 Open Access Article
Creative Commons Attribution 3.0 Unported Licence
Accurate analysis of HCl in biomethane using laser absorption spectroscopy and ion-exchange chromatography
Javis A.
Nwaboh
 *a,
Heleen
Meuzelaar
 b,
Jiawen
Liu
b,
Stefan
Persijn
b,
Jianrong
Li
b,
Adriaan M. H.
van der Veen
b,
Nicolas
Chatellier
c,
Arnaud
Papin
c,
Zhechao
Qu
b,
Jiawen
Liu
b,
Stefan
Persijn
b,
Jianrong
Li
b,
Adriaan M. H.
van der Veen
b,
Nicolas
Chatellier
c,
Arnaud
Papin
c,
Zhechao
Qu
 a,
Olav
Werhahn
a and
Volker
Ebert
a
aPhysikalisch-Technische Bundesanstalt (PTB), 38116 Braunschweig, Germany. E-mail: javis.nwaboh@ptb.de
bVSL, Thijsseweg 11, 2629 JA, Delft, The Netherlands
cINERIS: Parc Technologique Alata BP 2, Verneuil en Halatte, 60550, France
First published on 6th January 2021
Abstract
Biomethane is a renewable energy gas with great potential to contribute to the diversification and greening of the natural gas supply. Ideally, biomethane can directly be injected into the natural gas grid system. For grid injection, specifications such as those in EN 16723-1 shall be met. One of the impurities to be monitored is hydrogen chloride (HCl). To assess conformity with the specification for HCl, accurate and reliable test methods are required. Here, we report the development of three novel test methods, based on a variety of laser absorption spectroscopy techniques (Direct absorption spectroscopy-DAS and wavelength modulation spectroscopy-WMS) and ion-exchange chromatography, for the measurement of HCl in biomethane. Gas mixtures of HCl in biomethane were used to demonstrate the performance of the spectroscopic systems in the nmol mol−1 to low μmol mol−1 ranges, achieving uncertainties in the 4% range, k = 2. For ion-exchange chromatography analysis, HCl was first collected on an alkali-impregnated quartz fiber filter. The analysis was performed according to ISO 21438-2 and validated using synthetic biomethane spiked with HCl. The relative expanded uncertainties for the ion exchange chromatography HCl measurements are in the 10–37% range, k = 2. The results presented for the 3 test methods demonstrate that the respective methods can be used for HCl conformity assessment in biomethane.
1. Introduction
There is an increased need from the European Union (EU) to diversify its energy supply, thereby targeting renewable sources such as biomethane.1,2 Biomethane (composed mostly of methane, nitrogen and carbon dioxide produced by upgrading biogas, i.e. removing molecules such as carbon dioxide, hydrogen sulfide and water from biogas) is a renewable energy gas that can be used for equipment and applications designed for natural gas, and can be injected into the natural gas network if certain specifications are met. To preserve the integrity of the natural gas grid infrastructure, the specification (EN 16723-13) for biomethane injection provides threshold values for the contents of impurities such as siloxanes, hydrogen chloride (HCl), hydrogen fluoride (HF), and halogenated volatile organic compounds in biomethane. As an example, high concentrations of halogenated compounds are generally found in biogas from industrial landfills and sewage treatment which need to be removed.In this work, we describe dedicated methods for the analysis of HCl in biomethane and biogas, aiming to achieve analytical performance characteristics better than those provided by the methods specified in EN16723-1. The method cited in the specification is developed for measurements in air, thus not specifically developed and validated for measurements in biomethane. In fact, a recent study indicates the potential inadequacy of current standard methods for chlorine sampling in particular in biogas but also in biomethane.4
With the growing number of biomethane plants in Europe,5 there is a need to develop a metrological infrastructure for traceable biomethane conformity assessment2 thereby supporting policy makers to make decisions on the supply and use of biomethane. Within the EMPIR project “Metrology for Biomethane”,1 test methods are being developed for accurate and reliable measurements of the impurities. Accurate measurements of the concentration of HCl in biomethane (threshold for chlorinated compounds in EN 16723-1: 1 mg m−3; 1 μmol mol−1 HCl corresponds to approximately 1.5 mg m−3 at reference conditions 25 °C and 101.325 kPa) for quality control are of particular importance as HCl leads to corrosion in gas transport pipelines and appliances. Across Europe threshold values vary for chlorinated compounds in biomethane.3,6 As indicated, to support conformity assessment of biomethane, there is currently no dedicated method for HCl in biomethane. Laser absorption spectroscopy and ion-exchange chromatography are techniques that enable the developing of selective, accurate and reliable tests methods for this purpose.
Laser absorption spectroscopy has been demonstrated for accurate HCl and other gas species amount fraction measurements in a variety of applications.7–14 So far, reports on laser spectroscopic measurements of HCl in biomethane, addressing traceability of the results to the international system of units (SI), are lacking. Direct tunable diode laser absorption spectroscopy (dTDLAS) and wavelength modulation spectroscopy ((WMS) with comparably higher sensitivity2,9) specifically as demonstrated in other applications2,8,9,11 are good candidates for the development of test methods for HCl concentration measurements in biomethane. dTDLAS is a variant of TDLAS that combines this spectroscopic technique with a special, first principles data evaluation approach to directly extract absolute species amount fraction (concentration) without calibration of the sensor with a calibration gas mixture, under the provision that a metrologically traceable line strength parameter is available.7,11,15 Ion exchange chromatography on the other hand is an analytical technique that is widely used to measure the concentration of gases with very low limits of quantification,16,17 and therefore also a good candidate to develop a test method for HCl concentration measurements in biomethane. Due to the biomethane matrix, a dedicated sampling approach and data analysis procedure is required.
In the following subsections, two laser spectroscopy methods (based on dTDLAS and WMS) and an ion exchange chromatographic method have been described for accurate and reliable measurements of the amount fraction of HCl (nmol mol−1 to μmol mol−1) in biomethane. The performance characteristics (e.g., repeatability and reproducibility) of the methods were determined to demonstrate their applicability for HCl impurity measurements at these low levels in biomethane. The measurement methods are validated by comparing the measurement results with values assigned to the amount fraction of HCl in calibration gas mixtures. These gas mixtures have been prepared using static or dynamic gravimetric gas mixture preparation methods. An in-depth description of one of the dynamic-gravimetric gas mixture preparation method, developed for this purpose is based on the permeation method as described in ISO 6145-10,18 is presented. Uncertainty evaluations are presented for the analytical values reported for all measurements.
2. Experimental results
2.1. The dTDLAS measurements
In dTDLAS, the relation between the incident radiation and the transmitted radiation across an absorbing medium (e.g., gas molecules in a gas cell, see Fig. 1) can be expressed by the extended Beer–Lambert law,11Φ(![[small nu, Greek, tilde]](https://www.rsc.org/images/entities/i_char_e0e1.gif) , L) = Tr(t) × Φ0( , L) = Tr(t) × Φ0(![[small nu, Greek, tilde]](https://www.rsc.org/images/entities/i_char_e0e1.gif) ) × exp{−ST × g( ) × exp{−ST × g(![[small nu, Greek, tilde]](https://www.rsc.org/images/entities/i_char_e0e1.gif) − − ![[small nu, Greek, tilde]](https://www.rsc.org/images/entities/i_char_e0e1.gif) 0) × L × n} + E(t) 0) × L × n} + E(t) | (1) |
 | (2) |
![[small nu, Greek, tilde]](https://www.rsc.org/images/entities/i_char_e0e1.gif) ) = −ln(Φ(
) = −ln(Φ(![[small nu, Greek, tilde]](https://www.rsc.org/images/entities/i_char_e0e1.gif) )/Φ0(
)/Φ0(![[small nu, Greek, tilde]](https://www.rsc.org/images/entities/i_char_e0e1.gif) )) is the spectral absorbance, kB the Boltzmann constant, ptotal the total gas pressure and Aline the line area.11 The quantity riso is an isotopic correction factor, given e.g. as riso = xH-35Cl/xH-35Cl-HIT, for a probed H35Cl line, where xH-35Cl and xH-35Cl-HIT are the abundances of H35Cl in the sample and the conventional abundance value used by HITRAN,20 respectively. The amount fraction of a gas species xspecies (e.g., xHCl, for HCl) can be made metrologically traceable to the international system of units (SI), if all input quantities, e.g., ST, L, ppartial and T, are determined with metrological traceability as well, the measurement uncertainty is duly propagated, and the impact of all assumptions underlying the measurement model have been taken into account in the evaluation of the measurement uncertainty.
)) is the spectral absorbance, kB the Boltzmann constant, ptotal the total gas pressure and Aline the line area.11 The quantity riso is an isotopic correction factor, given e.g. as riso = xH-35Cl/xH-35Cl-HIT, for a probed H35Cl line, where xH-35Cl and xH-35Cl-HIT are the abundances of H35Cl in the sample and the conventional abundance value used by HITRAN,20 respectively. The amount fraction of a gas species xspecies (e.g., xHCl, for HCl) can be made metrologically traceable to the international system of units (SI), if all input quantities, e.g., ST, L, ppartial and T, are determined with metrological traceability as well, the measurement uncertainty is duly propagated, and the impact of all assumptions underlying the measurement model have been taken into account in the evaluation of the measurement uncertainty.
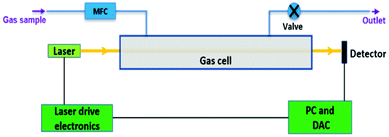 | ||
| Fig. 1 Schematic of the ICL-dTDLAS instrumentation for HCl concentration measurements in CH4 and biomethane (DAC: data acquisition card). | ||
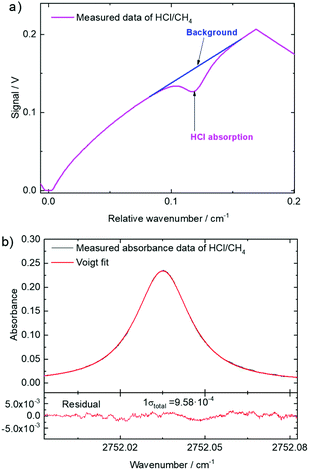 | ||
| Fig. 2 (a) Measured dTDLAS HCl-P6 signal as a function of relative wavenumber. (b) Measured absorbance and residuals with respect to a Voigt profile as a function of the wavenumber. | ||
Table 1 holds the uncertainty budget of the dTDLAS 112 μmol mol−1 HCl amount fraction results evaluated from the data in Fig. 2b. As shown in Table 1 (with eqn (2) as model function), the relative standard uncertainty of the result of 2.3% (k = 1) is dominated by the uncertainty of the line strength values (traceable to ref. 22 and validated at the PTB) of 2.0%,7,20,22–24 followed by the relative standard deviation of the line area (Aline) of 1%, and the rest of the other quantities (including the uncertainty associated with the assumption of an ideal gas for eqn (1)) with sub-percent uncertainties.
| Parameter | Value | Relative standard uncertainty (k = 1)/% |
|---|---|---|
| Pressure | 192.2 hPa | 0.20 |
| Temperature | 294.6 K | 0.10 |
| Path length | 0.820 cm | 0.24 |
| Line strength21 | 1.91 × 10⁻¹⁹ cm per molecule | 2.00 |
| Line area | 0.00829 cm−1 | 1.00 |
| dTDLAS HCl result | 112 μmol mol−1 | 2.30 |
To determine the repeatability and the detection limit of the dDTLAS spectrometer, Fig. 3a and b depict results of repeated dTDLAS measurements and dTDLAS-xHCl Allan deviation plot, respectively. The repeatability (calculated as the standard deviation of the mean) of the HCl amount fraction results is 0.065 μmol mol−1 (0.058% relative). The detection limit of the instrument is 25 nmol mol−1 at a time resolution (Δt) of 24 s. Here, time resolution means the averaging time.
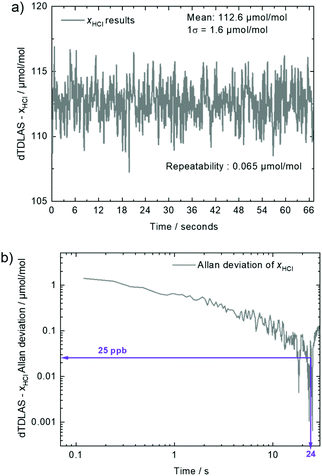 | ||
| Fig. 3 (a) dTDLAS-xHCl results as a function of time. (b) dTDLAS-xHCl Allan deviation as a function of time. | ||
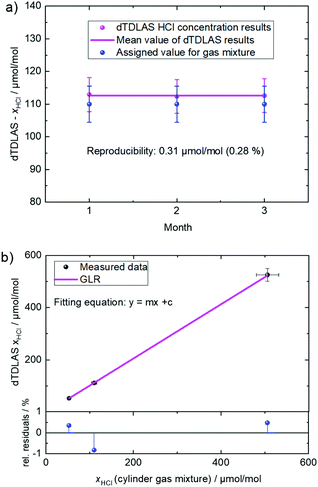
Regarding the reproducibility of the dTDLAS results, HCl amount measurements were carried out at three consecutive months. Fig. 4a depicts dTDLAS measurements performed at months 1, 2 and 3. The mean value of the dTDLAS results is 112.6 μmol mol−1. The reproducibility (standard deviation) of the results is 0.31 μmol mol−1 (0.28% relative). As shown in Fig. 4a, all dTDLAS results are in good agreement with the value assigned to the commercial gas mixture (110 ± 5.5) μmol mol−1 (k = 2).
Similar dTDLAS measurements of HCl amount fractions were performed in the amount fraction range of 10–500 μmol mol−1 achieving good agreements (see Fig. 4b, linearity in the range (10–500 μmol mol−1: slope: 1.038 ± 0.071, intercept: (−2.41 ± 5.57) μmol mol−1) with the values reported for the gas mixtures used, further demonstrating the capability of the dTDLAS test method for HCl concentration measurements in biomethane. The intercept is insignificant (i.e., its uncertainty is larger than the value), demonstrating that there is no offset of the dTDLAS. Therefore, the dTDLAS HCl instrument can perform absolute and calibration free (no pre-calibration of the instrument with a calibration gas mixture) measurements. The HCl amount fraction measurements in biomethane showed good repeatability (e.g., 0.058% at 112 μmol mol−1), reproducibility (e.g., 0.28% at 112 μmol mol−1 for 3 months span), linearity (in the range of 10–500 μmol mol−1 HCl in CH4: slope: 1.038 ± 0.071) and precision of 25 nmol mol−1 at a time resolution of 24 s. Direct traceability of the dTDLAS HCl amount fraction results to SI was addressed via the traceability of input parameters such as the measured gas pressure and temperature that are traceable to respective PTB standards. The line strength value is traceable to HITRAN20 entry for HCl form ref. 22 and has been validated (to be fit for purpose) in separate HCl concentration measurements at PTB. A dTDLAS instrument that can deliver gas species amount fraction results that are directly traceable to the SI can be referred to as an “Optical Gas Standard (OGS)”11,13,15 similar to the Ozone Standard Reference Photometer.26 To assess compliance with EN 16723-13 for HCl in CH4 (and biomethane), the dTDLAS HCl instrument can be used.
2.2. Calibrated DAS-WMS HCl amount fraction measurements
Fig. 6b shows the background subtracted DAS spectra of HCl at different amount-of-substance fractions in CH4 generated based on permeation (used to prepare calibration gases for the spectroscopic measurements). The HCl absorption lines were fitted using a simple Voigt profile. The area under the resulting fit was determined and plotted as function of the generated amount of substance fraction (see Fig. 6c, here, straight line: resulting calibration curve for HCl determination different from the analysis method in the dTDLAS subsection). The results show that the response of the instrument follows a straight-line relationship according to Beer–Lambert's law.31 The obtained straight line meets the consistency requirements of ISO 6143.32 The slope of the straight line is (4.167 ± 0.096) × 10−2 a.u per μmol per mol and the intercept is (2.93 ± 0.26) × 10−2 a.u, where the uncertainties are stated as standard uncertainties The error bars indicate the expanded uncertainties (k = 2). A limit of quantification of 100 nmol mol−1 was found for the DAS measurement of HCl in CH4. The resulting expanded uncertainty for HCl analysis at 10 μmol mol−1 in CH4 is 4%.
Enhanced sensitivity and lower detection limits were achieved by using 2f-WMS. Fig. 7a shows the results of 2f-WMS measurements of pure methane, 0.99 μmol mol−1 HCl in CH4, the matrix-corrected 2f-signals of HCl and its simulated 2f-spectrum based on HITRAN database.20 The methane matrix causes quite some spectral interference at these low HCl amount fractions but as the CH4 background signal is very stable this can be easily subtracted. The background-corrected signal shows good agreement with the simulated 2f-spectrum (see Fig. 7a). Fig. 7b depicts the matrix-corrected 2f-WMS spectra of calibration gas mixtures with varying HCl amount fractions in CH4 showing the high sensitivity and selectivity of the method, even for such low HCl amount fraction in methane. Using the absolute 2f-area under the curves provides a robust measure of the HCl amount fraction and a good linearity is observed (see Fig. 7c). The obtained straight line meets the requirements of ISO 6143 regarding the goodness-of-fit.32 The slope of the straight line is (6.77 ± 0.19) × 10−2 and the intercept is (−1.09 ± 1.15) × 10−3, where the uncertainties are stated as standard uncertainties. The uncertainty bars plotted denote expanded uncertainties (k = 2). A limit of quantification of 20 nmol mol−1 was found for the 2f-WMS measurement of HCl in CH4. The resulting expanded uncertainty for HCl analysis at 1.0 μmol mol−1 in CH4 is 4%.
For the analysis of unknown amount fractions of HCl in CH4 three main sources of uncertainty can be identified in the measurements:
(1) Purity of the permeation-based calibration gas: The most challenging part in the uncertainty budget of permeation is the purity of the generated gas. Any impurity released by the HCl permeator will affect the observed mass flow rate of permeation and thereby the determined HCl amount fraction. In this study, the purity specification of the manufacturer, i.e., 99.0%, has been taken into account for the uncertainty evaluation of the permeation system. Ongoing work includes further purity analysis of the gas emitted from HCl permeators to minimise the contribution of potential impurities to the standard deviation of the generated calibration gas. The relative uncertainty contribution of the generated HCl amount fractions based on permeation was 3.2% (k = 2).
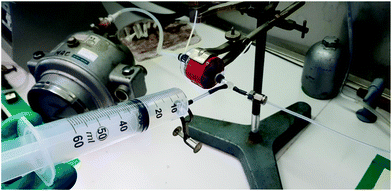
(2) HCl adsorption: HCl is highly reactive, reacting rapidly with water and therefore issues exist with the reproducibility of measurements. While both the dynamic gas mixture preparation system and sampling system have been optimized using only SilcoNert 2000 coated materials (e.g., tubings, mass flow controller, pressure controller pressure regulator) the multi-pass measurement cell is made of uncoated aluminium. An optimized cell should be used in case rapid measurements are required. However, measurements of HCl generated by the MSB at amount fractions around 10 μmol mol−1 were well reproducible (better than 1%). For similar cylinder measurements a poorer reproducibility was observed probably due to adsorption in the cylinder and pressure reducer. Response times of approximately 30 minutes (using static mixtures) were obtained at volume flow rates of 0.5 L min−1. By waiting 30 minutes or more this uncertainty contribution from adsorption issues can thus be reduced but this leads to relatively high gas consumption of at least 15 L.
(3) Analyzer's (DAS 2f-WMS system) laser and detector instabilities: Sources contributing to the uncertainty include instability in the laser intensity, laser wavelength and photodetector. The uncertainty of the analyser has been estimated using the same experimental set-up (cell, electronics, photodetector and flow system) only with a different laser (QCL) and a stable component (N2O). With this set-up a relative expanded uncertainty (k = 2) of 0.5% or better has been obtained in the amount fraction determination for a N2O absorbance mimicking that of to 10 μmol mol−1 HCl. As the performance of the ICL laser used for HCl detection is comparable (possibly even better due to the better beam profile and wavelength stability) than the operated QCL laser, the resulting uncertainty will also be of similar magnitude.
In conclusion, to assess compliance with EN 16723-13 for the measurement of HCl in CH4 both the direct absorption (DAS) as well as wavelength modulation (2f-WMS) method can be used. An advantage of the latter method is that it provides a higher sensitivity and suffers less from optical interference by the CH4 matrix. Relative expanded uncertainties of 4% for both the DAS and 2f-WMS method have been achieved for HCl analysis at 10 μmol mol−1 (DAS) and 1.0 μmol mol−1 in CH4 (2f-WMS).
2.3. Ion-exchange chromatography
The characterization of the method has been carried out by applying two standards, initially published for water matrices, but also largely used for the validation of analytical methods in various matrices:
- the requirements of NF T 90-21036 for the characterization of the calibration curve, the validation of the limit of quantification, the evaluation of accuracy at various levels of HCl concentrations;
- the requirements of the EN ISO 1135237 for the evaluation of uncertainties at various levels of HCl concentrations.
| Compounds | Nominal value (%) |
|---|---|
| H2 | 0.25 |
| O2 | 2.00 |
| N2 | 4.00 |
| CO2 | 5.00 |
| CH4 | 88.75 |
Impregnated quartz fiber filters were used to trap HCl from the synthetic biomethane gas. The quartz fiber filter used were from Whatman (QMA: 1851-037). Before being used for the sampling, they were impregnated with 500 μl of a sodium carbonate solution at 50 g L−1 and disposed into a holder. Two filters were positioned in succession in the holder with the second filter used as a control.
The sampling was performed at controlled volume flow rates (1 L min−1) during 30 minutes onto the alkali-impregnated quartz fiber filters. The quartz filters were connected directly to the flow regulator mounted on the gas bottle. A gas counter was connected after the quartz filters to control the flow. This sampling method was used for the evaluation of the limit of quantification (LOQ), the accuracy at different levels of concentrations (amount of substance fractions) of HCl in biomethane and their associated uncertainties.
The analytical conditions were:
- Precolumn AG19 4 × 50 mm (Thermo Scientific):
Particle diameter: 11 μm;
Functional Group: Alkanol quaternary ammonium;
Resin: Supermacroporus polyniylbenzyl ammonium cross-linked with divinylbenzene;
- Column Thermo AS19 4 × 250 mm (Thermo Scientific):
Particle diameter: 7.5 μm;
Functional Group: Alkanol quaternary ammonium;
Resin: Supermacroporus polyniylbenzyl ammonium cross-linked with divinylbenzene;
- Flow: 1 L min−1;
- Eluant: Using eluant generator from KOH solution at 22%;
- Temperature of the column: 30 °C;
- Injection volume: 25 μl;
- Elution mode: Gradient of eluent concentration (see Table 4);
- Detection: Conductimetric;
- Temperature of the conductimetric cell: 35 °C;
- Electrochemical suppression;
Suppressor ADRS 600 – 4 mm (Thermo Scientific);
Suppression current: 112 mA.
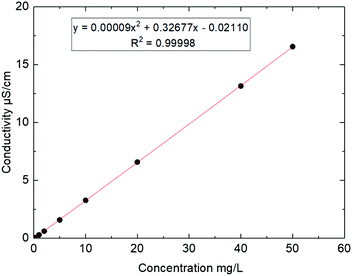
The analysis of the samples was performed on a Thermo Scientific chromatograph with conductimetric detector (model ICS 5000+) after calibration. To perform the calibration, nine standard solutions with different levels of concentration were prepared from liquid solutions of commercial products by successive dilutions in water. The reagents used was chloride at 1 g L−1 from ChemLab (ref. CL01.0346.0500). The calibration ranges from 2 μg Cl− to 1000 μg Cl− corresponding to 0.07 mg m−3 to 34 mg m−3 (see Table 3). Each calibration was prepared 6 times from independent solutions in conditions of intermediate precision (same person, different day). A second-degree polynomial was used as the calibration model (see Fig. 9). The range was verified according to the French standard NF T 90-210 requirements36 (maximum acceptable deviation approach), with a coefficient of determination (R2) over 0.999 (see Fig. 9) for HCl for this calibration range.
| Compound | Low level | High level |
|---|---|---|
| HCl | 0.1 mg L−1 | 50 mg L−1 |
| 2 μg | 1000 μg | |
| 0.07 mg m−3 | 34 mg m−3 |
| Time (min) | Events | mM KOH |
|---|---|---|
| −7 | Stabilization | 10 |
| 0 | Start acquisition | 10 |
| 10 | 10 | |
| 10.01 | 45 | |
| 17 | 45 | |
| 17.01 | End | 10 |
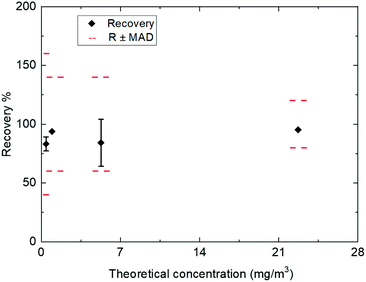
Similarly to the LOQ, the accuracy of the analytical method is evaluated according to NF T 90-210.36 Tests were performed at 4 levels (see Fig. 10) of concentration including LOQ within conditions of repeatability with duplicates for the sampling and extraction (two samples spiked at the same level of concentration) and inter-day precision by performing 6 series of extraction in duplicates on 6 different days. This methodology analyzes trueness and precision of the results for HCl at the studied concentration. This test ensures that the accuracy (trueness and precision) does not exceed ± 60% of the spiked concentration at the LOQ and 40% for the two intermediate concentrations at LOQ × 2 and 20% of the higher point of the validated range and ±20% of the spiked concentration for the highest concentration at 80% of the higher point of the validated range. The sampling of the biomethane gas spiked by HCl at variable level was performed at controlled flow rates (1 L min−1) with exposure time of 30 minutes. As shown in Fig. 10 (depicting accuracy profiles, MAD: maximum acceptable deviation is a criterion on the accuracy), good recoveries between 78% (at the LOQ) to 96% were obtained for HCl. Except at the LOQ, all the recoveries are above 80%.
| Tested level (mg m−3) | Relative expanded uncertainty |
|---|---|
| 0.49 | 37% |
| 0.98 | 14% |
| 6.15 | 37% |
| 23.4 | 10% |
It could be noted here that, for the tests at 6.15 mg m−3 (see Table 5) of HCl trapped on filters, the recoveries obtained on half of the measurements for this series were lower than expected although quality control (ultrapure water spiked with solutions of Cl−) were at the expected levels. Therefore, lower overall recoveries and larger uncertainties were obtained for this level of concentration. These observations indicate that a problem might have occurred during the trapping step but as the recoveries and bias were still within the defined range, they were not rejected. Therefore, the recoveries and uncertainty for this level (6.15 mg m−3) should be in reality closer to those obtained for the lower and higher level.
3. Discussion
The dTDLAS HCl amount fraction results in the (10–500) μmol mol−1 are reported to be in good agreement with values reported from cylinder-based gas mixtures. The optimal precision of the instrument is 25 nmol mol−1 at a time resolution (Δt) of 24 s. The agreement of the results demonstrates the capability of the dTDLAS approach as a test method for HCl concentration measurements in biomethane for quality control. The relative uncertainty of the dTDLAS results is in the 2.3% range, k = 1. This uncertainty is dominated by the systematic line strength uncertainty of 2%,20 indicating that, to further reduce the uncertainty (when necessary) of the dTDLAS HCl amount fraction results, focus will be placed on reducing the uncertainty of the line strength value. The good repeatability (0.058%) and reproducibility (0.28%) of the results combined with the detection limit of 25 nmol mol−1 (Δt = 24 s), further demonstrated the capability of the dTDLAS instrument for HCl quality control measurements in biomethane. Comparing the dTDLAS HCl results in this work (at about 3.6 μm) to the HCl results in Ortwein et al.7 (at about 1.7 μm), the concentration resolution of 0.38 μmol mol−1 m (calculated using the snapshot precision of 0.46 μmol mol−1 at Δt = 2 s and path length of 0.82 m) for the dTDLAS results in this work is about 34 times better than the 13 μmol mol−1 m (note: μmol mol−1 = ppm) reported in Ortwein et al.,7 indicating the improvement in the dTDLAS HCl results due to a stronger absorption line used in this work at 3.6 μm (fundamental band). This has become possible now, because of the improved mid-infrared interband cascade lasers available nowadays.Similarly, as for dTDLAS, the calibrated HCl DAS-2f-WMS amount fraction results in the amount of substance fraction range of 0–1.2 μmol mol−1 were validated by using gas mixtures provided by the dynamic-gravimetric preparation system. The relative expanded uncertainty of the calibrated DAS-2f WMS HCl amount fraction is estimated to be in the order of 4% (k = 2), in the same order as the expanded uncertainty of the dTDLAS results of 4.6% (k = 2). It should be noted here that the uncertainty of the DAS-WMS results is based on the calibration of the instrument with calibration gases, while that of the dTDLAS results is purely based on the individual input parameters (e.g., gas pressure and temperature, line area and the line strength).
A good recovery (78% to 96%) was achieved for ion exchange chromatography HCl results (range: 0.07 mg m−3–34 mg m−3), demonstrating the capability of this analytical method for HCl measurements in biomethane. The relative expanded uncertainties for the ion exchange chromatography HCl measurements are in the (10–37) %, k = 2. The measurement uncertainty for the ion exchange chromatography measurements depends on the concentration, with the lowest uncertainty (10%) reported for the results at 23.4 mg m−3. These uncertainties are calculated taken into consideration the within-laboratory reproducibility of the method and the laboratory bias.
For the spectroscopic measurement techniques in this work, compared to those in our previous work on CO (at 4.6 μm),13 a complex HCl absorption line selection process (before developing the systems) was required (due to potential interference from absorptions by CH4) for sensitive and selective measurements, and new high performance interband cascade lasers operated at 3.6 μm have been employed and carefully characterized for the HCl analysis now. Compared to CO, HCl is a very sticky and reactive gas with new challenging properties such as HCl adsorption to the gas cell wall. Therefore, the new spectroscopic systems in the paper have been designed and realized including sampling lines and the single pass gas cell coated with Silconert and Dursan™ to minimize HCl adsorption and to speed up the response time of the instrument for HCl measurements in biomethane. In addition, dTDLAS/QCLAS was used in Nwaboh et al.13 at μmol mol−1 (ppm) levels of CO, while dTDLAS/DAS-WMS containing longer gas cells was employed in this work targeting challenging HCl amount fractions down to the nmol mol−1 (ppb) levels.
The results presented for the 3 test methods (based on dTDLAS, ICL-2f WMS, ion chromatography), demonstrate that the respective methods can be used for HCl conformity assessment in biomethane with different uncertainties associated to the results depending on the method used. Table 6 holds a summary of the methods presented in this work, concentration ranges, expanded uncertainties, detection limits, key advantages and drawbacks of the respective methods. Using laser spectroscopic and ion chromatography methods offer the possibility of online (in situ) analysis and preconcentration procedures to significantly improve the sensitivities of analytical instrumentation, respectively.39–41 In addition to biomethane applications, the dTDLAS/DAS-WMS and ion exchange chromatography methods presented in this work have the capabilities to be applied for measurements in other applications such as HCl quality control measurements in clean room environment, atmospheric and industrial emission monitoring. Thus, the spectroscopic systems developed here showed a good potential for possible future commercial applications.
| Measurement method | Range | Expanded uncertainty achieved/% (k = 2) | Detection limit/limit of quantification | Key advantage and drawback of method |
|---|---|---|---|---|
| dTDLAS | 10–500 μmol mol−1 | 4.6 | 25 nmol mol−1 at Δt = 24 s | Key advantage: Absolute, traceable and calibration-free measurement, capable of performing sampling free in situ analysis. |
| Drawback: Lower optical resolution and hence worse LOD at identical path and time resolution than WMS. | ||||
| DAS-WMS | 0–1.2 μmol mol−1 | 4.0 | 100 nmol mol−1 (DAS) | Key advantage: WMS comes with a higher optical resolution than DAS. |
| 20 nmol mol−1 (WMS) | Drawback: First principles models and calibration-free approach for WMS is much more complicated and metrologically not validated. Higher optical density (OD) resolution requires higher baseline stability which is usually not given and thus forcing the system to be calibrated frequently. | |||
| Ion exchange chromatography | 0.07–34 mg m−3 | 10–37 | 0.07 mg m−3 | Key advantage: Trueness of the results with separation of the chloride (no interferences are possible). |
| Drawback: Lab analysis which needs time to obtain the results. |
4. Conclusions
Three analytical methods (two based on laser spectroscopy and the other based on ion exchange chromatography) have been reported for HCl measurements in biomethane. For the optical techniques, experiments were done in two modes, to evaluate and report the capability of the two modes of operation for HCl concentration measurements in CH4 and biomethane. The agreement of the laser spectroscopic (dTDLAS and DAS-2f-WMS) HCl amount fraction results with values reported for gas mixtures demonstrate the capability of laser spectroscopy for accurate and reliable HCl concentration measurements in biomethane, thereby proving the ability of the laser-based methods to be employed as test methods for HCl conformity assessment or quality control measurements in biomethane. For HCl amount of substance fractions in the 0.36–500 μmol mol−1, the expanded uncertainties from the laser spectroscopic measurements are 4.6%, k = 2. The good recovery demonstrated for the ion exchange chromatographic measurements shows that this typically used analytical method (that is employed to determine the time weighted average mass concentration of sulfuric acid and phosphoric acid in workplace atmospheres, ISO21438-1:2007) can also be used for HCl amount of substance fractions measurements in biomethane (a complex gas matrix) and as a test method for HCl in biomethane quality control. For HCl results in the range of 0.07–34 mg m−3, the expanded uncertainty of the ion exchange chromatography results is currently 37% at the LOQ and 14% at the threshold value of 1 mg m−3 (k = 2). Any of the presented methods can be used for routine analysis, depending on the target uncertainty level required. Laser spectroscopic methods have the added value advantage to have capabilities for both lab and online field routine analysis.Author contributions
All co-authors contributed to the work presented in this paper: The dTDLAS part: PTB; the DAS-WMS part: VSL; the Ion exchange chromatography part: INERIS.Conflicts of interest
There are no conflicts to declare.Acknowledgements
The work was supported by the European Metrology Programme for Innovation and Research (EMPIR). The EMPIR initiative is co-funded by the European Union's Horizon 2020 Research and Innovation Programme and the EMPIR Participating States. The authors would also like to acknowledge the support from members of the PTB working group 3.42 (Spectrometric Gas Analysis) on the development of the dTDLAS instrument. PTB and VSL are member of the European Metrology Networks for Energy Gases. PTB is a member of the European Metrology Networks for Climate and Ocean Observation.References
- European Metrology Programme for Innovation and Research (EMPIR) project: “Metrology for biomethane”, available at: http://empir.npl.co.uk/biomethane/.
- J. Li, S. Persijn, I. de Krom, H. Meuzelaar and A. M. H. van der Veen, 19th International Congress of Metrology (CIM2019), 2019, 06002, DOI: DOI:10.1051/metrology/201906002.
- EN 16723-1 Natural gas and biomethane for use in transport and biomethane for injection in the natural gas network – Part 1: Specifications for biomethane for injection in the natural gas network. CEN, European Committee for Standardization, Brussels, Belgium, 2016, first edition.
- V. Paolini, F. Petracchini, M. Carnevale, F. Gallucci, M. Perilli, G. Esposito, M. Segreto, L. G. Occulti, D. Scaglione, A. Ianniello and M. Frattoni, J. Environ. Manage., 2018, 217, 288–296 CrossRef CAS.
- European Biogas Association (EBA) Statistical Report of the European Biogas Association 2018 Brussels Belgium, 2018, available at: https://www.europeanbiogas.eu/wpcontent/uploads/2019/05/EBA_Statistical-Report-<?pdb_no 2018?>2018<?pdb END?>_AbrigedPublic_web.pdf.
- A list of the EU-wide existing best practices for the biogas transport in the natural gas grids REDUBAR WP06 D19/M, available at: https://ec.europa.eu/energy/intelligent/projects/sites/ieeprojects/files/projects/documents/redubar_best_practices.pdf.
- P. Ortwein, W. Woiwode, S. Fleck, M. Eberhard, T. Kolb, S. Wagner, M. Gisi and V. Ebert, Exp. Fluids, 2010, 49, 961–968 CrossRef CAS.
- B. Buchholz, B. Kühnreich, H. G. J. Smit and V. Ebert, Appl. Phys. B, 2013, 110, 249–262 CrossRef CAS.
- A. Klein, O. Witzel and V. Ebert, Sensors, 2014, 14, 1497–21513 CrossRef.
- A. Pogany, S. Wagner, O. Werhahn and V. Ebert, Appl. Spectrosc., 2015, 69, 257–268 CrossRef CAS.
- J. A. Nwaboh, Z. Qu, O. Werhahn and V. Ebert, Appl. Opt., 2017, 56, E84–E93 CrossRef CAS.
- N. Prakash, A. Ramachandran, R. Varma, J. Chen, C. Mazzoleni and K. Du, Analyst, 2018, 143, 3284 RSC.
- J. A. Nwaboh, S. Persijn, K. Arrhenius, H. Bohlén, O. Werhahn and V. Ebert, Meas. Sci. Technol., 2018, 29, 095010 CrossRef.
- J. A. Nwaboh, O. Werhahn and V. Ebert, Mol. Phys., 2014, 112, 2451–2461 CrossRef CAS.
- B. Buchholz, N. Böse and V. Ebert, Appl. Phys. B, 2014, 116, 883–899 CrossRef CAS.
- M. L. Dawson, V. Perraud, A. Gomez, K. D. Arquero, M. J. Ezell and B. J. Finlayson-Pitts, Atmos. Meas. Tech., 2014, 7, 2733–2744 CrossRef.
- P. F. Lindgren, Atmos. Environ., Part A, 1992, 26, 43–49 CrossRef.
- ISO 6145-10 Gas analysis – preparation of calibration gas mixtures using dynamic volumetric methods – Part 10: Permeation methods. ISO, International Organization for Standardization, Geneva, Switzerland, 2002, First edition.
- J. Nwaboh, Z. Qu, O. Werhahn and V. Ebert, Imaging and Applied Optics 2016 LM3G, 2016, DOI:10.1364/LACSEA.2016.LM3G.4.
- HITRAN data base, available at: https://hitran.org/.
- ISO Guide 98-3 Guide to the Expression of Uncertainty in Measurement, 1. International Organization for Standardization, Geneva, 2008, ISBN 9267101889.
- G. Li, I. E. Gordon, R. J. Le Roy, P. G. Hajigeorgiou, J. A. Coxon, P. F. Bernath and L. S. Rothman, J. Quant. Spectrosc. Radiat. Transfer, 2013, 121, 78–90 CrossRef CAS.
- G. Li, R. E. Asfin, A. V. Domanskaya and V. Ebert, Mol. Phys., 2018, 116, 3495–3502 CrossRef CAS.
- A. V. Domanskaya, G. Li, H. Tran, M. Gisi and V. Ebert, J. Quant. Spectrosc. Radiat. Transfer, 2017, 199, 71–76 CrossRef CAS.
- J. A. Nwaboh, O. Werhahn, P. Ortwein, D. Schiel and V. Ebert, Meas. Sci. Technol., 2012, 24, 015202 CrossRef.
- Ozone Standard Reference Photometer (SRP) 2009 available at: https://www.nist.gov/laboratories/tools-instruments/ozonestandard-reference-photometer.
- H. Meuzelaar, J. Liu, S. Persijn, J. van Wijk and A. M. H. van der Veen, Int. J. Hydrogen Energy, 2020, 45, 34024 CrossRef CAS.
- EMPIR project: Metrology for Airborne Molecular contaminants II, available at: http://empir.npl.co.uk/metamcii/.
- D. D. Arslanov, M. Spunei, A. K. Y. Ngai, S. M. Cristescu, I. D. Lindsay, S. T. Persijn, K. J. Boller and F. J. M. Harren, Appl. Phys. B, 2011, 103, 223–228 CrossRef CAS.
- ISO 6145-7 Gas analysis – Preparation of calibration gas mixtures using dynamic volumetric methods – Part 7: Thermal mass-flow controllers, ISO, International Organization for Standardization, Geneva, Switzerland, 2018, Third edition.
- D. F. Swinehart, J. Chem. Educ., 1962, 39, 333, DOI:10.1021/ed039p333.
- ISO 6143 Gas analysis – Comparison methods for determining and checking the composition of calibration gas mixtures, ISO, International Organization for Standardization, Geneva, Switzerland, 2001, Second edition.
- M. Shibukawa, A. Taguchi, Y. Suzuki, K. Saitoh, T. Hiaki and T. Yarita, Analyst, 2012, 137, 3154 RSC.
- ISO 21438-2 Workplace atmospheres – Determination of inorganic acids by ion chromatography – Part 2: Volatile acids, except hydrofluoric acid (hydrochloric acid, hydrobromic acid and nitric acid), 2010.
- Validation of an ion chromatography method for the analysis of HCl and HF in biomethane, INERIS report 2019 ref. DRC-20-169395-01916A, available a within the documentation of the EMPIR biomethane project at http://empir.npl.co.uk/biomethane/.
- NF T 90-210 Water quality – Protocol for the initial method performance assessment in a laboratory, 2018.
- EN ISO 11352 standard Water quality – Estimation of measurement uncertainty based on validation and quality control data, 2013.
- ISO 5725-3 Application of statistics – Accuracy (trueness and precision) of measurement methods and results – Part 3: Intermediate measures of the precision of a standard measurement method, 1994.
- M. Ghysels, G. Durry, N. Amarouche, J. Cousin, L. Joly, E. D. Riviere and L. Beaumont, Appl. Phys. B, 2012, 107, 213–220 CrossRef CAS.
- R. Sur, K. Sun, J. B. Jeffries and R. K. Hanson, Appl. Phys. B, 2014, 115, 9–24 CrossRef CAS.
- M. Novič, M. Guček, J. Turšič, Y. Liu and N. Avdalovic, J. Chromatogr. A, 2001, 909, 289–296 CrossRef.
| This journal is © The Royal Society of Chemistry 2021 |

