
 Open Access Article
 This Open Access Article is licensed under a
 Creative Commons Attribution 3.0 Unported Licence
Developing a Raman spectroscopy-based tool to stratify patient response to pre-operative radiotherapy in rectal cancer†
Chloe J.
Kirkby
 a,
Julia
Gala de Pablo
bc,
Emma
Tinkler-Hundal
a,
Henry M.
Wood
a,
Stephen D.
Evans
b and
Nicholas P.
West
*a
a,
Julia
Gala de Pablo
bc,
Emma
Tinkler-Hundal
a,
Henry M.
Wood
a,
Stephen D.
Evans
b and
Nicholas P.
West
*a
aPathology & Data Analytics, Leeds Institute of Medical Research at St James's, University of Leeds, Leeds, UK. E-mail: n.p.west@leeds.ac.uk
bMolecular and Nanoscale Physics Group, School of Physics and Astronomy, University of Leeds, Leeds, UK
cGoda Lab, School of Chemistry, University of Tokyo, Tokyo, Japan
First published on 10th November 2020
Abstract
Rectal cancer patients frequently receive pre-operative radiotherapy (RT), prior to surgical resection. However, colorectal cancer is heterogeneous and the degree of tumour response to pre-operative RT is highly variable. There are currently no clinically approved methods of predicting response to RT, and a significant proportion of patients will show no clinical benefit, despite enduring the side-effects. We evaluated the use of Raman spectroscopy (RS), a non-destructive technique able to provide the unique chemical fingerprint of tissues, as a potential tool to stratify patient response to pre-operative RT. Raman measurements were obtained from the formalin-fixed, paraffin-embedded (FFPE) pre-treatment biopsy specimens of 20 rectal cancer patients who received pre-operative RT. A principal component analysis and linear discriminant analysis algorithm was able to classify patient response to pre-operative RT as good or poor, with an accuracy of 86.04 ± 0.14% (standard error). Patients with a good response to RT showed greater contributions from protein-associated peaks, whereas patients who responded poorly showed greater lipid contributions. These results demonstrate that RS is able to reliably classify tumour response to pre-operative RT from FFPE biopsies and highlights its potential to guide personalised cancer patient treatment.
Introduction
Colorectal cancer (CRC) is common, it affects approximately 42000 people in the UK annually, and is the second most common cause of cancer related death.1 A significant proportion of rectal cancer patients receive pre-operative radiotherapy (RT), prior to surgical resection. There are three common RT approaches; short course RT (SCRT), long course RT (LCRT) and long course chemoradiotherapy (LCCRT). Treatment varies across the National Health Service (NHS), as current guidelines from the National Institute for Health and Care Excellence (NICE) state that in the UK, pre-operative SCRT or LCCRT can be offered to rectal cancer patients with operable tumours and a predicted moderate or high risk of local recurrence.2,3 Pre-operative RT aims to reduce the risk of local recurrence, as it enables the possibility of tumour regression prior to surgery, increasing the likelihood of achieving a complete resection. However, CRC is morphologically and molecularly heterogeneous and the degree of tumour response to pre-operative RT is highly variable, even in patients with the same clinical presentation at diagnosis. Some patients may show a complete pathological response, whereby no viable tumour remains in the specimen at the time of surgery, whereas others will show no evidence of tumour regression. Despite this variation in patient response, there are currently no clinically approved, reliable methods to predict individual patient response to pre-operative RT in rectal cancer.Additionally, although pre-operative RT has been shown to reduce the risk of local recurrence, it is also associated with significant adverse effects, and can increase the risk of long-term morbidity following surgical resection.4–6 Adverse effects from pre-operative RT vary depending on the individual patient and the treatments received, but they range from mild to severe and in some cases fatal. Acute toxicities commonly experienced from RT include diarrhoea, nausea, stomatitis and fatigue, and these symptoms typically persist throughout the duration of the treatment. Long-term adverse effects induced by radiotherapy may include faecal incontinence, bowel dysfunction, sexual dysfunction and an increased risk of secondary malignancies, particularly within or surrounding the irradiated volume.4,7–9
Although pre-operative RT aims to reduce the risk of local recurrence and ultimately improve patient survival, a significant proportion of patients endure the toxic side effects of RT whilst showing no clinical benefit. In the case of some patients, the adverse effects of pre-operative RT may outweigh the potential benefit of receiving it. In addition to this, the delivery of ineffective treatments places a financial burden on the NHS and its finite resources. This highlights the importance of developing novel stratification techniques, and identifying predictive biomarkers to facilitate personalised medicine.
Raman spectroscopy (RS) is a rapid and highly sensitive technique able to provide a unique molecular fingerprint of cells and tissues through the varying contributions of molecular bond vibrations.10–12 Advances in technology and analytical techniques over recent decades have rapidly broadened the applications of RS.13,14 The potential uses of RS as a clinical tool are well demonstrated in the literature and its ability to detect subtle biochemical alterations in cells and tissues have advanced its popularity as a desirable tool in cancer biology and histopathology.10–17
The current CRC diagnostic pathway involves taking a biopsy sample, tissue fixation, embedding in paraffin wax, sectioning and staining, before analysis by a histopathologist. RS has the potential to be easily implemented into this workflow. It is a label-free, non-destructive technique that requires no additional tissue preparation and can provide information-rich spectra to aid histopathologists with the interpretation of standard morphology.10,18 However, the integration of RS in histopathology laboratories at the present time is virtually non-existent. This is largely due to the widespread use of formalin-fixed, paraffin-embedded (FFPE) tissue in standard clinical practice. The spectrum of paraffin wax produces strong RS peak intensities that fall within the fingerprint region and have the potential to mask important biological tissue related peaks.16,19
Deparaffinisation of FFPE tissue for RS analysis is important, not only to remove the contaminating signals of the paraffin wax the tissue has been embedded in, but also to return the tissue as closely as possible to its in vivo state. Although fresh tissue is ideal for RS analysis, as it avoids the use of organic solvents that can greatly reduce the signal intensity of the tissue and cause degradation and loss of some cellular components,24 it is not readily available outside of research projects. FFPE tissue is integral to the routine clinical workflow, as it facilitates the production of optimal tissue sections for diagnosis, and long-term preservation of material for subsequent analysis.12 There is also an abundance of FFPE tissue readily available in tissue archives or ‘bio-banks’, leading to great potential for retrospective RS studies.
Here we report the development of RS as a tool to reliably stratify response to pre-operative RT in rectal cancer patients, using data collected from routine pre-treatment FFPE biopsy specimens.
Methods
Case selection and assessment of response to pre-operative radiotherapy
Anonymised FFPE tissue from a series of rectal cancer patients treated with pre-operative SCRT was obtained from Leeds Teaching Hospitals NHS Trust. Research ethics approval was provided by the North-East York Research Ethics Committee (ref. 08/H0903/62). All patients in the series received the same 5 × 5 Gy SCRT schedule, prior to surgical resection. Patient response to pre-operative RT was assessed by quantifying the degree of tumour regression following pre-operative RT. This was achieved by calculating the percentage reduction in tumour cell density (TCD) between the pre-treatment biopsy and the post-treatment resection specimen. The cases were then categorised into ‘good’ and ‘poor’ responders, using the median percentage reduction in TCD, 64.5%, as the threshold value to determine response.TCD scoring was performed on digital scans of the original haematoxylin and eosin (H&E) stained tissue sections, used for diagnosis. The TCD scores were calculated as previously described.25 Briefly, the H&E stained sections were scanned at ×20 magnification using an Aperio T3 scanner (Aperio Technologies, Vista, California, USA). For each resection case, the slide that showed the greatest tumour involvement was selected for TCD scoring. To calculate the TCD of the biopsy, the total area of tumour was annotated in ImageScope v12.3 (Aperio Technologies Inc., Vista, California, USA), avoiding any normal tissue and areas of extensive necrosis. For each corresponding resection, the total area of tumour, including any tumour-associated stroma and any scar tissue, was annotated. 300 (±15) randomly assigned points were added to the tumour annotation layers using RandomSpot v7.0.01 (University of Leeds, Leeds, UK), which were then uploaded back onto the digital slide. Manual scoring of the tissue component directly beneath each point was performed according to a set of nine histological criteria, as listed in Table 1. The TCD was then expressed as the proportion of tumour cells (score 1) out of all informative points (scores 1–8). The percentage reduction in TCD was calculated by comparing the TCD scores of the pre-treatment biopsy and the corresponding post-treatment resection sample.
| Score | Criteria |
|---|---|
| 0 | Non-informative (unclassifiable) |
| 1 | Tumour cell |
| 2 | Stroma/collagen/fibrosis |
| 3 | Necrosis |
| 4 | Blood vessel |
| 5 | Inflammatory cells |
| 6 | Tumour lumen |
| 7 | Mucin |
| 8 | Muscle |
For this hypothesis generating study, 20 cases were selected for Raman analysis. Cases were excluded if either the pre-treatment biopsy or the post-treatment resection blocks were not available, and from the remaining 62 cases, ten were selected from each extreme of good and poor response to pre-operative RT.
Preparation of samples for Raman analysis
Three serial sections cut at 8 μm were taken from the pre-treatment biopsy tissue blocks for RS analysis. The first section was stained with H&E and digitally scanned at ×20 magnification (Aperio T3 scanner) in order to annotate the regions of interest in ImageScope v12.3, for RS analysis. The entire tumour area of the biopsy was annotated freehand and within this a 200 × 200 μm grid annotated in the area of apparent greatest tumour cell density, to denote the region for Raman analysis, as shown in Fig. 1.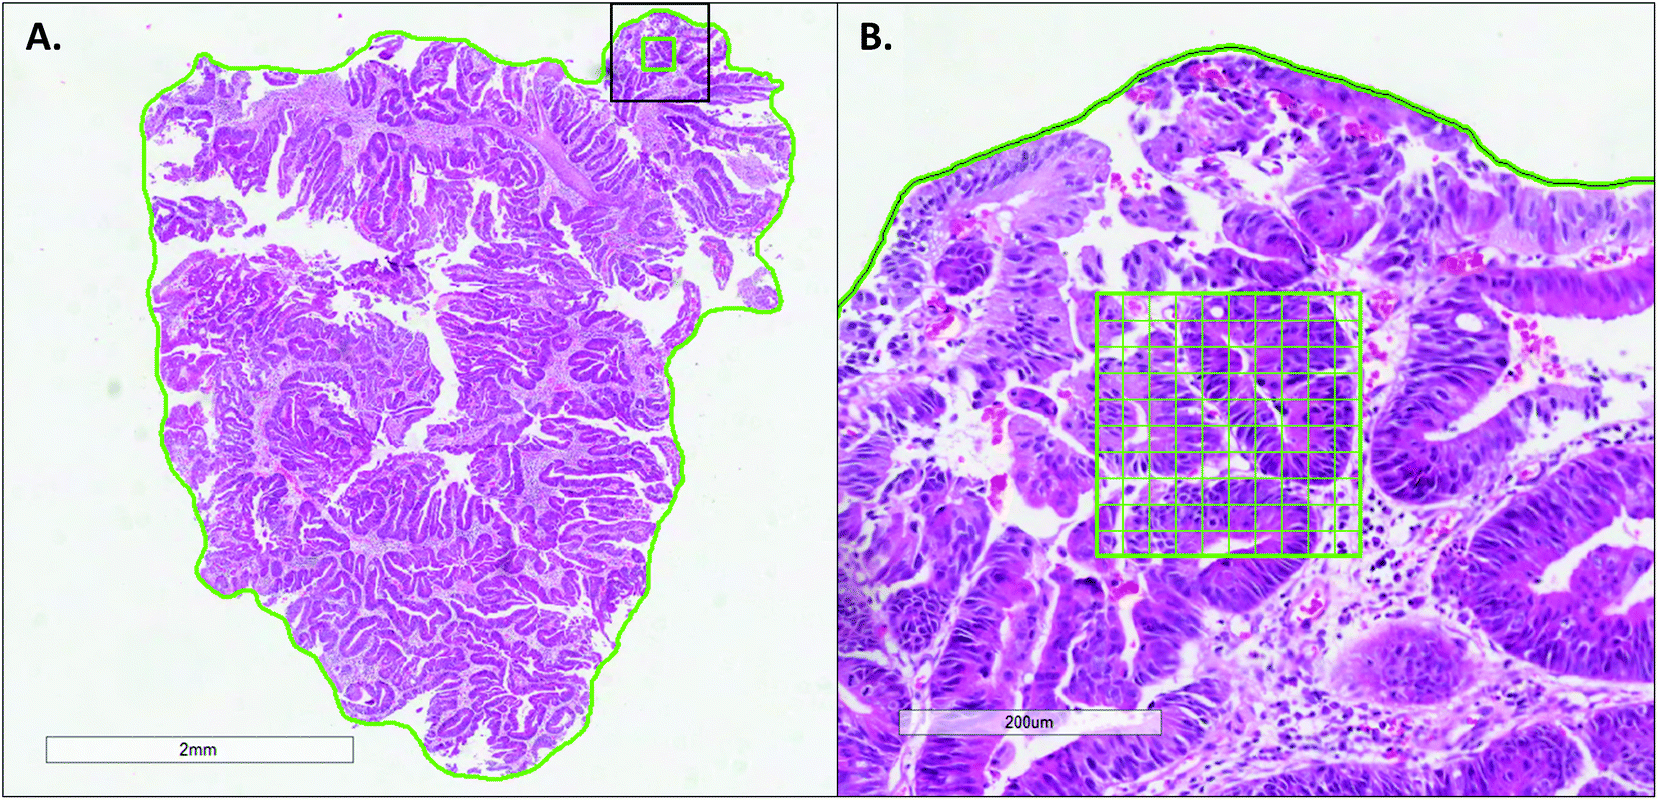 | ||
| Fig. 1 H&E stained tissue section of a biopsy specimen annotated for subsequent Raman analysis. (A) The entire tumour area of the biopsy specimen was first annotated, as shown by the continuous green line, before selecting a 200 × 200 μm tumour rich region to collect Raman measurements from (green grid). The area highlighted by a black box is shown at higher magnification in (B). The grid shows the array of points at which the 100 spectra were obtained. | ||
The second tissue section was mounted onto a fused quartz microscope slide (Alfa Aesar, Massachusetts, USA) for RS analysis. Prior to tissue mounting, the quartz slides were prepared by incubating overnight in 1% Decon, then sonicating in 1% Decon, isopropyl alcohol and deionised H2O for 15 minutes respectively, rinsing with deionised H2O in between each sonication. The quartz slides were then silanised to encourage tissue adhesion, by incubating for 15 seconds in a 4% 3-Aminopropyltriethoxysilane (APTES) in acetone solution, followed by 15 seconds incubations in acetone and MilliQ respectively.
Following tissue mounting, the samples were left overnight at 37 °C, then baked on a hotplate at approximately 70 °C for one hour prior to deparaffinisation to further encourage tissue adhesion. The slides were taken through a series of five-minute xylene and ethanol baths, to remove the wax and rehydrate the tissue.
Raman system configuration and data acquisition
The system used was an RA816 benchtop Raman Spectrometer (Renishaw), fitted with a 785 nm diode laser, with a laser power of 300 mW at the source and >150 mW at the sample, and an integral plasma filter. Data were collected using an 8.2 mm working distance, 0.55 NA 50× long working distance objective. Prior to experimental data collection, the system was calibrated and aligned using internal silicon and neon references.Mapping measurements of 100 spectra, taken on a 10 × 10 array were collected over a 200 × 200 μm area from each biopsy sample. Each spectrum was obtained using a one second acquisition time and 15 accumulations, resulting in a total laser acquisition time of 15 seconds at each point and total mapping time of approximately 30 minutes. All data was collected from the 715–2040 cm−1 spectral region.
Pre-processing and analysis of the spectra
The raw spectra were cosmic ray filtered, using a maximum width of 3 cm−1 and threshold height of 10 counts, in WiRE 4.2 (Renishaw, Wotton-under-Edge, UK) to remove any cosmic rays detected during mapping. All subsequent pre-processing and data analysis were performed in MATLAB (MathWorks, Massachusetts, USA). The wavenumber axis of each spectrum was corrected to the corresponding silicon calibration peak 520.5 cm−1 and truncated to consider only the region between 850–1800 cm−1. The baseline was then removed using the algorithm developed by Koch et al.26 Contaminating wax contributions were subtracted from the data using a modified extended multiplicative signal correction (EMSC) technique, described by Ibrahim et al.18 Using this method, the inhomogeneous nature of the wax contributions are accounted for by considering a matrix of 100 reference spectra of pure paraffin mounted on quartz in the algorithm, instead of a single reference spectrum.Poor quality biological spectra, or spectra taken from regions lacking any biological tissue (such as those obtained from the surrounding quartz substrate) were filtered from the analysis, based on the presence and intensity of the phenylalanine peak at approximately 1003 cm−1. The threshold ratio of the phenylalanine peak area (integrated from 998–1010 cm−1) to the adjacent spectral regions (983–985 cm−1) was set at 15 for all spectra. Any spectra that did not meet this threshold ratio were discounted from the analysis.
Principal component analysis (PCA) was performed using the pca function in MATLAB. The data was standardised using a standard normal variate (SNV) method within the pca function. Following this, the fitcdiscr function (‘linear’ discriminant type) was used for linear discriminant analysis (LDA). All spectra collected from the Raman maps taken from good and poor responders were combined in their respective group, and randomly split for five-fold cross validation, to estimate the performance of the model. This process was repeated 100 times and the output from each validation set was used to calculate the average sensitivity, specificity and accuracy of the model.
Results
Cases selected for Raman analysis
From the 20 cases analysed, those showing a poor response to pre-operative RT had a median percentage reduction in TCD of −2.5% (IQR −29.4–7.9%), and those that showed a good response had a median percentage reduction in TCD of 94.7% (IQR 90.6–97.9%). The median patient age was 64 years at the time of surgery (IQR = 56–74 years), and the sample population contained 13 male, and 7 female patients. A summary of the clinicopathological data, including tumour, node, metastasis (TNM) stage and tumour differentiation grade, of the patients in this study is summarised in Table 2.| Number of cases | ||
|---|---|---|
| Good responders | Poor responders | |
| Sex of Patient | ||
| Male | 8 | 5 |
| Female | 2 | 5 |
| Patient age (years) | ||
| Median (IQR) | 66 (60–72) | 60 (55–75) |
| Percentage reduction in tumour cell density (%) | ||
| Median (IQR) | 94.7 (90.6–97.9) | −2.5 (−29.4–7.9) |
| ypT stage | ||
| pT1 | 1 | 1 |
| pT2 | 6 | 1 |
| pT3 | 3 | 8 |
| ypN stage | ||
| pN0 | 10 | 6 |
| pN1 | 0 | 4 |
| ypM stage | ||
| pM0 | 0 | 0 |
| pM1 | 1 | 0 |
| pMx | 9 | 10 |
| Differentiation grade | ||
| Well | 0 | 1 |
| Moderate | 9 | 8 |
| Poor | 0 | 1 |
| Unknown | 1 | 0 |
Pre-processed Raman spectra
The raw Raman spectra contained contaminating paraffin peaks, which were observed at varying intensities at the following positions; 1063 cm−1, 1133 cm−1, 1296 cm−1, 1418 cm−1, 1441 cm−1 and 1464 cm−1, representative of the distinctive C–C stretching and CH2 and CH3 deformation.20Fig. 2 shows an example spectrum during the pre-processing stage, whereby the ‘raw’ truncated spectrum (blue) is corrected to reduce the paraffin contributions (green), to the level of the background noise (orange). Standard deparaffinisation protocols typically employed in histopathology laboratories involve the use of a clearing agent followed by rehydration of the tissue. Faoláin et al. originally reported the use of RS to detect the presence of paraffin wax in FFPE tissues following deparaffinisation using several common chemical dewaxing agents.20 Inefficient paraffin removal by commonly used deparaffinisation protocols, has been reported in both the RS and infrared spectroscopy communities.19–21 However, alongside the standard chemical deparaffinisation agents, computational methods have also been employed to remove contaminating paraffin peaks from the Raman spectra of biological tissue. There are several approaches to digital subtraction from Raman spectra that have been used to remove residual wax contributions and the background signal of substrates.18,22,23 Most recently, Ibrahim et al. reported efficient paraffin signal removal using an EMSC algorithm that employs a matrix of paraffin wax spectra as a reference, to account for the heterogeneity of paraffin.18 Using this technique, we were able to eliminate the contaminating residual paraffin peaks in the spectra.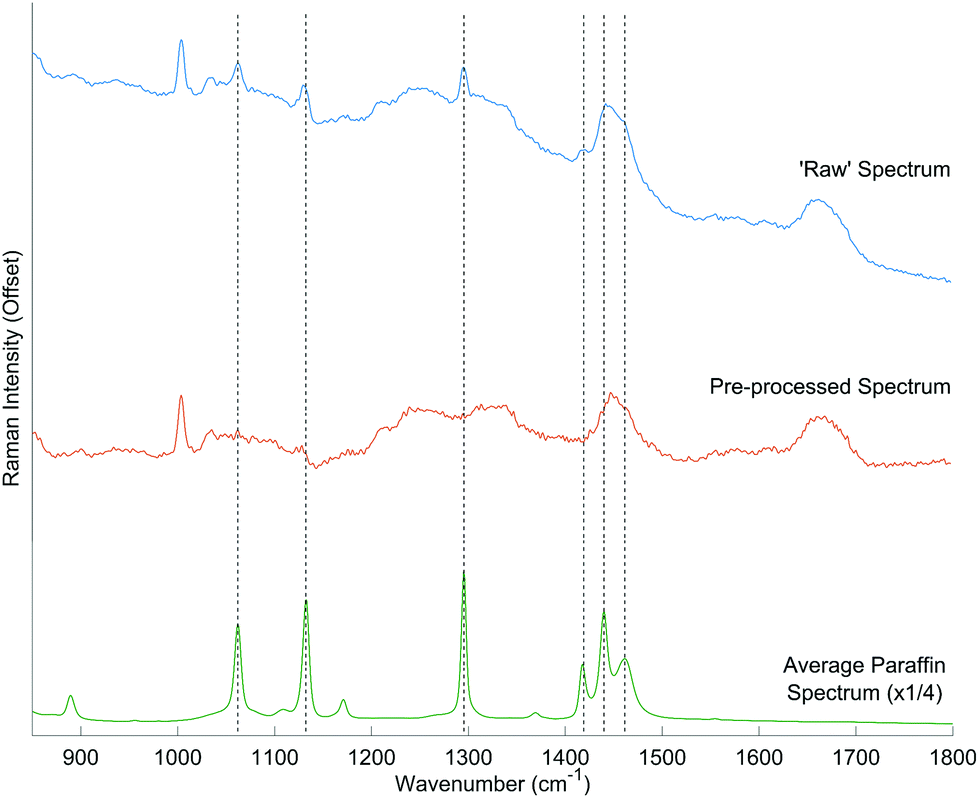 | ||
| Fig. 2 Digital paraffin removal using EMSC. Residual paraffin peaks, following ‘de-waxing’ are shown in the example spectra (blue) with major bands indicated by the dashed lines at 1062 cm−1, 1133 cm−1, 1296 cm−1, 1418 cm−1, 1441 cm−1 and 1464 cm−1. The pre-processed spectra (orange) shows the reduction of paraffin contributions, following EMSC and baseline correction. The average paraffin spectrum, obtained from 100 point measurements of pure paraffin, is shown in green for reference (the intensity of the paraffin spectrum has been reduced four-fold to aid visualisation). | ||
For the biopsy specimens, 2000 spectra were collected in total: 100 spectra from each of the 20 samples. However, 123 poor quality spectra that did not achieve the threshold ratio of phenylalanine peak intensity were filtered and removed from subsequent analysis. This resulted in a total of 1877 spectra: 1055 good response spectra, and 822 poor response spectra.
The average Raman spectrum of patients who showed a good response to pre-operative RT, and that of those who showed a poor response to pre-operative RT, are compared in Fig. 3. Notable Raman peaks characteristic of biological tissue, including peaks corresponding to the ring breathing mode of amino acid phenylalanine (1004 cm−1), the C–N stretch and N–H bend of Amide III (1230–1300 cm−1), the CH2 deformation of proteins and lipids (1450 cm−1), and the C![[double bond, length as m-dash]](https://www.rsc.org/images/entities/char_e001.gif) O stretch of Amide I (1665 cm−1) were observed in our results. Fig. 3 shows these peaks, in addition to other biological peaks and their tentative assignments, which were allocated using references from the current literature.14,15,28
O stretch of Amide I (1665 cm−1) were observed in our results. Fig. 3 shows these peaks, in addition to other biological peaks and their tentative assignments, which were allocated using references from the current literature.14,15,28
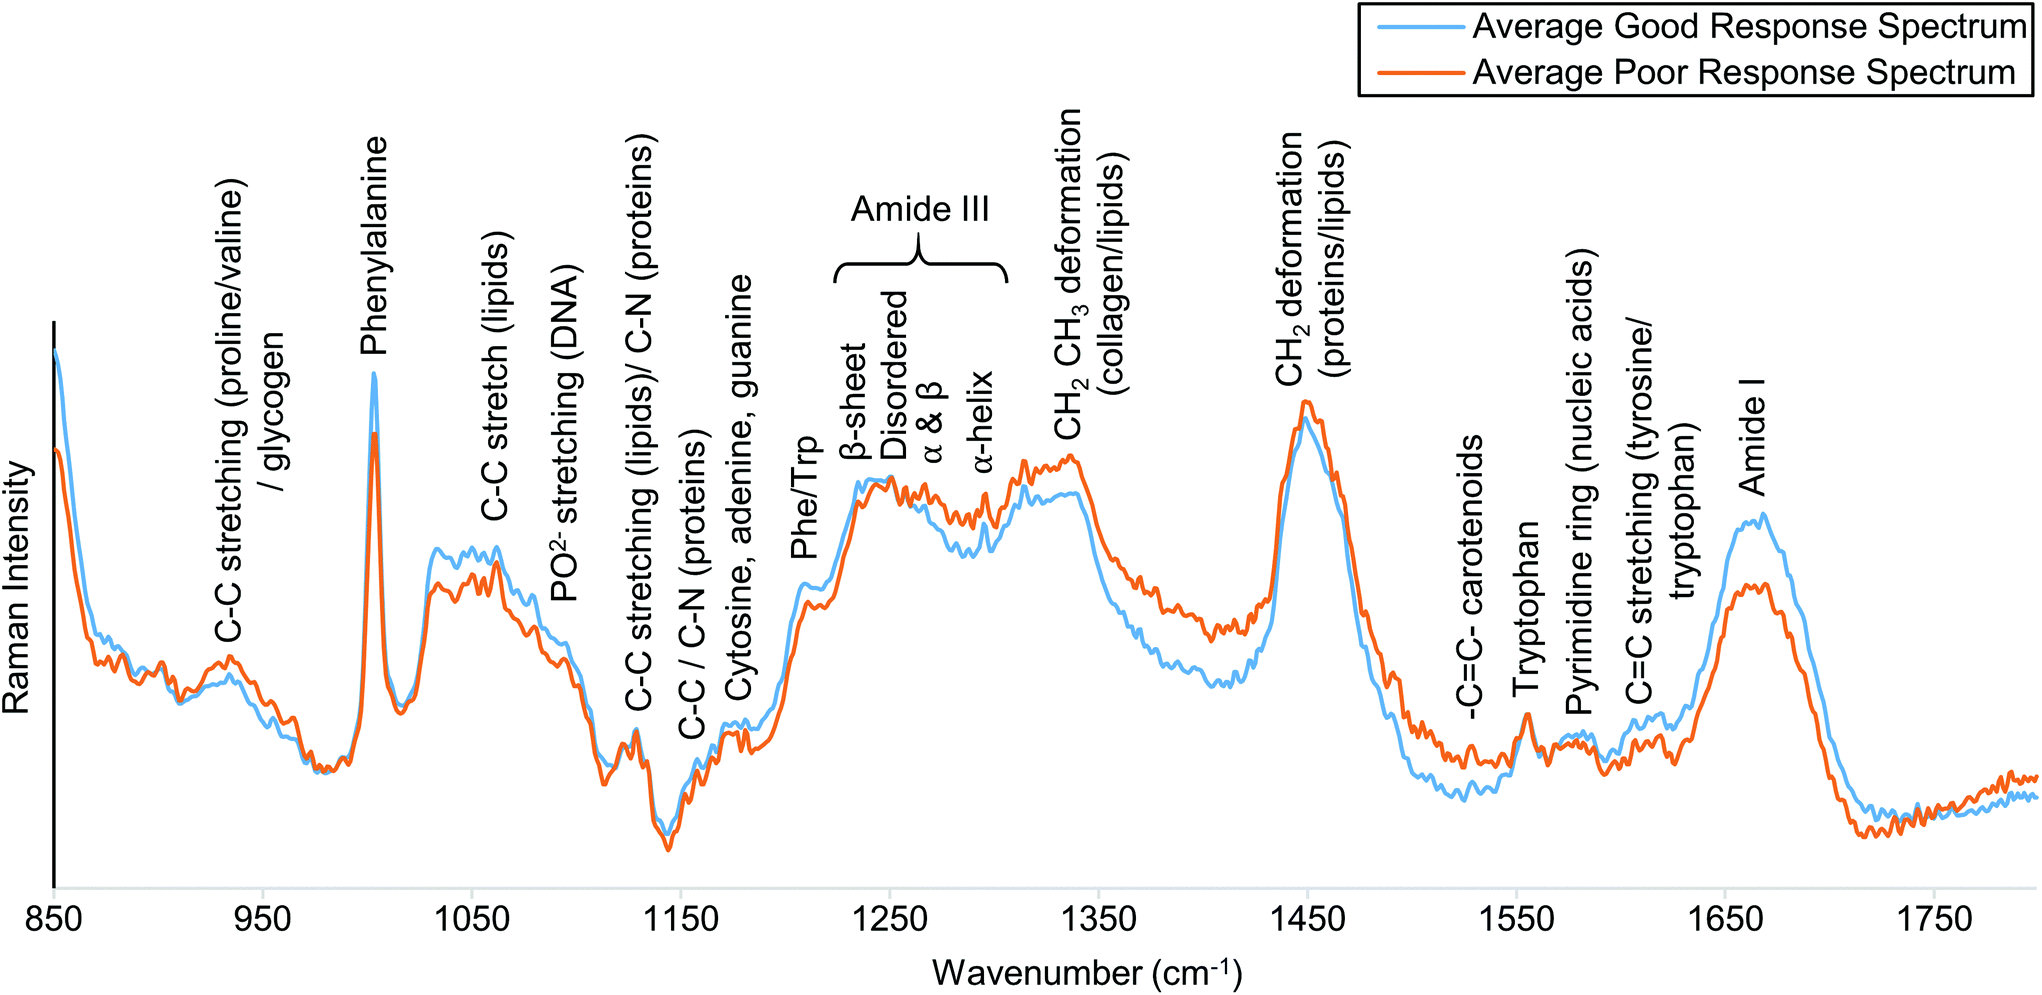 | ||
| Fig. 3 Averaged spectra obtained from biopsy specimens of good and poor response groups, shown in blue and orange respectively. Tentative peak assignments of the main spectral bands are annotated. | ||
The Raman spectra of biological tissue are inherently complex in nature, due to overlapping peaks from the vast number of tissue components within the sample.14 Subtle differences between good and poor responders were observed in the relative peak intensities and bandwidths of Raman peaks associated with protein and lipid contributions across the spectrum. The average spectrum of good responders showed a greater Raman intensity of peaks associated with protein contributions; 1004 cm−1 (phenylalanine), 1235 cm−1 and 1250 cm−1 (fitted to the β-sheet and disordered structure peaks of Amide III, respectively) and 1665 cm−1 (Amide I). Whereas, the average spectrum of poor responders showed increased lipid contributions; 1315–1340 cm−1 (CH2CH3 deformation) and 1450 cm−1 (CH2 deformation).
Multivariate analysis: PCA and LDA
Fig. 4A shows the loadings of the first three principal components (PCs) that were responsible for approximately 97% of the total variance. Multivariate statistical techniques, PCA and LDA, were employed to detect subtle features that differentiate the Raman spectra of good and poor responders. PCA is an unsupervised form of multivariate analysis, that reduces the dimensionality of the data, by linear transformation of the original variables into PCs.29,30 The first two PCs, PC1 and PC2, accounted for the most variance (95.2%), with PC2 being the most discriminatory component. Both PC1 and PC2 show contributions from peaks commonly associated with biological tissue; a phenylalanine peak at approximately 1004 cm−1, CH2 deformations typically associated with lipids at approximately 1450 cm−1 and Amide I signal at around 1669 cm−1. PC2 also showed additional notable peaks around 1115 cm−1 and 1239 cm−1, corresponding to lipid and Amide III contributions respectively, and an additional phenylalanine peak at 1033 cm−1. PC3 was dominated by peaks observed from the quartz substrate the tissue was mounted on. These include the broad peaks centred around approximately 1055 cm−1 and 1190 cm−1. PC3 showed additional biological peaks, including Amide I signal at approximately 1669 cm−1, and C–C deformation of lipids/C–N deformation of proteins at around 1133 cm−1.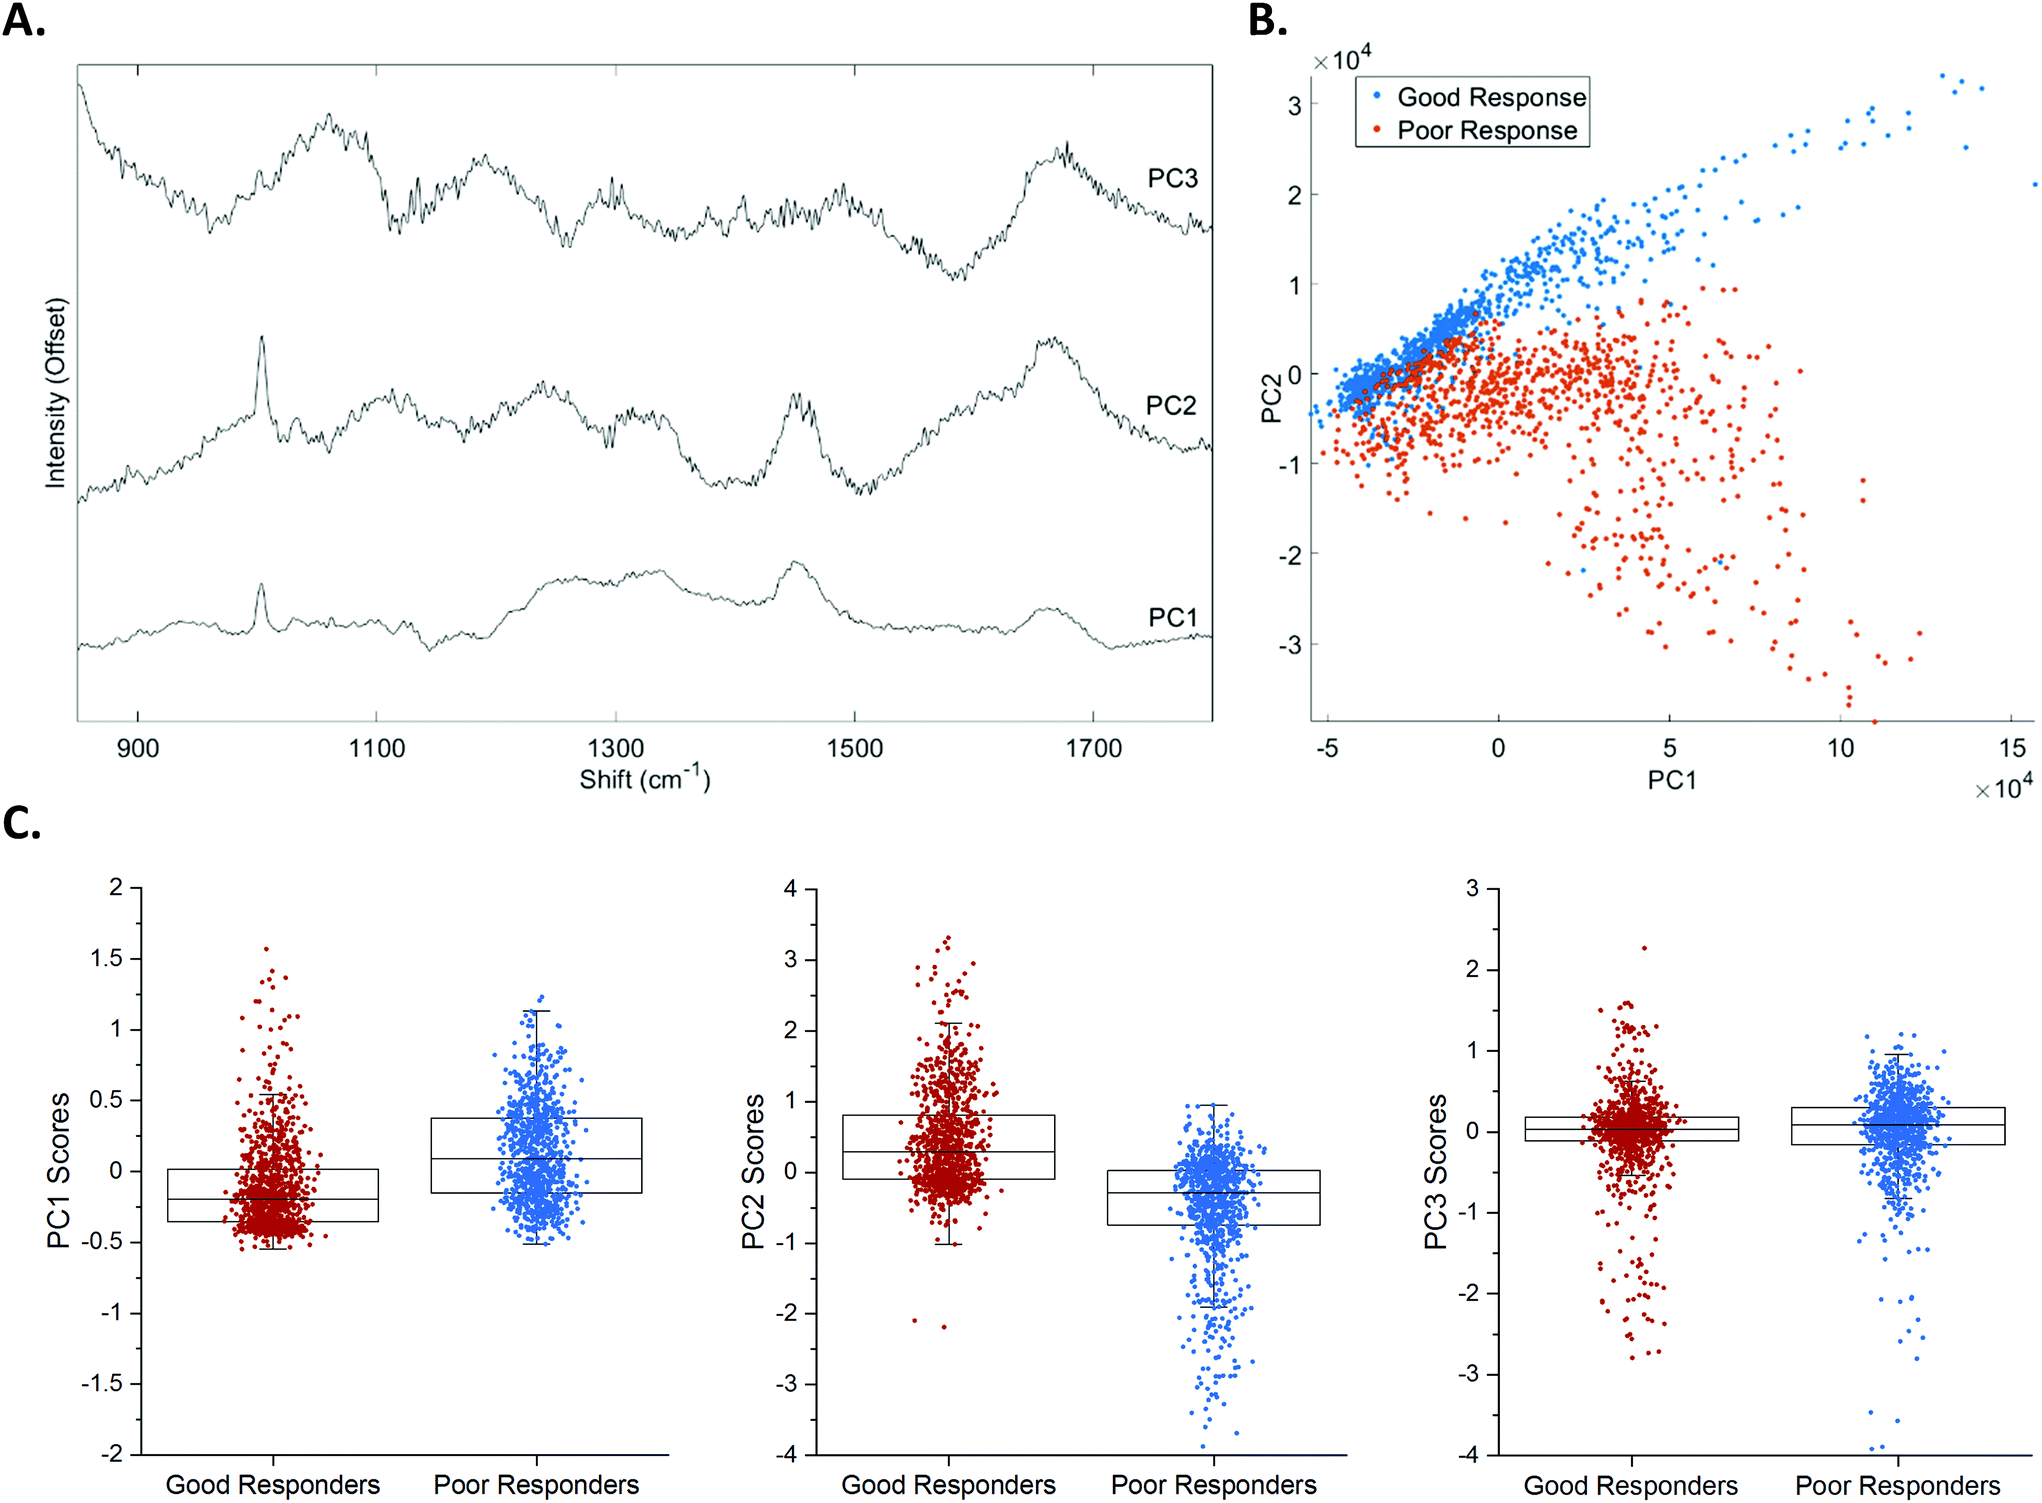 | ||
| Fig. 4 Results of PCA. (A) Plotted shapes of PC1 – PC3. (B) 2D scatter plot of PC1 and PC2 scores. (C) Scatter plot/box plot showing the scores of good responders and poor responders for PC 1–3. Each point represents a single Raman spectrum acquired from the Raman map measurements of the 20 biopsy samples. | ||
Fig. 4B shows a clear separation of good and poor responders was achieved by plotting the PC1 versus PC2 scores of each point in the 10 × 10 array for all samples. The scores for PC1 – 3, from good and poor responders are shown in Fig. 4C.
The first eight PCs (responsible for >98% of the total variance) were input into the LDA, a supervised technique that maximises the between-class variance, creating a linear boundary between classes.29–31 Classification of good and poor response was achieved with an accuracy of 86.04 ± 0.14% (standard error), 84.20 ± 0.27% sensitivity and 81.01 ± 0.37% specificity. Generally, positive LDA scores corresponded to Raman spectra taken from a sample that showed a good response to pre-operative RT, whereas negative scores corresponded to those that showed a poor response to pre-operative RT, as illustrated in Fig. 5A.
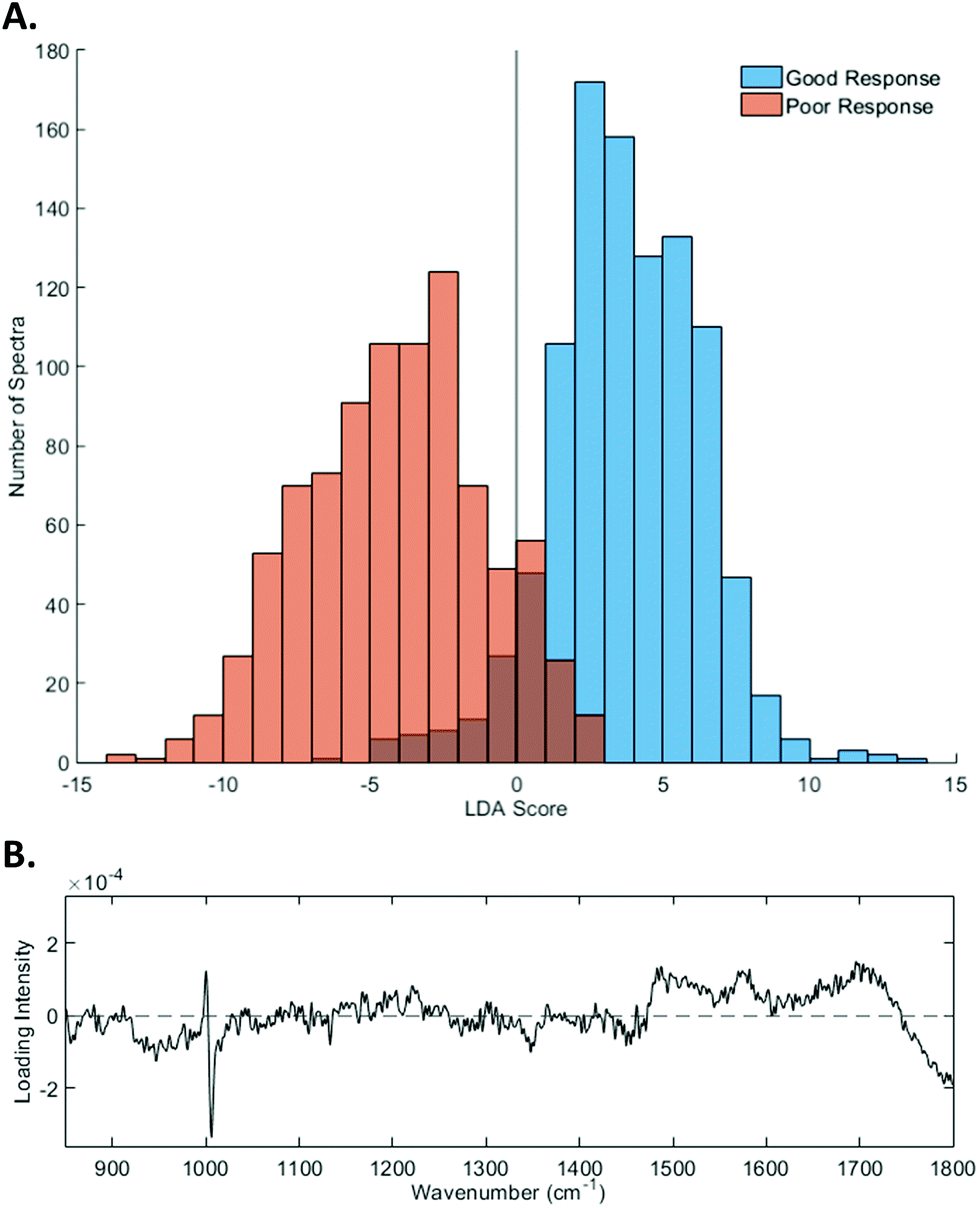 | ||
| Fig. 5 Linear discriminant analysis (LDA) results. (A) Histogram of the LDA scores for each spectrum from the Raman maps of the biopsy specimens. (B) The shape of the linear discriminant (LD). | ||
Fig. 5B shows the loading plot of the linear discriminant (LD) that achieved the best classification of response. The positive loading intensities were dominated by peaks that are typically associated with proteins and amino acids. These included peaks at 1168 cm−1 (C–H bending of tyrosine), 880 cm−1 and 1365 cm−1 (tryptophan), 1220 cm−1 (β sheet Amide III) and 1461 cm−1 (CH2 deformation of proteins/lipids). Peaks corresponding to nucleic acids, 1487 cm−1 (guanine/adenine) and 1582 cm−1 (pyrimidine ring of cytosine and thymine), also showed positive contributions to the LD loading.
In contrast, negative contributions to the LD were predominantly attributed to peaks mostly associated with lipid contributions. These peaks include those at 1133 cm−1 (C–C of lipids/C–N proteins), 1348 cm−1 (CH2CH3 deformation of collagen/lipids) and 1450 cm−1 (CH2 deformation). Other peaks that contributed to the negative score were 1274 cm−1 and 946 cm−1, which are associated with the α helix of Amide III and proline, valine and glycogen respectively.
We note that the LDA also showed a shift in the phenylalanine peak position between good and poor response groups, from 1000 to 1006 cm−1. Although this falls within the expected range of the phenylalanine peak, we presume that the shift is indicative of the different protein composition within the tissue of good and poor responders.
The results of the LDA confirmed the elevated lipid content observed in the average spectra obtained from the biopsies of patients who responded poorly to pre-operative RT (Fig. 3). Interestingly, these findings are in accordance with previously reported research, linking chemoresistance of several cancers, including CRC, to the dysregulation of lipid metabolism and the accumulation of lipid droplets (LDs).32,33 Additionally, a RS study by Tirinato et al. determined that increased levels of lipid droplets are characteristic of cancer stem cells in CRC, which are thought to have increased resistance to chemotherapies.34,35
Whilst our results show promising similarities with trends seen in the chemoresistance of CRC, we acknowledge that additional work is required to confirm these findings. This study considers only RS data collected from rectal cancer patients at the extremes of response, and does not consider those who showed a ‘moderate’ response to pre-operative RT. We hypothesise that these patients would show a combination of good and poor response signals, and therefore would require additional interpretation and consideration by a clinician. However, the intention is not that RS could replace the role of a clinician in CRC care, but provide additional information to guide patient treatment. In addition, these results only consider response to pre-operative SCRT, however, rectal cancer patients may also receive LCCRT. Further work would include validation of the model on a cohort of LCCRT patients and additional analysis of the corresponding post-treatment resection specimens to elucidate the molecular mechanisms of patient response.
Furthermore, the entirety of the sample population used in this study received treatment at the same hospital and therefore were subjected to the same tissue processing and embedding protocols. Although the general processes are standardised, there is likely to be slight variation in protocols across different hospital trusts and therefore the model should also be validated using samples from other hospitals.
Conclusions
This study has demonstrated subtle differences in the Raman spectra obtained from routine FFPE biopsy samples of rectal cancer patients who responded well to pre-operative RT and showed significant tumour regression, when compared to those who responded poorly. The Raman signature of patients that showed a good response showed increased protein contributions, whereas poor responders showed elevated lipid contributions. These differences were confirmed using a PCA-LDA algorithm, which was able to classify patient response to pre-operative RT into ‘good’ or ‘poor’ with an accuracy of approximately 86%, based on the spectra obtained from the pre-treatment biopsy samples. Although not absolute, this study has demonstrated that RS is able to detect subtle changes in the biochemical fingerprint of patient biopsy specimens, to stratify patient response to pre-operative RT, with a sufficient level of accuracy. Furthermore, this highlights the potential to develop RS as a tool to predict patient response to pre-operative therapy, to ultimately aid a clinician and guide personalised patient treatment in rectal cancer.Conflicts of interest
There are no conflicts to declare.Acknowledgements
CJK thanks the Leeds Institute of Medical Research at St James's for PhD funding and gratefully acknowledges the Pathology and Data Analytics staff at the University of Leeds for histology support and Dr Martin Isabelle (Spatial Omics and Multiplex Imaging, Bioimaging, GSK) for technical and academic support. We thank Renishaw for loan of the RA816 instrument acknowledge the support of the NIHR Surgical Technologies Co-operative. JGP thanks EPSRC and JSPS for funding. NPW is funded by Yorkshire Cancer Research. SDE acknowledges the following funders; MRC (MR/M009084/1) and EPSRC (EP/P023266/1). SDE is supported by the National Institute for Health Research (NIHR) infrastructure at Leeds.References
- Cancer Research UK, Bowel cancer statistics, http://www.cancerresearchuk.org/health-professional/cancer-statistics/statistics-by-cancer-type/bowel-cancer.
- The National Institute for Health and Care Excellence, Recommendations in Colorectal Cancer (NG151), 2020.
- E. J. A. Morris, P. J. Finan, K. Spencer, I. Geh, A. Crellin, P. Quirke, J. D. Thomas, S. Lawton, R. Adams and D. Sebag-Montefiore, Clin. Oncol., 2016, 28, 522–531 CrossRef CAS.
- K. C. M. J. Peeters, C. J. H. van de Velde, J. W. H. Leer, H. Martijn, J. M. C. Junggeburt, E. K. Kranenbarg, W. H. Steup, T. Wiggers, H. J. Rutten and C. A. M. Marijnen, J. Clin. Oncol., 2005, 23, 6199–6206 CrossRef CAS.
- R. J. Stephens, L. C. Thompson, P. Quirke, R. Steele, R. Grieve, J. Couture, G. O. Griffiths and D. Sebag-Montefiore, J. Clin. Oncol., 2010, 28, 4233–4239 CrossRef.
- E. Kapiteijn, C. A. M. Marijnen, I. D. Nagtegaal, H. Putter, W. H. Steup, T. Wiggers, H. J. T. Rutten, L. Pahlman, B. Glimelius, J. H. J. M. van Krieken, J. W. H. Leer and C. J. H. van de Velde, N. Engl. J. Med., 2001, 345, 638–646 CrossRef CAS.
- W. Van Gijn, C. A. M. Marijnen, I. D. Nagtegaal, E. M. K. Kranenbarg, H. Putter, T. Wiggers, H. J. T. Rutten, L. Påhlman, B. Glimelius and C. J. H. Van de Velde, Lancet Oncol., 2011, 12, 575–582 CrossRef.
- H. Birgisson, L. Påhlman, U. Gunnarsson and B. Glimelius, J. Clin. Oncol., 2005, 23, 6126–6131 CrossRef.
- J. Pollack, T. Holm, B. Cedermark, D. Altman, B. Holmström, B. Glimelius and A. Mellgren, Br. J. Surg., 2006, 93, 1519–1525 CrossRef CAS.
- O. J. Old, L. M. Fullwood, R. Scott, G. R. Lloyd, L. M. Almond, N. A. Shepherd, N. Stone, H. Barr and C. Kendall, Anal. Methods, 2014, 6, 3901–3917 RSC.
- P. Crow, N. Stone, C. A. Kendall, J. S. Uff, J. A. M. Farmer, H. Barr and M. P. J. Wright, Br. J. Cancer, 2003, 89, 106–108 CrossRef CAS.
- H. J. Butler, L. Ashton, B. Bird, G. Cinque, K. Curtis, J. Dorney, K. Esmonde-White, N. J. Fullwood, B. Gardner, P. L. Martin-Hirsch, M. J. Walsh, M. R. McAinsh, N. Stone and F. L. Martin, Nat. Protoc., 2016, 11, 664–687 CrossRef CAS.
- C. Krafft and J. Popp, Anal. Bioanal. Chem., 2015, 407, 699–717 CrossRef CAS.
- D. W. Shipp, F. Sinjab and I. Notingher, Adv. Opt. Photonics, 2017, 9, 315–428 CrossRef.
- N. Stone, C. Kendall, J. Smith, P. Crow and H. Barr, Faraday Discuss., 2004, 126, 141–157 RSC.
- R. Gaifulina, A. T. Maher, C. Kendall, J. Nelson, M. Rodriguez-Justo, K. Lau and G. M. Thomas, Int. J. Exp. Pathol., 2016, 97, 337–350 CrossRef CAS.
- J. Gala de Pablo, F. J. Armistead, S. A. Peyman, D. Bonthron, M. Lones, S. Smith and S. D. Evans, J. Raman Spectrosc., 2018, 49, 1323–1332 CrossRef.
- O. Ibrahim, A. Maguire, A. D. Meade, S. Flint, M. Toner, H. J. Byrne and F. M. Lyng, Anal. Methods, 2017, 9, 4709–4717 RSC.
- A. Tfayli, C. Gobinet, V. Vrabie, R. Huez, M. Manfait and O. Piot, Appl. Spectrosc., 2009, 63, 564–570 CrossRef CAS.
- E. O. Faoláin, M. B. Hunter, J. M. Byrne, P. Kelehan, H. A. Lambkin, H. J. Byrne and F. M. Lyng, J. Histochem. Cytochem., 2005, 53, 121–129 CrossRef.
- J. Nallala, G. R. Lloyd and N. Stone, Analyst, 2015, 140, 2369–2375 RSC.
- L. T. Kerr and B. M. Hennelly, Chemom. Intell. Lab. Syst., 2016, 158, 61–68 CrossRef CAS.
- K. H. Liland, A. Kohler and N. K. Afseth, J. Raman Spectrosc., 2016, 47, 643–650 CrossRef CAS.
- F. Lyng, E. Gazi and P. Gardner, Biomed. Appl. Synchrotron Infrared Microspectrosc. A Pract. Approach, 2011, pp. 147–191 Search PubMed.
- N. P. West, M. Dattani, P. McShane, G. Hutchins, J. Grabsch, W. Mueller, D. Treanor, P. Quirke and H. Grabsch, Br. J. Cancer, 2010, 102, 1519–1523 CrossRef CAS.
- M. Koch, C. Suhr, B. Roth and M. Meinhardt-Wollweber, J. Raman Spectrosc., 2017, 48, 336–342 CrossRef CAS.
- J. D. Brierley, M. K. Gospodarowicz and C. Wittekind, TNM Classification of Malignant Tumours, Wiley-Blackwell, 8th edn, 2016 Search PubMed.
- A. C. S. Talari, Z. Movasaghi, S. Rehman and I. U. Rehman, Appl. Spectrosc. Rev., 2015, 50, 46–111 CrossRef CAS.
- J. G. Kelly, J. Trevisan, A. D. Scott, P. L. Carmichael, H. M. Pollock, P. L. Martin-Hirsch and F. L. Martin, J. Proteome Res., 2011, 10, 1437–1448 CrossRef CAS.
- M. C. D. Santos, C. L. M. Morais, Y. M. Nascimento, J. M. G. Araujo and K. M. G. Lima, Trends Anal. Chem., 2017, 97, 244–256 CrossRef CAS.
- F. L. Martin, M. J. German, E. Wit, T. Fearn, N. Ragavan and H. M. Pollock, J. Comput. Biol., 2007, 14, 1176–1184 CrossRef CAS.
- A. K. Cotte, V. Aires, M. Fredon, E. Limagne, V. Derangère, M. Thibaudin, E. Humblin, A. Scagliarini, J. P. P. De Barros, P. Hillon, F. Ghiringhelli and D. Delmas, Nat. Commun., 2018, 9(1), 322 CrossRef.
- A. L. S. Cruz, E. de A. Barreto, N. P. B. Fazolini, J. P. B. Viola and P. T. Bozza, Cell Death Dis., 2020, 11(2), 105 CrossRef.
- L. Tirinato, C. Liberale, S. Di Franco, P. Candeloro, A. Benfante, R. La Rocca, L. Potze, R. Marotta, R. Ruffilli, V. P. Rajamanickam, M. Malerba, F. De Angelis, A. Falqui, E. Carbone, M. Todaro, J. P. Medema, G. Stassi and E. Di Fabrizio, Stem Cells, 2015, 33, 35–44 CrossRef CAS.
- M. Todaro, M. G. Francipane, J. P. Medema and G. Stassi, Gastroenterology, 2010, 138, 2151–2162 CrossRef CAS.
- C. J. Kirkby, J. Gala De Pablo, E. Hinkler-Hundal, H. M. Wood, S. D. Evans and N. P. West, Data for “Developing a Raman spectroscopy-based tool to stratify patient response to pre-operative radiotherapy in rectal cancer”, University of Leeds, [Dataset], 2020, DOI:10.5518/889.
Footnote |
| † The data for this paper is available from the University of Leeds Data Repository (https://doi.org/10.5518/889, Kirkby et al. 2020).36 |
| This journal is © The Royal Society of Chemistry 2021 |