DOI:
10.1039/D0AN01746A
(Paper)
Analyst, 2021,
146, 232-243
A three-electrode integrated electrochemical platform based on nanoporous gold for the simultaneous determination of hydroquinone and catechol with high selectivity†
Received
31st August 2020
, Accepted 12th October 2020
First published on 13th October 2020
Abstract
In this study, a novel three-electrode integrated electrochemical platform (TEIEP) has been designed and fabricated for the simultaneous detection of hydroquinone (HQ) and catechol (CC), in which nanoporous gold (NPG) served as the working electrode, and Pt particles and nanoporous Ag/AgCl served as the courter electrode and the reference electrode, respectively. Due to the remarkable catalytic activity of NPG, the TEIEP exhibits high selectivity and sensitivity towards HQ and CC determination with a distinct separation between the peaks for their coexistence. The oxidation peak current densities of HQ and CC were linear over the range of 0.2–100 μM with the detection limits of 0.083 μM (S/N = 3) for HQ and 0.119 μM (S/N = 3) for CC. Moreover, TEIEP has a satisfactory reproducibility and anti-interference ability, and can be used in real water sample analysis. This work undoubtedly provides a remarkable choice for catalytic materials and an integrated structure, and further a promising application prospect for developing novel sensors for on-site environmental monitoring.
1. Introduction
Industrial development has led to a significant increase in the release of potentially toxic phenolic compounds into the aquatic environment. Hydroquinone (1,4-dihydroxybenzene, HQ) and catechol (1,2-dihydroxybenzene, CC) are two important isomers of dihydroxybenzene, which are widely employed in industrial applications, such as in pesticides, dyes, tanning, plastics, cosmetics, and medicines.1,2 Improper sewage disposal leads to serious risk to all kinds of creatures, whilst human exposure to the overdose of these isomers can cause kidney damage, central nervous system inhibition, and even cancer.3 Considering their high toxicity and low degradability in a typical ecological environment,4 the US Environmental Protection Agency (EPA) and the European Union (EU) have listed HQ and CC as priority pollutants to be monitored in aquatic environments.5 So far, various methods have been implemented for the quantitative and qualitative determination of HQ and CC, including spectrophotometry,6 high performance liquid chromatography,7 chemiluminescence,8 fluorescence,9 and electrochemical methods.10,11 Compared with the other methods, electrochemical methods have drawn more attention due to their advantages of quick response, low cost, simple operation, high sensitivity, and stability.12 However, it is still difficult to determine these two isomers simultaneously with conventional electrodes due to their similar structures and redox potentials.13,14 Therefore, the development of a selective and sensitive electrochemical sensor for HQ and CC determination is of great significance to protect both the human health and environment.
Gold nanomaterials have received impressive attention in the field of electrochemical sensors owing to their good conductivity and excellent catalytic activity.15–17 To date, numerous reports have suggested that electrodes modified with gold nanoparticles can significantly improve the sensing performance of HQ and CC.18–20 However, the performance of the gold nanoparticles may be affected by the agglomeration of nanoparticles, which reduces the stability,21,22 and the high surface area oxide supports of nanoparticles, which degrade the catalytic performance of the gold nanoparticles.23 Besides, the immobilized gold nanoparticles are easily detached from the supports during the reaction, resulting in a rapid decrease in the catalytic activity of the gold nanoparticle-support composite catalyst.24 Unlike gold nanoparticles, nanoporous gold (NPG) has an independent self-supporting continuous porous structure, which can maintain its structural integrity during the catalytic reaction and reduces catalyst losses.25 Furthermore, the bi-continuous open porosity of NPG is beneficial for fast mass transport of the reactants at the solid–liquid interface, and the large effective surface area can promote the electrochemical reactions.26 Since the NPG structure can be easily prepared by the selective etching of active metal components in Au-based alloys,27–29 we fabricated NPG successfully on different substrates and applied it for the detection of hydrazine and small biological molecules.26,30 Herein, we further consider NPG as a promising candidate for the simultaneous determination of HQ and CC due to its high catalytic activity and availability.
Conventional electrochemical detection in the laboratory is easily restricted by large equipment, specific environments, qualified operators, and long detection time, which make it difficult to achieve on-site detection. In contrast, various electrochemical devices based on the integrated microchip can benefit by the portability, miniaturization, and mass production.31–33 They have been intensely researched and used, particularly for point-of-care diagnosis and on-site environmental monitoring.34–37 Generally, an integrated device is composed of a substrate, on which three mutually-insulated electrodes are sealed with an external insulating layer and the corresponding electrode leads.38,39 The three separate electrodes, known as the working electrode (WE), the reference electrode (RE), and the counter electrode (CE), respectively, emulate a classic electrochemical three-electrode system. The properties of miniaturization and coplanarization bring several inherent advantages to the integrated devices, including short electrode distance, low ohmic drop, large surface area-to-volume ratio, high sensitivity, and fast response time.30,40 Hence, it is of importance to combine portable integrated devices with NPG to achieve high performance and convenient sensors for the rapid on-site monitoring of HQ and CC.
In this paper, a three-electrode integrated electrochemical platform (TEIEP) was designed and built by preparing NPG as the working electrode, and Pt particles and nanoporous Ag/AgCl as the counter electrode and the reference electrode, respectively. All of the three electrodes were integrated onto a plane by electrochemical methods without complex operations. The prepared TEIEP showed excellent ability in the simultaneous determination of HQ and CC. Moreover, the portable TEIEP shows satisfactory results for real water sample analyses. The excellent electrochemical performance and simple fabrication process of the TEIEP will provide an available method to develop novel sensors for the future on-site monitoring of water quality.
2. Experimental
2.1. Reagents and chemicals
Au–Sn and Ag–Sn alloy plating solutions were both obtained from Mecart Sensor Co., Ltd (Guangzhou, China, website: http://www.mecart.cn). Hydroquinone (HQ, ≥98%) was purchased from Tianjin Yongda Chemical Reagent Co., Ltd. Catechol (CC, 98%) was obtained from Energy Chemical. Potassium hydroxide (KOH, 98%), potassium chloride (KCl, 99.5%), potassium ferrocyanide trihydrate (K4[Fe(CN)6]·3H2O, 99.0%), and potassium ferricyanide (K3[Fe(CN)6], ≥99.5%) were purchased from Aldrich. 0.1 M phosphate buffer solutions (PBS) containing 0.01 M KCl with various pH values were prepared using a certain amount of 0.1 M disodium hydrogen phosphate dodecahydrate (Na2HPO4·12H2O, 99.0%, Macklin) and sodium phosphate monobasic dihydrate (NaH2PO4·2H2O, 99.0%, Aldrich). Deionized water (DI water, ≥18.2 MΩ cm) was used to prepare all the aqueous solutions. All other chemicals used in this study were of analytical grade without further purification.
2.2. Electrodeposition of Pt as a counter electrode
Raw electrochemical chips were obtained from Mecart Sensor Co., Ltd (Guangzhou, China). Firstly, the integrated chip was cleaned with acetone, absolute ethanol, and deionized water sequentially. Then, the chip was put into an oven at 60 °C for 30 min before drying. The chip was immersed into 1 mM H2PtCl6 and 0.1 M KCl solution, and then Pt nanoparticles were electrodeposited on the counter electrode region at −0.6 V for 15 min. A Pt foil and a commercial Ag/AgCl electrode were used as the counter electrode and reference electrode, respectively, in the preparation process.
2.3. Fabrication of the NPG film as the working electrode
A two-electrode electrochemical cell was applied for the electrodeposition and dealloying of the Au–Sn alloy. In detail, the Au–Sn alloy was deposited onto the working electrode in the Au–Sn alloy plating bath at 45 °C, applying a constant cathode current density of 8 mA cm−2 for 5 min, with a stirring speed of 300 rpm. Then, the obtained Au–Sn electrode was immersed in 2 M KOH to dissolve Sn by applying a 0.6 V anode potential for 10 h.
2.4. Synthesis of nanoporous Ag/AgCl as the reference electrode
In order to optimize the electrode performance, a reference electrode with a large specific surface area is required to ensure reliable long-term stability and to shorten the time required for the electrode to reach equilibrium.41 Herein, a simple strategy for synthesizing nanoporous Ag/AgCl was first proposed. Firstly, a constant cathode current density of 20 mA cm−2 was applied to electrodeposit the Ag–Sn alloy for 5 min on the reference electrode region with a suitable stirring speed (700 rpm). Then, the nanoporous Ag/AgCl electrode was obtained in a single step by immersing the Ag–Sn alloy into 1.2 M HCl electrolyte with a constant anode potential of 0.1 V vs. a commercial Ag/AgCl reference electrode for only 2000 s.
2.5. Characterization and electrochemical measurements
A field-emission scanning electron microscope (SEM, Hitachi, SU8010) equipped with an energy dispersive spectrometer (EDS, IXRF) was used to observe the microstructure and the elemental composition of the samples at an acceleration voltage of 10 kV. X-ray diffraction (XRD) characterization was carried out using a Rigaku D/max-2200/PC diffractometer with Cu Kα radiation at the step rate of 8° min−1. Cyclic voltammetry (CV), linear sweep voltammetry (LSV), and electrochemical impedance spectroscopy (EIS) were performed on a Gamry Reference 600 electrochemical workstation and differential pulse voltammetry (DPV) was conducted on a CHI-1230A electrochemical workstation. The prepared TEIEP can be measured in 0.1 M phosphate buffered solution (PBS) containing 0.01 M KCl directly without an extrinsic counter electrode and a reference electrode. All the electrochemical measurements were carried out at room temperature.
3. Results and discussion
3.1. Characterization of the TEIEP
The schematic description of the fabrication process for the TEIEP is demonstrated in Scheme 1. The working electrode, counter electrode, and reference electrode were designed on the same plane and surrounded by a dam, which can prevent the leakage of the electrolyte. The interspace between each electrode was 500 μm, indicating its short electrode distance for an integrated device. Pt nanoparticles, NPG, and nanoporous Ag/AgCl were fabricated successively on the counter electrode, working electrode, and reference electrode, respectively. The corresponding optical pictures of the unmodified chip and TEIEP are shown in Fig. S1.†
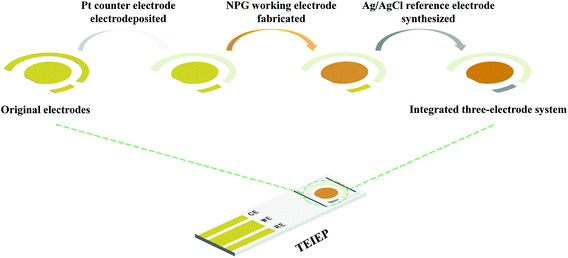 |
| | Scheme 1 Schematic illustration of the fabrication process for the TEIEP. | |
The SEM images of the bare planar gold substrate, the Pt counter electrode, the NPG working electrode, and the Ag/AgCl reference electrode are presented in Fig. 1. It can be observed that the bare planar gold substrate possesses a relatively flat surface before modification (Fig. 1a). The Pt nanoparticles were distributed uniformly on the surface of the counter electrode (Fig. 1b) with a homogeneous size of about 20–80 nm. The corresponding size distributions of the Pt nanoparticles are shown in Fig. S2a.† After electrodepositing the Au–Sn alloy on the substrate, a typical ridge-like structure42 was formed (Fig. S3a†). The Au–Sn alloy on the surface of the working electrode was eventually turned into an NPG film (Fig. 1c) after a simple etching process. Fig. 1c reveals that NPG consists of bi-continuous nanostructures with interconnected ligaments and nanopores. Fig. S2b† presents the pore size distributions of NPG. The pores with an average diameter of about 20–50 nm were found to occupy up to 95%; such a high porosity can shorten the transfer mass lengths between the electrode/electrolyte interface.42 Moreover, due to its large surface area, resulting from the porous structure, the NPG film can provide abundant active sites for electrochemical reactions. After corrosion and chlorination in hydrochloric acid, the Ag–Sn grains with an almost flat surface (Fig. S3b†) were converted into a rough and uniform Ag/AgCl structure (Fig. 1d). The large geometric surface area of the Ag/AgCl structure can ensure the stability of the reference electrode. Furthermore, this novel nanoporous Ag/AgCl structure can be further applied in the field of micro-integration.
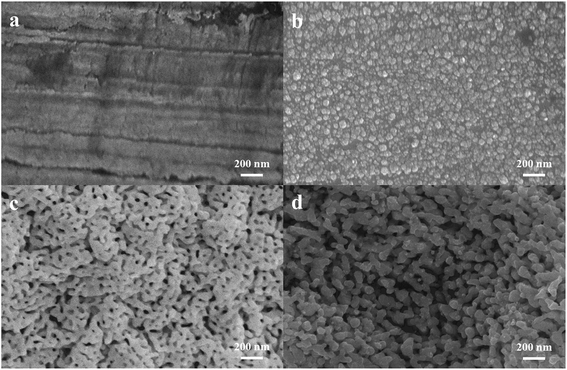 |
| | Fig. 1 SEM images of the planar gold substrate (a), the Pt counter electrode (b), the NPG working electrode (c), and the Ag/AgCl reference electrode (d). | |
In order to confirm the detailed elementary composition and the crystal structure of the modified NPG electrodes, EDS and XRD were performed. EDS element mapping images in low-magnification SEM were recorded to observe the elemental distribution of the Au–Sn alloy and NPG. As shown in Fig. S4,† Au and Sn elements (Fig. S4c and d†) were uniformly distributed on the Au–Sn alloy (Fig. S4a†), whereas only Au element (Fig. S4e†) could be found on NPG (Fig. S4b†). Fig. 2a exhibits the EDS spectrum of the Au–Sn alloy and NPG, with the determined composition shown in the inset. The atomic ratio of Au and Sn was found to be about 1![[thin space (1/6-em)]](https://www.rsc.org/images/entities/char_2009.gif) :
:![[thin space (1/6-em)]](https://www.rsc.org/images/entities/char_2009.gif) 1 in the prepared Au–Sn alloy film. Moreover, there was no signal of the Sn element in NPG, indicating the complete removal of Sn from the Au–Sn alloy via the electrochemical dealloying process. Fig. 2b shows the XRD patterns of the as-prepared Au–Sn and NPG. The results demonstrate that the as-prepared Au–Sn alloy film is composed of an AuSn homogeneous phase, which is in agreement with the EDS analysis. The diffraction peaks located at 23.8°, 28.8°, 40.6°, 41.8°, 48.6°, 51.5°, 59.7°, 66.0°, 68.4°, 75.4°, 76.2°, and 82.9° correspond to the (100), (101), (102), (110), (200), (201), (202), (210), (211), (212), (300), and (114) crystal planes of AuSn (JCPDS No. 08-0463), respectively. The peaks of the NPG film at 38.3°, 44.5°, 64.7°, 77.8°, and 81.9° can be indexed to the diffractions from the (111), (200), (220), (311), and (222) planes of face-centered cubic Au (JCPDS No. 04-0784), respectively. These results further demonstrate the successful construction of NPG structures.
1 in the prepared Au–Sn alloy film. Moreover, there was no signal of the Sn element in NPG, indicating the complete removal of Sn from the Au–Sn alloy via the electrochemical dealloying process. Fig. 2b shows the XRD patterns of the as-prepared Au–Sn and NPG. The results demonstrate that the as-prepared Au–Sn alloy film is composed of an AuSn homogeneous phase, which is in agreement with the EDS analysis. The diffraction peaks located at 23.8°, 28.8°, 40.6°, 41.8°, 48.6°, 51.5°, 59.7°, 66.0°, 68.4°, 75.4°, 76.2°, and 82.9° correspond to the (100), (101), (102), (110), (200), (201), (202), (210), (211), (212), (300), and (114) crystal planes of AuSn (JCPDS No. 08-0463), respectively. The peaks of the NPG film at 38.3°, 44.5°, 64.7°, 77.8°, and 81.9° can be indexed to the diffractions from the (111), (200), (220), (311), and (222) planes of face-centered cubic Au (JCPDS No. 04-0784), respectively. These results further demonstrate the successful construction of NPG structures.
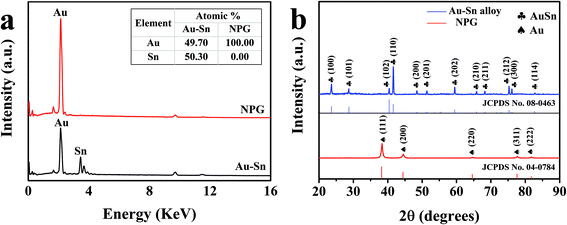 |
| | Fig. 2 (a) EDS images of Au–Sn and NPG, and the inset shows the elemental composition. (b) XRD patterns of Au–Sn and NPG. | |
The fabricated nanoporous Ag/AgCl electrode, which was prepared using the novel method, was then examined by EDS and XRD for investigating its elemental composition and crystal structure. The detailed preparation of the electrode is mentioned in section 2.4. Fig. S5a† shows the change in the elemental composition throughout the process. It is obvious that Sn was completely etched and Cl reacted with some of the Ag to form AgCl (the atomic ratio of Ag to Cl is more than 1). The XRD test further proved the successful synthesis of AgCl. As recorded in Fig. S5b,† several conspicuous diffraction peaks of the Ag/AgCl layer located at 28.0°, 32.4°, 46.4°, 55.0°, 57.7°, 67.6°, 74.6°, 76.9°, and 85.9° are ascribed to the (111), (200), (220), (311), (222), (400), (331), (420), and (422) crystal planes of AgCl (JCPDS No. 31-1238), respectively. The residual peaks are attributed to unchlorinated silver. The diffraction peaks located at 38.3°, 44.4°, 64.6°, 77.5°, and 81.7° belong to the (111), (200), (220), (311), and (222) crystal planes of Ag (JCPDS No. 04-0783), respectively. These results indicate the feasibility of our proposed strategy for synthesizing the Ag/AgCl structure.
3.2. Electrochemical behaviors of the bare and modified electrodes
To evaluate the catalytic performance of NPG for dihydroxybenzene, cyclic voltammetry (CV) tests were performed. Fig. 3a and b show the response of the bare Au substrate and NPG electrode in PBS for HQ and CC, respectively. It can be seen that the Au substrate possesses some catalytic performance, which may be attributed to the catalytic properties of gold itself. Compared with the Au substrate, NPG produced about two times enhancement in the oxidation current density of HQ or CC, demonstrating its better sensing performance. In addition, the peak potential differences (ΔEp) between the anodic and cathodic peaks at the NPG electrode were 102.67 mV for HQ and 96.6 mV for CC, which was much smaller than that on the original Au substrate (262.55 mV for HQ and 211.7 mV for CC). The results indicate a significant improvement in the reversibility of the electrochemical reactions with the NPG electrode. Nevertheless, the bare Au electrode and NPG electrode exhibited different electrochemical behaviors when they were used for detecting HQ and CC simultaneously. As shown in Fig. 3c, only one broad oxidation peak and two distinct reduction peaks were found at the Au electrode, indicating that it lacked the ability to specifically recognize these two isomers simultaneously. For the NPG electrode, two pairs of well-defined redox peaks can be observed. Fig. 3d presents the CV curves of NPG in the absence and presence of 1 mM HQ and CC. After 1 mM HQ and CC were added, obvious enhancements in the current density could be noticed. Meanwhile, a pair of redox peaks were located at 118 mV and 34 mV for HQ, corresponding to the oxidation of HQ to 1,4-benzoquinone and the reversible reduction from 1,4-benzoquinone back to HQ. Similarly, the redox peaks located at 225 mV and 146 mV were in accordance with the oxidation of CC to 1,2-benzoquinone and the reversible reduction from 1,2-benzoquinone back to CC on the surface of NPG. The results illustrate that NPG shows excellent sensitivity and selectivity towards HQ and CC in a mixture solution.
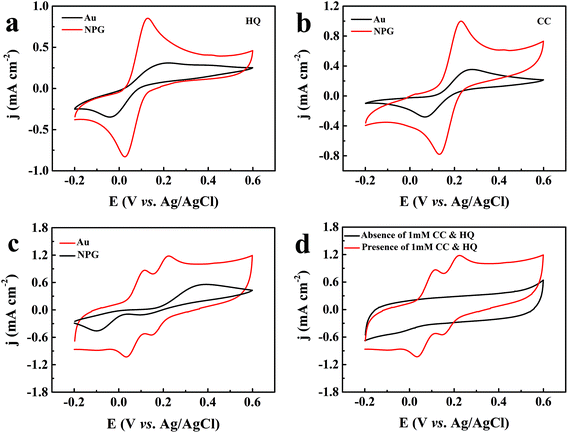 |
| | Fig. 3 CV curves of the gold electrode and the NPG electrode in 0.1 M PBS (pH = 7.0) and 0.01 M KCl solution with 1 mM HQ (a), 1 mM CC (b), 1 mM HQ and CC (c), and NPG electrode with and without 1 mM HQ and CC (d) at a scan rate of 50 mV s−1. | |
The reason for this discrepancy in the simultaneous detection of these two isomers may be derived from the intrinsic differences between the planar gold and NPG electrodes. The major morphological difference between these two electrodes is the presence of a higher density of defect-type sites at the edges of the NPG surface, which can lead to significant potential shifts in electrochemical reactions.43,44 The more catalytic defect-type sites can be evaluated by the increased surface area. The electrochemical surface areas (ECSA) of the planar gold and NPG were calculated through the CV curves measured in 0.5 M H2SO4 solution at a scan rate of 50 mV s−1, as shown in Fig. 4a. The ECSA was determined by the integral area of the gold oxide reduction peak,45 which can be calculated according to the equation:46
| |  | (1) |
where
A is the integral area of the gold oxide reduction peak,
s is the apparent area of the electrode, and constant 0.39 is the conversion factor. The ECSA value of NPG (20.83 cm
2) is much higher than that of the planar gold electrode (0.10 cm
2), demonstrating that NPG has a higher density of catalytic active sites and thus caused incoordinate potential shifts of HQ and CC. Furthermore, it is well known that the oxidation potential is generally governed by electron transfer from the electroactive molecules to the working electrode and hole transfer from the molecules to the Pt electrode.
13 In this work, the electron transfer is the major influencing factor of the oxidation potential. In order to obtain insights into the interfacial electron transfer kinetics, the electrochemical impedance (EIS) measurements of the planar gold and NPG electrodes were performed in 5 mM [Fe(CN)
6]
3−/4− solution with 0.1 M KCl as the supporting electrolyte.
Fig. 4b compares their Nyquist plots. The semicircular diameter in the Nyquist diagram at a high frequency range represents the electron transfer resistance (
Rct).
47 The
Rct of NPG (8.06 Ω cm
2) was found to be lower than that of the planar gold electrode (16.70 Ω cm
2), indicating that NPG can significantly reduce the electron transfer resistance and kinetic barrier at the electrode interface, and further lower the overpotentials of HQ and CC. According to the discussions above, the larger electrochemical surface areas and faster electron transfer efficiency of NPG modify the oxidation potential of HQ and CC with a distinct separation of the peaks.
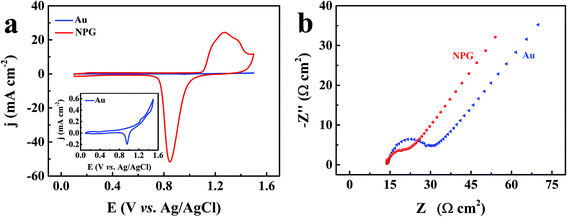 |
| | Fig. 4 (a) CV curves of the planar Au electrode and the NPG electrode in 0.5 M H2SO4 at a scan rate of 50 mV s−1; the inset is the magnified CV curve of the planar Au electrode. (b) Nyquist plots of the Au electrode and the NPG electrode in 0.1 M KCl electrolyte with 5 mM K3[Fe(CN)6] and 5 mM K4[Fe(CN)6]. | |
For the purpose of briefly highlighting the performance of our prepared nanoporous Ag/AgCl structure, we selected commercial Ag/AgCl pastes with a planar sheet structure (shown in Fig. S6†) for comparison. It is known that the polarization of the reference electrode can induce the deviation of the electrode equilibrium potential and contribute to signal distortion.48 Therefore, the linear polarization test was conducted by linear sweep voltammetry (LSV) method to evaluate the anti-polarization property of these two electrodes in a two-electrode system. Each Ag/AgCl electrode served as the working electrode and the reference electrode. The counter electrode was a platinum electrode. As shown in Fig. S7a,† the polarization resistance value of nanoporous Ag/AgCl (0.1 Ω cm−2) is smaller than that of the planar Ag/AgCl electrode (0.2 Ω cm−2), demonstrating a larger exchange current density and greater anti-polarization property. Furthermore, an open circuit potential (OCP) test was performed in 0.1 M PBS containing 0.01 M KCl to evaluate the stability and accuracy of our synthesized nanoporous Ag/AgCl reference electrode. It should be noted that the obtained Ag/AgCl worked as the working electrode and the commercial Ag/AgCl (3 M KCl) reference electrode served as the counter and the reference electrode. According to the Nernst equation, the relationship between EAg/AgCl and chloride ion concentration CCl− (25 °C) can be described by the equation:49
| | EAg/AgCl (mV) = 222 − 59![[thin space (1/6-em)]](https://www.rsc.org/images/entities/char_2009.gif) lg lg![[thin space (1/6-em)]](https://www.rsc.org/images/entities/char_2009.gif) CCl− CCl− | (2) |
The theoretical value of the potential difference between the synthesized nanoporous Ag/AgCl electrode (0.01 M KCl) and the commercial Ag/AgCl (3 M KCl) reference electrode can be calculated as 146 mV from the above equation. As shown in Fig. S7b,† the OCP was eventually steady at 141.2 mV with a variation of 0.1 mV, further verifying the practicability of our synthesized nanoporous Ag/AgCl reference electrode.
3.3. The effect and optimization of pH
Considering that the electrochemical behavior of the two dihydroxybenzene isomers were significantly influenced by the acidity of electrolyte, the redox behaviors of 1 mM HQ and CC were then investigated with the TEIEP via CV measurements in the pH range of 6.0–8.0, as illustrated in Fig. 5a and b. The oxidation peak potential Epa of the two isomers shifted negatively with increasing pH value, indicating that the protons were directly involved in this redox process.50 The regression equations can be written as follows.| | | HQ: Epa = −0.054 × pH + 0.494 (R2 = 0.998) | (3) |
| | | CC: Epa = −0.050 × pH + 0.575 (R2 = 0.991) | (4) |
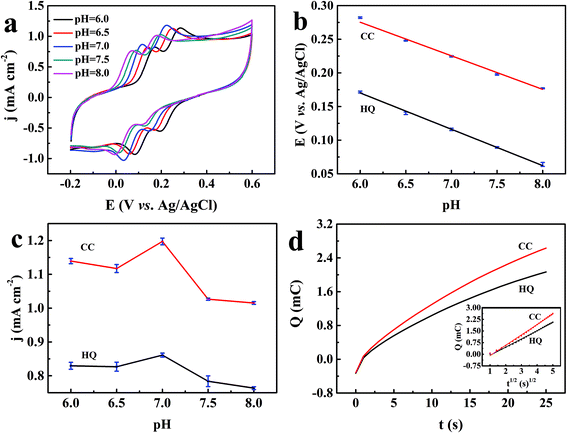 |
| | Fig. 5 (a) CV curves of 1 mM HQ and CC at the TEIEP in 0.1 M PBS containing 0.01 M KCl in the pH range of 6.0–8.0, scan rate: 50 mV s−1. (b) The influence of different pH values on the oxidation peak potentials of HQ and CC. (c) The effect of the pH value of the electrolyte on the oxidation peak current densities of HQ and CC. (d) Plot of Q–t curves of 1 mM HQ or CC at the TEIEP in 0.1 M PBS (pH = 7.0) and 0.01 M KCl; the inset shows the plot of Q versus t1/2. | |
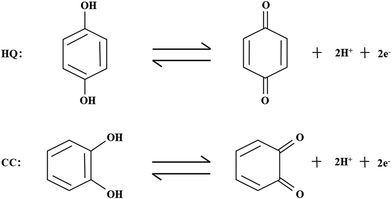
The slope values of the two equations are −54 and −50 mV per pH, which are close to the Nernst value of −59 mV per pH.51 The result indicates that the electrochemical redox processes of HQ and CC both involve two-electron and two-proton processes, which is in accordance with previous reports.52,53 The proposed redox reactions can be described as follows.
Furthermore, the result in Fig. 5c shows that the oxidation peak current densities of HQ and CC increased gradually with the increasing pH value and both attained their maximum at pH 7.0; then, the oxidation peak current densities decreased when pH increased further. Hence, in order to obtain optimal sensitivity and selectivity, pH 7.0 was chosen for the detection of HQ and CC in subsequent experiments. However, at equivalent concentrations, the response current density of CC was found to be higher than that of HQ. This phenomenon can be well explained by the Randles–Sevcik equation:54
| | | ip = 2.69 × 10⁵n3/2AD1/2Cv1/2 | (5) |
where
ip is the peak current,
n is the number of electrons involved,
A is the electrochemical surface area,
D is the diffusion coefficient,
C is the concentration of the electroactive species, and
v is the scan rate. Therefore, the peak current densities of HQ and CC were determined by their different diffusion coefficient (
D), when all the other variables were the same. Chronocoulometry method was employed to estimate the apparent diffusion coefficient of HQ and CC using the TEIEP in 0.1 M PBS (pH = 7.0) containing 0.01 M KCl.
Fig. 5d represents the charge-time profiles obtained by setting the working electrode potential at 118 and 255 mV (peak potentials in the cyclic voltammogram) for HQ and CC, respectively. The inset shows the plots of
Q vs. t1/2 with the best fits. The apparent diffusion coefficients for both HQ and CC can be estimated from the slopes of their chronocoulometry curves by Anson's equation:
55| |  | (6) |
where
Q is the amount of charge,
F is Faraday's constant,
t represents time,
Qdl represents double layer charge, and
Qads represents faradaic charge. The diffusion coefficient could be calculated to be 2.94 × 10
−5 cm
2 s
−1 for HQ and 4.86 × 10
−5 cm
2 s
−1 for CC. Since CC has a larger diffusion coefficient than that of HQ, therefore, when the concentrations of the HQ and CC were equal in the solution, a higher current density of CC than HQ is expected.
3.4. Influence of the scan rate
To investigate the reaction kinetics, the influence of the scan rates on the redox behavior of the two dihydroxybenzene isomers at the TEIEP was investigated by the CV studies in 0.1 M PBS (pH = 7.0) and 0.01 M KCl containing 1 mM HQ and CC. From Fig. 6a, it can be seen that as the scan rate increased from 10 to 150 mV s−1, the oxidation peak potentials of HQ and CC shifted to a more positive potential, while their reduction peak potentials decreased to a more negative potential, which indicated that the two isomers showed quasi-reversible behavior at the modified electrode. Besides, the oxidation peak current densities jp (mA cm−2) of HQ and CC increased gradually with increasing scan rates and exhibited a good linear relationship with the square root of the scan rate v1/2 (mV s−1)1/2, as demonstrated in Fig. 6b. The regression equations can be calculated as:| | | HQ: jp = 0.152 × v1/2 − 0.205 (R2 = 0.996) | (7) |
| | | CC: jp = 0.172 × v1/2 − 0.143 (R2 = 0.993) | (8) |
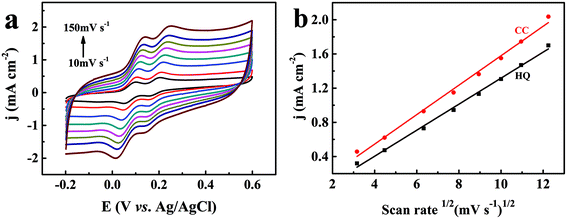 |
| | Fig. 6 (a) CV curves of 1 mM HQ and CC at the TEIEP in 0.1 M PBS (pH = 7.0) containing 0.01 M KCl at different scan rates (10–150 mV s−1). (b) The fitting plots of the anodic peak current densities vs. the square root of the scan rate for HQ and CC. | |
These results indicate that the electrode reactions of HQ and CC are typical diffusion-controlled processes.
3.5. Simultaneous determination of HQ and CC
Differential pulse voltammetry (DPV) technique was utilized for the quantitative analysis of the two isomers due to its higher sensitivity and better resolution than the CV method.56 The selective determination of HQ and CC in their mixed components was conducted by increasing the concentration of one component with the other component kept at a constant concentration of 30 μM. As shown in Fig. 7a and c, the oxidant peaks of HQ and CC were found to be well-separated and the peak current density jp (mA cm−2) of the detected species enhanced gradually with increasing concentration C (μM) from 0.2 to 100 μM, while the peak current density of the other species remained essentially constant. Based on the calibration plots from Fig. 7b and d, we can obtain the linear regression equations as:| | | HQ: jp = 0.00314 × C + 0.02653 (R2 = 0.996) | (9) |
| | | CC: jp = 0.00314 × C + 0.03392(R2 = 0.997) | (10) |
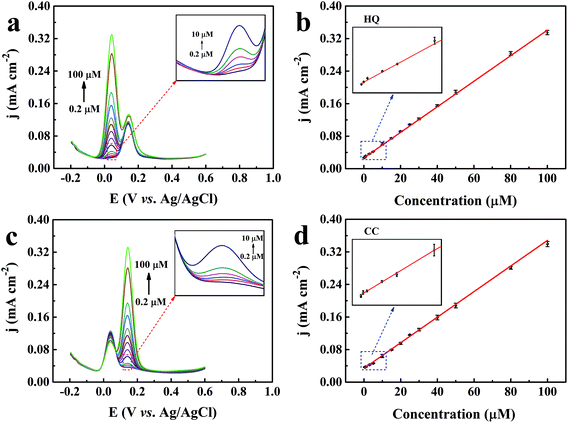 |
| | Fig. 7 (a) DPV curves of the TEIEP in the presence of 30 μM CC with HQ at different concentrations in 0.1 M PBS (pH = 7.0) containing 0.01 M KCl. (b) Linear calibration plot between the concentration of HQ and the peak current density. (c) DPV curves of the TEIEP with CC at different concentrations in the presence of 30 μM HQ. (d) Corresponding calibration plot between the concentration of CC and the peak current density. | |
Further, the minimum limit of detection (LOD) was calculated by using the following equation.
| |  | (11) |
where
σ is the standard deviation of the blank and
S is the slope of the calibration curve. All the detection limits obtained in this study were based on three times of the signal-to-noise ratio (S/N = 3). The detection limits were estimated to be 0.083 μM for HQ and 0.119 μM for CC.
The synchronous determination of HQ and CC was also carried out in 0.1 M PBS (pH = 7.0) containing 0.01 M KCl by simultaneously increasing their concentrations. From Fig. 8a, as the concentrations of the two isomers increased, the corresponding oxidation currents were gradually elevated. Linear relationships were found between the oxidation current densities and the concentrations of the isomers within the investigated concentrations (0.2–50 μM for HQ and 0.2–100 μM for CC), as demonstrated in Fig. 8b and c. The corresponding regression equations are written as follows:
| | | HQ: jp = 0.00307 × C + 0.02350 (R2 = 0.996) | (12) |
| | | CC: jp = 0.00327 × C + 0.02526 (R2 = 0.998) | (13) |
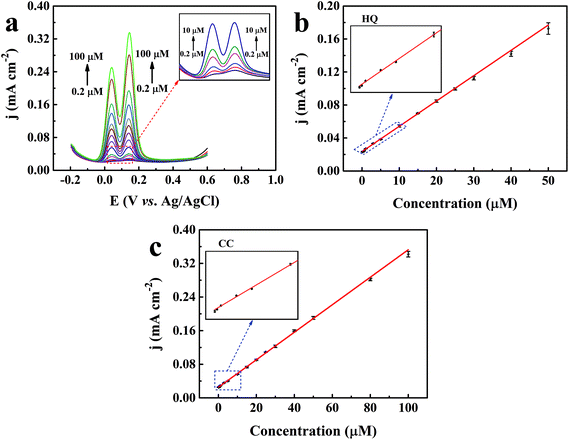 |
| | Fig. 8 (a) DPV curves of the TEIEP with different concentrations of HQ and CC in 0.1 M PBS (pH = 7.0) containing 0.01 M KCl. (b) Linear calibration plot between the concentration of HQ and the peak current density. (c) Corresponding calibration plot between the concentration of CC and the peak current density. | |
The detection limits reached 0.141 μM and 0.088 μM for HQ and CC, respectively. These results illustrate that our proposed TEIEP can be used for the simultaneous identification and determination of HQ and CC when they coexist. The corresponding detection mechanisms by the DPV method can be described in Scheme 2. A comparison of the previously reported electrochemical sensors based on the Au nanomaterial and this work for the selective determination of HQ and CC is listed in Table 1, demonstrating that our fabricated NPG shows a better sensing performance.
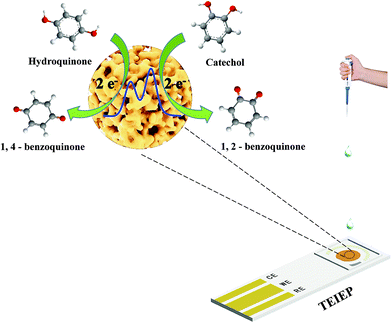 |
| | Scheme 2 Mechanisms for the simultaneous detection of HQ and CC. | |
Table 1 Comparison of this work with other reported Au nanomaterial-modified electrodes for the simultaneous determination of HQ and CC
| Working electrodes |
Linear range (μM) |
Detection limits (μM) |
Ref. |
| HQ |
CC |
HQ |
CC |
| AuNP/SG/GCE |
5–100 |
5–100 |
1 |
2 |
18
|
| Au NPs/CNTs/graphene/GCE |
2–80 |
2–80 |
0.8 |
0.95 |
57
|
| Au-G/GCE |
1–100 |
1–100 |
0.2 |
0.15 |
58
|
| AuNPs/Fe3O4-APTES-GO/GCE |
3–137 |
2–145 |
1.1 |
0.8 |
59
|
| CS/MWCNTs/PDA/AuNPs/GCE |
0.1–10 |
0.1–10 |
0.035 |
0.047 |
60
|
| pEDOT/DGNs/GCE |
5–100 |
5–100 |
0.98 |
1.4 |
61
|
| MWCNT-Au-IL/GCE |
0.5–110 |
0.5–200 |
0.2 |
0.2 |
62
|
| AuNPs/ZnO/Al2O3/GO,chit/GCE |
0.13–56.6 |
0.5–40 |
0.19 |
3.1 |
63
|
| Au/L-lysine/OMC-Au/Tyr/GCE |
0.4–80 |
0.4–80 |
0.05 |
0.025 |
64
|
| Au-PdNF/rGO/GCE |
1.6–100 |
2.5–100 |
0.5 |
0.8 |
65
|
| NPG |
0.2–100 |
0.2–100 |
0.083 |
0.119 |
This work |
3.6. Selectivity, reproducibility, and stability studies of the as-prepared TEIEP
Selectivity is a crucial parameter to evaluate the reliability of electrochemical sensors. Therefore, the effects of various possible interfering inorganic ions and phenolic compounds on the determination of HQ and CC were investigated by DPV technique in the presence of 50 μM HQ and CC using 0.1 M PBS (pH = 7.0) and 0.01 M KCl as the supporting electrolyte. As shown in Table S1,† no impact on the signals of the two isomers (the variation of peak current <5%) was observed after the addition of 100-fold greater concentrations of Na+, K+, Mg2+, Zn2+, NH4+, SO42−, Cl−, and NO3−, 5-fold greater concentrations of phenol and resorcinol, and 20-fold greater concentrations of bisphenol A, o-nitrophenol, and p-nitrophenol. This result indicates that the as-prepared TEIEP has a satisfactory selectivity for the simultaneous detection of HQ and CC without influence from potential interfering substances.
In order to investigate the reproducibility and long-term stability of the prepared TEIEP, five individual electrodes were fabricated under the same conditions and applied for the detection of 1 mM HQ and CC in 0.1 M PBS (pH = 7.0) containing 0.01 M KCl by CV measurement at the scan rate of 50 mV s−1. As shown in Fig. 9a, the relative standard deviations (RSD) of the anodic current densities were calculated to be 2.06% and 2.39% for HQ and CC, respectively, among the five different electrodes. The results reveal the unique reproducibility of the reported TEIEP. The long-term stability of the TEIEP was examined under the same electrochemical conditions with continuous examinations every day. After one week of storage, as presented in Fig. 9b, TEIEP exhibited 95.28% and 99.16% of its initial oxidation current densities for HQ and CC, respectively, demonstrating the reliable and excellent long-term stability.
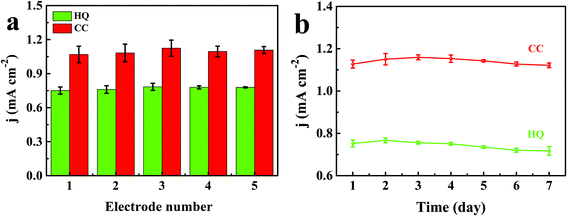 |
| | Fig. 9 (a) Reproducibility test of the TEIEP in 0.1 M PBS (pH = 7) and 0.01 M KCl solution containing 1 mM HQ and CC. (b) Long-term stability of the TEIEP under the same test conditions for one week. | |
3.7. Real sample analysis
The performance of on-site monitoring was estimated by determining HQ and CC in different real water samples. Tap water was collected from the Sun Yat-sen University and river water was collected from Pearl River (Guangzhou, China). DPV measurement was applied to calculate the recoveries of HQ and CC by using the standard addition method and each analysis took 100 s. In detail, the water samples were firstly prepared by adding different concentrations of HQ and CC in the freshly collected water. Before adding the testing water sample on the TEIEP, a series of real water samples were diluted 10-fold with 0.1 M PBS (pH 7.0). The oxidation peak current density was measured by DPV at the oxidation potentials of HQ or CC. The concentrations of HQ or CC were obtained from the calibration plot. This procedure was repeated three times for each sample. As presented in Table 2, the recoveries of the water samples were in the range of 98.35–105.30% for HQ and 95.40–102.20% for CC. The satisfactory results demonstrate the feasibility of using the TEIEP for the on-site monitoring of HQ and CC in environmental water samples.
Table 2 Determination of HQ and CC in tap water and river water (n = 3)
| Sample |
Added (μM) |
Found (μM) |
Recovery (%) |
RSD (%) |
| HQ |
CC |
HQ |
CC |
HQ |
CC |
HQ |
CC |
| Tap water |
10.00 |
10.00 |
10.48 |
9.54 |
104.80 |
95.40 |
2.52 |
2.34 |
| 20.00 |
20.00 |
19.67 |
20.29 |
98.35 |
101.45 |
2.43 |
1.15 |
| 30.00 |
30.00 |
30.93 |
29.13 |
103.10 |
97.10 |
4.46 |
2.36 |
| River water |
10.00 |
10.00 |
10.53 |
10.22 |
105.30 |
102.20 |
2.81 |
3.62 |
| 20.00 |
20.00 |
20.95 |
20.28 |
104.75 |
101.40 |
2.57 |
0.87 |
| 30.00 |
30.00 |
29.88 |
30.29 |
99.60 |
100.97 |
1.16 |
0.67 |
4. Conclusion
In this work, we successfully established a novel three-electrode integrated electrochemical platform (TEIEP) for the determination of dihydroxybenzene isomers. Three electrodes, including NPG as the working electrode, Pt as the counter electrode, and nanoporous Ag/AgCl as the reference electrode, were integrated onto the plane of the micro-device by simple electrochemical methods without complex operations. Due to the remarkable catalytic activity of NPG, the TEIEP exhibits high selectivity and sensitivity towards HQ and CC determination with a remarkable separation of the peaks when they coexist. In addition, the obtained TEIEP exhibited superb anti-interference ability, satisfactory reproducibility and stability, and excellent performance in real water sample analysis during the detection of HQ and CC. In summary, the novel TEIEP can provide a promising structure and material design for a micro-device and meaningful application for the future monitoring of water quality.
Conflicts of interest
There are no conflicts to declare.
Acknowledgements
Dr J. Zhao and G. Cui gratefully acknowledge the financial support by National Natural Science Foundation of China (51271205, 50801070, 51571093), “Project of Science and Technology Plan” by Qingyuan city (DZXQY052, 2018C005, 2019A026), Project of results transformation achievement fund by Sun Yat-sen University (31000-18843232), and “Tian'e Plan” by Huizhou city (20170220011822281, 20170220085037390).
References
- L. A. Alshahrani, L. Miao, Y. Zhang, S. Cheng, P. Sathishkumar, B. Saravanakumar, J. Nan and F. L. Gu, Sensors, 2019, 19, 2289 CrossRef CAS.
- S. Meng, Y. Hong, Z. Dai, W. Huang and X. Dong, ACS Appl. Mater. Interfaces, 2017, 9, 12453–12460 CrossRef CAS.
- C. Rajkumar, B. Thirumalraj, S. Chen, P. Veerakumar, K. Lin and K. Lin, Microchim. Acta, 2018, 185, 395 CrossRef.
- M. Zhang, J. Ye, P. Fang, Z. Zhang, C. Wang and G. Wu, Electrochim. Acta, 2019, 317, 618–627 CrossRef CAS.
- T. Xie, Q. Liu, Y. Shi and Q. Liu, J. Chromatogr. A, 2006, 1109, 317–321 CrossRef CAS.
- P. Nagaraja, R. A. Vasantha and K. R. Sunitha, Talanta, 2001, 55, 1039–1046 CrossRef CAS.
- G. Marrubini, E. Calleri, T. Coccini, A. F. Castoldi and L. Manzo, Chromatographia, 2005, 62, 25–31 CrossRef CAS.
- H. Cui, Q. Zhang, A. Myint, X. Ge and L. Liu, J. Photochem. Photobiol., A, 2006, 181, 238–245 CrossRef CAS.
- M. F. Pistonesi, M. S. Di Nezio, M. E. Centurión, M. E. Palomeque, A. G. Lista and B. S. Fernández Band, Talanta, 2006, 69, 1265–1268 CrossRef CAS.
- Y. Qi, Y. Cao, X. Meng, J. Cao, X. Li, Q. Hao and W. Lei, Sens. Actuators, B, 2019, 279, 170–176 CrossRef CAS.
- M. A. Ghanem, Electrochem. Commun., 2007, 9, 2501–2506 CrossRef CAS.
- G. H. Ribeiro, L. M. Vilarinho, T. S. Ramos, A. L. Bogado and L. R. Dinelli, Electrochim. Acta, 2015, 176, 394–401 CrossRef CAS.
- Y. Yang, Q. Wang, W. Qiu, H. Guo and F. Gao, J. Phys. Chem. C, 2016, 120, 9794–9803 CrossRef CAS.
- S. Li, C. Qian, K. Wang, B. Hua, F. Wang, Z. Sheng and X. Xia, Sens. Actuators, B, 2012, 174, 441–448 CrossRef CAS.
- A. Diouf, N. El Bari and B. Bouchikhi, Talanta, 2020, 209, 120577 CrossRef CAS.
- R. N. Goyal, V. K. Gupta, M. Oyama and N. Bachheti, Electrochem. Commun., 2005, 7, 803–807 CrossRef CAS.
- L. Chu, L. Han and X. Zhang, J. Appl. Electrochem., 2011, 41, 687–694 CrossRef CAS.
- D. H. Deng, S. J. Li, M. J. Zhang, X. N. Liu, M. M. Zhao and L. Liu, Anal. Methods, 2013, 5, 2536–2542 RSC.
- Y. H. Huang, J. H. Chen, L. J. Ling, Z. B. Su, X. Sun, S. R. Hu, W. Weng, Y. Huang, W. B. Wu and Y. S. He, Analyst, 2015, 140, 7939–7947 RSC.
- S. Palanisamy, C. Karuppiah, S. M. Chen, K. Muthupandi, R. Emmanuel, P. Prakash, M. S. Elshikh, M. Ajmal Ali and F. M. A. Al-Hemaid, Electroanalysis, 2015, 27, 1144–1151 CrossRef CAS.
- B. S. Takale, M. Bao and Y. Yamamoto, Org. Biomol. Chem., 2014, 12, 2005–2027 RSC.
- W. Li, X. Yue, C. Guo, J. Lv, S. Liu, Y. Zhang and J. Xu, Appl. Surf. Sci., 2015, 335, 23–28 CrossRef CAS.
- T. Fujita, P. Guan, K. McKenna, X. Lang, A. Hirata, L. Zhang, T. Tokunaga, S. Arai, Y. Yamamoto, N. Tanaka, Y. Ishikawa, N. Asao, Y. Yamamoto, J. Erlebacher and M. Chen, Nat. Mater., 2012, 11, 775–780 CrossRef CAS.
- S. H. Kim, Curr. Appl. Phys., 2018, 18, 810–818 CrossRef.
- A. Wichmann, A. Wittstock, K. Frank, M. M. Biener, B. Neumann, L. Mädler, J. Biener, A. Rosenauer and M. Bäumer, ChemCatChem, 2013, 5, 2037–2043 CrossRef CAS.
- X. Ke, Z. Li, L. Gan, J. Zhao, G. Cui, W. Kellogg, D. Matera, D. Higgins and G. Wu, Electrochim. Acta, 2015, 170, 337–342 CrossRef CAS.
- M. N. Hossain, Z. Liu, J. Wen and A. Chen, Appl. Catal., B, 2018, 236, 483–489 CrossRef CAS.
- A. J. Welch, J. S. Duchene, G. Tagliabue, A. Davoyan, W. H. Cheng and H. A. Atwater, ACS Appl. Energy Mater., 2019, 2, 164–170 CrossRef CAS.
- Y. Xu, X. Ke, C. Yu, S. Liu, J. Zhao, G. Cui, D. Higgins, Z. Chen, Q. Li and G. Wu, Nanotechnology, 2014, 25, 445602 CrossRef.
- G. Fan, P. Sun, J. Zhao, D. Han, L. Niu and G. Cui, RSC Adv., 2019, 9, 10465–10472 RSC.
- X. Jia, S. Dong and E. Wang, Biosens. Bioelectron., 2016, 76, 80–90 CrossRef CAS.
- D. Li, J. Li, X. Jia, Y. Xia, X. Zhang and E. Wang, Anal. Chim. Acta, 2013, 804, 98–103 CrossRef CAS.
- J. Yin, W. Gao, Z. Zhang, Y. Mai, A. Luan, H. Jin, J. Jian and Q. Jin, Electrochim. Acta, 2020, 335, 135660 CrossRef CAS.
- A. G. Ayankojo, J. Reut, V. Ciocan, A. Öpik and V. Syritski, Talanta, 2020, 209, 120502 CrossRef CAS.
- A. Huang, H. Li and D. Xu, J. Electroanal. Chem., 2019, 848, 113189 CrossRef CAS.
- K. Hsieh, B. S. Ferguson, M. Eisenstein, K. W. Plaxco and H. T. Soh, Acc. Chem. Res., 2015, 48, 911–920 CrossRef CAS.
- A. Tsopela, A. Lale, E. Vanhove, O. Reynes, I. Séguy, P. Temple-Boyer, P. Juneau, R. Izquierdo and J. Launay, Biosens. Bioelectron., 2014, 61, 290–297 CrossRef CAS.
- O. Amor-Gutiérrez, E. Costa Rama, A. Costa-García and M. T. Fernández-Abedul, Biosens. Bioelectron., 2017, 93, 40–45 CrossRef.
- J. Prasek, L. Trnkova, I. Gablech, P. Businova, J. Drbohlavova, J. Chomoucka, V. Adam, R. Kizek and J. Hubalek, Int. J. Electrochem. Sci., 2012, 7, 1785–1801 CAS.
- W. Yang, X. Wei, A. Fraiwan, C. G. Coogan, H. Lee and S. Choi, Sens. Actuators, B, 2016, 226, 191–195 CrossRef CAS.
- P. J. Brewer, D. Stoica and R. J. C. Brown, Sensors, 2011, 11, 8072–8084 CrossRef CAS.
- X. Ke, Y. Xu, C. Yu, J. Zhao, G. Cui, D. Higgins, Z. Chen, Q. Li, H. Xu and G. Wu, J. Mater. Chem. A, 2014, 2, 16474–16479 RSC.
- M. D. Scanlon, U. Salaj-Kosla, S. Belochapkine, D. MacAodha, D. Leech, Y. Ding and E. Magner, Langmuir, 2012, 28, 2251–2261 CrossRef CAS.
- A. Sukeri, A. S. Lima and M. Bertotti, Microchem. J., 2017, 133, 149–154 CrossRef CAS.
- A. Sukeri and L. P. Herna, Phys. Chem. Chem. Phys., 2015, 17, 28510–28514 RSC.
- C. Fisica and U. Milano, Pure Appl. Chem., 1991, 63, 711–734 Search PubMed.
- L. A. Alshahrani, L. Liu, P. Sathish Kumar, J. Nan and F. L. Gu, J. Electroanal. Chem., 2018, 815, 68–75 CrossRef CAS.
- J. Zai, Y. Fu, X. Zai, H. Ji, A. Liu and F. Chai, Ionics, 2017, 23, 2213–2219 CrossRef CAS.
- M. Jiang, P. Sun, J. Zhao, L. Huo and G. Cui, Sensors, 2019, 19, 5055 CrossRef CAS.
- H. Zhang, Y. Huang, S. Hu, Q. Huang and C. Wei, Electrochim. Acta, 2015, 176, 28–35 CrossRef CAS.
- S. Ramaraj, S. Mani, S. Chen, T. Kokulnathan, B. Lou, M. A. Ali, A. A. Hatamleh and F. M. A. Al-Hemaid, J. Colloid Interface Sci., 2018, 514, 59–69 CrossRef CAS.
- H. Yang, S. Li, H. Yu, F. Zheng, L. Lin, J. Chen, Y. Li and Y. Lin, Nanoscale, 2019, 11, 8950–8958 RSC.
- C. Wei, Q. Huang, S. Hu, H. Zhang, W. Zhang, Z. Wang, M. Zhu, P. Dai and L. Huang, Electrochim. Acta, 2014, 149, 237–244 CrossRef CAS.
-
A. J. Bard and L. R. Faulkner, Electrochemical Methods, Wiley, New York, 2nd edn, 2011 Search PubMed.
- F. C. Anson, Anal. Chem., 1964, 36, 932–934 CrossRef CAS.
- L. Xiao, J. Yin, Y. Li, Q. Yuan, H. Shen, G. Hu and W. Gan, Analyst, 2016, 141, 5555–5562 RSC.
- T.-W. Chen, Int. J. Electrochem. Sci., 2019, 14, 7037–7046 CrossRef CAS.
- X. Ma, Z. Liu, C. Qiu, T. Chen and H. Ma, Microchim. Acta, 2013, 180, 461–468 CrossRef CAS.
- S. Erogul, S. Z. Bas, M. Ozmen and S. Yildiz, Electrochim. Acta, 2015, 186, 302–313 CrossRef CAS.
- Y. Wang, Y. Xiong, J. Qu, J. Qu and S. Li, Sens. Actuators, B, 2016, 223, 501–508 CrossRef CAS.
- D. Cheng and X. Kan, J. Electroanal. Chem., 2020, 857, 113741 CrossRef CAS.
- H. Ershadifar, M. Akhond and G. Absalan, IEEE Sens. J., 2017, 17, 5030–5037 CAS.
- M. Nazari, S. Kashanian, P. Moradipour and N. Maleki, J. Electroanal. Chem., 2018, 812, 122–131 CrossRef CAS.
- L. Tang, Y. Zhou, G. Zeng, Z. Li, Y. Liu, Y. Zhang, G. Chen, G. Yang and M. Wu, Analyst, 2013, 138, 3552–3560 RSC.
- Y. Chen, X. Liu, S. Zhang, L. Yang, M. Liu, Y. Zhang and S. Yao, Electrochim. Acta, 2017, 231, 677–685 CrossRef CAS.
Footnote |
| † Electronic supplementary information (ESI) available. See DOI: 10.1039/d0an01746a |
|
| This journal is © The Royal Society of Chemistry 2021 |
Click here to see how this site uses Cookies. View our privacy policy here.  *a,
Dongxue
Han
*b,
Shifan
Zhao
 *cd,
Rui
Zhu
cd and
Guofeng
Cui
 cd
cd

![[thin space (1/6-em)]](https://www.rsc.org/images/entities/char_2009.gif) :
:![[thin space (1/6-em)]](https://www.rsc.org/images/entities/char_2009.gif) 1 in the prepared Au–Sn alloy film. Moreover, there was no signal of the Sn element in NPG, indicating the complete removal of Sn from the Au–Sn alloy via the electrochemical dealloying process. Fig. 2b shows the XRD patterns of the as-prepared Au–Sn and NPG. The results demonstrate that the as-prepared Au–Sn alloy film is composed of an AuSn homogeneous phase, which is in agreement with the EDS analysis. The diffraction peaks located at 23.8°, 28.8°, 40.6°, 41.8°, 48.6°, 51.5°, 59.7°, 66.0°, 68.4°, 75.4°, 76.2°, and 82.9° correspond to the (100), (101), (102), (110), (200), (201), (202), (210), (211), (212), (300), and (114) crystal planes of AuSn (JCPDS No. 08-0463), respectively. The peaks of the NPG film at 38.3°, 44.5°, 64.7°, 77.8°, and 81.9° can be indexed to the diffractions from the (111), (200), (220), (311), and (222) planes of face-centered cubic Au (JCPDS No. 04-0784), respectively. These results further demonstrate the successful construction of NPG structures.
1 in the prepared Au–Sn alloy film. Moreover, there was no signal of the Sn element in NPG, indicating the complete removal of Sn from the Au–Sn alloy via the electrochemical dealloying process. Fig. 2b shows the XRD patterns of the as-prepared Au–Sn and NPG. The results demonstrate that the as-prepared Au–Sn alloy film is composed of an AuSn homogeneous phase, which is in agreement with the EDS analysis. The diffraction peaks located at 23.8°, 28.8°, 40.6°, 41.8°, 48.6°, 51.5°, 59.7°, 66.0°, 68.4°, 75.4°, 76.2°, and 82.9° correspond to the (100), (101), (102), (110), (200), (201), (202), (210), (211), (212), (300), and (114) crystal planes of AuSn (JCPDS No. 08-0463), respectively. The peaks of the NPG film at 38.3°, 44.5°, 64.7°, 77.8°, and 81.9° can be indexed to the diffractions from the (111), (200), (220), (311), and (222) planes of face-centered cubic Au (JCPDS No. 04-0784), respectively. These results further demonstrate the successful construction of NPG structures.

![[thin space (1/6-em)]](https://www.rsc.org/images/entities/char_2009.gif) lg
lg![[thin space (1/6-em)]](https://www.rsc.org/images/entities/char_2009.gif) CCl−
CCl−


