
 Open Access Article
 This Open Access Article is licensed under a Creative Commons Attribution-Non Commercial 3.0 Unported Licence
The cyanobacterial lectin, microvirin-N, enhances the specificity and sensitivity of lipoarabinomannan-based TB diagnostic tests†
Megan
van der Horst‡
 a,
Leshern
Karamchand‡
b,
Westley S.
Bauer‡
a,
Andrew J. M.
Nel
b,
Jonathan M.
Blackburn
*b and
David W.
Wright
*a
a,
Leshern
Karamchand‡
b,
Westley S.
Bauer‡
a,
Andrew J. M.
Nel
b,
Jonathan M.
Blackburn
*b and
David W.
Wright
*a
aDepartment of Chemistry, Vanderbilt University, Station B 351822, Nashville, TN 37235, USA. E-mail: david.wright@vanderbilt.edu
bUniversity of Cape Town, Faculty of Health Sciences, Institute of Infectious Disease and Molecular Medicine; Department of Integrative Biomedical Sciences, Anzio Road, Observatory, 7925, South Africa. E-mail: jonathan.blackburn@uct.ac.za
First published on 24th December 2020
Abstract
Tuberculosis (TB) is one of the top ten causes of death globally, despite being treatable. The eradication of TB disease requires, amongst others, diagnostic tests with high specificity and sensitivity that will work at the point of care (POC) in low-resource settings. The TB surface glycolipid antigen, mannose-capped lipoarabinomannan (ManLAM) currently serves as the only POC molecular diagnostic biomarker suitable for use in low cost immunoassays. Here, we demonstrate the high affinity and exceptional specificity of microvirin-N (MVN), a 14.3 kDa cyanobacterial lectin, toward H37Rv TB ManLAM and utilize it to develop a novel on-bead ELISA. MVN binds to ManLAM with sub-picomolar binding affinity, but does not bind to other variants of LAM expressed by non-pathogenic mycobacteria – a level of binding specificity and affinity that current commercially available anti-LAM antibodies cannot achieve. An on-bead ELISA was subsequently developed using MVN-functionalized magnetic beads which allows for the specific capture of ManLAM from human urine with a limit of detection (LOD) of 1.14 ng mL−1 and no cross-reactivity when tested with PILAM, a variant of LAM found on non-pathogenic mycobacteria.
Introduction
Tuberculosis (TB) remains the world's leading deadliest infectious disease despite being treatable.1 In 2018 alone, the global burden of TB was estimated to be 10 million incident cases and over 1.4 million deaths.1 Yet, with early diagnosis and appropriate treatment, most deaths from TB can be prevented.2 One of the contributing factors to this high mortality rate is that the causative agent, Mycobacterium tuberculosis (M. tb), is the most common opportunistic infection in HIV-positive patients.3 People infected with HIV are approximately 21 times more likely to develop active TB and have a 2 times higher fatality rate compared to people without HIV.3,4 Reasons for comparatively poor outcomes for HIV-positive TB patients stem from late diagnosis and delays in starting antiretroviral therapy (ART) and/or TB treatment.4 In fact, the world fails to detect 36% of the estimated new cases of TB per year.1 Conventional TB diagnostic tests rely on resource-intensive nucleic acid amplification tests, such as the Xpert MTB/RIF test, or technologies that lack specificity and sensitivity, such as sputum smear microscopy and chest radiography. Moreover, the diagnostic accuracy of these techniques is further impaired in patients with HIV coinfection, many of whom cannot produce the required sputum sample.3,5 Globally, the use of biomarker-based rapid diagnostic testing is increasing and many countries are phasing out the use of smear microscopy and chest radiography. In response to the high TB mortality in HIV-positive patients, the World Health Organization (WHO) approved the Alere Determine TB LAM Ag lateral flow assay (LFA) as a point-of-care (POC) test for people infected with HIV and with very low CD4 counts (<100 CD4 cells per μL).1The Alere LFA detects lipoarabinomannan (LAM), a mycobacterial cell surface glycolipid that is shed from metabolically active or degenerating bacterial cells.6,7 In addition to the Alere LFA, LAM has also been the target of several other immunological tests including enzyme linked immunosorbent assays (ELISAs) in both plate and dipstick formats.8,9 Further, the diagnostic potential of LAM has led it to become the current gold standard biomarker for POC TB diagnostic tests. LAM is shed from the surface of the mycobacterium into the bloodstream and, after filtration by the kidneys, secreted into urine where it can be detected.10 The concentration of LAM in urine of TB-infected, HIV-negative individuals varies from approximately 10 to 1000 pg mL−1.11 Higher LAM concentrations are reported in HIV-positive individuals, up to 100 ng mL−1, due to a higher overall bacillary load.11 The rapid adoption of biomarker-based LAM testing in HIV endemic areas is expected to help ensure early diagnosis and overcome challenges with diagnosing TB in people with low CD4 counts.
However, implementation of these tests has been limited largely due to their variable sensitivity and specificity. Results from clinical studies and a meta-analysis present pooled sensitivities between 34% and 60% depending on the reference standard.12 Increased sensitivity was correlated to the severity of patient immune suppression as the concentration of LAM in urine is thought to depend on the patient's immunocompetence, reflecting increased bacillary load, dissemination of M. tb, and potentially also renal involvement in TB disease in such patients.12 Similarly, although most studies have reported high positive predictive values, there remains unexplained variability in specificity, with individual studies reporting values ranging from 79% to 100%.12 While poor specificity may reflect the shortcomings of individual assays, it is also possible that false-positive results are due to cross-reactivity with LAM molecules expressed by non-tuberculous mycobacteria (NTM), or related bacteria of the Actinomycetales order.7,13,14
The LAM antigen has three structural domains: (1) a mannosyl-phosphatidyl-myo-inositol linker, (2) a polysaccharide backbone composed of a D-mannan core and D-arabinan branches, and (3) a capping motif on the terminal ends of the D-arabinan branches.15 The linker and backbone are conserved in all LAM variants, while the capping motif differs depending on the species of mycobacterium.15 There are three classifications of LAM based on variations in their capping motif: (1) ManLAM is capped with α-(1,2)-linked di-mannosyl residues (Manα-(1,2)-Man), (2) PILAM is capped with phospho-myo-inositol, and (3) AraLAM is devoid of capping motifs.15,16 Throughout this manuscript, the specific variant of LAM (ManLAM, PILAM, or AraLAM) will be used where applicable and LAM will be used generally to discuss conserved features, shared properties, and non-specific interactions. ManLAM is unique to the surface envelope of slow-growing, pathogenic mycobacteria, such as M. tb, M. bovis and M. leprae (Fig. 1). M. tb and M. bovis ManLAM express the highest number of di-mannosyl capping residues (seven to nine per ManLAM molecule), whereas M. leprae ManLAM averages only one di-mannosyl cap per ManLAM molecule.17,18 This makes the high abundance of di-mannosyl caps on M. tb ManLAM an especially attractive target for new capture and detection agents.19 However, current commercially available LAM detection tests use anti-LAM antibodies that are incapable of distinguishing between the variants of LAM, leading to cross-reactivity and high false-positive detection rates.20 Recently, new antibodies have been developed that are specific for ManLAM, underscoring the need for ManLAM-specific capture agents to improve the specificity of M. tb diagnostic assays.11,19,21,22
 | ||
| Fig. 1 Cross-sectional schematic representation of the mycobacterial cell envelope. The cell envelope of mycobacteria comprises four main layers: (i) an innermost plasma membrane, (ii) a complex of peptidoglycan and arabinogalactan, (iii) a mycobacterial outer membrane (MOM), and (iv) an external capsular layer. The plasma membrane (approximately 7 nm thick) consists of standard membrane lipids such as glycerophospholipids, including phosphatidylinositol mannosides (PIMs), lipomannans (LMs), and lipoarabinomannans (LAMs). Slow-growing, pathogenic mycobacteria, such as Mycobacterium tuberculosis, also express mannose-capped LAM (ManLAM) in which the arabinan branch termini are capped with Manα(1-2)Man linkages. In contrast, fast-growing, non-pathogenic mycobacteria, such as Mycobacterium smegmatis, express PILAM in which the arabinan branch termini are capped with phospho-myo-inositol. A periplasmic space (14 nm) separates the plasma membrane from the innermost layer of the cell wall, the peptidoglycan layer, which serves to maintain cell shape and reinforce the plasma membrane against the osmotic pressure of the cytoplasm. The peptidoglycan layer is composed of linear strands of alternating N-acetyl-glucosamine (GlcNAc) and N-acetyl-muramic acid (MurNAc) sugars that are crosslinked together by peptides into honeycomb-like layers. The peptidoglycan is in turn crosslinked to the middle layer of the cell wall, the arabinogalactan polymer, which is composed of branched arabinose chains and galactose sugars. The mycobacterial outer membrane (MOM) is composed of (a) an inner leaflet of mycolic acids esterified to the underlying arabinogalactan layer, and (b) an outer leaflet composed of both free mycolic acids, and mycolic acids covalently linked to trehalose sugar as either trehalose monomycolate (TMM) or trehalose dimycolate (TDM) variants. The outer leaflet of the mycomembrane also consists of PIMs, LMs, LAMs, and secreted proteins. Porin transporter proteins traverse the entire width of the MOM. Notably, the thickness of the MOM is also similar to that of the plasma membrane (approximately 7–8 nm) despite being composed of very long chain (C60–C90) mycolic acids. The external capsular layer (approximately 35 nm) mainly consists of neutral polysaccharides including a glycogen-like α-glucan and lower amounts of arabinomannan (AM), capsular proteins, and low levels of glycopeptidolipids (GPLs) and free triacylglyercols (TAGs). | ||
In this study, we expressed microvirin-N (MVN), a 14.3 kDa cyanobacterial lectin that specifically binds the Manα-(1,2)-Man di-mannosyl caps of ManLAM with sub-picomolar binding affinity and demonstrate its utility in ManLAM TB diagnostic tests.23–25 By developing a “sandwich” pairing of MVN with a monoclonal antibody that binds an orthogonal linear hexa-arabinan (Ara6) motif located in the branches of LAM, we developed a highly specific, sensitive, and stable diagnostic test for M. tb ManLAM. To the best of our knowledge, this is the first study to demonstrate the use of a lectin-based molecular recognition element to selectively capture and detect ManLAM for the development of a TB diagnostic test.
Experimental
Expression and purification of MVN
Competent E. coli BL21-DE3 bacteria were transformed with the MVN-pET15b plasmid (190 ng plasmid per 100 μL competent bacteria) by heat shock. The plasmid-transformed bacteria were plated onto LB Agar plates containing ampicillin (100 μg mL−1). Colonies were selected from the plates and stored as a glycerol stock. A 50 mL aliquot of LB medium containing 100 μg mL−1 ampicillin was inoculated with MVN-pET15b transformed BL21-DE3 bacteria as a starter culture, and allowed to grow at 37 °C, 22 rpm overnight (∼16–18 hours). 1 L sterilized TB Broth was inoculated with overnight starter culture until the OD600 reading reached ∼0.1. Ampicillin was then added to a final concentration of 100 μg mL−1. The culture was allowed to grow at 37 °C, 22 rpm until the OD600 reading reached ∼0.6–0.8. The culture was cooled to 18 °C and isopropyl β-D-1-thiogalactopyranoside (IPTG) was added to final concentration of 1 mM. Cultures were further incubated overnight (∼16–18 hours) at 18 °C, 22 rpm. Bacterial cells were harvested via centrifugation and either used fresh or stored frozen (Fig. S1†).Cell pellets were resuspended in 150 mL phosphate buffer (25 mM NaH2PO4, 500 mM NaCl, 10% glycerol, pH 8) containing 2 μg mL−1 lysozyme (Sigma: Cat. no. L6876), 1 mL protease cocktail (Sigma: Cat. no. P8849), and powdered DNase I (Sigma: Cat. no. DN25). The cell suspension was then passed through an Emulsiflex-C3 High Pressure Homogenizer (Avestin) three times maintaining lysis pressure at 15![[thin space (1/6-em)]](https://www.rsc.org/images/entities/char_2009.gif) 000 psi. The lysate was centrifuged and the resulting supernatant was clarified by filtering through a 0.22 μm filter. The clarified lysate was loaded onto a 5 mL HisTrap HP column (GE: 17-5248-02) and purified by FPLC. MVN was eluted with a linear imidazole gradient from 0–500 mM (Fig. S2†). Fractions containing MVN were pooled and dialyzed against PBS overnight at 4 °C. Protein concentration was determined by quantification gel – Invitrogen NuPAGE 4–12% gradient gel run in 1× MES buffer with densitometry performed using the Image Studio Lite Version 5.2 software (Fig. S3†).
000 psi. The lysate was centrifuged and the resulting supernatant was clarified by filtering through a 0.22 μm filter. The clarified lysate was loaded onto a 5 mL HisTrap HP column (GE: 17-5248-02) and purified by FPLC. MVN was eluted with a linear imidazole gradient from 0–500 mM (Fig. S2†). Fractions containing MVN were pooled and dialyzed against PBS overnight at 4 °C. Protein concentration was determined by quantification gel – Invitrogen NuPAGE 4–12% gradient gel run in 1× MES buffer with densitometry performed using the Image Studio Lite Version 5.2 software (Fig. S3†).
Bioconjugation
MVN (1.36 mg mL−1) was conjugated to biotin using a 20× molar equivalence of EZ-Link NHS-PEG4-Biotin (Thermo Scientific: Cat. no. 21329) in DI water. Following a 30-minute incubation step at room temperature, the MVN–biotin conjugate was purified from excess biotin reagent using a 7k MWCO Zeba desalting column (Thermo Scientific: Cat. no. 89883). The concentration of the resulting MVN–biotin conjugate was determined by micro-volume analysis using a BioTek Take3 plate on a BioTek Synergy H4 plate reader with the lysozyme setting.Anti-LAM antibodies Ab25, Ab28, and Ab170 were procured from the Foundation for Innovative New Diagnostics (FIND). FIND Ab25, Ab28, and Ab170 were conjugated to biotin with a 20× molar equivalence of EZ-Link NHS-PEG4-Biotin (Thermo Scientific: Cat. no. 21329) in DI water. Following a 30-minute incubation step at room temperature, the antibody–biotin conjugates were purified from excess biotin reagent using 7k MWCO Zeba desalting columns (Thermo Scientific: Cat. no. 89883). The concentration of the resulting antibody–biotin conjugates was determined by micro-volume analysis using a BioTek Take3 plate with the IgG setting.
FIND Ab28 was conjugated to horseradish peroxidase (HRP) using EZ-Link Plus Activated Peroxidase (Thermo Scientific: Cat. no. 31489). The single-use tube was dissolved in DI H2O and added to the antibody, followed by sodium cyanoborohydride. The reaction was incubated for 1 hour at room temperature. Quenching buffer was added and allowed to react for 15 minutes. The resulting antibody-conjugate was transferred to an Amicon Ultra-0.5 mL Centrifugal Filter Ultracel – 100 K spin filter (Millipore Sigma: Cat. no. UFC510024) and centrifuged for 10 minutes at 14000g. The spin filters were washed three times with PBS then inverted into new collection tubes and centrifuged for 2 minutes at 1000g. The concentration of the antibody-conjugate was determined by microvolume analysis using a BioTek Take3 plate with the IgG setting.
Binding characterization of molecular recognition elements by bio-layer interferometry
Anti-LAM antibodies CS35 and CS40 were procured from the Biodefense and Emerging Infections Research Resources Repository (BEI Resources). MVN, Ab25, Ab28, and Ab170 were conjugated to biotin as described above. Following the conjugation, the molecular recognition elements were subjected to binding experiments on the ForteBio Octet RED96 to determine binding affinity to M. tb H37Rv ManLAM, M. leprae ManLAM, and M. smegmatis PILAM.18 Dip and Read Streptavidin biosensors (ForteBio: Cat. no. 18-5019) were used for the binding experiments with biotinylated MVN, Ab25, Ab28, and Ab170 and Dip and Read Anti-Mouse Fc capture biosensors (ForteBio: Cat. no. 18-5088) were used for the binding experiments with CS35 and CS40.The biosensors were first introduced to a biosensor buffer (0.1% BSA (Fisher: BioReagents: Cat. no. BP9706100), 0.02% Tween 20 in PBS (Fisher BioReagents: Cat. no: BP337100) for a 300 seconds equilibration step. The biosensors were then transferred to wells containing MVN–biotin (0.125 μg mL−1) or antibody–biotin (0.5 μg mL−1) for 400 seconds. The loaded biosensors were moved to wells containing biosensor buffer for a 60 seconds baseline step and then transferred to sample wells containing a two-fold serially diluted range of M. tb H37Rv ManLAM with a buffer reference well for a 400 seconds association step. The two-fold serial dilution began at an initial concentration of ManLAM such that the starting concentration of ManLAM was at least 10× higher than the expected KD and the lowest concentration was 2× lower than the expected KD.19 Lastly, the biosensors were moved back to the baseline buffer wells for a 900 seconds dissociation step. The same procedure was used with Dip and Read Ni-NTA biosensors (ForteBio: Cat. no. 18-5101) to determine the binding affinity of MVN-His6, except the biosensor buffer was 0.02% Tween 20 in PBS and MVN was loaded onto the biosensor at 0.5 μg mL−1. Inside the ForteBio software, a global 1:1 fit model was selected to derive the kinetic (kon, koff) and equilibrium (KD) data.
Stability test of MVN by bio-layer interferometry
MVN was stored at either 4 °C or RT. Repeated binding experiments at set time points were performed on MVN to determine changes in its binding affinity toward M. tb H37Rv ManLAM over time as a representation of stability. For the batch stored at 4 °C, measurements were made on days 0, 1, 2, 3, 4, 8, 12 (excluded by outlier test), 16, 22, 29, 36, 43, 49 (measured twice using two batches of ManLAM and averaged), 63, 77, 91, and 105. For the batch stored at RT, aliquots were moved from the freezer to RT on days 0, 1, 2, 3, 4, 5, 6, 8, 10, 12, and 14; binding experiments were performed with each aliquot on the last day. The binding experiments were performed in the same manner as before.Binding pair evaluation by bio-layer interferometry
The binding pair evaluation was run on the Octet RED96, equipped with Dip and Read Ni-NTA (ForteBio: Cat. no. 18-5101). The biosensors were first introduced to a biosensor buffer (0.02% Tween 20 in PBS) for a 300 seconds equilibration step, followed by a loading step where the biosensors were transferred to wells containing 0.7 μg mL−1 MVN-His6 for 400 seconds. The loaded biosensors were transferred to wells containing biosensor buffer for a 60 seconds baseline step and then transferred to sample wells containing 0.325 μg mL−1M. tb H37Rv ManLAM for a 400 seconds association step. The biosensors were returned to the baseline wells for a 60 seconds baseline step and then transferred to wells containing 12 μg mL−1 non-conjugated Ab28 for another 400 seconds association step. Lastly, the biosensors were returned to the baseline buffer wells for a 900 seconds dissociation step.On-bead ELISA (OB-ELISA)
First, Dynabeads MyOne™ Streptavidin T1 beads (Invitrogen: Cat. no. 65601) were functionalized with MVN–biotin conjugate. MVN was conjugated to biotin as above. The streptavidin beads were washed three times with PBS using a magnetic separation rack (Invitrogen: Cat. no CS15000). MVN–biotin conjugate was added at a ratio of either 60 μg MVN per 100 μL beads (Bead 1) or 30 μg MVN per 100 μL beads (Bead 2). The resulting mixture was incubated for 30 minutes at room temperature. The beads were then washed three times with PBS and blocked with excess D-biotin in PBS for 30 minutes. Lastly, the beads were washed three times with PBS and re-suspended in PBST (PBS, 0.1% Tween 20).Solutions (100 μL) of ManLAM or PILAM in 0.1% BSA PBST or pooled human urine (Innovative Research: Cat. no. IRHUURE1000ML) were placed in a clear flat-bottom 96-well plate (Fig. S4†). A 100 μL aliquot of 2 μg mL−1 Ab28 conjugated to HRP in 0.5% BSA PBST was then added to the wells. Lastly, 4 μL MVN-functionalized magnetic Dynabeads were added to each well and the plate was incubated on a shaker for 30 minutes. The beads were magnetically separated from the supernatant using a 96-well magnetic separation rack (EdgeBio: Cat. no. 57624) and washed three times with 200 μL PBST. A 100 μL aliquot of TMB One (Promega: Cat. no. G7431) was added to each well containing beads and the plate was incubated on a shaker for 10 minutes while protected from light. Lastly, 100 μL 2 M H2SO4 was added to each well to stop the reaction and the signal was measured by absorbance at 450 nm to the thousandths place on a microplate reader. When larger volumes of urine were tested, the entire procedure was scaled accordingly. Informed consent was obtained for any experimentation with human subjects.
The absorbance values were doubled to account for a 1:1 dilution. For both ManLAM and PILAM, absorbance vs. concentration was plotted. The average signal of the blank was subtracted to correct for background. The limit of detections was calculated as 3SDblank per slope. Intra-assay variation was determined by calculating the average relative standard deviation of each triplicate measurement on the same plate.
Antibody-based plate ELISA
Solutions (100 μL) of 4 μg mL−1 Ab170 capture antibody were added to an Immulon 2 HB clear flat-bottomed 96-well plate (ThermoFisher: Cat. no. 3455) and allowed to incubate for 1 hour at room temperature. Wells were washed three times with 235 μL PBST (PBS, 0.1% Tween 20). 235 μL of 1.25% BSA PBST were added to the wells and allowed to incubate for 2 hours, followed by 3 washes with 235 μL PBST. Next, 100 μL of ManLAM or PILAM spiked into urine were added to the wells, and the plate was allowed to incubate for 2 hours, followed by 4 washes with 235 μL PBST. A solution (100 μL) of 0.5 μg mL−1 detection antibody Ab28 conjugated to HRP (conjugation described above) was added to the wells and allowed to incubate for 1 hour, followed by 5 washes with 235 μL PBST. A 100 μL aliquot of TMB One was added to each well and the plate was incubated on a shaker for 10 minutes while protected from light. Lastly, 100 μL 2 M H2SO4 was added to each well to stop the reaction and the signal was measured by absorbance at 450 nm on a microplate reader. For both ManLAM and PILAM, absorbance vs. concentration was plotted. The limit of detections was calculated as 3SDblank per slope.Alere LFAs
Alere LFAs were performed according to the manufacturer's instructions – 60 μL of ManLAM or PILAM spiked into urine was applied to the Alere LFAs (Lot no. 170423) in triplicate. After 25 minutes, the LFAs were read on the Qiagen ESEQuant LFR – Lateral Flow Reader to determine the test line area and visible test lines were noted.Results and discussion
New approaches for TB control and care are urgently needed. As accurate diagnosis is one of the cornerstones of TB control, POC diagnostic tests serve as the most practical tests to enable well-timed diagnosis, guide the appropriate treatment, and curb the transmission and unacceptably high number of deaths due to this otherwise curable disease.1,26 Conventional direct smear, bacterial culture and nucleic acid amplification tests, such as GeneXpert MTB/RIF, require biohazardous M. tb-infected sputum samples to yield a positive diagnosis of TB.26 Yet, it is difficult for many active TB patients to produce sputum samples, including those co-infected with HIV, diabetes patients, and children.26 Alternatively, urine analysis obviates the biohazards associated with sputum handling and can be easily collected from all patients.7,13 LAM is a particularly advantageous biomarker to detect in urine because it is heat stable and does not readily degrade over time.7 The sensitivity and specificity shortcomings associated with current urine-based LAM tests are the consequence of several parameters including the characteristics of the capture/detection reagents, condition of the urine sample, immune status of the patient, and the variable concentration of excreted LAM that is dependent on the manifestations of co-infected disease.13 Of these factors, the selection of the test-capture reagents is the only one that researchers can improve upon to enhance the detection rate of TB-positive patients.Current LAM detection tests employ either polyclonal or monoclonal antibodies. Polyclonal antibodies raised against LAM are more likely to recognize multiple antigenic epitopes compared to monoclonal antibodies but carry the risk of batch-to-batch variation and cross-reactivity.27 Although monoclonal antibodies (mAbs) target a single epitope, the majority of mAbs generated against LAM target the conserved D-arabinan branches and D-mannan polysaccharide backbone of the antigen.28 As previously mentioned, M. tb, as well as other slow-growing, pathogenic mycobacteria species, express ManLAM, whereas non-pathogenic mycobacteria, such as M. smegmatis and M. chelonae, express PILAM and AraLAM, respectively.15 Therefore, targeting the mannose caps that make ManLAM distinct would enhance the specificity of the diagnostic test. Recently, antibodies that exclusively target the unique Manα-(1,2)-Man and 5-methylthio-D-xylose (MTX) capping residues of ManLAM have been produced.11,19,21,22 However, the MTX capping residue is present in low abundance on M. tb ManLAM, typically only one MTX residue per ManLAM molecule, and may be a suboptimal moiety to target on M. tb ManLAM for diagnostic purposes.29
The discovery of MVN, a highly specific Manα-(1,2)-Man binding lectin, was reported in 2006 by Kehr et al.23 Since then, it has been investigated for anti-HIV-1 activity and as a neutralizing agent for hepatitis C viral infections.24,30,31 To evaluate the feasibility of MVN to selectively capture ManLAM for use in next generation TB diagnostic tests, MVN was subjected to bio-layer interferometry (BLI) experiments with procurable LAM variants. LAM antibodies procured from the BEI repository and FIND were also evaluated employing the same design of experiments. When comparing the quantitative binding data between MVN and commercially available anti-LAM antibodies, MVN exhibited the highest binding affinity with markedly improved specificity as it did not bind to PILAM (Table 1). No appreciable binding was found for either of the anti-LAM polyclonal antibody matrices. This could be caused by the immobilization of non-specific antibodies on the biosensor which would skew the global binding data. This observation further substantiates the argument that polyclonal antibodies are not ideal for employment in quality-controlled diagnostic tests.
| Dissociation constant (KD) to antigens | |||
|---|---|---|---|
| H37Rv M. tb ManLAM | M. leprae ManLAM | M. smegmatis PILAM | |
| N.B. – no binding observed. | |||
| MVN | <1 ± 9 pM | 74.4 ± 0.5 nM | N.B. |
| MVN–biotin | 1850 ± 13 pM | 78.6 ± 0.5 nM | N.B. |
| FIND Ab25 | 1320 ± 16 pM | 967 ± 11 pM | 817 ± 18 pM |
| FIND Ab28 | 16.5 ± 0.4 nM | 10.7 ± 0.14 nM | 5.76 ± 0.11 nM |
| FIND Ab170 | 636 ± 11 pM | 118 ± 2 pM | <1 ± 2 pM |
| CS35 mAb | <1 ± 110 pM | <1.0 ± 60 pM | <1 ± 80 pM |
| CS40 mAb | 8740 ± 60 pM | Not tested | 113 ± 0.8 nM |
| Anti-LAM polyclonal (rabbit) | N.B. | N.B. | N.B. |
| Anti-LAM polyclonal (guinea pig) | N.B. | N.B. | N.B. |
The selective capture of ManLAM with MVN affords the ability to discriminate between pathogenic and non-pathogenic mycobacteria, which is crucial to avoid subjecting non-TB infected individuals to long durations of anti-TB therapy that can cause a host of potential side effects. However, in addition to M. tb, other pathogenic mycobacterial species that express ManLAM, such as M. bovis and M. leprae, would also be detected by MVN.19 Coupling symptomatic investigation with a MVN-based diagnostic would allow medical staff to differentiate between pathogenic mycobacterial infections as most ManLAM-presenting pathogenic bacteria either cause cutaneous infection or pulmonary TB (lung infection).19 Mycobacteria that cause cutaneous infections, such as M. leprae, induce illness that can be differentiated from M. tb empirically based on signature skin sores or lesions; therefore, they can be readily diagnosed without the need for LAM tests.19 Additionally, it is unnecessary to differentiate between pulmonary TB causing species, such as M. bovis, because they have the same or very similar treatment strategies to M. tb infection.32 Hence, screening tests do not need to further differentiate between pathogenic mycobacteria infections to permit proper treatment.
After confirming the high affinity and specificity of MVN to ManLAM, the greater utility of this capture reagent in a diagnostic assay was explored. MVN has several advantageous biophysical properties; it was expressed with a N-terminal hexa-histidine affinity tag and has a single intrinsic lysine residue which lends itself to facile bioconjugation techniques. Conjugating biotin to this residue enables the immobilization of MVN to any streptavidin coated substrate.23,33 A PyMOL rendering of the MVN:Manα-(1,2)-Man crystal structure shows the location of the lysine residue and N-terminal hexa-histidine tag in proximity to the Manα-(1,2)-Man binding site (Fig. 2A).30
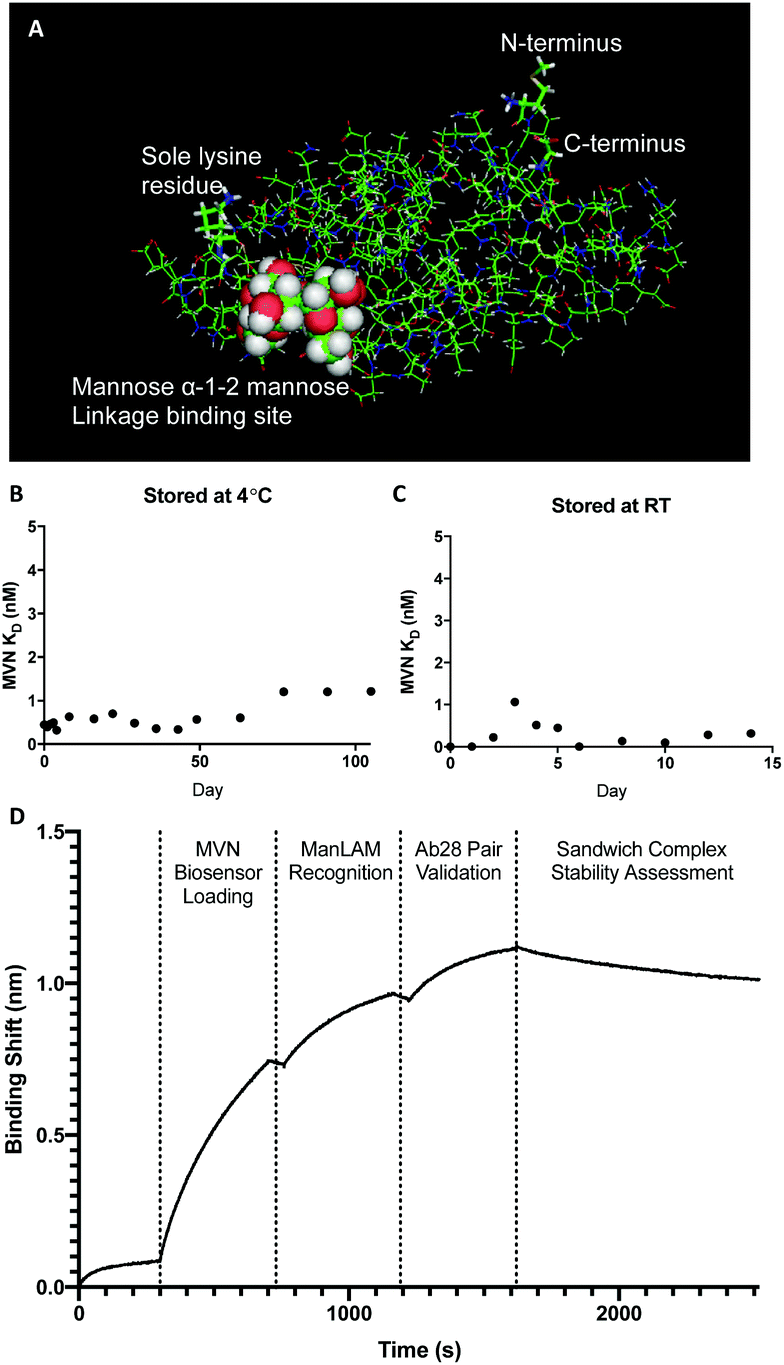 | ||
| Fig. 2 MVN crystal structure, stability studies, and binding pair assessment. (A) PyMOL rendering of the resolved crystal structure for MVN with the major components labeled.31 (B) MVN stability study where binding experiments were performed for 100+ days on MVN stored at 4 °C. (C) MVN stability study performed for 2 weeks on MVN stored at RT. (D) FIND Ab28 forms an orthogonal binding pair with MVN. | ||
Stability is an important parameter to the utility of protein-based capture reagents, especially when employed in POC diagnostic tests. As a measure of stability, the binding affinity (KD) of MVN conjugates, stored at room temp and at 4 °C, was examined against H37Rv M. tb ManLAM over time. MVN remained stable at 4 °C for over 100 days (Fig. 2B), moreover MVN that was stored at room temperature (RT) for two weeks showed no evidence of degradation during the course of the experiment (Fig. 2C). Importantly, the thermal stability of MVN at room temperature will limit the need for cold-chain transportation of MVN-based POC tests to remote clinic sites in developing countries, further improving the accessibility of MVN-based POC diagnostic tests. Another practical advantage to using MVN is that, like in vitro mAb production, MVN can be produced via vector-based expression in E. coli, which can be readily scaled up in industrial bacterial bioreactors and is resistant to batch-to-batch variation. Furthermore, the stable expression of MVN in E. coli, a bacterium that multiplies every 20 minutes, and easily tolerates incubation and protein expression at lower temperatures, e.g. 18 °C, means that MVN can be produced in large quantities at a significantly lower cost than recombinant proteins that have to be expressed in mammalian cells. In turn, the lower cost of production of MVN will translate to a lower cost per test, which is crucial to ensuring the successful rollout of POC diagnostic tests in developing countries.
In traditional “sandwich” style in vitro diagnostic tests, like ELISAs and LFAs, orthogonal binding pairs are employed to capture and detect biomarkers of interest. Pairing MVN with an orthogonal, high-affinity LAM capture element is therefore needed to detect ManLAM in these formats. Non-specific binding was observed between MVN and CS35, as well as MVN and CS40; additionally, supply constraints limited the use of Ab25 and Ab170. Therefore, Ab28 was chosen as the orthogonal LAM capture element for the binding pair and confirmed by bio-layer interferometry (Fig. 2D). MVN was not investigated as a self-binding pair (i.e. using MVN as both capture and detection elements) as MVN is known to bind to HIV-1.23 A MVN self-binding pair could display cross-reactivity with HIV-1 which would compromise the assay's specificity and sensitivity for M. tb ManLAM due to the high co-morbidity of HIV with TB.30 Alternatively, when using MVN in a binding pair with an anti-LAM capture antibody, the antibody would provide specificity for LAM thereby eliminating cross-reactivity with HIV, while MVN would detect only ManLAM molecules among the captured LAM variants.
The model assay selected to showcase the high-affinity ManLAM-binding pair was an on-bead ELISA (OB-ELISA). The sub-picomolar binding affinity of MVN to ManLAM and opportunistic bioconjugation framework made it an ideal capture reagent, while the ubiquitous use of antibodies as detection conjugates in ELISAs prompted the selection of Ab28 as the detection conjugate.34,35 The capture bead was generated by loading streptavidin magnetic Dynabeads with biotinylated MVN.21 An “all-in-one” OB-ELISA format was employed because it shortened overall assay time by 30+ minutes when compared to sequential addition without a significant impact on the signal-to-noise ratio (Fig. S5A†).36 The concentration of Ab28-HRP detection antibody was then optimized for the highest signal-to-noise ratio, where 2 μg mL−1 Ab28-HRP yielded choice results (Fig. S5B†). In addition, number of beads used and MVN loading density were investigated. Bead 1 was functionalized with 60 μg MVN per 100 μL beads and Bead 2 was functionalized with 30 μg MVN per 100 μL bead. 40 μg of Bead 2 was selected as it produced a high signal-to-noise ratio and low variability (6.5%) over all concentrations tested (Fig. S5CB†). It is noteworthy that MVN has an approximately 10-fold lower molecular weight than IgG antibodies which could result in higher overall loading density of MVN. Further, for an equivalent bead surface loading density, the surface-bound MVN molecules would experience less steric hinderance and, hence, lower impairment on ManLAM-binding than the surface-bound anti-LAM IgG antibodies.
The OB-ELISA was then tested with mock patient samples consisting of ManLAM or PILAM spiked into pooled human urine. The urine was pooled from multiple normal doners and purchased from Innovative Research. A standard curve of ManLAM spiked into pooled human urine (n = 7) was generated and the limit of detection was found to be 1.14 ng mL−1 with a variation of 6.18% (Fig. 3A). Importantly, no signal was observed when mock samples containing PILAM were tested, which provides strong evidence for the specificity of our MVN-based assay exclusively toward ManLAM. Lastly, larger urine sample volumes (250, 500 μL) were used in the OB-ELISA to show that the signal can be increased through volumetric enrichment by increasing the sample volume (Fig. 3B). An increase in signal was observed with increasing sample volume; albeit, the maximum theoretical enhancement factor was not met at large sample volumes; when a 250 μL sample was used, signal was enhanced by a factor of 1.4 compared to a theoretical enhancement of 2.5 and when a 500 μL sample was used, the resulting signal showed enhancement by a factor of 2.7 compared to the theoretical enhancement of 5. However, this finding is important as it shows that increasing sample volume leads to increased performance of the OB-ELISA. Large-volume urine samples are easily acquired – unlike other sample types (i.e. blood, sputum) – therefore, it would be feasible to use larger volumes of urine to improve the LOD of the OB-ELISA.37
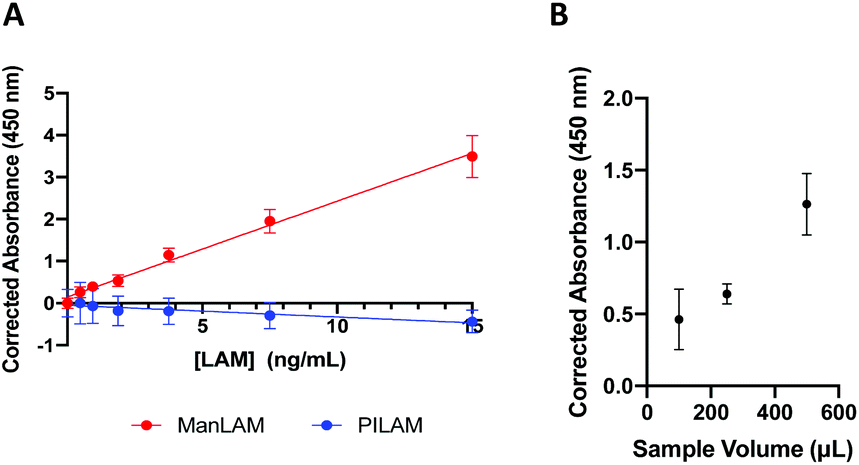 | ||
| Fig. 3 Results of the MVN-based on-bead ELISA. (A) Standard curves of ManLAM and PILAM spiked into pooled human urine. (B) Using larger urine sample volumes in the OB-ELISA allows the resulting signal to be increased proportionally. | ||
An antibody-based plate ELISA was also developed to compare the use of traditional molecular recognition elements (i.e. antibodies) to MVN (Fig. S6†). In this assay, anti-LAM antibodies were used for both capture and detection. As expected based on BLI results, this assay detects both ManLAM and PILAM spiked into pooled human urine with LODs of 729 pg mL−1 and 360 pg mL−1, respectively. We hypothesize that this assay is capable of detecting lower concentrations of PILAM than ManLAM due to the greater affinity of the anti-LAM antibodies for PILAM versus ManLAM. The antibody-based assay has a slightly lower LOD than the MVN-based OB-ELISA (1.14 ng mL−1). We attribute this to the greater number of binding sites on the ManLAM arabinan branches for an anti-LAM antibody compared to the number of Manα-(1,2)-Man di-mannosyl cap binding sites for MVN. However, the MVN-based OB-ELISA has markedly improved specificity as no signal is observed when tested with PILAM.
Lastly, the sensitivity and specificity of the OB-ELISA were compared to the Alere LFA by testing the LFA with mock samples consisting of ManLAM or PILAM spiked into pooled human urine (Fig. S7†). Both ManLAM and PILAM produce noticeable test line signal indicating that the Alere LFA is cross-reactive with PILAM, as expected based on the use of non-specific anti-LAM antibodies. Additionally, more intense test lines (greater test line area signal) were observed when LFAs were tested with PILAM which is in agreement with the results of the antibody-based ELISA. The visual LOD was determined to be 1.25 ng mL−1 ManLAM and 0.625 ng mL−1 PILAM which are similar to the reported values of 500–1000 pg mL−1.38,39 The LOD of the OB-ELISA (1.14 ng mL−1) falls in this range indicating that our assay is equally sensitive.
Conclusion
POC diagnostic tests for the detection of the TB biomarker ManLAM in urine play an increasingly important role in HIV + TB coinfection. We have employed the lectin MVN as the molecular recognition element to selectively detect ManLAM. Previous reports detail this lectin's high affinity and specificity for the Manα-(1,2)-Man di-mannosyl caps, but this is the first report that exploits this binding for the detection of ManLAM in TB diagnostic tests. BLI experiments showed that MVN has sub-picomolar binding affinity against ManLAM and stringent selectivity as it was shown that MVN does not bind PILAM, a variant of LAM found on non-pathogenic mycobacteria. In contrast, the employment of anti-LAM antibodies that bind to the arabinan branches of both ManLAM and PILAM leads to cross-reactivity and false positive results in diagnostic assays. Consequently, MVN is an ideal molecular recognition element for the development of POC TB diagnostic tests.We have developed an OB-ELISA that demonstrates the utility of MVN to selectively detect ManLAM in urine samples. As expected based on the BLI results, the assay exhibited a clear specificity for ManLAM versus PILAM, as well as a LOD of 1.14 ng mL−1 ManLAM, which falls between the LODs of an in-house antibody-based plate ELISA (729 pg mL−1) and the Alere LFA (1.25 ng mL−1). It is important to highlight that the plate ELISA and Alere LFA lack specificity for ManLAM and detect all variants of LAM. Further, we have shown that the sample volume for the on-bead ELISA can be scaled up to increase the assay signal and, theoretically, decrease the LOD. Ultimately, the goal is to develop a test that is sensitive enough to detect low levels of ManLAM in HIV-negative, TB-positive patients. Future work includes optimizing the assay for use with large-volume urine samples and testing with clinical TB samples. We have demonstrated the potential MVN has as a highly-selective capture reagent for TB ManLAM in urine, paving the way for the development of next generation POC diagnostics that will serve as vital tools for future TB control, particularly in low-resource settings.
Conflicts of interest
There are no conflicts of interest to declare.Acknowledgements
This work was supported by the “A Prototype Diagnostic Device for Rapid, Sensitive and Direct Identification and Quantification of Mycobacterium tuberculosis at Point-of-Care in Low Resource Settings” grant from the University of Cape Town/South African Medical Research Council. This material is based on work supported by the National Science Foundation Graduate Research Fellowship program under Grants DGE-1445197 and DGE-1937963, and the National Research Foundation of South Africa (NRF) under Grant SFP150729132726. JMB thanks the NRF for a research chair grant no. 64760. The authors thank the Vanderbilt Antibody Protein Resource Core for the expression of MVN, Stephanie Pearlman for assistance with the characterization of MVN, and the Foundation for Innovative New Diagnostics for providing the anti-LAM antibodies. The authors thank Dr Carole Bewley (Laboratory of Bioorganic Chemistry, NIDDK, National Institutes of Health) for gift of the MVN-pET15b plasmid. The authors thank M. F. Richards for critical comments in the preparation of this manuscript.Notes and references
- World Health Organization, Global Tuberculosis Report 2018, World Health Organization, S.l., 2018.
- M. Pai, M. P. Nicol and C. C. Boehme, Microbiol. Spectrum., 2016, 4, 5 Search PubMed.
- E. MacLean, K. Saravu and M. Pai, Curr. Opin. HIV AIDS, 2019, 14(1), 46–54 CrossRef.
- C. K. Kwan and J. D. Ernst, Clin. Microbiol. Rev., 2011, 24, 351–376 CrossRef.
- A. D. Harries and A. M. V. Kumar, Diagnostics, 2018, 8(4), 78 CrossRef.
- R. Wood, K. Racow, L. G. Bekker, K. Middelkoop, M. Vogt, B. N. Kreiswirth and S. D. Lawn, BMC Infect. Dis., 2012, 12, 47 CrossRef.
- S. D. Lawn, BMC Infect. Dis., 2012, 12, 103 CrossRef.
- K. Dheda, V. Davids, L. Lenders, T. Roberts, R. Meldau, D. Ling, L. Brunet, R. van Zyl Smit, J. Peter, C. Green, M. Badri, L. Sechi, S. Sharma, M. Hoelscher, R. Dawson, A. Whitelaw, J. Blackburn, M. Pai and A. Zumla, PLoS One, 2010, 5, e9848 CrossRef.
- S. Sarkar, X. L. Tang, D. Das, J. S. Spencer, T. L. Lowary and M. R. Suresh, PLoS One, 2012, 7, e32340 CrossRef CAS.
- L. Paris, R. Magni, F. Zaidi, R. Araujo, N. Saini, M. Harpole, J. Coronel, D. E. Kirwan, H. Steinberg, R. H. Gilman, E. F. Petricoin, R. Nisini, A. Luchini and L. Liotta, Sci. Transl. Med., 2017, 9, 420 CrossRef.
- G. B. Sigal, A. Pinter, T. L. Lowary, M. Kawasaki, A. Li, A. Mathew, M. Tsionsky, R. B. Zheng, T. Plisova, K. Shen, K. Katsuragi, A. Choudhary, W. J. Honnen, P. Nahid, C. M. Denkinger and T. Broger, J. Clin. Microbiol., 2018, 56, 12 CrossRef.
- J. Minion, E. Leung, E. Talbot, K. Dheda, M. Pai and D. Menzies, Eur. Respir. J., 2011, 38, 1398–1405 CrossRef CAS.
- P. Sarkar, D. Biswas, G. Sindhwani, J. Rawat, A. Kotwal and B. Kakati, Postgrad. Med. J., 2014, 90, 155–163 CrossRef CAS.
- C. Boehme, E. Molokova, F. Minja, S. Geis, T. Loscher, L. Maboko, V. Koulchin and M. Hoelscher, Trans. R. Soc. Trop. Med. Hyg., 2005, 99, 893–900 CrossRef CAS.
- A. K. Mishra, N. N. Driessen, B. J. Appelmelk and G. S. Besra, FEMS Microbiol. Rev., 2011, 35, 1126–1157 CrossRef CAS.
- J. Nigou, M. Gilleron and G. Puzo, Biochimie, 2003, 85, 153–166 CrossRef CAS.
- J. Nigou, A. Vercellone and G. Puzo, J. Mol. Biol., 2000, 299, 1353–1362 CrossRef CAS.
- J. B. Torrelles, K.-H. Khoo, P. A. Sieling, R. L. Modlin, N. Zhang, A. M. Marques, A. Treumann, C. D. Rithner, P. J. Brennan and D. Chatterjee, J. Biol. Chem., 2004, 279, 41227–41239 CrossRef CAS.
- C. E. Chan, S. Götze, G. T. Seah, P. H. Seeberger, N. Tukvadze, M. R. Wenk, B. J. Hanson and P. A. MacAry, Sci. Rep., 2015, 5, 10281 CrossRef CAS.
- D. Kaur, T. L. Lowary, V. D. Vissa, D. C. Crick and P. J. Brennan, Microbiology, 2002, 148, 3049–3057 CrossRef CAS.
- T. Broger, B. Sossen, E. du Toit, A. D. Kerkhoff, C. Schutz, E. I. Reipold, A. Ward, D. A. Barr, A. Macé, A. Trollip, R. Burton, S. Ongarello, A. Pinter, T. L. Lowary, C. Boehme, M. P. Nicol, G. Meintjes and C. M. Denkinger, Lancet Infect. Dis., 2019, 19(8), 852–861 CrossRef.
- M. Kawasaki, C. Echiverri, L. Raymond, E. Cadena, E. Reside, M. T. Gler, T. Oda, R. Ito, R. Higashiyama, K. Katsuragi and Y. Liu, PLoS Med., 2019, 16, e1002780 CrossRef CAS.
- J.-C. Kehr, Y. Zilliges, A. Springer, M. D. Disney, D. D. Ratner, C. Bouchier, P. H. Seeberger, N. T. de Marsac and E. Dittmann, Mol. Microbiol., 2006, 59, 893–906 CrossRef CAS.
- D. Huskens, G. Ferir, K. Vermeire, J.-C. Kehr, J. Balzarini, E. Dittmann and D. Schols, J. Biol. Chem., 2010, 285, 24845–24854 CrossRef CAS.
- S. Shahzad-ul-Hussan, E. Gustchina, R. Ghirlando, G. M. Clore and C. A. Bewley, J. Biol. Chem., 2011, 286, 20788–20796 CrossRef CAS.
- D. Goletti, E. Petruccioli, S. A. Joosten and T. H. M. Ottenhoff, Infect. Dis. Rep., 2016, 8(2), 24–32 Search PubMed.
- N. S. Lipman, L. R. Jackson, L. J. Trudel and F. Weis-Garcia, ILAR J., 2005, 46, 258–268 CrossRef CAS.
- A. G. Amin, P. De, J. S. Spencer, P. J. Brennan, J. Daum, B. G. Andre, M. Joe, Y. Bai, L. Laurentius, M. D. Porter, W. J. Honnen, A. Choudhary, T. L. Lowary, A. Pinter and D. Chatterjee, Tuberculosis, 2018, 111, 178–187 CrossRef CAS.
- A. Treumann, F. Xidong, L. McDonnell, P. J. Derrick, A. E. Ashcroft, D. Chatterjee and S. W. Homans, J. Mol. Biol., 2002, 316, 89–100 CrossRef CAS.
- S. Shahzad-Ul-Hussan, M. Sastry, T. Lemmin, C. Soto, S. Loesgen, D. A. Scott, J. R. Davison, K. Lohith, R. O’Connor, P. D. Kwong and C. A. Bewley, ChemBioChem, 2017, 18, 764–771 CrossRef CAS.
- Y. Q. Min, X. C. Duan, Y. D. Zhou, A. Kulinich, W. Meng, Z. P. Cai, H. Y. Ma, L. Liu, X. L. Zhang and J. Voglmeir, Biosci. Rep., 2017, 37, 3 CrossRef.
- Fact Sheets | General | Mycobacterium bovis (Bovine Tuberculosis) in Humans | TB | CDC, https://www.cdc.gov/tb/publications/factsheets/general/mbovis.htm, (accessed July 15, 2019).
- O. Koniev and A. Wagner, Chem. Soc. Rev., 2015, 44, 5495–5551 RSC.
- P. Damborský, K. M. Koczula, A. Gallotta and J. Katrlík, Analyst, 2016, 141, 6444–6448 RSC.
- E. Åström, P. Stål, R. Zenlander, P. Edenvik, C. Alexandersson, M. Haglund, I. Rydén and P. Påhlsson, PLoS One, 2017, 12, e0173897 CrossRef.
- C. F. Markwalter, K. M. Ricks, A. L. Bitting, L. Mudenda and D. W. Wright, Talanta, 2016, 161, 443–449 CrossRef CAS.
- C. F. Markwalter, P. L. A. M. Corstjens, C. M. Mammoser, G. Camps, G. J. van Dam and D. W. Wright, Analyst, 2018, 144, 212–219 RSC.
- E. MacLean and M. Pai, Clin. Chem., 2018, 64, 1133–1135 CrossRef CAS.
- J. I. García, H. V. Kelley, J. Meléndez, R. A. A. de León, A. Castillo, S. Sidiki, K. A. Yusoof, E. Nunes, C. L. Téllez, C. R. Mejía-Villatoro, J. Ikeda, A. L. García-Basteiro, S.-H. Wang and J. B. Torrelles, Sci. Rep., 2019, 9, 1–6 CrossRef.
Footnotes |
| † Electronic supplementary information (ESI) available. See DOI: 10.1039/d0an01725f |
| ‡ These authors contributed equally to this work. |
| This journal is © The Royal Society of Chemistry 2021 |