
Fluorescence lifetime probes for detection of RNA degradation†
Riku
Hirata
a,
Kazutaka
Hirakawa
b,
Naotaka
Shimada
a,
Kazunori
Watanabe
a and
Takashi
Ohtsuki
 *a
*a
aDepartment of Interdisciplinary Science and Engineering in Health Systems, Okayama University, Okayama, Japan. E-mail: ohtsuk@okayama-u.ac.jp; Tel: +81-86-251-8218
bDepartment of Engineering, Graduate School of Integrated Science and Technology, Shizuoka University, Johoku 3-5-1, Naka-ku, Hamamatsu 432-8561, Japan
First published on 27th October 2020
Abstract
To investigate RNA degradation in live cells, detection methods that do not require RNA extraction from cells are necessary. In this study, we examined the utility of fluorescence lifetime measurements using a probe attached to the end of an RNA molecule for detecting RNA degradation. We optimized a short fluorescein-labeled RNA sequence whose fluorescence lifetime varied significantly before and after degradation. The selected HHG-fluorescein sequence (H = U, C, or A) is a promising RNA labeling unit (fluorescence lifetime probe) for live cell imaging of RNA degradation.
Introduction
RNAs play important roles not only in coding protein sequences but also in the regulation of genome organization and gene expression, controlling many biological processes, including differentiation and development.1 Recently, the stability of various mRNAs and non-coding RNAs has been studied.2–6 It has been established that short-lived RNAs are involved in regulatory processes, whereas long-lived RNAs perform housekeeping functions.2–4,7 Therefore, to study RNA functions, it is important to investigate RNA stability. In addition, RNA stability may vary depending on the cellular localization and conditions to which the cell is exposed. For example, all-trans retinoic acid treatment alters half-lives of non-coding RNAs in human cells,3 cold stress affects the half-life of mRNAs in Arabidopsis cells,8 and heat stress stimulates translocation of mammalian initiator tRNAMet from the cytoplasm to the nucleus and promotes the tRNAiMet degradation.9,10 To assess the differences in RNA stability at various cellular locations and in various environments to which cells are exposed, a method for measuring RNA degradation in intact cells is necessary.To assess RNA stability, it is common to analyze RNAs extracted from cells after the inhibition of transcription.2,4 The extracted RNAs are quantified by microarrays, Northern blotting, or next-generation sequencing. However, these methods cannot be applied for measurements of RNA stability in intact cells. In contrast, fluorescence imaging methods allow simultaneous detection of the subcellular RNA localization and estimation of RNA decay rate in cells. A method for the measurement of mRNA decay rate by fluorescence in situ hybridization has been reported.11,12 However, in this method, the cells are not intact, as transcriptional inhibition and cell fixation are required. For live cell imaging of RNA degradation, fluorescence resonance energy transfer (FRET)-based method13 and fluorescence lifetime-based method14 have been suggested recently. The FRET method requires RNA labeling with two fluorophores at adjacent sites, whereas the fluorescence lifetime method requires single fluorophore labeling.
In this study, we investigated an optimal labeling method to facilitate the measurements of RNA stability in living cells by fluorescence lifetime imaging. The fluorescence lifetime of a fluorescent molecule is affected by the chemical environment near its fluorophore and does not depend on the fluorophore concentration or optical conditions. This study mainly focused on the role of guanine bases (G) near the fluorophore. Fluorescence quenching is often observed between fluorescent dyes and guanine, which is believed to occur due to photoinduced electron transfer between the fluorophore (electron acceptor) and G (electron donor).15,16 Fluorescence quenching is generally related to the decrease of fluorescence lifetime. Therefore, we considered that G near a fluorophore would greatly affect fluorescence lifetime. We used fluorescein for RNA labeling because it is a fluorescent dye susceptible to quenching by G.17 Here, we systematically examined fluorescein-labeled 6-base RNAs arranged to have 1–3 G bases near fluorescein (Table 1), looking for a fluorescein-labeled RNA species with the largest difference in fluorescence lifetime before and after degradation. From these fluorescein-labeled RNA variants, we found that 3′-end labeling with HHG-fluorescein, where H = U, C, or A, is optimal for detecting RNA degradation by fluorescence lifetime measurements. This labeling unit (a fluorescence lifetime probe added to the 3′ end of RNA) was applied for detecting the degradation of several RNAs.
| Name | Sequence (from 5′ to 3′) |
|---|---|
| fluGUU | Fluorescein-GUUUUU |
| fluUGU | Fluorescein-UGUUUU |
| fluUUG | Fluorescein-UUGUUU |
| UUGflu | UUUUUG-fluorescein |
| UGUflu | UUUUGU-fluorescein |
| GUUflu | UUUGUU-fluorescein |
| UGGflu | UUUUGG-fluorescein |
| GGGflu | UUUGGG-fluorescein |
| GGUflu | UUUGGU-fluorescein |
| G3Uflu | UUGGGU-fluorescein |
| UCGflu | UUUUCG-fluorescein |
| UAGflu | UUUUAG-fluorescein |
| CUGflu | UUUCUG-fluorescein |
| AUGflu | UUUAUG-fluorescein |
| GGCflu | UUUGGC-fluorescein |
| GGAflu | UUUGGA-fluorescein |
| polyA-UCGflu | AAAAAAAAAAAAAAA-UCG-fluorescein |
| polyG-UCGflu | GGGGGGGGGGGGGGG-UCG-fluorescein |
| polyU-UCGflu | UUUUUUUUUUUUUUU-UCG-fluorescein |
| polyC-UCGflu | CCCCCCCCCCCCCCC-UCG-fluorescein |
| iMet3′-Gflu | GAAACCAUCCUCUGCCACCA-G-fluorescein |
Experimental
Fluorescein-labeled RNAs
The labeled RNAs (Table 1, Fig. S1†) were purchased from JBioS (Saitama, Japan).Fluorescein-labeled human tRNAiMet (iMet-Gflu) was prepared by enzymatic ligation of a transcribed 5′-fragment (iMet5′) and a fluorescein-labeled 3′-fragment (iMet3′-Gflu, Table 1) as follows. iMet5′, which lacks the 20-nucleotide sequence at the 3′-end of tRNAiMet, was transcribed as described.18 Briefly, a DNA template for the transcription was prepared by primer extension using two primers: the forward primer, 5′-CGA AAT TAA TAC GAC TCA CTA TAG GCA GAG TGG CGC AGC GGA AGC GTG CTG GGC CCA TAA CCC AGA G-3′, and the reverse primer, 5′-GAT CCA TCG ACC TCT GGG TTA TGG GCC CAG C-3′. The DNA template was transcribed using T7 RNA polymerase and the transcribed iMet5′ was purified in an 8% denaturing polyacrylamide gel. Removal of the 5′-phosphate group of iMet5′ was performed using Escherichia coli alkaline phosphatase (BAP) (TOYOBO, Osaka, Japan). The reaction was carried out at 37 °C for 30 min in a reaction mixture containing 20 μM RNA fragment, 30 units per mL BAP, and 1× reaction buffer for BAP. After the reaction, BAP was removed by phenol treatment followed by ethanol precipitation. The 5′-end of iMet3′-Gflu (10 μM) was phosphorylated at 37 °C for 30 min in a reaction mixture containing 1× Protruding End Kinase Buffer (TOYOBO), 1 mM ATP, and 560 units per mL T4 polynucleotide kinase (TOYOBO). After the reaction, the kinase was removed by phenol treatment followed by ethanol precipitation. Dephosphorylated iMet5′ (20 μM) and phosphorylated iMet3′-Gflu (20 μM) were ligated at 16 °C for 16 h in a reaction mixture containing 50 mM Tris-HCl (pH 7.5), 10 mM MgCl2, 10 mM dithiothreitol, 1 mM ATP, 0.006% bovine serum albumin, 25% polyethylene glycol 6000, and 800 units per mL T4 RNA ligase (TaKaRa). The ligation product (iMet-Gflu) was purified by electrophoresis in 8% polyacrylamide gel containing 7 M urea (PAGE).
RNA degradation by RNase If
Each fluorescein-labeled RNA was degraded at 37 °C for 90 min in a reaction solution containing 50 mM Tris-HCl (pH 7.9), 100 mM NaCl, 10 mM MgCl2, 1 mM DTT, 10 units per μL RNase If (New England Biolabs), and 8 μM of the RNA. As negative controls, non-degraded fluorescein-labeled RNAs were prepared by incubation at 37 °C for 90 min in the above solution without RNase If. RNA degradation was confirmed by 12% denaturing (7 M urea) PAGE. Fluorescein images of the gel were acquired using an FLA-9000 (Fujifilm, Japan).Measurements of fluorescence and fluorescence lifetime
Each RNA sample was dissolved in a buffer containing 10 mM HEPES-KOH (pH 7.6) and 1 mM MgCl2 to prepare 32 nM RNA solution. The fluorescence spectra of the fluorescein-labeled RNAs were measured at an excitation wavelength of 492 nm and an emission wavelength of 500–700 nm using an FP-6600 spectrofluorometer (JASCO, Tokyo, Japan). Fluorescence intensities were measured at an emission wavelength of 517 nm. The fluorescence lifetimes of the fluorescein-labeled RNAs were measured using the time-correlated single-photon counting method with a Fluorescence Lifetime System TemPro (HORIBA, Kyoto, Japan). Excitation at 402 nm was achieved using a diode laser (NanoLED-405L, HORIBA) at a repetition rate of 1.0 MHz. The detection wavelength was over 520 nm. The experimental error of these measurements was within 0.01 ns.Results & discussion
Confirmation of RNA degradation
To perform fluorescence lifetime measurements, we first prepared fluorescein-labeled RNAs degraded with RNase If. RNase If has an identical activity to that of E. coli RNase I, which cleaves all RNA dinucleotide bonds, leaving a 5′-hydroxyl and 2′, 3′-cyclic monophosphate.19 For each degraded fluorescein-labeled RNA, a single band was observed at a different mobility value from that of the non-degraded RNAs (Fig. 1), indicating that all of these RNAs were completely degraded. Successful RNase treatment should generate 5′-fluorescein-Np-3′ or 5′-N-fluorescein-3′ (N = G or U), and the former product should electrophorese faster than the latter due to the negative charge of 2′,3′-cyclic monophosphate in fluorescein-Np. The PAGE results confirmed the properties of the expected products: the degraded fluGUU, fluUGU, and fluUUG (5′-fluorescein-Np-3′) were observed in lower positions on the gels than the degraded UUGflu, UGUflu, and GUUflu (5′-N-fluorescein-3′). | ||
| Fig. 1 Electrophoretic diagram of fluorescein-labeled RNA before and after RNase If treatment. The labeled RNAs were analyzed by 12% 7 M urea-PAGE with ethidium bromide (EtBr) staining and fluorescein imaging. | ||
Fluorescein-labeled RNA hexamers containing one G and five U
Of the four RNA bases, guanine is the base most likely to affect fluorescence lifetime by fluorescence quenching. The electron-donor ability of G is the highest among the four nucleic acid bases because the oxidation potential of G is lower than that of the other bases.15,20 Therefore, G tends to induce electron transfer quenching. In addition, fluorescence quenching can be explained by the ΔG value of electron transfer from nucleobase, specifically G, to fluorescein in the singlet excited (S1) state. The calculated ΔG value was negative (−0.05 eV) (see ESI†), indicating the thermodynamic possibility of electron transfer quenching of fluorescein in the S1 state by G. In contrast, positive ΔG values for the other nucleobases (A: +0.40 eV, U: +0.61 eV, and C: +0.61 eV) suggested that electron transfer quenching by other nucleobases is much less likely.Thus, we first investigated the effect of G-to-fluorescein distance by using 5′- or 3′-fluorescein-labeled RNA variants (Fig. 2A) with one G at a distance of 1–3 bases from the terminal fluorescein. Large differences before and after degradation were observed in UUGflu and fluGUU, where the fluorescence lifetime was shortened by more than 0.5 ns after degradation (Fig. 2B). This result indicates that the presence of G next to fluorescein is very important for a large difference between fluorescence lifetimes before and after degradation. However, fluGUU was a suboptimal probe for the detection of RNA degradation by fluorescence lifetime measurements, because it showed very weak fluorescence, especially after degradation (Fig. 2C). The third largest difference (0.23 ns) was observed in UGUflu. It should be noted that contrary to the result with UUGflu, the fluorescence lifetime of UGUflu became longer after degradation. Therefore, we focused on the constructs based on UUGflu and UGUflu in the following experiment.
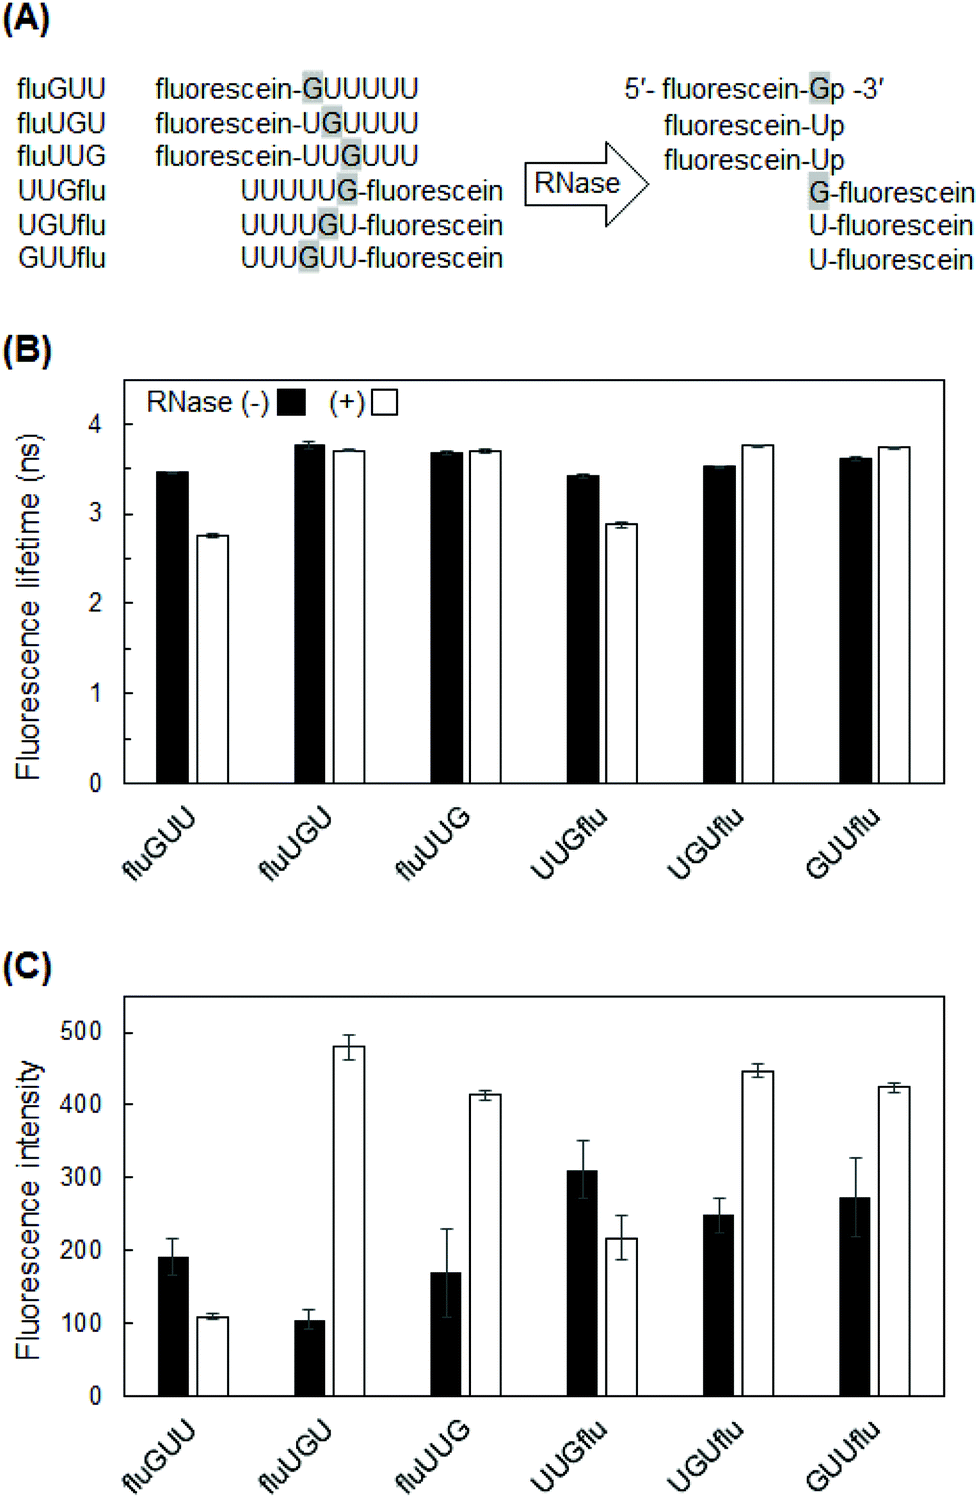 | ||
| Fig. 2 Fluorescence lifetime and fluorescence intensity of fluorescein-labeled RNA hexamers comprising one G and five U bases. (A) The sequences of fluorescein-labeled RNAs before and after RNase If treatment. For digested RNAs, only fluorescein-labeled RNA products are shown. (B) Fluorescence lifetime of fluorescein-labeled RNAs. (C) Fluorescence intensity of fluorescein-labeled RNAs. Fluorescence lifetime/intensity values of RNAs with or without RNase If treatment are shown by white and black bars, respectively. Data are presented as the mean ± SD (n = 3). | ||
Fluorescein-labeled RNA hexamers containing multiple guanine bases
Based on the results with UUGflu and UGUflu, we next designed fluorescein-labeled RNAs with multiple G bases to investigate the effect of their number on fluorescence parameters. It has been reported that stacking interaction between consecutive G bases significantly lowers the energy of the highest occupied molecular orbital.21,22 Therefore, consecutive G bases become strong electron donors that may cause electron transfer quenching and decrease of fluorescence lifetime.Among the labeled RNAs whose fluorescence lifetime decreased after degradation, the largest decrease (∼0.55 ns) was observed in UUGflu and UGGflu (Fig. 3A). UUGflu appeared to be a better fluorescent probe because its fluorescence intensity was twice as high as that of UGGflu (Fig. 3B). Fluorescence lifetime measurement is easier in highly fluorescent molecules than in poorly fluorescent molecules, so the former can be detected at low concentrations. Among the labeled RNAs whose fluorescence lifetime increased after degradation, the largest increase (0.33 ns) was observed in GGUflu (Fig. 3A).
 | ||
| Fig. 3 Fluorescence lifetime and fluorescence intensity of fluorescein-labeled RNA hexamers containing multiple guanine bases. (A) Fluorescence lifetime of fluorescein-labeled RNAs. (B) Fluorescence intensity of fluorescein-labeled RNAs. Fluorescence lifetime/intensity values of RNAs with and without RNase If treatment are shown by white and black bars, respectively. Data are presented as the mean ± SD (n = 3). | ||
Fluorescein-labeled RNAs with 3′-NNG or GGN sequence
Based on the results with UUGflu and GGUflu, which showed large differences in fluorescence lifetime before and after degradation (Fig. 3), U residues near the 3′-end were systematically changed to A or C (Fig. 4A) to investigate the effects of A and C bases. Fluorescence lifetime measurements showed a large difference (0.54–0.73 ns) before and after RNA degradation in HHGflu (H = A, U, or C), especially in UCGflu (the difference in fluorescence lifetimes before and after degradation was 0.73 ns). Such 0.5–0.8 ns difference for samples with a fluorescence lifetime of several ns can also be detected in fluorescence lifetime imaging experiments.23,24 Compared to HHGflu, GGHflu variants showed a smaller difference. Fluorescence intensities of AUGflu and UAGflu were slightly lower than those of YYGflu (Y = C or U), but not too low (Fig. 4B). These results suggest that HHG-fluorescein sequences are optimal for the detection of RNA degradation when they are used as probes added to the end of an RNA molecule of interest (Fig. 5A left). | ||
| Fig. 4 Fluorescence lifetime and fluorescence intensity of fluorescein-labeled RNA hexamer variants with 3′-NNG or GGN sequence. (A) Fluorescence lifetime of fluorescein-labeled RNAs. (B) Fluorescence intensity of fluorescein-labeled RNAs. Fluorescence lifetime/intensity values of RNAs with and without RNase If treatment are shown by white and black bars, respectively. Data are presented as the mean ± SD (n = 3). | ||
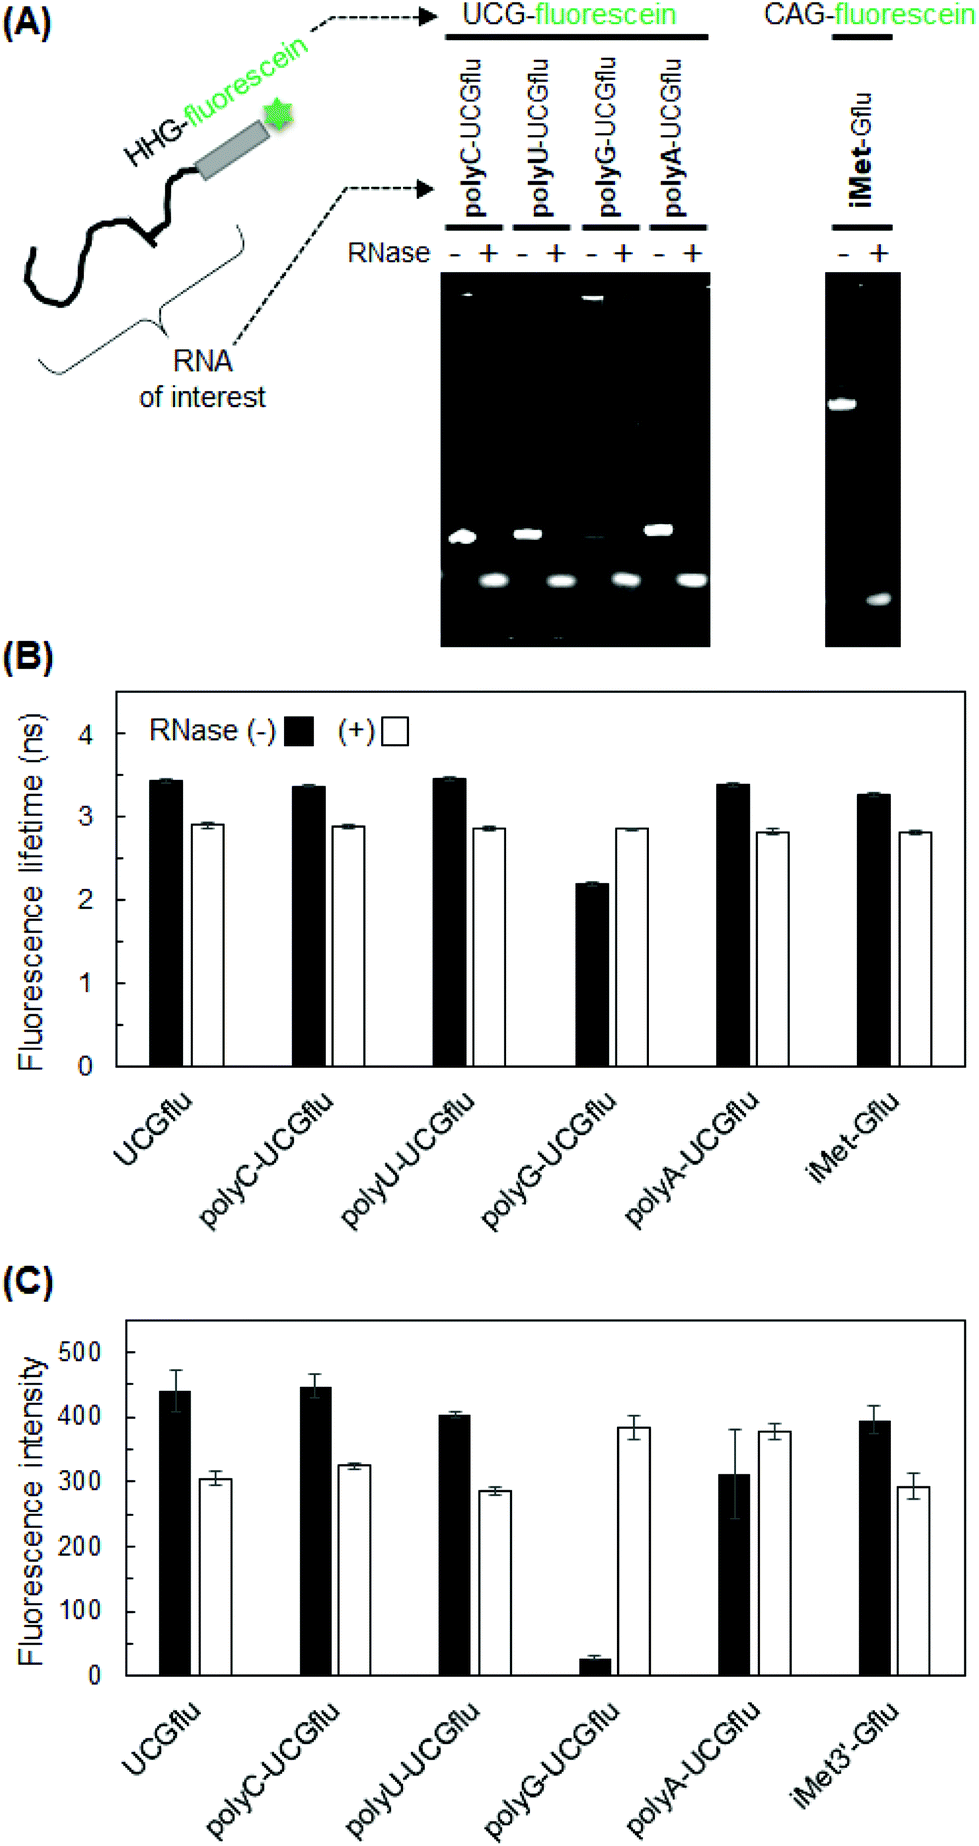 | ||
| Fig. 5 Fluorescence lifetime and fluorescence intensity of RNA labeled with HHG-fluorescein sequence. (A) Electrophoresis diagram of fluorescein-labeled RNAs before and after degradation by the RNase treatment. The labeled RNAs were analyzed by PAGE in 12% gel containing 7 M urea with ethidium bromide staining. (B) Fluorescence lifetime of fluorescein-labeled RNAs. (C) Fluorescence intensity of fluorescein-labeled RNAs. UCG-fluorescein served as a positive control. Fluorescence lifetime/intensity of RNAs with and without RNase If treatment are shown by white and black bars, respectively. Data are presented as the mean ± SD (n = 3). | ||
Application of HHG-fluorescein attachment for detecting RNA degradation
Finally, we applied HHG-fluorescein attachment for detecting the degradation of several RNAs by fluorescence lifetime measurements. For example, UCG-fluorescein was attached to the 3′-end of polyU, polyC, polyG, and polyA, and their fluorescence lifetimes were measured before and after degradation. Similar to the case with UCGflu (UUU-UCG-fluorescein), fluorescence lifetimes of UCG-fluorescein-labeled polyU, polyC, and polyA were significantly shorter after degradation (Fig. 5B). PolyG-UCGflu was an exception for which the principle of fluorescence lifetime difference before and after degradation did not apply. The fluorescence lifetime of non-degraded polyG-UCGflu was short probably due to the strong quenching ability of many G bases, which was reflected by its extremely low fluorescence intensity (Fig. 5C). This exceptional result for polyG-UCGflu may be also related to the self-complex structure (probably, G-quadruplex) shown by the upper shifted band (Fig. 5A). Then, human tRNAiMet was used as an example of an endogenous RNA with a natural ratio of A/G/C/U bases, (unlike extreme artificial RNAs, such as polyX). Human tRNAiMet was labeled at the 3′-end with HHG-fluorescein sequence and its fluorescence lifetime was measured. As an HHG-fluorescein sequence, we used CAG-fluorescein (the original tRNA sequence is up to CA; thus, only G-fluorescein sequence was added) to change the original sequence as little as possible. We found that fluorescence lifetime of fluorescein-labeled tRNAiMet (iMet-Gflu) was shortened after degradation as was shown above for UCGflu, polyU-UCGflu, polyC-UCGflu, and polyA-UCG flu. These data demonstrate the usefulness of the HHG-fluorescein probe for the detection of RNA degradation.Influence of incomplete degradation and molecular crowding conditions
As shown by PAGE (Fig. 1 and 5a), we used completely degraded fluorescein-labeled RNAs to detect their degradation through fluorescence lifetime. However, there is an incomplete RNA degradation state before complete degradation. In the incomplete degradation state, the fluorescence lifetime is considered to have an intermediate value between complete degradation and non-degradation. We thus monitored UCGflu degradation depending on the reaction time by the fluorescence lifetime (Fig. S2†). The intermediate values of fluorescence lifetime were observed in the reaction time ranging from 30 min to 60 min.To confirm that the present fluorescent behavior holds in the intracellular environment, we measured the fluorescence lifetime and intensity of several RNAs in a cell-mimicking environment with a molecular crowding agent. Poly-(ethylene glycol) with an average molecular weight of 200 (PEG 200) was used as the molecular crowding agent.25,26 Three characteristic fluorescein-labeled RNA hexamers (fluGUU, GGUflu, and UCGflu) and an RNA labeled with an HHG-fluorescein sequence (polyU-UCGflu) were analyzed, and a similar fluorescent behavior was observed (Fig. S3†); for fluGUU, UCGflu and polyU-UCGflu, the fluorescence lifetime decreased after degradation, and for GGUflu, it increased after degradation.
Correlation of RNA sequences and degradation-induced changes in fluorescence lifetime
For sequences with G next to fluorescein, irrespective of which end was fluorescein-labeled, the fluorescence lifetime was shortened in most cases after degradation. This is probably because quenching by G is weaker before degradation than after degradation. Molecular mechanics calculations of fluorescein-GUU and UUG-fluorescein showed that the base (U) that is not next to fluorescein in the sequence, rather than the G next to fluorescein, was closer to fluorescein (Fig. S4A and S5A†). In contrast, in the structure after degradation (fluorescein-G and G-fluorescein), G moved closer to fluorescein, without the interruption by other bases (Fig. S4B and S5B†). These calculated structures indicate that quenching by G is weaker before degradation than after degradation.When U/C/A was placed next to fluorescein, in many cases (UGUflu, GUUflu, GGUflu, GGCflu, and GGAflu), the fluorescence lifetime increased after degradation. These results can be explained by the quenching effect of G. RNA degradation causes dissociation of the G-containing sequence from the U/C/A-fluorescein terminus, which, in turn, attenuates quenching by G and prolongs fluorescence lifetime. Exceptionally, fluorescence lifetimes of fluUGU and fluUUG remained almost unchanged after degradation (Fig. 2B). It is mysterious that the fluorescence lifetime remained unchanged, in spite that the fluorescence intensities of fluUGU and fluUUG were greatly increased after degradation (Fig. 2C). This might be explained by the existence of non-fluorescent species that are statically quenched by G. Given that the non-fluorescent species cannot be observed, the average fluorescence lifetime of the fluorescent species does not change. The relative amplitude of non-fluorescent species (rnf) can be estimated by the equation derived from the previous report27 (for the above-mentioned fluUGU and fluUUG, rnf values were estimated as shown in ESI† Results).
Conclusions
In this study, we determined the optimal sequences of fluorescence lifetime probes for detecting RNA degradation. We focused mainly on the effect of the G base and systematically changed the bases near the fluorescent group. The sequences with G next to fluorescein almost always resulted in a shorter fluorescence lifetime after degradation (Fig. 2–5) (with the only exception of polyG-UCGflu). For the sequences with U/C/A next to fluorescein, the fluorescence lifetime increased or unchanged after degradation (Fig. 2–4). Changing U in the vicinity of fluorescein to C or A did not significantly affect fluorescence lifetime (Fig. 4), indicating that only G had a significant effect on that parameter among the four bases. We concluded that HHG-fluorescein (H = U, C, A) is the optimal probe sequence, which should be attached at the 3′-end of an RNA of interest for detecting its degradation. In the case if the 5′-end labeling is required, fluorescein-GUU may be used, although its fluorescence intensity is low. We attached the HHG-fluorescein probe sequence to several RNAs, and their degradation, except for that of polyG, was successfully detected by fluorescence lifetime measurements. Although only fluorescein was used here, other fluorophores that can be quenched by guanine17 may be used as a substitute for fluorescein in the fluorescence lifetime probe. In the future, this probe may be used in fluorescence lifetime imaging for the detection of RNA degradation in cells.Conflicts of interest
There are no conflicts to declare.References
- K. V. Morris and J. S. Mattick, Nat. Rev. Genet., 2014, 15, 423–437 CrossRef CAS.
- B. Schwanhüusser, D. Busse, N. Li, G. Dittmar, J. Schuchhardt and J. Wolf, et al. , Nature, 2011, 473, 337–342 CrossRef.
- H. Tani, R. Mizutani, K. A. Salam, K. Tano, K. Ijiri and A. Wakamatsu, et al. , Genome Res., 2012, 22, 947–956 CrossRef CAS.
- Y. Li, Z. Li, S. Zhou, J. Wen, B. Geng, J. Yang and Q. Cui, BioMed Res. Int., 2013, 2013, 368975 Search PubMed.
- V. Presnyak, N. Alhusaini, Y. H. Chen, S. Martin, N. Morris and N. Kline, et al. , Cell, 2015, 160, 1111–1124 CrossRef CAS.
- X. Wu and D. P. Bartel, Cell, 2017, 169, 905–917 CrossRef CAS.
- W. Wang, M. C. Caldwell, S. Lin, H. Furneaux and M. Gorospe, EMBO J., 2000, 19, 2340–2350 CrossRef CAS.
- Y. Chiba, K. Mineta, M. Y. Hirai, Y. Suzuki, S. Kanaya and H. Takahashi, et al. , Plant Cell Physiol., 2013, 54, 180–194 CrossRef CAS.
- R. Miyagawa, R. Mizuno, K. Watanabe and K. Ijiri, Biochem. Biophys. Res. Commun., 2012, 418, 149–155 CrossRef CAS.
- K. Watanabe, R. Miyagawa, C. Tomikawa, R. Mizuno, A. Takahashi and H. Hori, et al. , Nucleic Acids Res., 2013, 41, 4671–4685 CrossRef CAS.
- S. Kramer, Nucleic Acids Res., 2017, 45, e49 CrossRef.
- S. Iyer, B. R. Park and M. Kim, Nucleic Acids Res., 2016, 44, e142 CrossRef.
- M. Hirsch and M. Helm, Nucleic Acids Res., 2015, 43, 4650–4660 CrossRef CAS.
- P. Heissig, W. Schrimpf, P. Hadwiger, E. Wagner and D. C. Lamb, PLoS One, 2017, 12, e0173401 CrossRef.
- F. D. Lewis and R. L. Letsinger, J. Biol. Inorg. Chem., 1998, 3, 215–221 CrossRef CAS.
- M. Torimura, S. Kurata, K. Yamada, T. Yokomaku, Y. Kamagata and T. Kanagawa, et al. , Anal. Sci., 2001, 17, 155–160 CrossRef CAS.
- S. A. E. Marras, F. R. Kramer and S. Tyagi, Nucleic Acids Res., 2002, 30, e122 CrossRef.
- T. Ohtsuki, T. Manabe and M. Sisido, FEBS Lett., 2005, 579, 6769–6774 CrossRef CAS.
- P. F. Spahr and B. R. Hollingworth, J. Biol. Chem., 1961, 236, 823–831 CAS.
- C. J. Burrows and J. G. Muller, Chem. Rev., 1998, 98, 1109–1151 CrossRef CAS.
- H. Sugiyama and I. Saito, J. Am. Chem. Soc., 1996, 118, 7063–7068 CrossRef CAS.
- Y. Yoshioka, Y. Kitagawa, Y. Takano, K. Yamaguchi, T. Nakamura and I. Saito, J. Am. Chem. Soc., 1999, 121, 8712–8719 CrossRef CAS.
- S. Gershanov, S. Michowiz, H. Toledano, G. Yahav, O. Barinfeld and A. Hirshberg, et al. , Sci. Rep., 2017, 7, 3648 CrossRef.
- T. Laviv, B. B. Kim, J. Chu, A. J. Lam, M. Z. Lin and R. Yasuda, Nat. Methods, 2016, 13, 989–992 CrossRef CAS.
- S. B. Zimmerman and A. P. Minton, Annu. Rev. Biophys. Biomol. Struct., 1993, 22, 27–65 CrossRef CAS.
- D. Miyoshi, H. Karimata and N. Sugimoto, J. Am. Chem. Soc., 2006, 128, 7957–7963 CrossRef.
- K. Hirakawa, A. Suzuki, D. Ouyang, S. Okazaki, Y. Ibuki and J. Nakazaki, et al. , Chem. Res. Toxicol., 2019, 32, 1638–1645 Search PubMed.
Footnote |
| † Electronic supplementary information (ESI) available. See DOI: 10.1039/d0an01230k |
| This journal is © The Royal Society of Chemistry 2021 |