 Open Access Article
Creative Commons Attribution 3.0 Unported Licence
Multiscale understanding of electric polarization in poly(vinylidene fluoride)-based ferroelectric polymers†
Nan
Meng
 ab,
Xintong
Ren
 b,
Xiaojing
Zhu
 b,
Jiyue
Wu
 b,
Bin
Yang
 *c,
Feng
Gao
 d,
Han
Zhang
 b,
Yaozu
Liao
 a,
Emiliano
Bilotti
 b,
Michael J.
Reece
b and
Haixue
Yan
 *b
*b
aState Key Laboratory for Modification of Chemical Fibers and Polymer Materials, College of Materials Science and Engineering, Donghua University, Shanghai, 201620, P. R. China
bSchool of Engineering and Materials Science, Queen Mary University of London, Mile End Road, London E1 4NS, UK. E-mail: h.x.yan@qmul.ac.uk
cDepartment of Computer Science, Electronic and Electrical Engineering, Faculty of Science and Engineering, University of Chester, Thornton Science Park, CH2 4NU, UK. E-mail: b.yang@chester.ac.uk
dState Key Laboratory of Solidification Processing, School of Materials Science and Engineering, NPU-QMUL Joint Research Institute of Advanced Materials and Structure, Northwestern Polytechnical University, Xi’an, 710072, P. R. China
First published on 19th October 2020
Abstract
Poly(vinylidene fluoride) (PVDF) and PVDF-based copolymers with trifluoroethylene (PVDF-TrFE) have attracted considerable academic and industrial interest due to their ferroelectric properties, which are only present in very few polymers. However, the underlying fundamentals of molecular ordering and induced polarizations are complex and not fully understood. Herein, PVDF, PVDF-TrFE and their blends, prepared using melt extrusion and hot pressing, have been selected to obtain controlled case studies with well-defined chain ordering and microstructures. Impedance analysis and terahertz time-domain spectroscopy (THz-TDS) are exploited to investigate electric polarization in PVDF-based polymers at different length scales. The extruded ferroelectric films show in-plane chain orientation and higher domain wall density compared to hot pressed films with randomly-distributed polymer chains, which favors the polarization at low frequencies (Hz to MHz), as concluded from the higher dielectric constants and more prominent high electric field polarization switching features. However, the domain walls cannot respond at high frequencies, which leads to lower dielectric constants in the extruded films at THz frequencies.
Introduction
Poly(vinylidene fluoride) (PVDF) based polymers are candidate materials for applications in sensors and actuators,1,2 energy harvesting and storage3–5 and non-volatile memory devices6,7 because of their good dielectric, piezoelectric and ferroelectric properties. PVDF exhibits a complex structure with multiple crystalline polymorphs (α-, β-, γ- and δ-phase) along with the existence of amorphous regions arising from its semi-crystalline nature. The crystallographic data and the spontaneous polarization (Ps) calculated using a model of rigid dipoles for the different crystalline phases are summarized in Table 1.8,9 Of the four crystalline forms, the α-phase is non-polar due to the self-cancellation of dipoles arising from antiparallel adjacent chain packing, while the other three structures are polar. The β-phase shows the highest dipole moment (μ = 7 × 10⁻³⁰ C m) perpendicular to the chain axis (c-axis) and the best ferroelectric performance9 with a Ps of 0.13 C m−2. PVDF crystallizes into the α-phase when cooled from the melt. The β-phase is usually obtained after post-treatments of the as-formed α-phase, like solid-state drawing,8 solid-state pressure deformation10 and/or electric field poling (>500 kV mm−1).8 Poling at relatively low electric fields (∼170 kV mm−1![[thin space (1/6-em)]](https://www.rsc.org/images/entities/char_2009.gif) 11,12) can only transform the α-phase into the δ-phase. The γ-phase is usually obtained via solvent crystallization,13 or via re-crystallization at temperatures slightly above melting point14 or via the addition of fillers such as carbon-based materials.15
11,12) can only transform the α-phase into the δ-phase. The γ-phase is usually obtained via solvent crystallization,13 or via re-crystallization at temperatures slightly above melting point14 or via the addition of fillers such as carbon-based materials.15
| Unit cella | Space group | Molecul-ar chain | N a | μ per repeat unit per chaina (C m)8 | P s (C m−2) | |
|---|---|---|---|---|---|---|
| a c.a.: chain axis; Na: number of chains in a unit cell; μ: dipole moment; Ps: spontaneous polarization calculated on the model of rigid dipoles. | ||||||
| α-Phase | a = 4.96 Å | P21/c-C2h | TGTG′ | 2 | 4 × 10⁻³⁰ ⊥ c-axis; | Non-polar |
| b = 9.64 Å | ||||||
| c (c.a.) = 4.96 Å | 3.4 × 10⁻³⁰‖c-axis | |||||
| β = 90° | ||||||
| β-Phase | a = 8.58 Å | Cm2m-C2v | TTTT | 2 | 7.0 × 10⁻³⁰ ⊥ c-axis | 0.130 |
| b = 4.91 Å | ||||||
| c(c.a.) = 2.56 Å | ||||||
| γ-Phase | a = 4.96 Å | Cc-C s | T3GT3G′ | 2 | Similar to α-phase | 0.055 |
| b = 9.58 Å | ||||||
| c (c.a.) = 9.23 Å | ||||||
| β = 92.9° | ||||||
| δ-Phase | Essentially the same to α-phase | P21cn | TGTG′ | 2 | Similar to α-phase | 0.067 |
To achieve better dielectric and ferroelectric properties, the fundamental physics of crystalline polymorphism, dipole rotation and macroscopic ordering of molecules still need to be clarified. The anisotropy of the polarizability of PVDF-based materials at low frequencies (Hz to MHz) has been well studied,16–20 where films with in-plane distribution of polymer chains (c-axis) show relatively high dielectric constant (11–14 at 100 Hz) and low coercive field (30–70 kV mm−1 measured at 10 Hz), compared to films with randomly distributed polymer chains (dielectric constant: 7; coercive field: 260 kV mm−1), since the CH2–CF2 dipoles can respond easily to an applied external electric field. However, the dielectric polarization of PVDF-based polymers at high frequencies of terahertz (THz or 1012 Hz) arising from the contribution of local structures is rarely characterized and thereby not fully understood. The coherent terahertz time-domain spectroscopy (THz-TDS) can be implemented to detect the collaborative motions of large molecules, for instance, the intramolecular and/or intermolecular vibrations of polymer chains with molecular weights exceeding several hundreds of atomic mass units (equivalent to g mol−1).21–23 Accordingly, in this work, the THz-TDS spectroscopy combined with impedance analysis was utilized to characterize the real part of the dielectric permittivity and loss tangent and investigate the structural dependence of dielectric properties. Three different polymeric materials have been studied – PVDF, PVDF-TrFE and their blends with a mass ratio of 50/50 – as well as different processing methods – melt extrusion and hot pressing, which enabled the tailoring of chain ordering and microstructures.
Experimental
Film preparation
The PVDF (average molecular weight 530 kg mol−1) and PVDF-TrFE (molar ratio of VDF/TrFE 75/25) used in this work were purchased from Sigma Aldrich Chemical Co and Piezotech-Arkema, respectively. The extruded PVDF (melting temperature: ∼160 °C) and PVDF-TrFE (melting temperature: ∼150 °C) films were prepared using a Xplore Micro compounder MC-15-HT (Xplore Instruments BV, The Netherlands). They were extruded at 200 °C and 190 °C, respectively, and collected at room temperature with a film die of 200 μm thickness. The extruded blends of PVDF/PVDF-TrFE 50/50 wt% were also extruded at 200 °C. The hot-pressed PVDF and PVDF-TrFE films were compression molded at 200 °C and 180![[thin space (1/6-em)]](https://www.rsc.org/images/entities/char_2009.gif) °C, respectively, for 5
°C, respectively, for 5![[thin space (1/6-em)]](https://www.rsc.org/images/entities/char_2009.gif) minutes using a Collin hot press P300E (COLLIN Lab & Pilot Solutions GmbH, Germany). The hot-pressed blends were also prepared at 200 °C for 5 minutes. The pellets of PVDF/PVDF-TrFE 50/50 wt% were firstly extruded into strands before cutting into pellets.
minutes using a Collin hot press P300E (COLLIN Lab & Pilot Solutions GmbH, Germany). The hot-pressed blends were also prepared at 200 °C for 5 minutes. The pellets of PVDF/PVDF-TrFE 50/50 wt% were firstly extruded into strands before cutting into pellets.
Structure characterization
X-ray diffraction (XRD, X’Pert Pro, PANalytical, Almelo, The Netherlands) in the 2θ range of 5–70° with Cu/Kα (λ = 0.15418![[thin space (1/6-em)]](https://www.rsc.org/images/entities/char_2009.gif) nm) radiation was used to characterize the crystalline polymorphs. Differential scanning calorimetry (DSC, DSC 25, TA Instruments, Asse, Belgium) with a temperature range of 25–200 °C and a heating rate of 10 °C min−1 was used to analyse the thermal properties. Fourier-transform infrared spectroscopy (FTIR) (Tensor 27, Bruker Optik GmbH, Ettlingen, Germany) was used to complement and validate the phase identification of the polymer films both qualitatively and quantitatively. The preferred orientation of the polymer chains was characterized using two-dimensional X-ray diffraction (2D-XRD) ring patterns (Kappa ApexII Duo, Bruker AXS GmbH, Karlsruhe, Germany), which were obtained using Cu/Kα (λ = 0.15418
nm) radiation was used to characterize the crystalline polymorphs. Differential scanning calorimetry (DSC, DSC 25, TA Instruments, Asse, Belgium) with a temperature range of 25–200 °C and a heating rate of 10 °C min−1 was used to analyse the thermal properties. Fourier-transform infrared spectroscopy (FTIR) (Tensor 27, Bruker Optik GmbH, Ettlingen, Germany) was used to complement and validate the phase identification of the polymer films both qualitatively and quantitatively. The preferred orientation of the polymer chains was characterized using two-dimensional X-ray diffraction (2D-XRD) ring patterns (Kappa ApexII Duo, Bruker AXS GmbH, Karlsruhe, Germany), which were obtained using Cu/Kα (λ = 0.15418![[thin space (1/6-em)]](https://www.rsc.org/images/entities/char_2009.gif) nm) radiation with the incident beam normal to the surface of polymer samples. The morphology of film surface was characterized using scanning electron microscopy (SEM) (FEI Inspector-F, The Netherlands).
nm) radiation with the incident beam normal to the surface of polymer samples. The morphology of film surface was characterized using scanning electron microscopy (SEM) (FEI Inspector-F, The Netherlands).
Ferroelectric and dielectric properties measurement
The ferroelectric properties were tested using a triangle waveform at a frequency of 10 Hz on a ferroelectric hysteresis tester (NPL, Teddington, UK) with a maximum applied voltage of 10 kV.24 Electrodes were prepared using gold sputtering with a diameter of 2 mm. The frequency dependent dielectric permittivity in the range of 100 Hz to 100 MHz was measured using an impedance analyzer (4294A, Agilent, Santa Clara, CA) with an applied voltage of 0.5 V at room temperature. The THz-TDS spectra (TeTechS Ltd, Ontario, Canada) were measured using a transmission mode from 0.5 THz to 2 THz at room temperature with an extremely low humidity <0.3%, controlled through a nitrogen purge. The parameter extraction involves a transmitted Fourier transformed pulse waveform recording the temporal response of the THz reference pulse as a function of time delay. More details about the set-up of THz-TDS can refer to our previous work.25Results and discussion
Structure determination
Fig. 1 shows the structural characterization for the films using X-ray diffraction (XRD) and differential scanning calorimetry (DSC). PVDF films mainly crystallize into α-phase, as concluded from the presence of peaks at 17.8°, 18.4° and 20.0°, resulting from the reflections of (100)α-PVDF, (020)α-PVDF and (110)α-PVDF, respectively, and the absence of β-phase characteristic peaks at 20.8° (110)/(200)β-PVDF and 36.5° (020)/(101)β-PVDF (Fig. 1a).26 The PVDF-TrFE films show strong peaks assigned to the reflections of (110)/(200)β-PVDF-TrFE, which is at a lower angle of 20.0° compared to 20.8° of β-PVDF due to the enlarged inter-chain lattice spacing arising from the incorporation of another large fluorine atom in the TrFE unit.27 The blends of PVDF/PVDF-TrFE 50/50 wt% exhibit superimposed peaks at 17.8°, 18.4° and 20.0°, which confirms the presence of both α- and β-phase. Fourier-transform infrared spectroscopy (FTIR) can also be used to confirm the crystalline phases (Fig. S1 and Table S1, ESI†). All of the peaks reflected from the (hk0) crystal planes (parallel to c-axis) can be clearly seen in both the extruded and hot-pressed films. However, the peaks at 26.6° (021)α, 38.9° (002)/(131)α, and (111)/(201)β-PVDF-TrFE are only evident in the hot-pressed films, and not in the extruded films, which highlights the high degree of in-plane orientation of c-axis (polymer chains) and out-of-plane distribution of CF2 dipole moments in the extruded films.28,29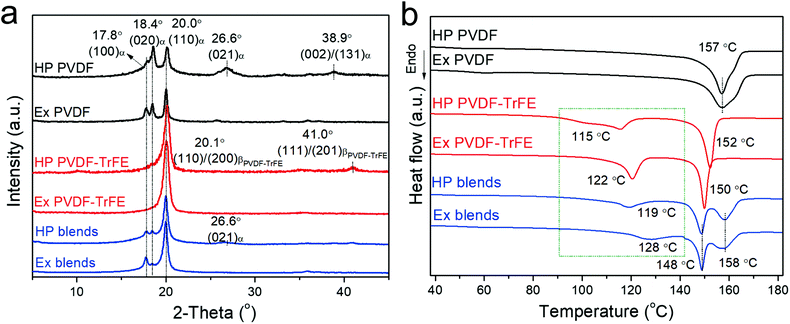 | ||
| Fig. 1 Structural characterization of films processed via melt-extrusion (Ex) and hot-compression (HP): (a) XRD and (b) DSC. | ||
Fig. 1b shows the DSC data for the polymer films (summarized in Table S1, ESI†). The hot-pressed and extruded PVDF films showed similar main melting temperature peaks (∼157 °C). The extruded PVDF-TrFE has a sharper Curie transition peak (Tc) at a higher temperature (∼122 °C) compared to HP films (∼115 °C), which is consistent with the temperature dependence of dielectric permittivity showing slightly diffuse Curie transition in the hot-pressed films but narrower transition peaks in the extruded films (Fig. S2, ESI†). The Tc of PVDF-based ferroelectric polymers can be predicted from the dipolar energy (WD), which is determined by the saturation polarization (Po) linked to the dipole moment in a monomer (μ) and the primitive cell volume at 0 K (ν0K),30 as shown in eqn (1), where κB is the Boltzmann constant.
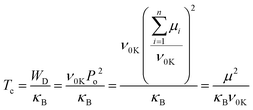 | (1) |
The higher Tc in extruded PVDF-TrFE is ascribed to an enhanced dipole moment arising from a more regular and highly orientated chain packing.6 This is confirmed by the morphology characterization and 2D-XRD patterns (Fig. S3, ESI†), which show that the extruded PVDF-TrFE films exhibited well aligned lamellae, with the polymer chains (c-axis) oriented along the extrusion direction. Similar results were also observed in the extruded blends (Fig. 1b and Fig. S3, ESI†), with a higher Tc (∼128 °C) compared to hot-pressed films (∼119 °C). The Tc of the blends is higher compared to pure PVDF-TrFE, suggesting the formation of polar crystals with higher polarity in the blends.31
Ferroelectric properties
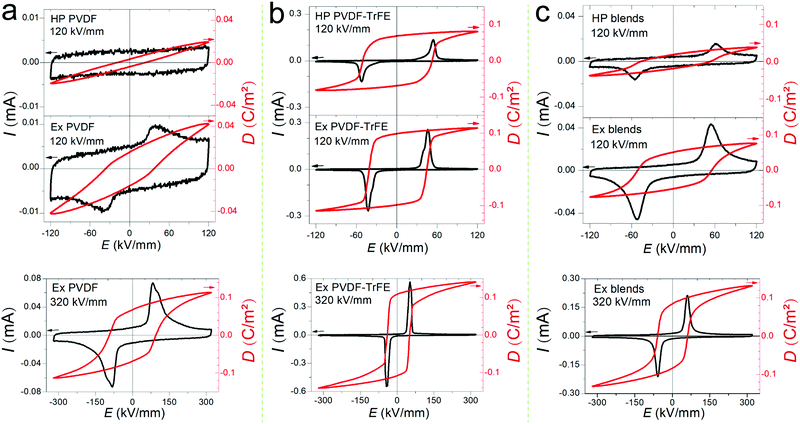
Fig. 2 shows the ferroelectric displacement (D–E) hysteresis loops (10 Hz) of the polymer films along with the original plots of the current–electric field (I–E) loops. The I–E and D–E loops measured at 120 kV mm−1 were used to compare the hot-pressed and extruded films, since the hot-pressed films (thickness: ∼80 μm) could only be tested at low electric fields (<130 kV mm−1) due to the limited applied voltage of the ferroelectric tester (10 kV), while the ferroelectric properties of the extruded films can be measured at 320 kV mm−1. Both the hot-pressed and the extruded PVDF films present weak ferroelectric switching at 120 kV mm−1, while the extruded PVDF films show clear ferroelectric switching at 320 kV mm−1 with a remnant polarization (Pr) of 0.067 C m−2 and a coercive field (Ec) of 100 kV mm−1 (Fig. 2a). The extruded PVDF-TrFE films show higher switching current density compared to the hot-pressed PVDF-TrFE films at the same field of 120 kV mm−1 (Fig. 2b), which indicates a higher domain wall density in the extruded PVDF-TrFE films linked to their highly ordered chain packing. The extruded PVDF-TrFE shows a Pr of 0.108 C m−2 and an Ec of 50 kV mm−1 at 320 kV mm−1 (Fig. 2b). The higher Pr in the extruded PVDF-TrFE is a result of highly crystalline β-phase (∼74% in Table S1, ESI†) compared to the extruded PVDF films (∼42% in Table S1, ESI†). Simulation studies reveal that the dipole moment of monomers will experience a 50% increase when separate chains are put together to build up a crystal due to the local electric field produced by neighbouring chains,32,33 which contributes to an enhanced Ps. Therefore, the highest values of Pr can be roughly estimated with respect to Ps and degree of crystallinity (η) using Pr = Ps × η, and the values for PVDF and PVDF-TrFE are 0.080 C m−2 and 0.118 C m−2, respectively. These values coincide with the measured values of the extruded films. The high degree of in-plane chain (c-axis) orientation confines the CH2–CF2 dipole moments in a plane parallel to the external electric field and eases the alignment of dipoles along electric field. The blends show intermediated ferroelectric properties, with a Pr slightly higher than the value of 0.083 C m−2 calculated by rules-of-mixtures.Frequency dependence of dielectric permittivity
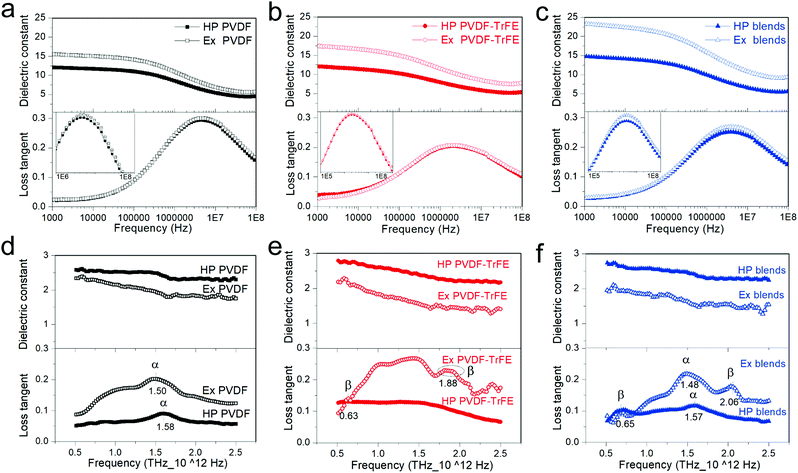
Fig. 3 shows the frequency dependence of dielectric spectra in the frequency range of 1 kHz–100 MHz (Fig. 3a–c) and 0.5–2.5 THz (Fig. 3d–f). No difference was observed in the THz-TDS spectra during the 90° rotation of samples (Fig. S4, ESI†). The dielectric permittivity is strongly dependent on the frequency of the alternating electric field, being linked to the response time of the different polarization mechanism, which include electronic polarization (1015–1018 Hz), vibrational or atomic polarization (1012–1015 Hz), dipolar orientation polarization (∼between 100 Hz to a few GHz) and interfacial polarization.34 Below 1 kHz, there can be a significant influence of conductivity on the frequency dependence of dielectric permittivity.35 Particularly for ferroelectric materials, the spontaneous polarization gives rise to either local polar structures or long range domains, which contributes to the dielectric permittivity.36 The hot-pressed PVDF and extruded PVDF films mainly crystallized into α-phase, therefore, the dielectric polarization of PVDF (PPVDF) can be written as:| PPVDF = ηPdip.C + (1 − η)Pdip.A + Pe. + Pat. | (2) |
Analogously, the dielectric polarization of hot-pressed and extruded copolymer PVDF-TrFE (Pco) can be described in eqn (3) with the additional ferroelectric contribution of Ps in the unit cell and the formed local polar structures (LP) containing several unit cells and domain walls (DW) related to long range ordered ferroelectric domains:
| Pco = η(Pdip.C + Ps + LP + DW) + (1 − η)Pdip.A + Pe + Pat. | (3) |
PVDF-TrFE has smaller content of amorphous region because of its higher η and shows relatively low intensity of relaxation loss peak at frequencies from 400 kHz to 100 MHz, a relaxation process originating from the dipoles in the amorphous region (αa relaxation).37 Despite the high η, PVDF-TrFE exhibit similar dielectric constant compared to PVDF, being ascribed to the additional contribution of Ps, LP and DW within the crystalline regions. A high domain wall density in extruded PVDF-TrFE films, as indicated by the high switching current density (at 10 Hz in Fig. 2), also contributes to an enhanced dielectric constant.
Compared to pure polymers, the blends show higher dielectric constant, ∼15 for hot-pressed and 22 for extruded films (at 1 kHz in Fig. 3c). Blends have lower η and higher Tc compared to PVDF-TrFE (Table S1, ESI†). A low η enhances Pdip.A in the amorphous region. A high Tc is linked to a stronger polar structure that emphasizes the Ps contribution. It is worth noting that for each film, the extruded samples show slightly higher dielectric loss during αa relaxation18 (insets of Fig. 3a–c), which highlights a higher mobility of dipoles in the amorphous region of extruded films.
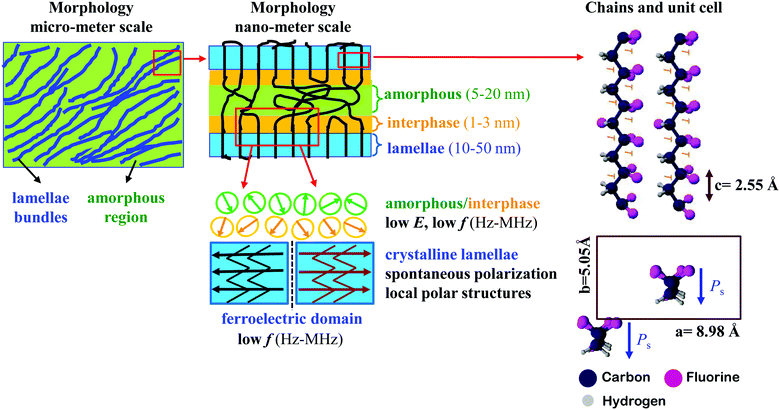
The dipole relaxation does not occur at frequencies beyond GHz, which explains the low dielectric constant for all of the samples in the THz region (∼1–3 in Fig. 3d–f) due to the elimination of the Pdip.A. However, Pe., Pat., Ps and LP contribute to the dielectric properties of PVDF-TrFE at high frequencies.25 The extruded PVDF-TrFE films were chosen as a model to describe the structure and polarization specifications since they crystallize into oriented β-phase crystals (Fig. 4) and displays lamellae bundle morphology at micro-meter scale, as evidenced by SEM image (Fig. S3, ESI†), which consists of lamellae crystallites and alternating interfacial and amorphous region. The crystalline lamellae are several microns broad38 and 10–50 nm thick.39,40 Precise quantitative description of amorphous region remains difficult, however, the thickness of amorphous region is evaluated to be 5–20 nm.39,41 It is not reasonable for the transition from ordered crystalline to completely random amorphous region to be abrupt. The thickness of the necessarily existing interfacial region is theoretically expected42 and experimentally confirmed43 to be 1–3 nm. A high Mw, hence averagely longer chains, increases the interfacial free energy related to the crystal basal plane and gives rise to a thicker interfacial region.38 Therefore, substantial Pdip. is generated from the interphase or amorphous dipoles. More importantly, the oriented crystals in extruded samples would make some chains in the amorphous region align along the extrusion direction, which enlarges the interfacial region and further enhances the dielectric permittivity at low frequencies (Hz–MHz). The all-trans chain conformation results in the CH2–CF2 and CHF–CF2 dipoles positioning perpendicular to chain backbone (Fig. 4) and generating Ps along b-axis in a unit cell. The crystalline dipoles are stacked to constitute domains in PVDF-TrFE with an average size of 20–40 nm.44,45 The domain walls are reported to be several nano-meters wide.45 The polarization reversal of PVDF-TrFE is proposed to be accomplished by the successive 60° rotation of crystalline dipoles (b-axis) about chain axis (c-axis) with the domain wall progressing through the rotation of molecular chains in the a–b plane of lamellae crystallites.46 This highlights the importance of in-plane orientation of chain axis and explains the large polarization of extruded films at high electric fields (Fig. 2). The extruded films have more defects because of the shear force working on melt flow during processing, which contributes to a higher domain wall density compared to the hot-pressed films and leads to a low coercive field and high dielectric permittivity at low frequencies (∼0.1 Hz–104 Hz). However, domain walls cannot follow THz frequencies because of their long relaxation time,47 which leads to a low dielectric constant at high frequencies in extruded films compared to hot-pressed films. Pe. and Pat. are due to the vibrations of electron or atoms, and they are highly active when the frequency of applied voltage is close to the intrinsic frequency of oscillation34 (such as the stretching, torsion, bending, and/or wagging of consecutive chain segments) or libration.48 Consequently, the frequency dependence spectra of dielectric permittivity at THz (Pe. and Pat. dominated) show specific peaks (loss tangent data in Fig. 3d–f) and can be used as a reference for the phase identification of PVDF-based materials.25 The loss peak at about 1.50–1.60 THz is a libration lattice mode in α-PVDF. The peaks at ∼0.63 THz and 2.10 THz are generally considered as β-characteristic, which arises from the librational lattice mode around the polymer chain c-axis and the pure translation along the crystallographic a-axis.49–51 PVDF films showed the absence of peaks at 0.63 THz and 2.10 THz due to the main crystallization of α-phase. The hot-pressed PVDF-TrFE films showed a rather broad feature over the whole frequency range and the extruded films exhibited a weak peak at 0.63 THz and a broad peak at ∼1.88 THz, which suggests a reduced long distance order of molecular chains,49 being a result of a high content of TrFE monomer (25 mol%). The blends clearly display characteristic β-PVDF peaks at ∼0.65 THz and 2.06 THz, which demonstrates that the existence of PVDF-TrFE promotes the formation of β-phase in PVDF.
Conclusions
In conclusion, the structure dependent dielectric properties of PVDF-based films were studied using THz-TDS technique combined with impedance analysis. The crystalline structure of films was tailored using different materials – PVDF, PVDF-TrFE and their blends with a mass ratio of 50/50 – and different processing routes – melt-extrusion and hot compression. It was observed that the extruded ferroelectric films possess in-plane orientation of polymer chains, aligned crystalline lamellae and higher domain wall density. This favours the polarization and ferroelectric switching at low frequencies (Hz to MHz), leading to higher dielectric constants and obvious ferroelectric switching features in extruded films. However, at THz range (0.5–2.5 THz), the extruded ferroelectric films showed lower dielectric constant compared to hot-pressed films, being a consequence of eliminating domain wall motion at high frequencies. Moreover, the THz-TDS spectra clearly show the characteristic peak of β-PVDF in blended films, which outperforms FTIR and XRD since they cannot distinguish between β-PVDF and β-PVDF-TrFE in the blended films.Conflicts of interest
There are no conflicts to declare.Acknowledgements
The authors would like to thank the financial support of Engineering and Physical Sciences Research Council (EPSRC) (MASSIVE Project, EP/L017695/1) and National Natural Science Foundation of China (52073046). Xintong Ren (201606280030) and Dr Jiyue Wu (201506630005) were financially supported by the China Scholarship Council.Notes and references
- N. R. Alluri, A. Chandrasekhar, J. H. Jeong and S.-J. Kim, J. Mater. Chem. C, 2017, 5, 4833–4844 RSC.
- Q. Li, W. Ke, T. Chang and Z. Hu, J. Mater. Chem. C, 2019, 7, 1532–1543 RSC.
- D. Zabek, K. Seunarine, C. Spacie and C. Bowen, ACS Appl. Mater. Interfaces, 2017, 9, 9161–9167 CrossRef CAS.
- X. Ren, N. Meng, H. Zhang, J. Wu, I. Abrahams, H. Yan, E. Bilotti and M. J. Reece, Nano Energy, 2020, 72, 104662 CrossRef CAS.
- Q. Shi, J. Sun, C. Hou, Y. Li, Q. Zhang and H. Wang, Adv. Fiber Mater., 2019, 1, 3–31 CrossRef.
- Z. Fu, W. Xia, W. Chen, J. Weng, J. Zhang, J. Zhang, Y. Jiang and G. Zhu, Macromolecules, 2016, 49, 3818–3825 CrossRef CAS.
- S. J. Kang, I. Bae, Y. J. Shin, Y. J. Park, J. Huh, S.-M. Park, H.-C. Kim and C. Park, Nano Lett., 2011, 11, 138–144 CrossRef CAS.
- A. J. Lovinger, Science, 1983, 220, 1115–1121 CrossRef CAS.
- T. Furukawa, Phase Trans., 1989, 18, 143–211 CrossRef CAS.
- N. Meng, X. Ren, G. Santagiuliana, L. Ventura, H. Zhang, J. Wu, H. Yan, M. J. Reece and E. Bilotti, Nat. Commun., 2019, 10, 4535 CrossRef.
- M. Li, H. J. Wondergem, M.-J. Spijkman, K. Asadi, I. Katsouras, P. W. M. Blom and D. M. de Leeuw, Nat. Mater., 2013, 12, 433 CrossRef CAS.
- J. Martín, D. Zhao, T. Lenz, I. Katsouras, D. M. de Leeuw and N. Stingelin, Mater. Horiz., 2017, 4, 408–414 RSC.
- R. Gregorio, Jr. and M. Cestari, J. Polym. Sci., Part B: Polym. Phys., 1994, 32, 859–870 CrossRef.
- M. Wang, S. Wang, J. Hu, H. Li, Z. Ren, X. Sun, H. Wang and S. Yan, Macromolecules, 2020, 53, 5971–5979 CrossRef CAS.
- S. Barrau, A. Ferri, A. Da Costa, J. Defebvin, S. Leroy, R. Desfeux and J.-M. Lefebvre, ACS Appl. Mater. Interfaces, 2018, 10, 13092–13099 CrossRef CAS.
- N. Meng, R. Mao, W. Tu, X. Zhu, R. M. Wilson, E. Bilotti and M. J. Reece, Polymer, 2016, 100, 69–76 CrossRef CAS.
- F. Guan, J. Pan, J. Wang, Q. Wang and L. Zhu, Macromolecules, 2010, 43, 384–392 CrossRef CAS.
- M. Yuan, B. Li, S. Zhang, R. Rajagopalan and M. T. Lanagan, ACS Appl. Polym. Mater., 2020, 2, 1356–1368 CrossRef CAS.
- N. Meng, X. Zhu, R. Mao, M. J. Reece and E. Bilotti, J. Mater. Chem. C, 2017, 5, 3296–3305 RSC.
- X. Ren, N. Meng, H. Yan, E. Bilotti and M. J. Reece, Polymer, 2019, 168, 246–254 CrossRef CAS.
- P. U. Jepsen, D. G. Cooke and M. Koch, Laser Photonics Rev., 2011, 5, 124–166 CrossRef CAS.
- J. Tang, B. Yang, I. Llewellyn, R. R. Cutler and R. S. Donnan, Chem. Phys. Lett., 2014, 592, 302–306 CrossRef CAS.
- B. Guzelturk, R. A. Belisle, M. D. Smith, K. Bruening, R. Prasanna, Y. Yuan, V. Gopalan, C. J. Tassone, H. I. Karunadasa, M. D. McGehee and A. M. Lindenberg, Adv. Mater., 2018, 30, 1704737 CrossRef.
- H. Yan, F. Inam, G. Viola, H. Ning, H. Zhang, Q. Jiang, T. Zeng, Z. Gao and M. J. Reece, J. Adv. Dielect., 2011, 01, 107–118 CrossRef CAS.
- J. Wu, W. Sun, N. Meng, H. Zhang, V. Koval, Y. Zhang, R. Donnan, B. Yang, D. Zhang and H. Yan, Adv. Electron. Mater., 2020, 6, 1901373 CrossRef CAS.
- P. Martins, A. C. Lopes and S. Lanceros-Mendez, Prog. Polym. Sci., 2014, 39, 683–706 CrossRef CAS.
- F.-C. Sun, A. M. Dongare, A. D. Asandei, S. Pamir Alpay and S. Nakhmanson, J. Mater. Chem. C, 2015, 3, 8389–8396 RSC.
- N. Meng, R. Mao, W. Tu, K. Odolczyk, Q. Zhang, E. Bilotti and M. J. Reece, Polymer, 2017, 121, 88–96 CrossRef CAS.
- R. Mao, N. Meng, W. Tu and T. Peijs, Cellulose, 2017, 24, 4627–4639 CrossRef CAS.
- J. Lajzerowicz and J.-F. Legrand, Phys. Rev. B: Condens. Matter Mater. Phys., 1978, 17, 1438–1444 CrossRef CAS.
- E. Bellet-Amalric and J. F. Legrand, Eur. Phys. J. B, 1998, 3, 225–236 CrossRef CAS.
- S. M. Nakhmanson, M. B. Nardelli and J. Bernholc, Phys. Rev. B: Condens. Matter Mater. Phys., 2005, 72, 115210 CrossRef.
- J. D. Carbeck, D. J. Lacks and G. C. Rutledge, J. Chem. Phys., 1995, 103, 10347–10355 CrossRef CAS.
- L. Zhu and Q. Wang, Macromolecules, 2012, 45, 2937–2954 CrossRef CAS.
- D. P. Almond and C. R. Bowen, J. Phys. Chem. Lett., 2015, 6, 1736–1740 CrossRef CAS.
- E. Buixaderas, V. Bovtun, M. Kempa, D. Nuzhnyy, M. Savinov, P. Vanek, I. Gregora and B. Malic, Phys. Rev. B, 2016, 94, 054315 CrossRef.
- L. Yang, J. Ho, E. Allahyarov, R. Mu and L. Zhu, ACS Appl. Mater. Interfaces, 2015, 7, 19894–19905 CrossRef CAS.
- L. Mandelkern, Acc. Chem. Res., 1990, 23, 380–386 CrossRef CAS.
- P. J. Flory, D. Y. Yoon and K. A. Dill, Macromolecules, 1984, 17, 862–868 CrossRef CAS.
- B. Lotz, T. Miyoshi and S. Z. D. Cheng, Macromolecules, 2017, 50, 5995–6025 CrossRef CAS.
- L. Mandelkern, Faraday Discuss. Chem. Soc., 1979, 68, 310–319 Search PubMed.
- S. K. Kumar and D. Y. Yoon, Macromolecules, 1989, 22, 3458–3465 CAS.
- L. Mandelkern, R. G. Alamo and M. A. Kennedy, Macromolecules, 1990, 23, 4721–4723 CrossRef CAS.
- P. Sharma, T. J. Reece, S. Ducharme and A. Gruverman, Nano Lett., 2011, 11, 1970–1975 CrossRef CAS.
- P. Sharma, T. Reece, D. Wu, V. M. Fridkin, S. Ducharme and A. Gruverman, J. Phys.: Condens. Matter, 2009, 21, 485902 CrossRef CAS.
- T. Furukawa, T. Nakajima and Y. Takahashi, IEEE Trans. Dielectr. Electr. Insul., 2006, 13, 1120–1131 CrossRef CAS.
- P. S. Bednyakov, B. I. Sturman, T. Sluka, A. K. Tagantsev and P. V. Yudin, npj Comput. Mater., 2018, 4, 65 CrossRef.
- S. Wietzke, C. Jansen, M. Reuter, T. Jung, D. Kraft, S. Chatterjee, B. M. Fischer and M. Koch, J. Mol. Struct., 2011, 1006, 41–51 CrossRef CAS.
- M. Latour and R. L. Moreira, J. Polym. Sci., Part B: Polym. Phys., 1987, 25, 1719–1723 Search PubMed.
- M. Kobayashi, K. Tashiro and H. Tadokoro, Macromolecules, 1975, 8, 158–171 CrossRef CAS.
- M. Latour and R. L. Moreira, J. Polym. Sci., Part B: Polym. Phys., 1987, 25, 1913–1921 CrossRef CAS.
Footnote |
| † Electronic supplementary information (ESI) available. See DOI: 10.1039/d0tc04310a |
| This journal is © The Royal Society of Chemistry 2020 |

