
 Open Access Article
 This Open Access Article is licensed under a Creative Commons Attribution-Non Commercial 3.0 Unported Licence
Ladder-type bithiophene imide-based organic semiconductors: understanding charge transport mechanisms in organic field effect transistors†
Alexandra
Harbuzaru
 *a,
Iratxe
Arrechea-Marcos
a,
Alberto D.
Scaccabarozzi
b,
Yingfeng
Wang
c,
Xugang
Guo
c,
Mario
Caironi
*b,
J. Teodomiro
López Navarrete
a,
M. Carmen
Ruiz Delgado
a and
Rocío
Ponce Ortiz
*a
*a,
Iratxe
Arrechea-Marcos
a,
Alberto D.
Scaccabarozzi
b,
Yingfeng
Wang
c,
Xugang
Guo
c,
Mario
Caironi
*b,
J. Teodomiro
López Navarrete
a,
M. Carmen
Ruiz Delgado
a and
Rocío
Ponce Ortiz
*a
aDepartment of Physical Chemistry, University of Málaga, Campus de Teatinos s/n, Málaga 29071, Spain. E-mail: harbuzaru@uma.es; rocioponce@uma.es
bCenter for Nano Science and Technology @ PoliMi, Istituto Italiano di Tecnologia, via Pascoli 70/3, 20133 Milano, Italy. E-mail: mario.caironi@iit.it
cDepartment of Materials Science and Engineering, South University of Science and Technology (SUSTech), No. 1088, Xueyuan Road, Shenzhen, Guangdong 518055, China
First published on 24th September 2020
Abstract
Here we have investigated the influence of the molecular length and structure of a series of BTI-based semiconductors on the stabilization of charged states in solution by in situ UV/Vis/NIR spectroelectrochemistry and in the solid state, at the active interface of operational OFET devices, by charge modulation spectroscopy (CMS). Interestingly, we found that charge stabilization in the shortest system of the series (BTI2) is strongly favored via a π-dimer formation which, in addition to higher thin film microstructural ordering, results in a greater electron mobility in organic field effect transistors (OFETs). The experimental results were interpreted using TD-DFT and DFT quantum chemical calculations at different levels of theory.
Introduction
Organic semiconductors have aroused an ongoing interest for their use in electronic devices such as organic field-effect transistors (OFETs),1 organic solar cells (OPV)2,3 and organic light-emitting diodes (OLEDs),4–6 driven by the advantages of low-cost, light-weight, and mechanical flexibility.7,8 The electronic performance of these organic devices is mainly determined by the chemical structure of the π-conjugated material, its purity, supramolecular organization and film morphology.9–11 Therefore, an adequate understanding of the molecular structure–transport property relationship is required in order to develop new high mobility semiconductors.2,7,12 Ladder-type molecules with highly planar backbones and well delocalized π-conjugation have attracted intensive attention as organic semiconductors due to their excellent performance in electronic devices.13 The most promising ladder-type organic semiconductors are large acenes, such as pentacene which show extraordinary hole mobility in OFETs.14 Nevertheless, larger acenes, such as hexacenes and heptacenes show poor ambient stability due to their high-lying HOMO energy levels, which dramatically limits their application in organic electronics.13,15 Another kind of ladder-type semiconductor, the [n]thienoacenes,15–17 exhibits improved air stability compared with large acenes; however a significantly lowered hole mobility was obtained in this case. Therefore, the combination of acenes and [n]thienoacenes gives rise to ladder-type benzothiophene heteroarenes such as benzothienobenzothiophene (BTBT)18–20 and dinaphthothienothiophene (DNTT),21 which exhibit remarkable mobility with excellent OFET stability. It is well known that most ladder-type molecules typically exhibit electron-rich characteristics (hole-transporting semiconductors); however, the synthesis of the electron-deficient analogues (electron-transporting semiconductors) is far more challenging given the existence of a high-density π-electron cloud within the aromatic skeleton. Previous studies have suggested that the substitution of hole-transporting semiconductors with electron-withdrawing groups (F, CN)22–25 is an efficient approach to obtain electron-transporting organic semiconductors; however this remains a great challenge mainly due to the reduced chemical reactivity and unfavored steric hindrance created by typical electron-withdrawing substituents.13 Therefore, it is essential to develop electron-deficient ladder-type π-conjugated systems in order to obtain donor–acceptor semiconductors. Imide-functionalized arenes are highly promising π-conjugated materials.8,26 The bithiophene imide (BTI) was first synthesized as an electron-deficient unit by Marks et al.,27 and its incorporation into polymers affords a series of semiconductors with remarkable performance in OFETs10,11 and OPVs.28 However, the relationship between device performance and the specific chemical structure is not yet fully understood owing to the limited knowledge of charge transport mechanisms in organic materials. The latter is indeed essential in the pursuit of new materials with improved structure–property relationships.New organic materials based on imide-functionalized ladder-type heteroarenes (BTI2–BTI5, Fig. 1) with high field-effect electron mobilities (μ), close to 0.1 cm2 V−1 s−1, were recently synthesized.10,11 Ladder-type heteroarenes present highly planar backbones with large π-conjugation lengths, which leads to reduced bandgaps. These characteristics result in enhanced intrinsic intramolecular charge transport and closer π-stacking between neighboring molecules, which further benefits intermolecular charge transport.13 Despite the high planarity and encouraging electron mobility of these BTI-fused heterocycles in OFETs, a significant decrease of the charge transport properties occurred upon increasing the building block length, which was an unexpected result. One of the reasons for this behavior could be related to the reduced molecular mobility in the solid-state as the repeated unit is extended, leading to poorer self-assembly and lower degree of film crystallinity.10,11
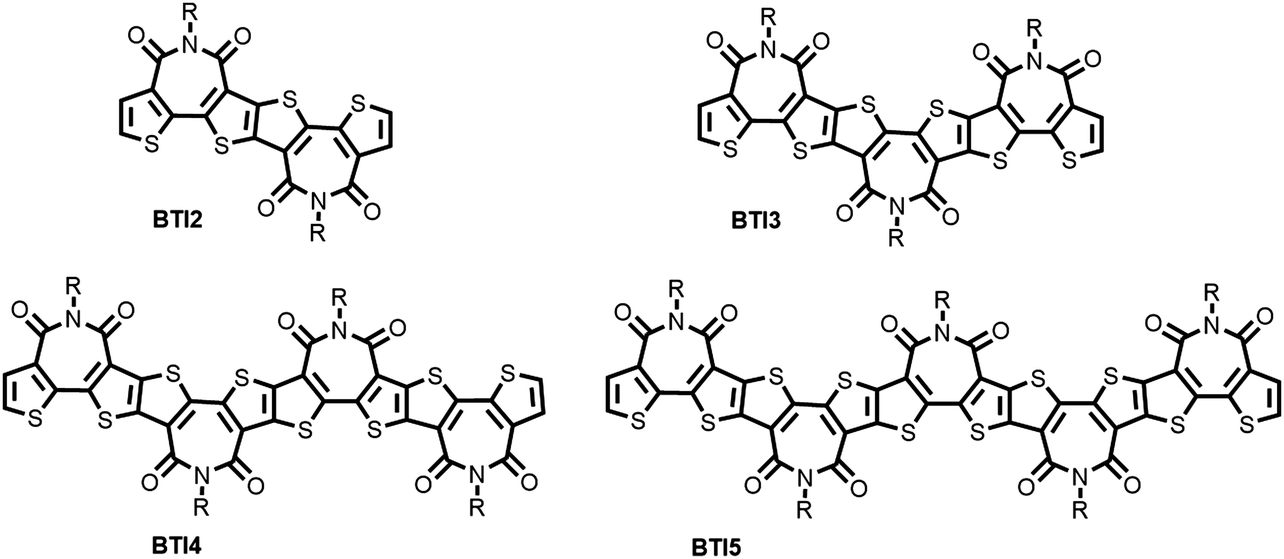 | ||
| Fig. 1 Chemical structures of the imide-functionalized ladder-type heteroarenes BTI2–BTI5 with varied conjugation lengths. | ||
Herein, we further investigate the reason for the decreasing electron mobility on going from BTI2 to BTI5 by studying the charge transport mechanism through these ladder-type all-acceptor heteroarenes. This mechanism is found to be strongly influenced by π-dimerization reactions of radical ions which are well-suited as models to study intermolecular spatial charge delocalization in conjugated materials.29–31 Up to now, the π-dimerization reactions of radical cations have been well investigated;32–34 nevertheless studies related to the intermolecular dimerization of radical anions are still limited.31 In order to address the latter, we investigate the π-dimerization process of the BTI2–BTI5 radical anions in both solution and solid-state, and its effect on charge transport mechanisms. As a result, we show how intra- and interchain interactions between charged extended π-systems are affected by the length of the BTI unit and hence play a crucial role in the charge transport properties of the corresponding thin films.
To this end, we made use of a combined experimental/theoretical approach that links in situ spectroelectrochemistry (UV/Vis/NIR) and charge modulation spectroscopy (CMS) with density functional theory (DFT) calculations. Time-dependent (TD) DFT calculations successfully provide a reliable assignment of the electronic absorption spectra of the π-dimerization products, thus greatly facilitating the identification of their nature and structure.34
Results and discussion
Optical properties of the neutral species
The optical properties of these ladder-type small molecules were investigated by measuring their ultraviolet-visible (UV-Vis) absorption spectra (Fig. 2),10,11 which highlight the tendency of these fused molecules to form aggregates, both in solution and film states. The aggregation processes play a very important role in the charge transport mechanism.35–37 Therefore, understanding how these highly planar molecules organize in the solid state and how this affects the charge transfer processes and stabilization of charged states in organic thin-layers, could help us to shed light on charge transport mechanisms in electronic devices. | ||
| Fig. 2 UV/Vis spectra of BTI2–BTI5 in (a) 2-methyl tetrahydrofuran at room temperature and (b) low temperature, (c) chlorobenzene at 373 K, (d) films (3 mg ml−1 in chloroform) deposited by spin-coating. (e–h) Heating and cooling down processes of BTI2–BTI5 in 2-methyl tetrahydrofuran. | ||
The UV-Vis optical absorption spectra of the bithienoimide compounds BTI2–BTI5 in 2-methyl tetrahydrofuran at room temperature are displayed in Fig. 2a. The spectra show a two structured peak profile with different relative intensities depending on the chain length. The maximum absorption peak (λmax) is bathochromically shifted as the chain length increases on going from 445 nm for BTI2 to 532 nm for BTI5, in line with the extension of the π-conjugation core in BTI5. The same applies to the spectra recorded at low temperature (Fig. 2b), at 373 K (Fig. 2c) and recorded for thin films (Fig. 2d). In the film state, all the compounds show a red-shifted absorption peak in comparison with their solution, but also a broadened absorption band, suggesting more extensive aggregation.
The detailed analysis of the relative intensities of the two recorded absorption peaks shows similar spectral profiles for the four compounds at 373 K (Fig. 2c), the low energy band being the most intense in all the systems, whereas a much broader absorption profile with the reverse intensity pattern is recorded for BTI4 and BTI5 at room temperature (Fig. 2a), indicating the formation of aggregates. The temperature dependent electronic absorption spectra (Fig. 2e–h) recorded in 2-methyltetrahydrofuran help us to further understand the molecular aggregation. In this case, significant changes in the absorption spectra were observed for the BTI3 semiconductor; a relative intensity swap of the absorption bands was found, as well as a slightly red-shifted broadening of the band upon cooling, highlighting the high tendency of BTI3 to form aggregates at low temperature, even in diluted solutions. On the contrary, the spectrum of BTI2 shows only a slightly red-shifted broadening of the band with the temperature, remaining basically unaltered throughout the whole temperature range analyzed, which means that BTI2 does not tend to easily form aggregates in low-concentration solutions. The absorption spectra for the longest systems, at low temperature, also show a noticeable broadening of the band and the appearance of a low-energy shoulder similar to that registered in thin film spectra, thus being in agreement with the formation of aggregates. In this case the spectrum at low temperature is quite similar to that at room temperature, indicating that aggregates are easily formed in these compounds even at low concentrations and room temperature.10,38
Experimental and theoretical study of charged species in solution
In order to analyze charge species and their aggregation, Fig. 3 shows, as an example, the evolution of the UV/Vis/NIR spectra obtained by progressive spectroelectrochemical reduction of a low concentration solution of BTI2–BTI5 in the presence of a high excess of supporting electrolyte ((n-Bu)4NPF6).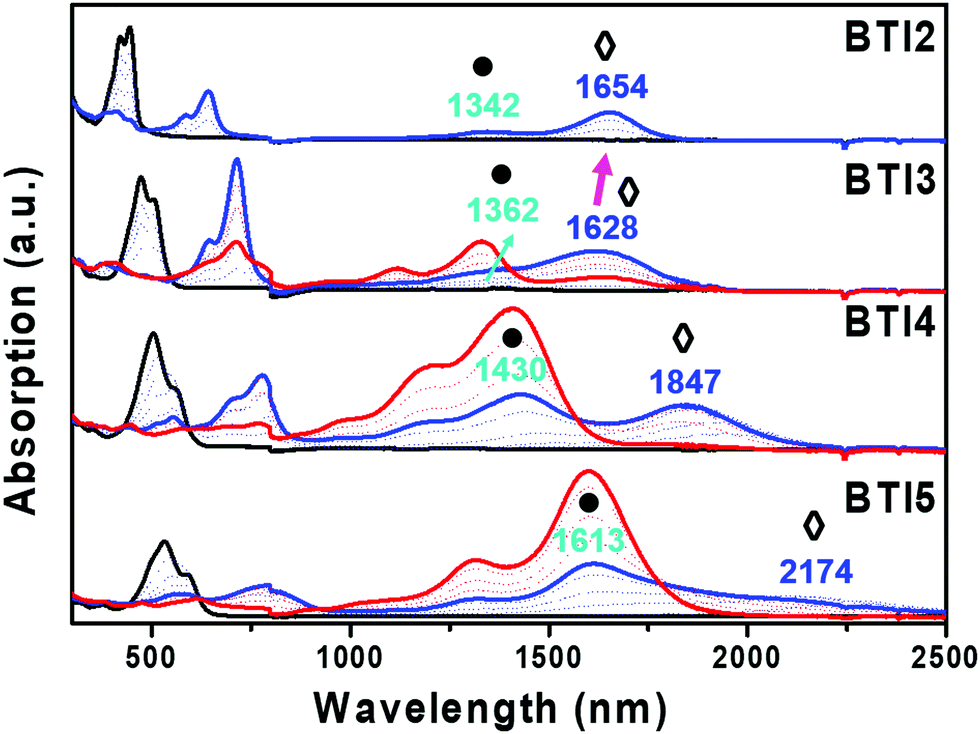 | ||
| Fig. 3 UV/Vis/NIR spectral changes upon electrochemical reduction of BTI2–BTI5 within an OTTLE cell in dichloromethane at room temperature in the presence of the 0.1 M (n-Bu)4NPF6 supporting electrolyte. The black, blue and red curves represent the neutral, radical anion and π-dimer dianion bands, respectively. (●) indicates the BTIn π-dimer radical anion ([BTIn]2−) and (◊) indicates the BTIn isolated radical anions (BTIn−). | ||
The UV-Vis absorption of all parent neutral species (black curve) progressively vanished in time, giving rise to two sharp peaks (blue curve) at higher wavelengths, with clear isosbestic points. The two peaks of the blue curve could represent the gradual formation of the isolated and π-dimer radical anions. As shown in the UV/Vis/NIR spectra (Fig. 3), the BTIn molecules exhibit a progressive redshift in the radical anion absorption bands with the increase of the building block unit, as we expected since the π-conjugation length increases on going from BTI2 to BTI5. However, an unexpected behavior of the higher energy band (1654 nm, ◊) for the shortest building block (BTI2) is observed, which consists in a 26 nm redshift compared with the next building block unit (BTI3), whose band appears at lower wavelength (1628 nm). This trend is theoretically predicted (Fig. S8, ESI†) and can be understood considering that the charge delocalization over the conjugated skeleton for BTI2 and BTI3 is similar, and both extended over ∼5 rings despite the longer BTI3 conjugated skeleton (Fig. S9, ESI†), and with higher delocalization over the external thiophene rings in BTI2. Upon further increasing the reduction potential, the radical anion is converted to a new species (red curve, Fig. 3), which exhibits a strong absorption in 1300–1900 nm (BTI3), except for the smallest monomer (BTI2) of this series of compounds. This new species could be assigned to the π-dimer dianion, formed by two radical anion monomers. It is noteworthy that for BTI2, although the presence of π-dimer radical anions is recorded (●), the increase of the applied potential does not lead to the introduction of an extra electron in the dimeric form. The spectroelectrochemical results as well as the theoretical results for all compounds under study are summarized in Table 1.
| Compound | λ max [nm] | λ calc [nm] |
|---|---|---|
| BTI2 | 421 (sh), 445 | 375 |
| BTI2− | 645, 1654 | 526, 1191 |
| syn-[BTI2]2− | 412, 584, 1342 | 360, 417, 956 |
| BTI3 | 473 (sh), 506 | 414 |
| BTI3− | 715, 1628 | 571, 944 |
| syn-[BTI3]2− | 376, 643, 1362 | 420, 575, 951 |
| syn-[BTI3−]2 | 409, 1118 (sh), 1331 | 393, 501, 888 |
| BTI4 | 503, 560 (sh) | 437 |
| BTI4− | 704 (sh), 781, 1847 | 617, 1263 |
| syn-[BTI4]2− | 558, 1197 (sh), 1430 | 430, 472, 622, 1168 |
| syn-[BTI4−]2 | 442, 1197 (sh), 1411 | 453, 941 |
In order to analyze in depth the different species formed during the first step of the spectroelectrochemical reduction, we first carried out a comparative experimental study of the impact of the chain length on the spectroelectrochemical behavior (Fig. 3). Thus, comparing the BTI2–BTI5 spectra, we can observe that the band at higher wavelength (1300–2200 nm, ●◊), corresponding to the blue curve, exhibits a higher energy shoulder (1300–1613 nm, ●). This shoulder increases in intensity upon increasing the chain length. Taking into account that the tendency to form aggregates increases with the building block unit, we assign this shoulder band (●) to a π-dimer radical anion. Thus, the isolated radical anions coexist with the π-dimer radical anions. Consequently, the red curve represents the π-dimer dianion, which is also more favored for the longest systems; note that the most intense band is recorded for BTI5. On the contrary, the red curve registration is not feasible for BTI2 under these conditions. In order to understand this, an in depth theoretical study was performed.
Density functional theory (DFT) calculations were conducted for the monomeric species as well as the [BTIn]2− π-dimer anions and [BTIn−]2 π-dimer dianions (Fig. 4). The solution environment in all cases is described by a polarizable continuum model (PCM) using dichloromethane as the solvent. Two configurations for the spatial disposition of the two monomers in the π-dimer formation were considered: (1) parallel π-stacking, which represents the N atom in distinct monomers in a syn configuration and (2) antiparallel π-stacking with the respective N atoms in an anti configuration. The impact of the orientations of the branched side chains relative to the ring plane on the dimer stability was also tested, the configuration with the branched side chains out of the plane being the most stable one in each case. Lateral and top views of the optimized structures are given in Fig. S4 and S5 of the ESI.† Both parallel and antiparallel configurations were found to be stable against dissociation, with the parallel conformer being slightly more stable than the antiparallel one (more negative free energy of formation values, ΔGf°) especially in the case of the largest monomers (see Fig. 4 and Table 2). Therefore, the nearly isoenergetic anti and syn configurations may co-exist in solution.
 | ||
| Fig. 4 LC-ωPBE-GD3BJ/6-31G**-calculated molecular structures of BTI2, BTI3 and BTI4 π-dimer radical anion (a) and π-dimer dianions (b) with a syn configuration. ΔGf° values are given in kcal mol−1. | ||
| Molecule | Configuration | E int (kcal mol−1) | E bind (kcal mol−1) | ΔGf°![[thin space (1/6-em)]](https://www.rsc.org/images/entities/char_2009.gif) c (kcal mol−1) c (kcal mol−1) |
|---|---|---|---|---|
| a E int. b E bind and c ΔGf° calculated as shown in the ESI. | ||||
| π-dimer radical anion | ||||
| [BTI2]2− | syn | −40.4 | −36.4 | −14.1 |
| anti | −40.4 | −36.3 | −13.5 | |
| [BTI3]2− | syn | −75.7 | −64.5 | −38.8 |
| anti | 71.4 | −63.6 | −38.7 | |
| [BTI4]2− | syn | −88.1 | −86.4 | −55.4 |
| anti | — | — | — | |
| π-dimer dianion | ||||
| [BTI2−]2 | syn | −30.9 | −19.3 | 4.4 |
| anti | −33.2 | −21.0 | 4.9 | |
| [BTI3−]2 | syn | −53.3 | −42.6 | −14.7 |
| anti | −54.5 | −42.4 | −15.6 | |
| [BTI4−]2 | syn | −84.1 | −70.6 | −35.5 |
| anti | — | — | — | |
Owing to the planarity of BTI molecules, both the binding energy and the interaction energy of the corresponding π-dimers are very similar. The Gibbs free energy is about 20 kcal mol−1 lower than the binding and interaction energies due to the entropic factor. These values are found to be more negative upon elongation of the building block units, indicating the greater tendency towards π-dimer formation for the longest systems (see Table 2). Although both types of π-dimers are stable against dissociation for BTI3–BTI5, the BTIn π-dimer dianions show lower ΔGf° energy values than the corresponding π-dimer radical anions. However, in the case of BTI2, the formation of π-dimer dianions is unstable with a ΔGf° of 4.4 kcal mol−1. In this case, the instability of the dianion π-dimer is in accordance with the experimental results shown above in Fig. 3 and may be understood in terms of charge delocalization over both monomer conjugated skeletons in the π-dimer radical anion forms. Fig. 5 shows the charge sum over each molecule of the radical anion π-dimer of molecules BTI2–BTI4.
 | ||
| Fig. 5 DFT-calculated charge delocalization in BTIn π-dimer radical anions at the LC-ωPBE–GD3BJ/6-31G** level. | ||
Whereas the charge density of the BTI3 and BTI4 π-dimer radical anions is delocalized on one single molecule, in the case of BTI2 an additional molecule is needed to facilitate charge delocalization, with the two molecules bearing approximately half of the injected charge. This may be the main reason why the injection of another electron into the BTI2 π-dimer radical anion is not feasible due to charge repulsion, while π-dimer radical anions built up with BTI3–BTI5 molecules are able to accommodate one extra charge.
In addition, while in [BTI2]2− the injected charge is delocalized over ∼8 rings, considering the two molecules of the π-dimer, charge delocalization in [BTI3]2− is extended over ∼7 rings (see Fig. S10, ESI†). This similar charge delocalization extension may explain the modest displacement of the π-dimer radical anion absorptions (1342 vs. 1362 nm) on going from BTI2 to BTI3 (Fig. 3) in comparison with the displacement observed for longer molecules.
In order to further prove this, time-dependent (TD) DFT calculations were then used to interpret the evolution of the electronic spectra of the reduced species. Different functionals were tested, i.e., M06-2X and ωB97XD and LC-ωPBE functionals were used over the previous M06-2X-GD3 and LC-ωPBE-GD3BJ-optimized structures, respectively (see Table 1 and Fig. S7, S8, ESI†). The three functionals show the same trend of the vertical transitions in the absorption spectra; thus, for simplicity reasons, only the data calculated at the ωB97XD/6-31G**//-LC-ωPBE-GD3BJ/6-31G** level will be further considered in this study. TD-DFT calculations show that the π-dimers, both radical anion ([BTIn]2−) and dianion ([BTIn−]2) and also the isolated radical anions (BTIn−) exhibit two red-shifted transitions compared to the neutral band, the most intense one at lower wavelengths and the less intense one at higher wavelengths, which is in good agreement with the experimental observation (see Fig. 6).
 | ||
| Fig. 6 (a) UV/Vis/NIR spectral changes at room temperature of BTI2 and BTI3 within an OTTLE cell in dichloromethane containing 0.1 M (n-Bu)4NPF6 as the supporting electrolyte. (b) TD-DFT/ωB97XD calculated vertical transition energies for neutral, the radical anion, π-dimer radical anion and π-dimer dianion of BTI2 and BIT3. | ||
As seen in Fig. 6b, two intense electronic transitions were computed for the BTI2 radical anion (BTI2−) at 526/1191 and for the BTI3 radical anion (BTI3−) at 571/944 nm, which correspond to the experimental absorption bands measured at 645/1654 nm for BTI2 and 715/1628 nm for BTI3 (Fig. 6a). For the syn-[BTI2]2− and syn-[BTI3]2− π-dimer radical anions, three bands are theoretically predicted at 360, 417 and 956 nm for the former and at 420, 575 and 951 nm for the latter (Fig. 6b), which are in good agreement with the three experimental bands associated with the formation of the π-dimer radical anion (412, 584, 1342 nm for [BTI2]2− and 376, 643, 1362 nm for [BTI3]2−, Fig. 6a). The three main intense bands of these BTI radical anion π-dimers, on going from lower to higher wavenumbers are associated with the HOMO → SOMO, SOMO → LUMO and HOMO → LUMO transitions, respectively (see Fig. S6, ESI†). The red-shift of the bands corresponding to the π-dimer radical anion compared to the neutral species, are presumably due to an effective through-space electronic interaction within the dimer.
Upon further increase of the applied voltage, a new spectral profile was recorded for BTI3–BTI5 semiconductors (red spectra in Fig. 3 and 6a), which are theoretically ascribed to the formation of π-dimer dianions (Fig. 6b). The bands recorded for these species are blue-shifted regarding those of the π-dimer radical anions, probably due to the inherent destabilization by increased electrostatic repulsion in the double charged π-dimer. Therefore, the TD-DFT calculations have reproduced reasonably well the experimental absorption spectra and give evidence of the formation of both isolated radical anions and π-dimer radical anions for BTI2, and even π-dimer dianions during the electroreduction processes of BTI3.
In order to further study the nature of the different charged species, the spectroelectrochemical reduction processes were recorded as a function of the nature of counterions (Fig. 7) and the concentration of semiconductor solution (Fig. 8).
 | ||
| Fig. 7 UV/Vis/NIR spectral changes at room temperature upon electrochemical reduction of BTI2 and BTI3 within an OTTLE cell in dichloromethane containing (a) 0.1 M (n-Bu)4NPF6 and (b) 0.1 M (n-Hex)4NPF6 as supporting electrolytes. | ||
 | ||
| Fig. 8 UV/Vis/NIR spectral changes at room temperature upon electrochemical reduction of (a) 3 × 10⁻⁷ M and (b) 8 × 10⁻⁸ M concentration solutions of BTI3 within an OTTLE cell in dichloromethane in the presence of 0.1 M (n-Bu)4NPF6 as the supporting electrolyte. | ||
The impact of the size of counterions on the formation of π-dimer species has been analyzed by inspecting the spectral changes recorded in the course of one-electron electrochemical reduction of BTIn semiconductors in the presence of tetrabutylammonium hexafluorophosphate, (n-Bu)4NPF6, or tetrahexylammonium hexafluorophosphate (n-Hex)4NPF6 supporting electrolytes. As seen in Fig. 7 and Fig. S2, S3 (ESI†), similar spectral profiles were obtained regardless of the size of the counterions; however, the extension of the counterions alkyl chains from butyl (Bu4+) to hexyl (Hex4+) chains slightly destabilizes the formation of π-dimeric species, probably due to steric hindrance effects. This is particularly evident in the formation of π-dimer dianions, which are clearly favored in the presence of the (n-Bu)4NPF6 supporting electrolyte.
In parallel, we studied the impact of the BTI concentration on the formation of the π-dimers (Fig. 8). As we can see in Fig. 8b, using a very low concentration of BTI3 solution, upon increasing the reduction potential, the spectral profile is similar to that obtained at higher BTI3 concentrations at the first applied potential (blue curve, Fig. 8a); however, the shoulder located at around 1300 nm (Fig. 8a), which was ascribed to π-dimer radical anion, basically disappears due to the low molecular concentration (Fig. 8b). Further increase of the applied potential does not modify the spectral profile at a low concentration of BTI3 (Fig. 8b); however at a high concentration of BTI3 a new band appears at around 1300 nm (red curve, Fig. 8a), which was ascribed to the formation of π-dimer dianions. These results support the π-dimeric nature of both the red spectra and the shoulder peak at around 1300 nm of the blue spectra, as previously indicated by theoretical calculations.
Experimental studies of charge species in solid state
In the previous sections we have demonstrated the predominance of aggregates both in the neutral and charged states in these BTI semiconductors even in diluted solutions, due to their rigid and planar structures. Molecular aggregation is key in thin film devices since charge carriers need to be stabilized and transported through the device active channel.38,39To better understand how charge is transported in solid state films based on these promising ladder-type BTI2–BTI5 molecules, we first fabricated and characterized top-gate, bottom-contact OFETs (see fabrication of OFETs in the Experimental section). As previously reported, a remarkable decrease in field effect mobility is found as the BTI unit gets longer, with one order of magnitude drop for BTI5 with respect to the shortest members of the series (see data in Table 3). This has been ascribed to different facts: (i) the degree of crystallinity was reported to decrease as the length of the BTI unit increased, with BTI2 showing the highest degree of order. Indeed, X-ray diffraction (XRD) measurements show that BTI2 exhibits the most pronounced lamellar scattering but larger grain size in AFM topographies.11 Nevertheless, other effects may also be considered, such as (ii) the injected charge density is confined in the three internal fused BTI units in BTI3–BTI5 (see Fig. S9, ESI†), so that longer fused BTI systems than BTI3 are, in principle, not necessary in terms of conjugation and charge stabilization; and (iii) processability issues are found in the longest members of the series due to the strong aggregation even at low concentration solutions, which is ultimately related to poor film formation and thus to a lower degree of order.
| μ e,sat (cm2 V−1 s−1) | V t (V) | I on/Ioff | |
|---|---|---|---|
| BTI2 | 0.074 | 2 | 104 |
| BTI3 | 0.017 | 4 | 104 |
| BTI4 | 0.014 | 9 | 104 |
| BTI5 | 0.0019 | 15 | 103 |
However, despite these indications, the remarkable increase in field-effect mobility observed for the shortest member of the series, BTI2, may not be solely understood under these terms. Thus, in order to shed light on the charge transport mechanism of BTI-fused systems, we have performed charge modulation spectroscopic (CMS) measurements in semi-transparent OFETs. CMS is a powerful technique which allows us to study the molecular nature of the charge carriers present in the OFET accumulated channel.40–42 In this experiment, we modulate the charge density in the thin semiconducting film, at the interface with the dielectric, by modulating the applied gate bias in a semitransparent OFET, and then measure the variation in light transmission (ΔT), normalized to the total transmission (ΔT/T). The ΔT signal is associated with the formation of new intragap states, owing to the modulation of mobile charges, while immobilized charges cannot be observed in the CMS spectrum since they cannot be modulated.
The CMS spectra of BTI OFET in full accumulation, measured at an applied gate voltage (VG) of 60 V with a modulating voltage (Vac) of ±20 V, are shown in Fig. 9. In these spectra, the ΔT/T < 0 region is associated with sub-band gap states induced by localized, polaronic charges present in the accumulation layer, while the positive signal is related to the bleaching of the neutral absorption. Bleaching of BTI2 could not be measured since the neutral absorbance of this molecule peaks below 450 nm, a value where our CMS experimental set-up is not sensitive enough. Some similarities are present in all CMS spectra: (i) the bleaching of neutral states exhibits highly pronounced vibronics, better resolved than their UV-Vis absorption counterpart. This is commonly observed, as charge carriers are located in the most ordered regions of the films. (ii) The charge absorption regions exhibit two distinct contributions. One at low wavelengths, immediately next to the bleaching and another at higher wavelengths. (iii) A high similitude between the sub-gap features attributed to charged species obtained by spectroelectrochemical and CMS experiments is observed. Yet, the CMS spectra show no fingerprint of dianion formation, which is probably related to the lower charge carrier density achieved in the channel of an accumulated transistor when compared to that of spectroelectrochemistry, upon strong reduction. The charge absorption signals fit well the peaks of radical anions, although some changes in the peak positions are present, probably because of differences in polarization between the solid state and solution.
 | ||
| Fig. 9 Evolution of the CMS spectra of semitransparent OFETs with BTI2, BTI3 and BTI4 semiconductors as the active materials at T = 300 K. | ||
We hence employ the radical anions spectra in solution as a reference to interpret the CMS spectra. The comparison between CMS and spectroelectrochemistry data for BTI2 is shown in Fig. 10. In particular, our spectroelectrochemistry reference shows the presence of two peaks at high wavelengths (1000–1900 nm), the peak at lower wavelengths related to π-dimer radical anion and at higher wavelegths related to the isolated anion. In BTI2 CMS spectra, at low gate voltage, the spectral shapes also show two contributions peaking at ∼1400 nm and ∼1200 nm, with a similar relative intensity. Thus we interpret them as those of the isolated anion and the π-dimer radical anion respectively. Upon increasing the gate voltage, the shoulder at 1400 nm decreases and vanishes, while the peak at 1200 nm becomes more pronounced. Thus, CMS spectra suggest a stronger contribution coming from the π-dimer radical anion than from the isolated anion at increasing charge density. In particular, in full accumulation, charge carriers in BTI2 systems are likely stabilized within two consecutive molecules, as predicted by DFT calculations (Fig. 5), therefore improving charge transport, where the hopping process within the active channel may be seen as charge transfer between neighboring π-dimers. In BTI3 the scenario is different and transitions associated with the isolated anion become dominant (Fig. S12, ESI†). Indeed, BTI3 CMS spectra exhibit a strong signal at ∼1600 nm that matches well the isolated anion peak (1628 nm) observed in spectroelectrochemistry, while at lower wavelengths (1000–1300 nm) only a broad feature is present, probably indicating a lower contribution of the π-dimer radical anion. Vg dependent spectra show only minor changes as voltage increases; in particular the peak at ∼600 nm – associated with the isolated radical anion in solution – reduces in intensity. Therefore, despite a dominant signal coming from the isolated anion, an increase of voltage seems to reduce the confinement of charge carriers on a single molecule. We would like to note that our CMS experimental set-up is not sensitive enough above 1600–1700 nm, therefore the reduction of intensity above those wavelegths is an artefact associated with the limitations of the measurement. Similarly, in BTI4, above 1500 nm the intensity increases and reaches a maximum at 1700 nm. This is again an artefact due to the limited resolution at those wavelengths, hence we could only detect the onset of a strong charge absorption signal, probably related to the isolated anion peak. At lower wavelengths, between 1000 and 1500 nm, only a broad and low intensity signal is detected. The charge absorption spectra next to the bleaching show sharp vibronics at ∼600 nm and 850 nm, in a spectral range where the isolated anion was shown to exhibit two peaks. These sharp vibronic transitions, together with the higher wavelength spectra suggest that the charge carriers are mainly localized on an single molecule.
 | ||
| Fig. 10 Comparison between UV/Vis/NIR spectral changes at room temperature of BTI2 within an OTTLE cell in dichloromethane containing 0.1 M (n-Bu)4NPF6 as supporting electrolytes (top) and the evolution of the CMS spectra of semitransparent OFETs with BTI2 semiconductors as the active material at T = 300 K (bottom). | ||
In conclusion, as the BTI length is increased, CMS suggests that charge carriers tend to be localized on isolated molecules, while BTI2 shows spectra suggesting charge relaxation within two molecules, in a π-dimer configuration. This is promoted by the more efficient crystal packing of the BTI2 semiconductor and the fact that charge stabilization is improved in the BTI2 π-dimer radical anion due to delocalization over the two interacting molecules.
Conclusions
Formation of aggregated species are determinants in the charge transport processes in electronic devices. The marked propensity toward π-dimerization shown by the radical anions of the BTI2–BTI5 series in dichloromethane was investigated in detail by using a combined experimental and theoretical approach. The stability, nature and spectroscopic characteristics of the ultimate radical anion and dianion π-dimeric species were analyzed as a function of the BTI concentration and the nature of counterions.We found that molecular aggregation is enhanced in solution upon increasing the BTIn chain length, both in neutral and charged states. In the case of charged species, both radical anion and dianion π-dimers were easily observed for BTI3–BTI5 semiconductors, while only π-dimer radical anions were registered for BTI2, which in this case is related to the delocalization of the injected charge over the two neighboring molecules, thus preventing the introduction of an extra electron due to the increased electrostatic repulsion. In good agreement with this result, in the solid state, the injected negative charge in BTI2 is also stabilized in the through-space between two adjacent molecules. This through-space charge delocalization, evidenced by CMS experiments and supported by quantum chemical calculations, does not apply to BTI3–BTI5, where charges seem to be localized on single BTI molecules. Thus, the more efficient charge transport process found in BTI2, with an electron field effect mobility ∼40× times higher than BTI5, which has previously been correctly ascribed to enhanced thin film crystallinity, is also related to charge relaxation over two molecules, in a π-dimer configuration.
Experimental section
Materials synthesis
The ladder-type BTI building blocks were synthesized following a previous published procedure (Angew. Chem., 2017, 129, 10056).Spectroelectrochemical experiments
In situ UV/Vis/NIR spectroelectrochemical studies were conducted at 300 K by using an optically transparent thin-layer electrochemical cell positioned in the sample compartment of a Cary 5000 spectrophotometer. In this cell a Pt gauze was used as the working electrode, a Pt wire was used as the counter electrode and an Ag wire was used as the pseudo-reference electrode. A C3 epsilon potentiostat from BASi was used for the electrolysis using a thin layer cell from a demountable omni cell from Specac. The spectra were collected at constant potentials, being the potentials changed at intervals of 10 mV. The electrochemical medium used was 0.1 M tetrabutylammonium hexafluorophosphate ((n-Bu)4NPF6) and 0.1 M tetrahexylammonium hexafluorophosphate ((n-Hex)4NPF6) in CH2Cl2, at room temperature.Charge modulation spectroscopy
For the OFETs used for the charge modulation spectroscopy measurements, we adopted a top-gate, bottom-contact (TG/BC) architecture. Thoroughly cleaned 1737F glass was used as the substrate. Interdigitated Au 20 nm thick contacts with channel length L = 40 μm and channel width W = 2 cm, were defined by a lift-off photolithographic process with a 2 nm thick Cr adhesion layer. To reduce the contact resistance, a thin layer of cesium fluoride (CsF) was spin-coated from 2-methoxyethanol solution onto the Au S/D electrodes to facilitate electron injection.43 A chloroform solution of BTI2–BTI5 (3 mg ml−1) was then deposited by spin-coating at 1000 rpm for 60 seconds, yielding an ∼40–60 nm thick film. The semiconductor was then annealed for 20 min at 80 °C on a hot plate in a nitrogen atmosphere. A 400 nm CYTOP dielectric layer was then spin-coated on top at 4000 rpm for 60 s. After the dielectric deposition, the devices were annealed in nitrogen, on a hot plate, at 100 °C for 30 min. Finally, a 7 nm thick Al, followed by 4 nm Au electrode was thermally evaporated as the gate contact to complete the device fabrication. The transistor fabrication was carried out in a nitrogen-filled glovebox.Computational details
All calculations were carried out at the density functional theory (DFT) level by using the Gaussian 16 program.44 Different functionals, such as M06-2X,45 ωB97XD46 and LC-wPBE47–49 were employed together with the 6-31G** basis set.50,51 These functionals were chosen taking into account their ability to describe π–π interactions and estimate the energies of weak intermolecular interactions more efficiently than the B3LYP functional does.52–54 The empirical dispersion correction GD355 and GD3BJ56 were used together with M06-2X and LC-ωPBE functionals, respectively. The polarizable continuum model (PCM)57–59 for solvation was used. The PCM considers the solvent (dichloromethane) as a continuous medium with a dielectric constant (ε = 8.93) and represents the solute by means of a cavity built using a number of interlaced spheres. All calculations on radical anions were spin-unrestricted. The 2-octyldodecyl chains on the N-imide group of BTI2–BTI5 were replaced with isopropyl chains in order to simplify the calculations. On the basis of the resulting ground-state geometries, harmonic vibrational frequencies were calculated at the same theoretical level corroborating that the optimized geometries are minima (zero imaginary frequencies).The vertical transition energies and oscillator strengths between the initial and final states were computed by using the time-dependent (TD) DFT approach60 with the LC-ωPBE and ωB97XD functionals over the previous LC-ωPBE-GD3BJ-optimized structures and with the M06-2X functional over the previous M06-2X-GD3-optimized structures. Gibbs energy changes associated with the formation of the dimer (ΔGf°) are computed based on the energies of the vibrational analysis of the neutral and radical anion monomers, as well as the π-dimer radical anion or dianion, taking into account the thermal corrections.
Conflicts of interest
There are no conflicts to declare.Acknowledgements
The work at University of Malaga was financially supported by Junta de Andalucía (projects UMA18-FEDERJA-080 and P18-FR-4559) and MICINN (project PID2019-110305GB-I00). A. S. and M. C. acknowledge funding from the European Research Council (ERC) under the European Union's Horizon 2020 research and innovation programme “HEROIC”, Grant Agreement 638059. X. G. thanks the Shenzhen Science and Technology Innovation Commission (No. JCYJ20170817105905899 and JCYJ20180504165709042). The authors thankfully acknowledge the computer resources, technical expertise, and assistance provided by the SCBI (Supercomputing and Bioinformatics) centre of the University of Malaga.References
- X. Guo, R. P. Ortiz, Y. Zheng, Y. Hu, Y.-Y. Noh, K.-J. Baeg, A. Facchetti and T. J. Marks, Bithiophene-Imide-Based Polymeric Semiconductors for Field-Effect Transistors: Synthesis, Structure−Property Correlations, Charge Carrier Polarity, and Device Stability, J. Am. Chem. Soc., 2011, 133(5), 1405–1418, DOI:10.1021/ja107678m.
- A. Mishra and P. Bäuerle, Small Molecule Organic Semiconductors on the Move: Promises for Future Solar Energy Technology, Angew. Chem., Int. Ed., 2012, 51(9), 2020–2067, DOI:10.1002/anie.201102326.
- X. Guo, N. Zhou, S. J. Lou, J. Smith, D. B. Tice, J. W. Hennek, R. P. Ortiz, J. T. L. Navarrete, S. Li, J. Strzalka, L. X. Chen, R. P. H. Chang, A. Facchetti and T. J. Marks, Polymer Solar Cells with Enhanced Fill Factors, Nat. Photonics, 2013, 7(10), 825–833, DOI:10.1038/nphoton.2013.207.
- R.-P. Xu, Y.-Q. Li and J.-X. Tang, Recent Advances in Flexible Organic Light-Emitting Diodes, J. Mater. Chem. C, 2016, 4(39), 9116–9142, 10.1039/C6TC03230C.
- M. Chen, Y. Zhao, Z. Tang, B. Zhang and B. Wei, Multifunctional Organic Emitters for High-Performance and Low-Cost Organic Light-Emitting Didoes, Chem. Rec., 2019, 19(8), 1768–1778, DOI:10.1002/tcr.201900005.
- S.-J. Zou, Y. Shen, F.-M. Xie, J.-D. Chen, Y.-Q. Li and J.-X. Tang, Recent Advances in Organic Light-Emitting Diodes: Toward Smart Lighting and Displays, Mater. Chem. Front., 2020, 4(3), 788–820, 10.1039/C9QM00716D.
- J. Zaumseil and H. Sirringhaus, Electron and Ambipolar Transport in Organic Field-Effect Transistors, Chem. Rev., 2007, 107(4), 1296–1323, DOI:10.1021/cr0501543.
- X. Guo, A. Facchetti and T. J. Marks, Imide- and Amide-Functionalized Polymer Semiconductors, Chem. Rev., 2014, 114(18), 8943–9021, DOI:10.1021/cr500225d.
- F. J. M. Hoeben, P. Jonkheijm, E. W. Meijer and A. P. H. J. Schenning, About Supramolecular Assemblies of π-Conjugated Systems, Chem. Rev., 2005, 105(4), 1491–1546, DOI:10.1021/cr030070z.
- Y. Wang, H. Guo, S. Ling, I. Arrechea-Marcos, Y. Wang, J. T. López Navarrete, R. P. Ortiz and X. Guo, Ladder-Type Heteroarenes: Up to 15 Rings with Five Imide Groups, Angew. Chem., Int. Ed., 2017, 56(33), 9924–9929, DOI:10.1002/anie.201702225.
- Y. Wang, H. Guo, A. Harbuzaru, M. A. Uddin, I. Arrechea-Marcos, S. Ling, J. Yu, Y. Tang, H. Sun, J. T. López Navarrete, R. P. Ortiz, H. Y. Woo and X. Guo, (Semi)Ladder-Type Bithiophene Imide-Based All-Acceptor Semiconductors: Synthesis, Structure-Property Correlations, and Unipolar n-Type Transistor Performance, J. Am. Chem. Soc., 2018, 140(19), 6095–6108, DOI:10.1021/jacs.8b02144.
- K. Takimiya, S. Shinamura, I. Osaka and E. Miyazaki, Thienoacene-Based Organic Semiconductors, Adv. Mater., 2011, 23(38), 4347–4370, DOI:10.1002/adma.201102007.
- J. Chen, K. Yang, X. Zhou and X. Guo, Ladder-Type Heteroarene-Based Organic Semiconductors, Chem. – Asian J., 2018, 13(18), 2587–2600, DOI:10.1002/asia.201800860.
- H. Klauk, M. Halik, U. Zschieschang, G. Schmid, W. Radlik and W. Weber, High-Mobility Polymer Gate Dielectric Pentacene Thin Film Transistors, J. Appl. Phys., 2002, 92(9), 5259–5263, DOI:10.1063/1.1511826.
- K. Niimi, S. Shinamura, I. Osaka, E. Miyazaki and K. Takimiya, Dianthra[2,3-b:2′,3′-f]Thieno[3,2-b]Thiophene (DATT): Synthesis, Characterization, and FET Characteristics of New π-Extended Heteroarene with Eight Fused Aromatic Rings, J. Am. Chem. Soc., 2011, 133(22), 8732–8739, DOI:10.1021/ja202377m.
- H. Dong, X. Fu, J. Liu, Z. Wang and W. Hu, 25th Anniversary Article: Key Points for High-Mobility Organic Field-Effect Transistors, Adv. Mater., 2013, 25(43), 6158–6183, DOI:10.1002/adma.201302514.
- C. Mitsui, T. Okamoto, M. Yamagishi, J. Tsurumi, K. Yoshimoto, K. Nakahara, J. Soeda, Y. Hirose, H. Sato, A. Yamano, T. Uemura and J. Takeya, High-Performance Solution-Processable N-Shaped Organic Semiconducting Materials with Stabilized Crystal Phase, Adv. Mater., 2014, 26(26), 4546–4551, DOI:10.1002/adma.201400289.
- H. Ebata, T. Izawa, E. Miyazaki, K. Takimiya, M. Ikeda, H. Kuwabara and T. Yui, Highly Soluble [1]Benzothieno[3,2-b]Benzothiophene (BTBT) Derivatives for High-Performance, Solution-Processed Organic Field-Effect Transistors, J. Am. Chem. Soc., 2007, 129(51), 15732–15733, DOI:10.1021/ja074841i.
- Y. Yuan, G. Giri, A. L. Ayzner, A. P. Zoombelt, S. C. B. Mannsfeld, J. Chen, D. Nordlund, M. F. Toney, J. Huang and Z. Bao, Ultra-High Mobility Transparent Organic Thin Film Transistors Grown by an off-Centre Spin-Coating Method, Nat. Commun., 2014, 5(1), 3005, DOI:10.1038/ncomms4005.
- S. Sanda, T. Nagase, T. Kobayashi, K. Takimiya, Y. Sadamitsu and H. Naito, High-Performance Didodecylbenzothienobenzothiophene-Based Top-Gate Organic Transistors Processed by Spin Coating Using Binary Solvent Mixtures, Org. Electron., 2018, 58, 306–312, DOI:10.1016/j.orgel.2018.04.013.
- T. Yamamoto and K. Takimiya, Facile Synthesis of Highly π-Extended Heteroarenes, Dinaphtho[2,3-b:2‘,3‘-f]Chalcogenopheno[3,2-b]Chalcogenophenes, and Their Application to Field-Effect Transistors, J. Am. Chem. Soc., 2007, 129(8), 2224–2225, DOI:10.1021/ja068429z.
- Y. Sakamoto, T. Suzuki, M. Kobayashi, Y. Gao, Y. Fukai, Y. Inoue, F. Sato and S. Tokito, Perfluoropentacene: High-Performance P−n Junctions and Complementary Circuits with Pentacene, J. Am. Chem. Soc., 2004, 126(26), 8138–8140, DOI:10.1021/ja0476258.
- H. Usta, C. Risko, Z. Wang, H. Huang, M. K. Deliomeroglu, A. Zhukhovitskiy, A. Facchetti and T. J. Marks, Design, Synthesis, and Characterization of Ladder-Type Molecules and Polymers. Air-Stable, Solution-Processable n-Channel and Ambipolar Semiconductors for Thin-Film Transistors via Experiment and Theory, J. Am. Chem. Soc., 2009, 131(15), 5586–5608, DOI:10.1021/ja809555c.
- J. E. Anthony, A. Facchetti, M. Heeney, S. R. Marder and X. Zhan, N-Type Organic Semiconductors in Organic Electronics, Adv. Mater., 2010, 22(34), 3876–3892, DOI:10.1002/adma.200903628.
- H. Usta, A. Facchetti and T. J. Marks, N-Channel Semiconductor Materials Design for Organic Complementary Circuits, Acc. Chem. Res., 2011, 44(7), 501–510, DOI:10.1021/ar200006r.
- J. Feng, W. Jiang and Z. Wang, Synthesis and Application of Rylene Imide Dyes as Organic Semiconducting Materials, Chem. – Asian J., 2018, 13(1), 20–30, DOI:10.1002/asia.201701424.
- J. A. Letizia, M. R. Salata, C. M. Tribout, A. Facchetti, M. A. Ratner and T. J. Marks, N-Channel Polymers by Design: Optimizing the Interplay of Solubilizing Substituents, Crystal Packing, and Field-Effect Transistor Characteristics in Polymeric Bithiophene-Imide Semiconductors, J. Am. Chem. Soc., 2008, 130(30), 9679–9694, DOI:10.1021/ja710815a.
- Y. Wang, Z. Yan, H. Guo, M. A. Uddin, S. Ling, X. Zhou, H. Su, J. Dai, H. Y. Woo and X. Guo, Effects of Bithiophene Imide Fusion on the Device Performance of Organic Thin-Film Transistors and All-Polymer Solar Cells, Angew. Chem., Int. Ed., 2017, 56(48), 15304–15308, DOI:10.1002/anie.201708421.
- T. Nishinaga and K. Komatsu, Persistent π Radical Cations: Self-Association and Its Steric Control in the Condensed Phase, Org. Biomol. Chem., 2005, 3(4), 561–569, 10.1039/B418872A.
- T. Zheng, Z. Cai, R. Ho-Wu, S. H. Yau, V. Shaparov, T. Goodson and L. Yu, Synthesis of Ladder-Type Thienoacenes and Their Electronic and Optical Properties, J. Am. Chem. Soc., 2016, 138(3), 868–875, DOI:10.1021/jacs.5b10175.
- T. Mani and D. C. Grills, Probing Intermolecular Electron Delocalization in Dimer Radical Anions by Vibrational Spectroscopy, J. Phys. Chem. B, 2017, 121(30), 7327–7335, DOI:10.1021/acs.jpcb.7b02559.
- C. C. Ferrón, M. C. R. Delgado, V. Hernández, J. T. L. Navarrete, B. Vercelli, G. Zotti, M. C. Cortada, J. J. Novoa, W. Niu, M. He and F. Hartl, Substituent and Counterion Effects on the Formation of π-Dimer Dications of End-Capped Heptathienoacenes, Chem. Commun., 2011, 47(47), 12622–12624, 10.1039/C1CC14566E.
- N. S. Rizalman, C. C. Ferrón, W. Niu, A. L. Wallace, M. He, R. Balster, J. Lampkin, V. Hernández, J. T. López Navarrete, M. C. Ruiz Delgado and F. Hartl, Radical Cations of End-Capped Tetrathienoacenes and Their π-Dimerization Controlled by the Nature of α-Substituents and Counterion Concentration, RSC Adv., 2013, 3(48), 25644–25647, 10.1039/C3RA45899G.
- C. C. Ferrón, M. Capdevila-Cortada, R. Balster, F. Hartl, W. Niu, M. He, J. J. Novoa, J. T. López Navarrete, V. Hernández and M. C. Ruiz Delgado, Multistep π Dimerization of Tetrakis(n-Decyl)Heptathienoacene Radical Cations: A Combined Experimental and Theoretical Study, Chem. – Eur. J., 2014, 20(33), 10351–10359, DOI:10.1002/chem.201402182.
- A. A. Virkar, S. Mannsfeld, Z. Bao and N. Stingelin, Organic Semiconductor Growth and Morphology Considerations for Organic Thin-Film Transistors, Adv. Mater., 2010, 22(34), 3857–3875, DOI:10.1002/adma.200903193.
- M. M. Nahid, A. Welford, E. Gann, L. Thomsen, K. P. Sharma and C. R. McNeill, Nature and Extent of Solution Aggregation Determines the Performance of P(NDI2OD-T2) Thin-Film Transistors, Adv. Electron. Mater., 2018, 4(4), 1700559, DOI:10.1002/aelm.201700559.
- M. Li, C. An, W. Pisula and K. Müllen, Cyclopentadithiophene–Benzothiadiazole Donor–Acceptor Polymers as Prototypical Semiconductors for High-Performance Field-Effect Transistors, Acc. Chem. Res., 2018, 51(5), 1196–1205, DOI:10.1021/acs.accounts.8b00025.
- I. Arrechea-Marcos, P. de Echegaray, M. J. Mancheño, M. C. Ruiz Delgado, M. M. Ramos, J. A. Quintana, J. M. Villalvilla, M. A. Díaz-García, J. T. López Navarrete, R. Ponce Ortiz and J. L. Segura, Molecular Aggregation of Naphthalimide Organic Semiconductors Assisted by Amphiphilic and Lipophilic Interactions: A Joint Theoretical and Experimental Study, Phys. Chem. Chem. Phys., 2017, 19(8), 6206–6215, 10.1039/C6CP06819G.
- J. Cornil, D. Beljonne, J.-P. Calbert and J.-L. Brédas, Interchain Interactions in Organic π-Conjugated Materials: Impact on Electronic Structure, Optical Response, and Charge Transport, Adv. Mater., 2001, 13(14), 1053–1067, DOI:10.1002/1521-4095(200107)13:14<1053::AID-ADMA1053>3.0.CO;2-7.
- P. J. Brown, H. Sirringhaus, M. Harrison, M. Shkunov and R. H. Friend, Optical Spectroscopy of Field-Induced Charge in Self-Organized High Mobility Poly(3-Hexylthiophene), Phys. Rev. B: Condens. Matter Mater. Phys., 2001, 63(12), 125204, DOI:10.1103/PhysRevB.63.125204.
- N. Zhao, Y.-Y. Noh, J.-F. Chang, M. Heeney, I. McCulloch and H. Sirringhaus, Polaron Localization at Interfaces in High-Mobility Microcrystalline Conjugated Polymers, Adv. Mater., 2009, 21(37), 3759–3763, DOI:10.1002/adma.200900326.
- M. Caironi, M. Bird, D. Fazzi, Z. Chen, R. Di Pietro, C. Newman, A. Facchetti and H. Sirringhaus, Very Low Degree of Energetic Disorder as the Origin of High Mobility in an N-Channel Polymer Semiconductor, Adv. Funct. Mater., 2011, 21(17), 3371–3381, DOI:10.1002/adfm.201100592.
- K.-J. Baeg, J. Kim, D. Khim, M. Caironi, D.-Y. Kim, I.-K. You, J. R. Quinn, A. Facchetti and Y.-Y. Noh, Charge Injection Engineering of Ambipolar Field-Effect Transistors for High-Performance Organic Complementary Circuits, ACS Appl. Mater. Interfaces, 2011, 3(8), 3205–3214, DOI:10.1021/am200705j.
- M. J. Frisch, G. W. Trucks, H. B. Schlegel, G. E. Scuseria, M. A. Robb, J. R. Cheeseman, G. Scalmani, V. Barone, G. A. Petersson, H. Nakatsuji, X. Li, M. Caricato, A. V. Marenich, J. Bloino, B. G. Janesko, R. Gomperts, B. Mennucci, H. P. Hratchian, J. V. Ortiz and D. J. Fox, Gaussian 16, Revision A.03, 2016 Search PubMed.
- Y. Zhao and D. G. Truhlar, The M06 Suite of Density Functionals for Main Group Thermochemistry, Thermochemical Kinetics, Noncovalent Interactions, Excited States, and Transition Elements: Two New Functionals and Systematic Testing of Four M06-Class Functionals and 12 Other Function, Theor. Chem. Acc., 2008, 120(1), 215–241, DOI:10.1007/s00214-007-0310-x.
- J.-D. Chai and M. Head-Gordon, Long-Range Corrected Hybrid Density Functionals with Damped Atom–Atom Dispersion Corrections, Phys. Chem. Chem. Phys., 2008, 10(44), 6615–6620, 10.1039/B810189B.
- O. A. Vydrov and G. E. Scuseria, Assessment of a Long-Range Corrected Hybrid Functional, J. Chem. Phys., 2006, 125(23), 234109, DOI:10.1063/1.2409292.
- O. A. Vydrov, J. Heyd, A. V. Krukau and G. E. Scuseria, Importance of Short-Range versus Long-Range Hartree-Fock Exchange for the Performance of Hybrid Density Functionals, J. Chem. Phys., 2006, 125(7), 74106, DOI:10.1063/1.2244560.
- O. A. Vydrov, G. E. Scuseria and J. P. Perdew, Tests of Functionals for Systems with Fractional Electron Number, J. Chem. Phys., 2007, 126(15), 154109, DOI:10.1063/1.2723119.
- W. J. Hehre, R. Ditchfield and J. A. Pople, Self—Consistent Molecular Orbital Methods. XII. Further Extensions of Gaussian—Type Basis Sets for Use in Molecular Orbital Studies of Organic Molecules, J. Chem. Phys., 1972, 56(5), 2257–2261, DOI:10.1063/1.1677527.
- P. C. Hariharan and J. A. Pople, The Influence of Polarization Functions on Molecular Orbital Hydrogenation Energies, Theor. Chim. Acta, 1973, 28(3), 213–222, DOI:10.1007/BF00533485.
- C. Lee, W. Yang and R. G. Parr, Development of the Colle-Salvetti Correlation-Energy Formula into a Functional of the Electron Density, Phys. Rev. B: Condens. Matter Mater. Phys., 1988, 37(2), 785–789, DOI:10.1103/PhysRevB.37.785.
- A. D. Becke, Density-functional Thermochemistry. III. The Role of Exact Exchange, J. Chem. Phys., 1993, 98(7), 5648–5652, DOI:10.1063/1.464913.
- A. D. Becke, A New Mixing of Hartree–Fock and Local Density-Functional Theories, J. Chem. Phys., 1993, 98(2), 1372–1377, DOI:10.1063/1.464304.
- S. Grimme, J. Antony, S. Ehrlich and H. Krieg, A Consistent and Accurate Ab Initio Parametrization of Density Functional Dispersion Correction (DFT-D) for the 94 Elements H-Pu, J. Chem. Phys., 2010, 132(15), 154104, DOI:10.1063/1.3382344.
- S. Grimme, S. Ehrlich and L. Goerigk, Effect of the Damping Function in Dispersion Corrected Density Functional Theory, J. Comput. Chem., 2011, 32(7), 1456–1465, DOI:10.1002/jcc.21759.
- J. Tomasi, B. Mennucci and R. Cammi, Quantum Mechanical Continuum Solvation Models, Chem. Rev., 2005, 105(8), 2999–3094, DOI:10.1021/cr9904009.
- R. Improta, V. Barone, G. Scalmani and M. J. Frisch, A State-Specific Polarizable Continuum Model Time Dependent Density Functional Theory Method for Excited State Calculations in Solution, J. Chem. Phys., 2006, 125(5), 54103, DOI:10.1063/1.2222364.
- R. Improta, G. Scalmani, M. J. Frisch and V. Barone, Toward Effective and Reliable Fluorescence Energies in Solution by a New State Specific Polarizable Continuum Model Time Dependent Density Functional Theory Approach, J. Chem. Phys., 2007, 127(7), 74504, DOI:10.1063/1.2757168.
- E. Runge and E. K. U. Gross, Density-Functional Theory for Time-Dependent Systems, Phys. Rev. Lett., 1984, 52(12), 997–1000, DOI:10.1103/PhysRevLett.52.997.
Footnote |
| † Electronic supplementary information (ESI) available. See DOI: 10.1039/d0tc04159a |
| This journal is © The Royal Society of Chemistry 2020 |