
 Open Access Article
 This Open Access Article is licensed under a
 Creative Commons Attribution 3.0 Unported Licence
Formate-mediated magnetic superexchange in the model hybrid perovskite [(CH3)2NH2]Cu(HCOO)3†
Rebecca
Scatena
 *a,
Roger D.
Johnson
b,
Pascal
Manuel
c and
Piero
Macchi
de
*a,
Roger D.
Johnson
b,
Pascal
Manuel
c and
Piero
Macchi
de
aDepartment of Physics, Clarendon Laboratory, University of Oxford, Parks Road, Oxford, OX1 3PU, UK. E-mail: rebecca.scatena@physics.ox.ac.uk
bDepartment of Physics and Astronomy, University College London, Gower Street, London, WC1E 6BT, UK
cISIS Pulsed Neutron and Muon Facility, STFC Rutherford Appleton Laboratory, Chilton, Oxfordshire OX11 0QX, UK
dDepartment of Chemistry, Materials, and Chemical Engineering, Polytechnic of Milan, Milan 20131, Italy
eIstituto Italiano di Tecnologia, Center for Nano Science and Technology CNST@polimi, Milan 20133, Italy
First published on 3rd September 2020
Abstract
We have investigated the magnetic and electronic structures of crystalline dimethylammonium copper formate [(CH3)2NH2]Cu(HCOO)3, a model compound that belongs to a wide class of hybrid organic–inorganic perovskites. We present the results of a combined experimental approach, where neutron diffraction and magnetisation measurements were used to solve the ground state magnetic structure in which the same ligand mediates both antiferromagnetic and ferromagnetic interactions, while the electron charge density distribution and orbital occupancy were determined by high-resolution X-ray diffraction. The latter enabled a microscopic analysis of the chemical bonding, from which we established a detailed correlation between the structural, electronic, and magnetic properties of [(CH3)2NH2]Cu(HCOO)3, demonstrating the primary role of Cu–O bonding in establishing the nature of the exchange. Our results elucidate the mechanism of magnetic exchange mediated by formate anions, from which we examine the applicability of foundational theories of purely inorganic perovskites and define characteristics that the ligands should meet to support the use of the Goodenough–Kanamori–Anderson rules.
Introduction
The discovery of solid-state phenomena and the development of new functional materials are typically underpinned by the application of well-established structure–property relationships. In this regard, an exemplary family of materials is that of inorganic transition metal oxide perovskites with generic chemical formula ABO3.1 In these systems, a deep understanding of how the crystal structure is related to materials properties has been developed, alongside exceptional discoveries of technologically important properties such as multiferroicity2,3 and colossal magnetoresistance.4,5Compared to the inorganic transition metal oxide perovskites, hybrid organic–inorganic coordination polymers are a relatively young class of materials in which a transition metal is coordinated by polydentate organic ligands forming extended periodic structures.6 The synthetic conditions, the coordination geometry of the transition metal, the interplay between possible interactions (i.e. covalent, ionic, coordinative, hydrogen, and van der Waals), and the chemical and structural characteristics of the ligands, all play a role in the final structure of the material. These parameters, together with the rich variety of organic molecular building blocks, give rise to a vast number of new materials that can be engineered with considerable control. Despite this inherent structural flexibility, coordination polymers whose framework topologies closely emulate that of the well-known inorganic perovskites are receiving considerable attention at present, especially in the field of multiferroics.7–13 In these cases empirical and semi-empirical structure–property relationships established for the inorganic counterparts might be used to anticipate the behavior of hybrid materials, hence accelerating their discovery and potential application.
To this end, we have explored the relationships between structure and magnetic properties in [(CH3)2NH2]Cu(HCOO)3 [dimethylammonium copper formate (DMACuF)] – a canonical hybrid organic–inorganic perovskite.14–16 In DMACuF the perovskite B sites are occupied by Cu2+ cations, and the O sites by formate (HCOO)− molecular anions. Accordingly, six formate ions coordinate the Cu2+ cations, which in turn form a 3D pseudo-cubic periodic framework of corner-shared octahedra (Fig. 1a). The A sites at the center of the framework voids are occupied by dimethylammonium cations [(CH3)2NH2]+, whose +1 charges balance the charge of the copper formate periodic framework {Cu(HCOO)3−}n. All CuIIO6 octahedra are centrosymmetric and axially elongated due to the Jahn–Teller (JT) instability of the 3d9 Cu2+ cations. The JT elongated Cu-formate bonds alternate approximately along the a + b and a − b directions from one Cu2+ site to the next, giving rise to alternating asymmetric Cu-formate-Cu pathways (labeled eq–ax) in the ab-plane (Fig. 1b). Short equatorial Cu-formate bonds align approximately along the c direction, forming symmetric Cu-formate-Cu pathways perpendicular to the ab-plane, labeled eq–eq. Hence, there exists two symmetry-inequivalent nearest-neighbor magnetic superexchange (SE) pathways with exchange coupling constants Jeq–eq and Jeq–ax, respectively. Wang et al.16 reported that the temperature dependent magnetic susceptibility curve of DMACuF (Fig. S1, ESI†) could be fit assuming an S = 1/2 1D Heisenberg model with antiferromagnetic (AFM) Jeq–eq = 77.4(3) K. However, muon spin relaxation studies by Baker and coworkers17 revealed that below TN = 5.2 K the material undergoes 3D long range magnetic order.
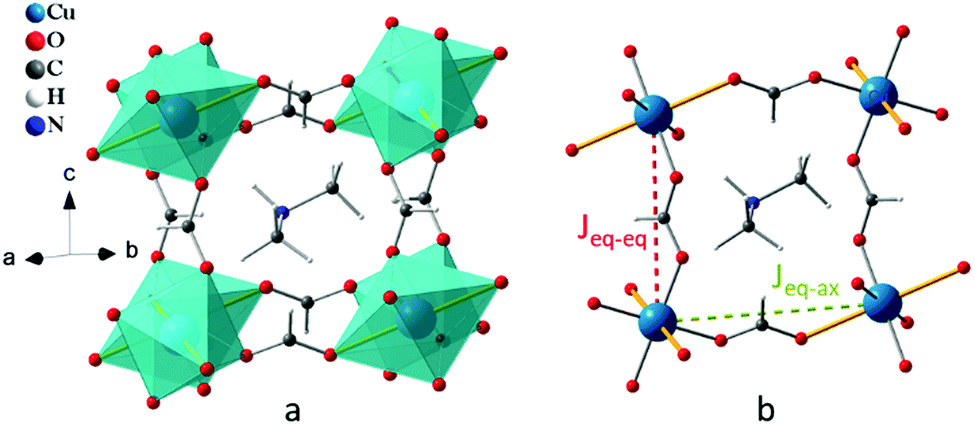 | ||
| Fig. 1 Crystal structure of [(CH3)2NH2]Cu(HCOO)3 with (a) the a−b−b− octahedral tilt pattern (in Glazer notation)22 of the ABO3 perovskite architecture and (b) two geometrically different superexchange pathways. Yellow thick sticks represent JT axes, the red and green dotted lines show respectively symmetric and asymmetric Cu-formate-Cu pathways. | ||
The nature of the ab-plane SE interaction Jeq–ax responsible for the 3D magnetic order is still the subject of debate. Based on the field dependence of the magnetic susceptibility below TN, and the fact that AFM coupling is normally observed for SE interactions mediated by molecular building blocks, Jeq–ax has been reported to be AFM.17 Alternatively, based on the foundational Goodenough–Kanamori–Anderson (GKA) rules18–20 taken from inorganic perovskite research,21 and density functional theory (DFT) studies,16Jeq–ax has been reported to be ferromagnetic (FM). Importantly, confirming the latter case would demonstrate that formate ligands can be used to mediate both FM and AFM superexchange.
In this paper, we present a detailed characterization of magnetic and electronic structures in DMACuF aiming to establish empirical microscopic and phenomenological structure–property relationships that can be compared to those valid for the inorganic analogues, and applied to a much broader range of materials. To reach our goal, we have first determined the true ground state magnetic structure of DMACuF by a combination of neutron powder diffraction and single crystal magnetometry. Then, to establish the microscopic origin of the observed magnetic structure and explore the general validity of the GKA rules in hybrid perovskites, the SE mechanism mediated by formate HCOO− and its electronic structure were determined by experimental charge density analysis and DFT calculations.
Experimental
Synthesis and crystal growth
All chemicals were purchased commercially and used without further purification. The syntheses were performed in 50 mL Teflon-lined stainless-steel autoclave reactors. 0.0116 g of Cu(NO3)2·3H2O were dissolved in a mixture of 5.97 g of N,N-dimethylformamide (DMF) and 18.14 g of deionized H2O. The solution was heated up to 140 °C and maintained at this temperature for 48 h. The reactor was then cooled down to room temperature. The precipitated mixture of CuO and Cu2O was filtered out and the colorless mother liquors used as solvent for 1.7329 g of Cu(BF4)2·6H2O. The obtained light blue solution was slowly evaporated to produce 1.1327 g of [(CH3)2NH2]Cu(HCOO)3 as light blue prismatic crystals. The product was isolated by filtration and then washed three times with ∼5 °C MeOH. A deuterated sample was prepared for neutron scattering measurements according to the same synthetic strategy but starting from deuterated DMF and deuterated water, and by extending the duration of the solvothermal reaction step to 108 h.Magnetic susceptibility measurements
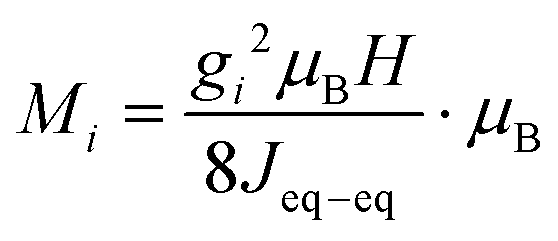
Magnetization as a function of applied magnetic field was measured on a 1.56 mg single crystal using a Quantum Design MPMS3. The measurement was carried out at a sample temperature of 2 K, and the magnetic field was swept from 0 → +5 → −5 → 0 T. The experiment was repeated three times with the magnetic field (H) applied along the three principal crystallographic directions [100], [010], and [001], respectively. The alignment precision was estimated to be ±5° due to the limited size of the sample. Regions of linear dependence between magnetization (M) and applied magnetic field (H) were fitted to estimate the main exchange coupling constant Jeq–eq bywhere gi is the component of the g-tensor16 along the magnetization direction, i, derived in the limit of zero magnetic anisotropy, see Fig. S2 (ESI†).
Powder elastic neutron diffraction
Elastic neutron diffraction patterns were collected using WISH, a time-of-flight diffractometer at ISIS, Rutherford Appleton Laboratory, UK. About 1.5 g of polycrystalline [(CD3)2ND2]Cu(DCOO)3 was loaded into a cylindrical vanadium can and placed into an Oxford Instruments cryostat. Diffraction patterns with high counting statistics (3 h) were collected at 10.0 and 1.5 K, above and below TN. Moreover, 60 min-long data collections were performed at 2.0, 3.0, 3.5, 4.0, 4.5, 5.0 and 5.5 K to extract the temperature dependence of the magnetic order parameter. Rietveld refinements were performed using FULLPROF against the data measured in detector banks at average 2θ values of 58°, 90°, 122° and 154°, each covering 32° of the scattering plane. Structural parameters derived from high-resolution single crystal X-ray measurements of a hydrogenated sample at 110 K were used as an initial input. All atoms were refined using isotropic thermal displacement parameters. The thermal parameters of chemically equivalent atoms were constrained to be equal. Candidate magnetic structure models were established by symmetry analysis performed using ISODISTORT,23 which were systematically tested against the data obtained from the difference between the patterns collected at 1.5 K and 10 K (Fig. 3). The temperature dependence of the main magnetic peak intensity at (001) was extracted by fitting a Gaussian function, which was then expressed in terms of a magnetic moment scaled to the moment refined at 1.5 K (Fig. 2). | ||
| Fig. 2 Temperature dependence of the ordered magnetic moment throughout the magnetic phase. The black line is drawn as a guide to the eye. | ||
High-resolution single-crystal X-ray diffraction and charge density refinement
A single crystal of [(CH3)2NH2]Cu(HCOO)3 with dimensions 363 × 165 × 79 μm was glued to a glass fibre and cooled to 110(2) K using an Oxford Cryostream flow cryostat. Redundant data were collected up to 0.45 Å using an Oxford Diffraction SuperNova area-detector diffractometer employing mirror optics, monochromated, and Al filtered microsource Mo Kα radiation (λ = 0.71073 Å). CrysAlisPro software was used for the calculation of the collection strategy and for the data reduction. Lorentz, polarization and absorption corrections were applied analytically. The results of a conventional spherical independent atom model (IAM) structural refinement performed using SHELXL24 provided a starting point for aspherical multipolar model (MM) fitting. The Hansen–Coppens formalism25 was used for charge density determination as implemented in the XD2016 software.26 Isotropic extinction was estimated according to the Becker–Coppens equation.27 All multipoles up to hexadodecapoles, and contraction and expansion parameters κ and κ′, were refined for all non-hydrogen atoms. Independent sets of κ and κ′ were refined for different elements. In addition, κ and κ′ were independently refined for sp2 and sp3 carbon atoms, as well as for axial and equatorial oxygen atoms. Hydrogen atoms were also described non-spherically by refining a dipole along their bond. The hydrogen κ and κ′ parameters were constrained to the standard value of 1.2, and anisotropic thermal displacements were estimated using SHADE2.1.28 Anharmonic motion up to the fourth-order was refined only for Cu atoms, whereas, second order anisotropic thermal parameters were refined for all other atoms. Selected crystallographic data and refinement details are summarized in Table S1 (ESI†). The agreement between structure factors obtained from experiment and fitted multipolar model was evaluated by analysing the residual density distribution. Statistics of the residual density distribution are reported in the ESI† (Fig. S3). The analysis of the electron density was performed using the XDPROP and TOPXD modules of XD2016.Periodic-DFT simulations
Geometry optimization of the ground state crystal structure of [(CH3)2NH2]Cu(HCOO)3 was carried out in the monoclinic I2/a space group, using CRYSTAL17.29 The experimental crystal structure determined at 110 K was used as a starting point for the optimization. The unrestricted B3LYP functional was used with basis set 6-31G(d,p). The energies of high- and low-spin configurations were computed to obtain the superexchange magnetic coupling constants. The simulated electron density distribution was used to obtain a calculated structure factor that was then fitted to the MM by using XD201626 and the result was analysed using the XDPROP and TOPXD modules.Results and discussion
Synthesis and crystallization
The synthesis of dimethylammonium copper formate (DMACuF) starting from CuII salts and N,N-dimethylformamide (DMF) was optimized to produce large amounts of product with limited volumes of reactor and DMF. We reported a two-steps synthetic strategy which is crucial to produce the deuterated phase. The first reaction step is carried out in solvothermal conditions and leads to hydrolysis of DMF into dimethylammonium [(CH3)2NH2]+ and formate [HCOO]−via catalytic support from Cu(NO3)2. The products of the hydrolysis self-assemble into the desired crystal phase upon addition of Cu(BF4)2. Millimetre-size single crystals were grown by slow evaporation of the solvent.Crystal structure
High-resolution X-ray diffraction measurements enabled a highly accurate crystal structure refinement of DMACuF (summarised in Tables S1 and S2, ESI†). Peak indexation showed that at 110 K the structure maintained the ambient temperature monoclinic I2/a space group.30 In this phase CuII ions are located on inversion centers in the middle of JT axially elongated octahedra characterized by three pairs of Cu–O distances [1.9688(2), 1.9731(2), and 2.4545(3) Å at 110 K]. All formate (HCOO−) ligands bind CuII ions in anti–anti fashion with a Cu–O–C angle of about 124°. CuII ions along c are separated by 5.69870(5) Å and connected by symmetric Cu-formate-Cu pathways involving two equatorial Cu–O bonds (denoted eq–eq). Along a + b and a − b equivalent directions, CuII ions are separated by 6.16273(5) Å and connected by asymmetric Cu-formate-Cu pathways involving an equatorial and an axial Cu–O bond (denoted eq–ax). The formate anions that comprise these two pathways have remarkably similar structural parameters with equivalent C–O bond lengths along the symmetric eq–eq path [C1–O1 = 1.2546(2) Å] and two independent C–O bonds along the asymmetric eq–ax path [C2–O2 = 1.2633(3) Å; C2–O3 = 1.2495(4) Å]. C2–O2 and C2–O3 lengths in the eq–ax formate ion remain alike in spite of the very different coordinative interactions that this ligand is exposed to in the crystal.The structure of deuterated [(CD3)2ND1.6H0.4]Cu(DCOO)3 was determined by refinement of the hydrogenated structure (described above) against elastic neutron powder diffraction data collected at 10 K (Fig. S4, ESI†). The deuterated phase was found to be isostructural with the hydrogenated phase (Tables S1 and S2, ESI†). No impurity peaks were detected, showing that the synthesis reported above produced the desired product as a pure phase.
Magnetic structure
The elastic neutron diffractogram measured on cooling below TN revealed three new Bragg peaks whose temperature evolution was consistent with the magnetic phase transition previously characterized by magnetic susceptibility (Fig. S1, ESI†). These three peaks were therefore assigned to 3D long range magnetic order, and the temperature-dependent trend of the respective magnetic moments (square-root of intensity), is shown in Fig. 2.The magnetic peaks occurred at small values of scattering vector length |Q| (i.e. large d-spacing values), and they could be indexed by the Y-point propagation vector (0,0,1), defined with respect to the I2/a paramagnetic crystal structure. Symmetry analysis using ISODISTORT23 gave two irreducible representations for the CuII lattice: mY1− and mY2−. With reference to the description of magnetic structures found in the inorganic perovskites, as formulated by Bertaut,31 the symmetry adapted modes of mY1− and mY2− can be written as AxCyAz and CxAyCz, respectively. Here, C-type describes a magnetic structure of FM chains along the c axis (Jeq–eq) with AFM coupling in the ab plane (Jeq–ax), and A-type describes a magnetic structure of AFM chains along c with FM coupling in the ab plane. The subscripts denote the magnetic moment component, where x||a, y||b, and z||c*.
The candidate magnetic structures were simulated (Fig. S5, ESI†) and tested against the magnetic diffraction peaks obtained by taking the difference between patterns collected at 1.5 and 10 K, as shown in Fig. 3. The presence of large C-type modes could be ruled out since they produce magnetic intensities at d-spacing positions were no peaks were observed (above the detection limit of the experiment). However, A-type modes capture well the data when the magnetic moment is oriented either along the a (Ax) or b (Ay) crystallographic axes (R-factor = 0.592%, χ2 = 1.53 and R-factor = 0.885%, χ2 = 1.53). We note that the Az mode is inconsistent with the main magnetic peak at (0,0,1), as the magnetic unpolarised neutron diffraction intensity is proportional to the component of the moments perpendicular to Q. Higher resolution magnetic diffraction peaks, which could in theory differentiate between Ax and Ay, were not detected due to their low intensity and overlap with nuclear peaks. At 1.5 K the size of the refined CuII magnetic moment is significantly reduced: 0.45(24) μB instead of 1 μB, which is consistent with the effect of quantum fluctuations in low-dimensional AFM systems.32,33 The magnetic moment temperature dependence extracted from the (0,0,1) intensity (Fig. 2) was scaled to this value.
 | ||
| Fig. 3 Powder elastic neutron diffractogram obtained from the difference between diffraction at 1.5 K and 10 K, indexed by propagation vector (0,0,1). Data and fit are shown as black crosses and a red line, respectively, and their difference is drawn as a blue line. Black tick marks show possible Bragg reflection positions for the magnetic structure. | ||
Measurements of the field-dependent single crystal magnetisation are shown in Fig. 4. For magnetic fields applied along b or c the magnetisation grows linearly from zero, which is qualitatively consistent with the canting of antiferromagnetic CuII moments aligned perpendicular to the field i.e. parallel to a. By contrast, when the magnetic field is applied along the a axis the magnetisation maintains very small values until 0.5 T, at which field the magnetisation jumps to a value similar to that measured with the field parallel to b or c. For fields of 0.7 T and upwards, the a axis magnetisation follows a linear increase analogous to the b and c field directions. This behaviour is typical of a field-induced spin-flop transition when the field is applied parallel to the direction of the staggered magnetisation (parallel to the magnetic easy axis), hence confirming that the ground state CuII moments are aligned parallel to a (Inset in Fig. 4). This result is consistent with the spin-flop transition suggested by Wang and coworkers.16 Hence, the combination of neutron diffraction and magnetisation measurements uniquely identifies an A-type magnetic structure (FM coupled AFM chains) with magnetic moments aligned along the a axis (mY1− irreducible representation).
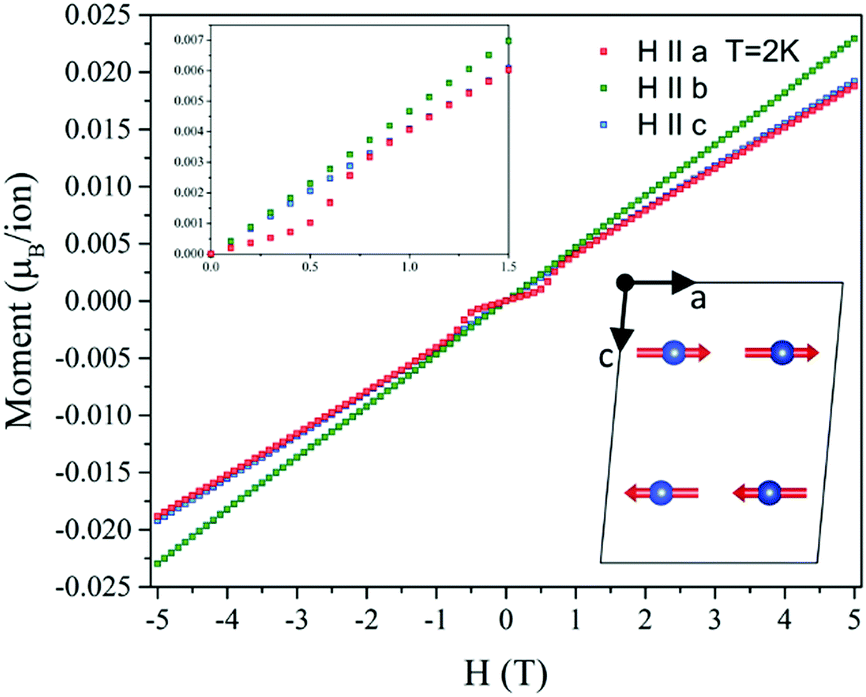 | ||
| Fig. 4 Magnetisation as a function of magnetic field applied along the principal crystallographic axes for a single crystal of [(CH3)2NH2]Cu(HCOO)3 at 2.0 K. Top left inset: Zoom-in about the spin-flop transition. Bottom right inset: Ground state magnetic structure. | ||
The critical field (BC ∼ 0.6 T) provides a direct measure of the small magnetic anisotropy energy, which in the absence of single-ion-anisotropy (CuII) likely originates in a combination of exchange anisotropy, antisymmetric Dzyaloshinskii–Moriya exchange, and the dipole–dipole interaction. The magnetisation gradient in the linear regimes provides a measure of the ‘stiffness’ of the antiferromagnetic exchange in this material, Jeq–eq, which was estimated to be 71.5(6) K (Fig. S2, ESI†) in excellent agreement with the value found from fitting the magnetic susceptibility.16 Differences in the gradient for the different field directions were accounted for by the anisotropic g-tensor, which is reported to be maximal along b,16 as observed.
Charge density distribution
The high-resolution single-crystal X-ray diffraction data measured at 110 K was also used to determine the electron charge density (ρMM) distribution in DMACuF, using a Hansen–Coppens multipolar model25 (MM) refined against the measured intensities. The quantum theory of atoms in molecules (QTAIM) topological analysis of ρMM defines atomic basins and bond trajectories (paths) between pairs of interacting atoms based on the ρMM gradient.34 Along a bond path, the point where the gradient of ρMM goes to zero, called a bond critical point (bcp), can be used to quantify the electron density associated with the interaction. Moreover, the Laplacian and ellipticity of the electron density at the bcp can be used to characterize the bond nature.In Table 1, we report the electron density properties at the bond critical points of all symmetry-independent nearest-neighbour interactions. The Cu–O bcps have a positive valued Laplacian, indicating that charge density is not concentrated at the centre of the bonds, as expected for coordinative interactions. The situation is different for the intramolecular HCOO− anion bonds, where negative Laplacian values at their bcps indicate strong covalency. The ellipticity of all bcps is small, demonstrating a cylindrical distribution of the electron density around the bond axes consistent with Sigma-type bonds. The obtained values were validated by comparison with the charge density analysis result obtained for MM fitting of a structure factor calculated from DFT, which are in good agreement (Table 1). Despite being inequivalent by symmetry, the eq–eq and eq–ax formate ligands feature electron density distributions of a similar form. Taken together with the intramolecular bond length analysis described above, this observation indicates that the striking differences in the Jeq–eq (Cu–O1–C1–O1–Cu) and Jeq–ax (Cu–O2–C2–O3–Cu) SE interactions likely originates in the Cu–O bonds and not differing characteristics of the formate ligands. Indeed, the bcp charge densities of the two equatorial bonds, Cu–O1 and Cu–O2, are similar and indicate a strong interaction, whereas the bcp charge density for the Cu–O3 axial bonds (occurring along the JT axis) indicates a much weaker interaction.
| Bond | Exp. MM | Calc. MM | ||||
|---|---|---|---|---|---|---|
| ρ | ∇2ρ | ε | ρ | ∇2ρ | ε | |
| Cu–O1 | 0.075(1) | 0.450(1) | 0.24 | 0.070 | 0.436 | 0.19 |
| Cu–O2 | 0.078(1) | 0.462(1) | 0.24 | 0.073 | 0.463 | 0.16 |
| Cu–O3 | 0.027(1) | 0.117(1) | 0.13 | 0.021 | 0.095 | 0.01 |
| O1–C1 | 0.396(3) | −0.927(3) | 0.09 | 0.378 | −1.061 | 0.04 |
| O2–C2 | 0.392(4) | −0.966(6) | 0.04 | 0.375 | −1.076 | 0.04 |
| O3–C2 | 0.399(4) | −0.665(6) | 0.04 | 0.388 | −1.098 | 0.02 |
| N1–C3 | 0.254(3) | −0.482(2) | 0.07 | 0.236 | −0.374 | 0.01 |
Further insight into the ionic or covalent character of the Cu–O interactions can be drawn from the atomic charges integrated within the atomic basins defined by the QTAIM. In DMACuF, all atomic charges are smaller than their formal ionic oxidation states, see Table S3 (ESI†), which indicates a significant level of electron sharing in the interactions – consistent with the covalency apparent in the bcp analysis. Integration of the atomic charges of the eq–eq and eq–ax formate ligands reveals molecular charges of −0.34 and −0.81, respectively. The excess charge density on the eq–ax formate is substantially localized at the axial oxygen (see Fig. 5), further supporting that the key electronic differences between eq–eq and eq–ax SE pathways lie in the Cu–O interactions. The eq–eq formate ligand has a molecular charge that is about 1/3 of the formal charge (−1), which implies a strong electron donation, hence a covalent character, in the equatorial Cu–O bonds. On the contrary, the eq–ax formate ligand has an absolute charge that is only slightly reduced from the formal −1 ionic value, suggesting that the axial Cu–O interactions have a predominately ionic character, in keeping with previous studies.35,36 These empirical differences in Cu–O covalency, and their relationship to the different Jeq–eq and Jeq–ax exchange interactions, can be understood in terms of the electronic orbital configuration of the formate and Cu ions, discussed in detail in the following.
 | ||
| Fig. 5 Difference between charge density distributions of eq–ax formate ion and eq–eq formate ion, where blue and red contours (0.2 e Å−3) represent, respectively, positive and negative regions of electron charge density. | ||
Orbital ordering
Electron density deformation maps calculated from the above experimental charge density analysis (ρMM − ρspherical) allow one to visualize the aspherical part of the charge distribution in terms of regions of electron density depletion or excess. A 2D deformation map of the CuIIO4 equatorial plane is shown in Fig. 6a, and a map containing equatorial (Cu–O1) and axial (Cu–O3) bonds is shown in Fig. 6b. The relative populations of the multipolar functions used to fit the aspherical electron density distribution around the CuII ions were converted into d-orbital populations.37 The result, reported in Table 2, is clearly reflected in the experimental deformation density maps shown in Fig. 6. For example, the partially occupied dx2−y2 orbital is evident as regions of depleted electron density (red contours) pointing towards the equatorial ligands, while the fully occupied dz2 orbital (i.e. d2z2−x2−y2) is observed as regions of excess electron density (blue contours) pointing towards the axial ligands. Hence, Jeq–eq is mediated via two partially occupied dx2−y2 orbitals, whereas Jeq–ax is mediated via a partially occupied dx2−y2 orbital and a fully occupied dz2 orbital. We note that the singularly and fully occupied orbitals may exceed occupancy of 1.0 and 2.0, respectively, since they are based upon d-shaped electron density functions as opposed to exact 3d-orbitals. | ||
| Fig. 6 Experimental static deformation density map (aspherical distribution of the charge density) (a) in the plane defined by CuII equatorial Cu–O bonds and (b) in the plane containing the JT axis (axial bonds) and two equatorial Cu–O bonds. Blue and red contours (0.2 e Å−3) represent, respectively, the excess and depletion of electron density with respect to the spherical atom distribution. | ||
| dx2−y2 | dxz | dxz | dxz | dz | |
|---|---|---|---|---|---|
| Exp. | 1.46(3) | 2.19(3) | 2.16(3) | 1.99(3) | 2.28(3) |
| Calc. | 1.43 | 2.21 | 2.25 | 2.20 | 2.14 |
The GKA rules are used in inorganic perovskites to predict the sign of magnetic SE coupling mediated via oxygen p-orbitals. They depend upon the angle of the metal–oxygen–metal bond and the electronic configurations of the metal d-orbitals. For 180° bonds, the GKA rules predict strong AFM SE between two half-filled eg orbitals, and weak FM SE between filled and half-filled eg orbitals.21 Our neutron diffraction results showed that Jeq–eq is AFM and Jeq–ax is FM, which, taken together with the above electron density analysis, is in perfect agreement with the GKA rules.
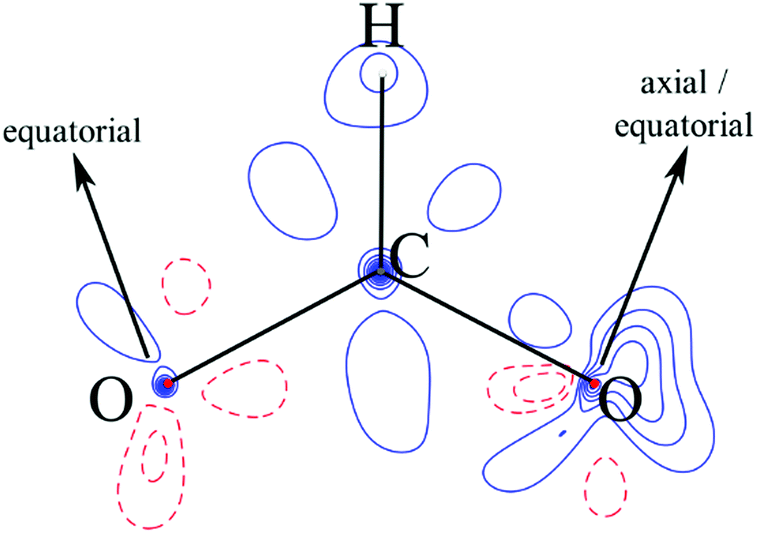
We suggest that the applicability of the GKA rules, in the 180° bond limit, to the hybrid organic/inorganic perovskites is dependent upon the properties of the ligand molecular orbitals. Specifically, the frontier molecular orbital that primarily mediates SE must effectively emulate oxygen p-orbitals by (a) spanning the molecule to guarantee SE via a single molecular orbital, (b) having an appreciable electron density on the extremal atoms that coordinate the metal to allow non-zero overlap with the magnetic orbital of the metal ions, and (c) having symmetric charge density about the molecule middle to ensure that any difference between the two metal–ligand bonds is principally inferred by the electronic configuration of the metal. The molecular orbitals of an isolated formate ion were calculated using gas phase DFT as implemented in Gaussian09.38 The frontier HOMO and HOMO−1 orbitals are shown in Fig. 7, and clearly satisfy our requirements for the GKA rules to apply.
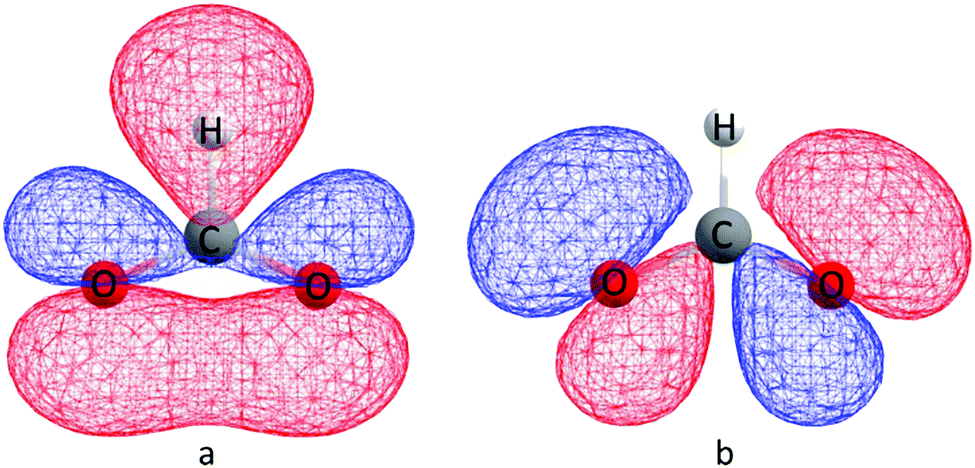 | ||
| Fig. 7 (a) HOMO and (b) HOMO−1 molecular orbitals calculated for the isolated formate HCOO− anion. The geometry was optimized, and the calculation run at the uB3LYP/6-311g(2d,2p) level of theory. | ||
Simulated magnetic properties
The electronic spin density and magnetic exchange coupling constants were further investigated by DFT calculations. The calculated spin density distribution is shown in Fig. 8 and it corroborates the results of the electron charge density analysis. In particular, the quasi-1D magnetic properties of DMACuF are explained by the configuration of the magnetic orbitals. Magnetic lobes are found to run along the Cu-formate-Cu c-axis chains supporting strong SE interactions (Jeq–eq) between singly occupied magnetic orbitals, while along the a + b and a − b directions the singularly occupied orbitals on subsequent CuII ions are mutually orthogonal and therefore SE must involve a fully occupied orbital giving less efficient coupling (Jeq–ax). Accordingly, the CuII equatorial regions are rich in spin density. | ||
| Fig. 8 Calculated spin density distribution represented at an isodensity value of 0.002 a.u. Green and cyan surfaces represent α (↑) and β (↓) spin densities. Yellow sticks represent JT elongated bonds. | ||
An optimized crystal geometry was used to systematically compute the energy, E, of all possible colinear spin states (differences of FM and AFM spin alignments along Jeq–eq and Jeq–ax), where the energy of the system was described by
Conclusions
Powder neutron diffraction and single crystal magnetometry experiments showed that DMACuF has an Ax-type magnetic structure below TN, in which c-axis AFM chains are coupled ferromagnetically in the ab-plane, with magnetic moments aligned along the a-axis. Experimental charge density analysis found that the molecular electronic structure of the formate ligands that mediate both c-axis AFM and ab-plane FM superexchange was to a good approximation the same, demonstrating the primary role of Cu–O bonding in establishing the nature of the exchange – in close analogy with inorganic perovskites. The charge density analysis was also used to reveal the electronic configuration of the CuII ions, which showed that for every CuII ion the singularly occupied dx2−y2 orbital has lobes pointing along the c-axis, which facilitates a strong magnetic superexchange interaction, whereas along the in plane a + b and a − b directions the singularly occupied orbitals on subsequent CuII nodes are orthogonal to each other, greatly reducing the efficiency of the magnetic interaction. The spin density and magnetic exchange energies were estimated by density functional theory calculations, the results of which were fully consistent with the experimental magnetic structure solution and charge density analysis, and corroborated the quasi-1D magnetic properties of DMACuF evident in the field dependent magnetization. Importantly, the experimental determination of the magnetic and electronic structures together demonstrated that the GKA rules, widely used to predict the nature of magnetic exchange in the fully inorganic perovskites, are applicable to this class of hybrid organic–inorganic perovskite. For instance, based on the comparison of bond lengths and oxidation states the electronic properties of the symmetric eq–eq SE pathway in DMACuF are common to those found in Mn, Co, and Ni analogues. We suggest a maximal set of conditions for the ligand molecular orbitals that may guide the more general application of the GKA rules in all hybrid organic–inorganic materials.Conflicts of interest
There are no conflicts to declare.Acknowledgements
R. S. acknowledges support from the Oxford Quantum Materials Platform Grant (EPSRC Ref. EP/M020517/1), the Swiss National Science Foundation (project Nr. P2BEP2_188253), and the exceptional Open Round 2018 of the Faculty of Science of the University of Bern. R. D. J. acknowledges support from a Royal Society University Research Fellowship.Notes and references
- P. Wagner, G. Wackers, I. Cardinaletti, J. Manca and J. Vanacken, Phys. Status Solidi A, 2017, 214, 1–25 Search PubMed.
- H. Liu and X. Yang, Ferroelectrics, 2017, 507, 69–85 CrossRef CAS.
- D. I. Khomskii, J. Magn. Magn. Mater., 2006, 306, 1–8 CrossRef CAS.
- A. Maignan, C. Martin, S. Hébert and V. Hardy, J. Mater. Chem., 2007, 17, 5023–5031 RSC.
- A. Hossain, A. K. M. Atique Ullah, P. Sarathi Guin and S. Roy, J. Sol-Gel Sci. Technol., 2020, 93, 479–494 CrossRef CAS.
- W. Li, Z. Wang, F. Deschler, S. Gao, R. H. Friend and A. K. Cheetham, Nat. Rev. Mater., 2017, 2, 1–18 Search PubMed.
- P. Jain, A. Stroppa, D. Nabok, A. Marino, A. Rubano, D. Paparo, M. Matsubara, H. Nakotte, M. Fiebig, S. Picozzi, E. S. Choi, A. K. Cheetham, C. Draxl, N. S. Dalal and V. S. Zapf, npj Quantum Mater., 2016, 1, 16012 CrossRef.
- A. Stroppa, P. Jain, P. Barone, M. Marsman, J. M. Perez-Mato, A. K. Cheetham, H. W. Kroto and S. Picozzi, Angew. Chem., Int. Ed., 2011, 123, 5969–5972 CrossRef.
- H. L. B. Boström, M. S. Senn and A. L. Goodwin, Nat. Commun., 2018, 9, 2380 CrossRef.
- C. S. Coates, H. J. Gray, J. M. Bulled, H. L. B. Boström, A. Simonov and A. L. Goodwin, Philos. Trans. R. Soc., A, 2019, 377, 20180219 CrossRef CAS.
- G. Kieslich and A. L. Goodwin, Mater. Horiz., 2017, 4, 362–366 RSC.
- M. Mączka, A. Gągor, M. Ptak, W. Paraguassu, T. A. da Silva, A. Sieradzki and A. Pikul, Chem. Mater., 2017, 29, 2264–2275 CrossRef.
- S. Chen, R. Shang, K. L. Hu, Z. M. Wang and S. Gao, Inorg. Chem. Front., 2014, 1, 83–98 RSC.
- K. L. Hu, M. Kurmoo, Z. Wang and S. Gao, Chem. – Eur. J., 2009, 15, 12050–12064 CrossRef CAS.
- Z. Wang, K. Hu, S. Gao and H. Kobayashi, Adv. Mater., 2010, 22, 1526–1533 CrossRef CAS.
- Z. Wang, P. Jain, K. Y. Choi, J. Van Tol, A. K. Cheetham, H. W. Kroto, H. J. Koo, H. Zhou, J. Hwang, E. S. Choi, M. H. Whangbo and N. S. Dalal, Phys. Rev. B: Condens. Matter Mater. Phys., 2013, 87, 224406 CrossRef.
- P. J. Baker, T. Lancaster, I. Franke, W. Hayes, S. J. Blundell, F. L. Pratt, P. Jain, Z. M. Wang and M. Kurmoo, Phys. Rev. B: Condens. Matter Mater. Phys., 2010, 82, 012407 CrossRef.
- J. B. Goodenough, Phys. Rev., 1955, 100, 564–573 CrossRef CAS.
- J. Kanamori, J. Phys. Chem. Solids, 1959, 10, 87–98 CrossRef CAS.
- P. W. Anderson, Phys. Rev., 1950, 79, 350–356 CrossRef.
- S. V. Streltsov and D. I. Khomskii, Uspekhi Fiz. Nauk, 2017, 187, 1205–1235 CrossRef.
- A. M. Glazer, Acta Crystallogr., Sect. B: Struct. Crystallogr. Cryst. Chem., 1972, 28, 3384–3392 CrossRef CAS.
- B. J. Campbell, H. T. Stokes, D. E. Tanner and D. M. Hatch, J. Appl. Crystallogr., 2006, 39, 607–614 CrossRef CAS.
- G. M. Sheldrick, Acta Crystallogr., Sect. C: Struct. Chem., 2015, 71, 3–8 Search PubMed.
- N. K. Hansen and P. Coppens, Acta Crystallogr., Sect. A: Cryst. Phys., Diffr., Theor. Gen. Crystallogr., 1978, 34, 909–921 CrossRef.
- A. Valkov, P. Macchi, L. J. Farrugia, C. Gatti, P. Mallinson, T. Richter and T. Koritsanszky, XD2016, 2016.
- P. J. Becker and P. Coppens, Acta Crystallogr., Sect. A: Cryst. Phys., Diffr., Theor. Gen. Crystallogr., 1975, 31, 417–425 CrossRef.
- A. Ø. Madsen, J. Appl. Crystallogr., 2006, 39, 757–758 CrossRef CAS.
- R. Dovesi, R. Orlando, A. Erba, C. M. Zicovich-Wilson, B. Civalleri, S. Casassa, L. Maschio, M. Ferrabone, M. De La Pierre, P. D’Arco, Y. Noël, M. Causà, M. Rérat and B. Kirtman, Int. J. Quantum Chem., 2014, 114, 1287–1317 CrossRef CAS.
- E. Sletten and L. H. Jensen, Acta Crystallogr., Sect. A: Cryst. Phys., Diffr., Theor. Gen. Crystallogr., 1973, 29, 1752–1756 CrossRef CAS.
- E. F. Bertaut, Magnetism, Academic, New York, 1963, vol. III Search PubMed.
- S. Chakravarty, B. I. Halperin and D. R. Nelson, Phys. Rev. Lett., 1988, 60, 1057–1060 CrossRef.
- J. Brambleby, P. A. Goddard, R. D. Johnson, J. Liu, D. Kaminski, A. Ardavan, A. J. Steele, S. J. Blundell, T. Lancaster, P. Manuel, P. J. Baker, J. Singleton, S. G. Schwalbe, P. M. Spurgeon, H. E. Tran, P. K. Peterson, J. F. Corbey and J. L. Manson, Phys. Rev. B: Condens. Matter Mater. Phys., 2015, 92, 1–15 CrossRef.
- R. F. W. Bader, Atoms in molecules: a quantum theory, Clarendon Press, 1990, p. 438 Search PubMed.
- R. Scatena, Y. T. Guntern and P. Macchi, J. Am. Chem. Soc., 2019, 141, 9382–9390 CrossRef CAS.
- P. Herich, L. Bučinský, M. Breza, M. Gall, M. Fronc, V. Petřiček and J. Kožíšek, Acta Crystallogr., Sect. B: Struct. Sci., Cryst. Eng. Mater., 2018, 74, 681–692 CrossRef CAS.
- A. Holladay, P. Leung and P. Coppens, Acta Crystallogr., Sect. A: Found. Crystallogr., 1983, 39, 377–387 CrossRef.
- M. J. Frisch, G. W. Trucks, H. B. Schlegel, G. E. Scuseria, M. A. Robb, J. R. Cheeseman, G. Scalmani, V. Barone, B. Mennucci, H. N. G. A. Petersson, M. Caricato, X. Li, H. P. Hratchian, A. F. Izmaylov, J. Bloino, G. Zheng, J. L. Sonnenberg, M. Hada, M. Ehara, K. Toyota, R. Fukuda, J. Hasegawa, M. Ishida, T. Nakajima, Y. Honda, O. Kitao, H. Nakai, T. Vreven, J. A. Montgomery. Jr., J. E. Peralta, F. Ogliaro, M. Bearpark, J. J. Heyd, E. Brothers, K. N. Kudin, V. N. Staroverov, R. Kobayashi, J. Normand, K. Raghavachari, A. Rendell, J. C. Burant, S. S. Iyengar, J. Tomasi, M. Cossi, N. Rega, J. M. Millam, M. Klene, J. E. Knox, J. B. Cross, V. Bakken, C. Adamo, J. Jaramillo, R. Gomperts, R. E. Stratmann, O. Yazyev, A. J. Austin, R. Cammi, C. Pomelli, J. W. Ochterski, R. L. Martin, K. Morokuma, V. G. Zakrzewski, G. A. Voth, P. Salvador, J. J. Dannenberg, S. Dapprich, A. D. Daniels, Ö. Farkas, J. B. Foresman, J. V. Ortiz, J. Cioslowski and D. J. Fox, Gaussian 09, 2009 Search PubMed.
Footnote |
| † Electronic supplementary information (ESI) available: The ESI include a PDF file with: graphs and fitting of magnetization measures, tables of the crystallographic information, fitting of neutron diffraction data, simulated pattern for magnetic structures and table of integrated charges; and CIF files of the charge density multipolar model at 110 K and of the powder neutron diffraction refinements at 1.5 and 10 K. See DOI: 10.1039/d0tc03913f |
| This journal is © The Royal Society of Chemistry 2020 |