
Multiple photoluminescence of spiro[acridine-fluorene]-based o-carboranyl compounds with potential as a visual sensory material†
Min Sik
Mun‡
,
Chan Hee
Ryu‡
,
Hyunhee
So
,
Mingi
Kim
,
Ji Hye
Lee
 ,
Hyonseok
Hwang
and
Kang Mun
Lee
*
,
Hyonseok
Hwang
and
Kang Mun
Lee
*
Department of Chemistry, Institute for Molecular Science and Fusion Technology, Kangwon National University, Chuncheon, Gangwon 24341, Republic of Korea. E-mail: kangmunlee@kangwon.ac.kr
First published on 20th October 2020
Abstract
Two spiro[acridine-9,9′-fluorene]-based closo-o-carboranyl compounds, namely p-SAC and o-SAC, were prepared and fully characterized. p-SAC exhibited a weak high energy emission trace only in tetrahydrofuran (THF) at 298 K, while the photoluminescence (PL) spectra at 77 K exhibited intense emission in the low energy region. However, o-SAC exhibited an excellent dual-emissive pattern in THF at both 298 and 77 K. The electronic transition in each excited state (S1) was calculated, which confirmed that the high and low energy emission originated from locally excited (LE) states on the fluorene moieties and intramolecular charge-transfer (ICT) transitions corresponding to o-carboranes, respectively. All these characteristics indicated that ICT-based radiative decay was only favored in the rigid state, where structural fluctuations were restricted. Energy barriers were calculated based on relative energies at various dihedral angles around the o-carborane cages in p-SAC and o-SAC. The rotational motion of the o-carborane cage was less restricted in p-SAC when compared to o-SAC, resulting in suppression of the ICT-based emission when p-SAC was in solution. The PL experiments in the THF/water mixtures indicated that these features were caused by the aggregation-induced emission (AIE) effect. An acetonitrile solution containing relatively high concentrations of o-SAC (ca. 10−3 M) exhibited a dramatic emission color change from deep red to sky blue when the temperature was increased. The higher temperature caused a natural conversion from a colloidal state (slightly aggregated) to a clear solution. Consequently, the photophysical features of p-SAC and o-SAC demonstrated the application potential of π-aromatic conjugated o-carboranyl compounds as visual sensory materials.
Introduction
closo-Carborane (C2B10H12) is a well-known icosahedral boron-cluster component,1–3 and is considered as a three-dimensional (3D) variant of benzene. The high electronic and thermal stability of closo-carborane has led to its extensive use as a 3D analogue molecule in a wide variety of novel materials, such as boron neutron capture therapy (BNCT) medications,4–7 novel ligands of supramolecular building blocks,8–14 and promising optoelectronic materials.15,16 In particular, π-conjugated aromatic group assembled closo-ortho-carborane (1,2-C2B10H12) exhibits unique photophysical properties due to strong electron withdrawal via C-substitution and high polarizability of its σ-aromaticity.17–56 The electronic features of o-carborane lead to intramolecular charge-transfer (ICT) transitions between the π-conjugated aromatic moiety and the o-carborane cage,21–46 resulting in the formation of an advantageous donor (D, aromatic group)–acceptor (A, o-carborane) system. A recent report found that this ICT process in D–A conjugated systems can be controlled using strategic molecular geometry design. Fox et al. reported that D–A-type C-diazaboryl-o-carboranes exhibit two different excited states depending on the rotational motion of the diazaboryl derivatives.40 The twisted intramolecular charge-transfer (TICT) states within o-carboranes comprising various fluorescent donor groups lead to multiple photoluminescence emission.47–56 Furthermore, our group recently reported that the structure of the molecular scaffold itself, particularly the planarity of the π-aromatic groups, played a dominant role in efficiently adjusting the radiative decay of the locally excited (LE) states centered at the π-aromatic groups and ICT transition corresponding to the o-carborane moiety.44,45The effect of molecular structure on the intramolecular electronic transitions of o-carborane D–A conjugate systems has been validated based on the aggregation-induced emission (AIE) phenomenon. The radiative decay in the conjugates due to ICT transition is generally suppressed in the solution state at ambient temperature due to numerous molecular motions around the o-carborane cages (e.g. rotational motion of the o-carborane cage and C–C bond variation). However, the radiative efficiency of the ICT emission is dramatically enhanced in an aggregated solid state due to severe restriction of the molecular structure.18,46,57–67 Further, the AIE of o-carborane conjugates can also be tuned by changing the number and position of substituents on the o-carborane moiety.66,67
The effects of structural features and molecular geometry on the photophysical properties of o-carboranyl D–A conjugated systems have been previously reported. These studies provide strong evidence that emissive characteristics can be controlled via strategic molecular design. Specifically, a unique structural formation of appended π-aromatic groups on o-carborane shows promise. By extension, the previous findings demonstrated the promise of these conjugate systems as novel candidates for single-molecule visual sensing materials with a prompt emissive response. Therefore, the structure of molecular scaffolds appended to o-carborane played a significant role in embodying the o-carborane based sensory materials, showing remarkable photophysical characteristics. In line with this concept, we have a constant interest in spirobifluorene derivatives as one of the mother scaffolds for o-carborane based materials possessing intriguing photophysical features, because these D–A conjugated systems apparently exhibited both strong ICT-based emission and AIE phenomenon.56
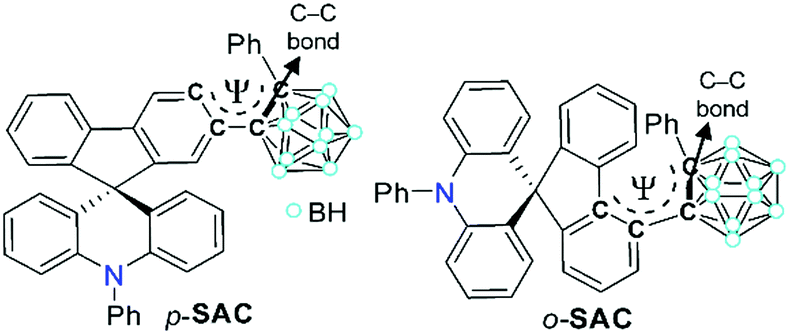
To further investigate such an intrinsic concept for the o-carboranyl-based D–A type conjugated systems, herein we explore whether the spirobifluorene-derivative-based o-carboranyl conjugates can exhibit complex multiple photoluminescence behavior, depending on their structural properties, which can be useful in the design of a novel visual-sensing material. The synthesis and photophysical properties of two 10-phenyl-10H-spiro[acridine-9,9′-fluorene]-based o-carboranyl compounds, namely p-SAC and o-SAC (Scheme 1), were evaluated. p-SAC and o-SAC were produced by introducing o-carboranes to the para- or ortho-positions of each fluorene moiety, respectively. This was the first report of spiro[acridine-9,9′-fluorene] possessing o-carborane groups. This study investigated the relationship between the rotational motion of the o-carborane cages and the radiative decay efficiency of the ICT-based emission. Further, an insight into the strategic directivity of using carboranyl conjugates as visual sensory materials was provided. Detailed synthetic procedures, characterization, optical properties (with theoretical calculations), and the application of o-carboranyl conjugates to sensing materials have been described.
 | ||
| Scheme 1 Synthetic routes for the formation of spiro[acridine-9,9′-fluorene]-based o-carboranyl compounds (p-SAC and o-SAC). Reagents and conditions: (i) ethynylbenzene, CuI, PdCl2(PPh3)2, toluene/NEt3, 110 °C, 24 h. (ii) B10H14, Et2S, toluene, 110 °C, 24 h. | ||
Experimental
General considerations
All experiments were carried out under an inert N2 atmosphere using standard Schlenk and glove box techniques. Anhydrous solvents (toluene, THF, n-hexane, diethyl ether, methanol, and trimethylamine (NEt3); Sigma-Aldrich) were dried by passing each solvent through an activated alumina column. The solvents were stored over activated molecular sieves (5 Å). Spectrophotometric-grade solvents (toluene, THF, dichloromethane (DCM), acetone, acetonitrile (ACN), ethanol and n-hexane) were used as received from Alfa Aesar. Commercial reagents were used as received from Sigma-Aldrich, including 2-bromo-N,N-diphenylaniline, 9H-fluoren-9-one, 2-bromo-9H-fluoren-9-one, 4-bromo-9H-fluoren-9-one, acetic acid, saturated aqueous hydrochloric acid solution, magnesium sulfate (MgSO4), sodium chloride (NaCl), sodium bicarbonate (NaHCO3), 1.6 M n-butyllithium in hexane (n-BuLi), ethynylbenzene, bis(triphenylphosphine)palladium(II) dichloride (Pd(PPh3)2Cl2), copper(I) iodide (CuI), diethyl sulfide (Et2S), and poly(methyl methacrylate) (PMMA), and Alfa Aesar (decaborane (B10H14) and basic alumina). Deuterated solvents (chloroform-d1 (CDCl3) and dichloromethane (CD2Cl2)) were obtained from Cambridge Isotope Laboratories and were dried over activated molecular sieves (5 Å). Nuclear magnetic resonance (NMR) spectra were recorded on a Bruker Avance 400 spectrometer (400.13 MHz for 1H{11B}, 100.62 MHz for 13C, and 128.38 MHz for 11B{1H}) at ambient temperature. Chemical shifts are given in ppm, and are referenced against external tetramethyl tin(IV) (Me4Si) (1H{11B} and 13C) and/or BF3·Et2O (11B{1H}). Elemental analyses, high resolution (HR)-mass spectroscopy, and dynamic light scattering (DLS) measurements were performed on an EA3000 instrument (EuroVector), JMS-700 (JEOL), and Mastersizer 3000 (Malvern Instrument) at the Central Laboratory of Kangwon National University, respectively. 10-Phenyl-10H-spiro[acridine-9,9′-fluorene] (SA) and both bromo-precursors (p-BrSA and o-BrSA) were prepared following previously reported procedures.68 The detailed synthesis procedures and spectroscopic data for SA, p-BrSA and o-BrSA are given in the ESI.†General synthetic method for acetylene precursors
The acetylene precursors (p-SAE and o-SAE) were synthesized using an adequate amount of starting materials. A cannula was used to add toluene and NEt3 (v/v, 2/1, 15 mL) to the mixture of bromo-precursors, CuI, and Pd(PPh3)2Cl2 at 25 °C. The reaction mixture was stirred for 10 min and ethynylbenzene (1.3 equiv. per bromo-precursor) was added to the resulting dark brown slurry. The reaction mixture was refluxed at 110 °C for 24 h. The volatiles were removed via rotary evaporation to produce a dark brown residue. The remaining solid was washed sequentially with MeOH and n-hexane, and purified by column chromatography on silica (DCM/n-hexane = 1/8, v/v) to produce white solid acetylene precursors.Data for p-SAE
p-BrSA (0.98 g, 2.0 mmol), CuI (34 mg, 0.18 mmol), PdCl2(PPh3)2 (0.12 g, 0.18 mmol), and ethynylbenzene (0.28 mL, 2.6 mmol) afforded p-SAE as a white solid. Yield = 50% (0.50 g). 1H NMR (CDCl3): δ 7.81 (dd, J = 7.8, 2.4 Hz, 2H), 7.72 (t, J = 7.6 Hz 2H), 7.59 (t, J = 8.4 Hz, 3H) 7.50 (m, 4H), 7.44 (d, J = 8.2 Hz, 1H), 7.40 (td, J = 7.6, 2.2 Hz, 1H), 7.32 (m, 4H), 6.94 (td, J = 8.5, 1.6 Hz, 2H), 6.59 (td, J = 8.4, 2.0 Hz, 2H), 6.43 (dd, J = 7.8, 1.5 Hz, 2H), 6.37 (dd, J = 8.4, 0.9 Hz, 2H). 13C NMR (CDCl3): δ 157.29, 156.83, 141.33, 141.09, 139.65, 138.47, 131.62, 131.42, 131.30, 131.20, 129.30, 128.95, 128.59, 128.43, 128.27, 128.00, 127.81, 127.45, 125.98, 124.21, 123.38, 122.89, 120.67, 120.28, 119.98, 114.85, 90.16 (acetylene-C), 89.85 (acetylene-C), 56.85 (spiro-C). Anal. calcd for C39H25N: C, 92.28; H, 4.96; N, 2.76. Found: C, 91.96; H, 4.88; N, 2.54.Data for o-SAE
o-BrSA (1.1 g, 2.3 mmol), CuI (34 mg, 0.18 mmol), PdCl2(PPh3)2 (0.12 g, 0.18 mmol), and ethynylbenzene (0.32 mL, 3.0 mmol) afforded o-SAE as a white solid. Yield = 38% (0.43 g). 1H NMR (CD2Cl2): δ 8.65 (d, J = 7.6 Hz, 1H), 7.71 (m, 4H), 7.60 (d, J = 8.0 Hz, 1H), 7.55 (dd, J = 8.2, 2.4 Hz, 1H), 7.50 (m, 2H), 7.45 (m, 4H), 7.41 (m, 2H), 7.33 (td, J = 7.7, 1.1 Hz, 1H), 7.27 (t, J = 7.6 Hz, 1H), 6.92 (td, J = 8.6, 1.6 Hz, 2H), 6.55 (td, J = 7.6, 1.2 Hz, 2H), 6.37 (d, J = 8.0 Hz, 2H), 6.5 (d, J = 7.8 Hz, 2H). 13C NMR (CD2Cl2): δ 157.29, 157.01, 141.40, 140.95, 139.06, 138.89, 132.02, 131.61, 131.17, 131.12, 128.89, 128.71, 128.66, 128.58, 127.97, 127.77, 127.55, 127.39, 125.79, 125.45, 124.32, 123.28, 122.85, 120.48, 116.58, 114.88, 93.75 (acetylene-C), 88.35 (acetylene-C), 56.40 (spiro-C). Anal. calcd for C39H25N: C, 92.28; H, 4.96; N, 2.76. Found: C, 92.01; H, 4.89; N, 2.62.General synthetic method for spiro[acridine-9,9′-fluorene] based o-carborane compounds
An excess amount of diethyl sulfide (Et2S, 5 equiv. of acetylene moiety) was added to a toluene solution (10 mL) of decaborane (B10H14, 1.2 equiv. per acetylene moiety) and acetylene precursors at 25 °C. The reaction mixture was heated to reflux and stirred for 24 h. The solvent was removed under vacuum and methanol (5 mL) was added. The resulting yellow solid was filtered and redissolved in toluene. The solution was purified by passing through a basic alumina column, and the solvent was removed in vacuo. The crude product was purified via recrystallization from n-hexane to produce the two o-carborane compounds as white solids.Data for p-SAC
p-SAE (0.25 g, 0.50 mmol), B10H14 (73 mg, 0.60 mmol), and Et2S (0.27 mL, 2.5 mmol) afforded p-SAC as a white solid. Yield = 38% (0.12 g). 1H{11B decoupled} NMR (CDCl3): δ 7.80 (t, J = 7.4 Hz, 2H), 7.67 (m, 3H), 7.60 (d, J = 8.0 Hz, 2H), 7.54 (m, 2H), 7.47 (d, J = 8.0 Hz, 1H), 7.35 (t, J = 7.5 Hz, 1H), 7.29 (d, J = 4.2 Hz, 3H), 7.18 (t, J = 8.0 Hz, 1H), 7.02 (m, 4H), 6.58 (t, J = 6.8 Hz, 2H), 6.46 (d, J = 8.3 Hz, 2H), 6.16 (d, J = 8.8 Hz, 2H), 3.26 (br s, 2H, CB-BH), 2.54 (br s, 5H, CB-BH), 2.35 (br s, 3H, CB-BH), 2.22 (br s, 1H, CB-BH). 13C NMR (CDCl3): δ 156.55, 155.30, 141.90, 141.49, 140.93, 136.96, 131.29, 131.18, 130.68, 130.49, 130.34, 130.06, 129.42, 128.72, 128.70, 128.29, 127.87, 127.55, 126.81, 125.61, 124.27, 120.82, 120.66, 119.59, 114.86, 86.14 (CB-C), 85.54 (CB-C), 57.10 (spiro-C). 11B{1H decoupled} NMR (CDCl3): δ −3.19 (br s, 3B), −10.03 (br s, 3B), −11.38 (br s, 4B). Anal. Calcd for C39H35B10N: C, 74.85; H, 5.64; N, 2.24. Found: C, 74.77; H, 5.49; N, 2.10. HR-mass (ESI): m/z calcd for C39H35B10N: 627.3700. Found: 627.3704.Data for o-SAC
o-SAE (0.25 g, 0.50 mmol), B10H14 (73 mg, 0.60 mmol), and Et2S (0.27 mL, 2.5 mmol) afforded p-SAC as a white solid. Yield = 29% (0.09 g). 1H{11B decoupled} NMR (CD2Cl2): δ 8.78 (d, J = 8.2 Hz, 1H), 7.94 (d, J = 8.1 Hz, 1H), 7.69 (t, J = 7.3 Hz, 2H), 7.57 (t, J = 8.0 Hz, 1H), 7.40 (t, J = 9.2 Hz, 5H), 7.26 (m, 4H), 7.10 (m, 3H), 6.85 (t, J = 7.8 Hz, 2H), 6.43 (t, J = 7.4 Hz, 2H), 6.27 (d, J = 8.1 Hz, 2H), 5.76 (d, J = 7.8 Hz, 2H), 3.78 (br s, 2H, CB-BH), 3.05 (br s, 2H, CB-BH), 2.62 (br s, 2H, CB-BH), 2.52 (br s, 4H, CB-BH). 13C NMR (CD2Cl2): δ 160.11, 158.70, 141.06, 140.81, 140.61, 136.51, 135.70, 131.18, 131.04, 130.88, 130.64, 130.28, 129.43, 129.10, 128.81, 128.61, 128.22, 127.69, 127.57, 127.29, 126.58, 126.52, 125.72, 124.17, 120.41, 114.91, 90.18 (CB-C), 89.87 (CB-C), 55.89 (spiro-C). 11B{1H} NMR (CD2Cl2): δ −2.37 (br s, 3B), −3.38 (br s, 2B), −9.74 (br s, 2B), −11.03 (br s, 3B). Anal. calcd for C39H35B10N: C, 74.85; H, 5.64; N, 2.24. Found: C, 74.75; H, 5.58; N, 2.08. HR-mass (ESI): m/z calcd for C39H35B10N: 627.3700. Found: 627.3703.Photophysical measurements
UV/Vis absorption and PL spectra of p-SAC and o-SAC were acquired using V-530 (Jasco) and Fluoromax-4P spectrophotometers (HORIBA), respectively. The solution UV/Vis absorption and PL measurements were performed at 298 K in degassed THF with a 1-cm quartz cuvette (5.0 × 10⁻⁵ M). PL measurements were also carried out under various conditions, including in different solvents (toluene, DCM, ACM, and THF/distilled water mixtures (5.0 × 10⁻⁵ M)), in THF solution (5.0 × 10⁻⁵ M) at 77 K, and in the film state at 298 K. Thin films of p-SAC and o-SAC in PMMA were obtained by spin-coating a THF solution (1 mL) of PMMA (50 mg) containing either o-carborane compound (5 wt% versus PMMA) on a 10 × 10 mm quartz plate (thickness = 1 mm). The absolute photoluminescence quantum yields (PLQYs) in THF solution (5.0 × 10⁻⁵ M) and the film state, and CIE 1931 color coordinates of o-SAC in acetonitrile (7.0 × 10⁻⁴ M) were obtained at 298 K using a 3.2 inch integrating sphere (FM-sphere, HORIBA) equipped on a Fluoromax-4P spectrophotometer (HORIBA). Fluorescence decay lifetimes in THF solution (5.0 × 10⁻⁵ M) and in the film state were measured at 298 K using a time-correlated single-photon counting (TCSPC) spectrometer (FLS920–EDINBURGH instrument at the Central Laboratory of Kangwon National University) equipped with a EPL-375 ps pulsed semiconductor diode laser excitation source and a microchannel plate photomultiplier tube (MCP-PMT, 200–850 nm) detector.X-ray crystallography
Single o-SAC crystals were grown for X-ray diffraction from DCM and methanol mixtures. The single crystals were coated with paratone oil and mounted onto a glass capillary. Crystallographic measurements were performed using a Bruker D8QUEST CCD area detector diffractometer with graphite-monochromated Mo-Kα radiation (λ = 0.71073 Å). The structure was assessed using direct methods, and all nonhydrogen atoms were subjected to anisotropic refinement by a full-matrix least-squares method on F2 by using the SHELXTL/PC software package. The X-ray crystallographic data of o-SAC were presented in CIF format. CCDC 2008760.† Hydrogen atoms were placed at their geometrically calculated positions and refined using a riding model on the corresponding carbon atoms with isotropic thermal parameters. The detailed crystallographic data are given in Tables S1 and S2 (ESI†).Computational calculation studies
The geometries of p-SAC and o-SAC in their ground (S0) and first-excited (S1) states in THF were optimized at the B3LYP/6-31G(d,p)69 level of theory. Vertical excitation energies in the optimized S0 and S1 state geometries were calculated using the TD-DFT method70 at the same level of theory. Solvent effects were evaluated using the self-consistent reaction field (SCRF) based on the integral equation formalism of the polarizable continuum model (IEFPCM) with THF as the solvent.71 The most stable geometries were determined by constructing one-dimensional potential energy surfaces (PESs) as a function of dihedral angle (Ψ) by rotating the o-carborane cage vide infra (Fig. 5) between ca. −180° and 180° at intervals of 30° to give a total of 13 initial conformations for each compound. Conformations that exhibited physically impossible atomic overlaps were excluded from further geometry optimization. The dihedral angle was fixed while the other geometrical variables were fully relaxed for geometry optimization and energy calculation of the resulting initial conformations using the Gaussian 16 software program.72 The contribution (%) of a group in a molecule to each molecular orbital was calculated using the GaussSum 3.0 software program,73 while GaussView 6 was used to visualize the molecular properties.74Results and discussion
Synthesis and characterization
The synthetic routes for two 10-phenyl-10H-spiro[acridine-9,9′-fluorene]-based compounds, namely p-SAC and o-SAC, with o-carborane cages appended at the para- or ortho-positions of each fluorene moiety, respectively, are given in Scheme 1. The bromo-precursors (p-BrSA and o-BrSA) were prepared according to previously reported procedures.68 The mother-scaffold structure, namely 10-phenyl-10H-spiro[acridine-9,9′-fluorene] (SA), was synthesized,68 and its optical properties were compared with p-SAC and o-SAC (see the Experimental section for detailed schemes). Sonogashira couplings between ethynylbenzene and either p-BrSA or o-BrSA led to the formation of p-SAE and o-SAE, respectively, with moderate yields (50 and 23%, respectively). p-SAC and o-SAC were prepared via a cage forming reaction between decaborane (B10H14) and either p-SAE or o-SAE in the presence of Et2S, respectively (Scheme 1).75–77The precursors and o-carboranyl compounds were fully characterized using multinuclear nuclear magnetic resonance (NMR) spectroscopy, HR-mass spectroscopy (Fig. S1–S11 in the ESI†), and elemental analysis. The 11B-decoupled 1H (1H{11B}) and 13C NMR spectra of p-SAC and o-SAC exhibited resonances attributed to the aromatic groups, namely spiro[acridine-9,9′-fluorene] moieties and terminal phenyl groups, as expected. Several broad peaks between −2 and −12 ppm in the 1H{11B} NMR spectra and two peaks around 90 to 80 ppm in the 13C NMR spectra clearly indicated the presence of B–H bonds (total of 10 H atoms) and carbon atoms in the closo-o-carborane cages. Further, the single peak at ca. 56 ppm in the 13C NMR spectra of both compounds confirmed the presence of quaternary carbon atoms. All of the 1H-decoupled 11B NMR (11B{1H}) spectral peaks were integrated to a total of 10 boron atoms. The peak spanning −2 to −4 ppm in the p-SAC spectrum was broadly detected as a single peak (−3.19 ppm, 3 B atoms), but was represented by two peaks in the o-SAC spectrum (−2.37 and −3.38 ppm, 3 and 2 B atoms). This observation suggested that the structural variation around the o-carborane moiety of p-SAC was much larger than in o-SAC.
The structural variation behavior of o-SAC was evaluated based on the molecular structure of o-SAC in the solid state, as determined using X-ray crystallography (Fig. 1). The detailed parameters, including selected bond length and angles, are provided in Tables S1 and S2 (ESI†). The structure of o-SAC comprised a tetrahedral carbon center (average bond angle around C15 = 109.37°, Fig. 1 and Table S2, ESI†) in the spirofluorene moiety with an o-carborane cage. The nitrogen atom in the acridine moiety adopted a perfect trigonal planar geometry, as evidenced by the sum of the three C–N–C angles (ΣC–N–C = 359.9° = 120.8° + 120.0° + 119.1°), resulting in sp2-orbital hybridization. These structural features suggested that the entire 10-phenyl-10H-spiro[acridine-9,9′-fluorene] component became electronically delocalized. The fluorene group linked to the o-carborane cage in o-SAC was significantly distorted, where the angle between the two phenyl rings was 12.9° (Fig. 1b). These structural features were attributed to severe steric hindrance around the carborane cage in o-SAC, indicating that structural variation centered at the cage was very restricted.
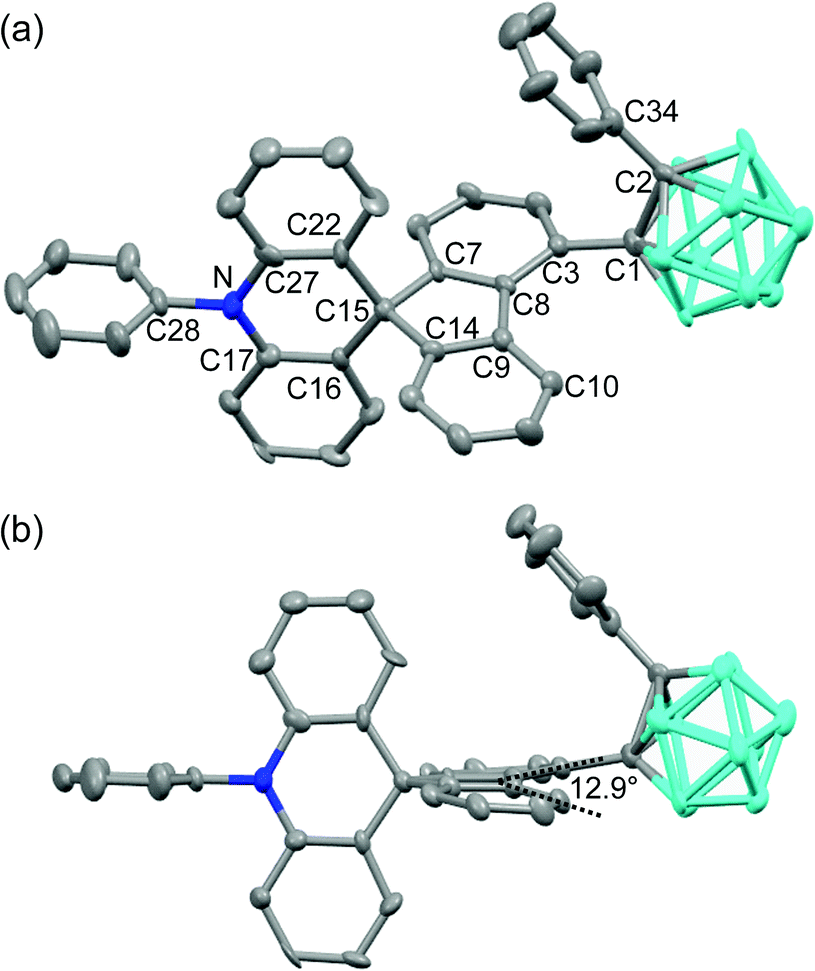 | ||
| Fig. 1 X-ray crystal structure of o-SAC (50% thermal ellipsoids), where the solvents in the unit cell and H atoms have been omitted for clarity. (a) Single molecule of o-SAC and (b) distorted structure of o-SAC. | ||
Theoretical calculation of photophysical properties in solution states
The photophysical properties of p-SAC and o-SAC were investigated using ultraviolet-visible (UV-vis) absorption and photoluminescence (PL) spectroscopy (Fig. 2 and Table 1). Prominent absorption bands centered at 285 nm in the p-SAC spectrum and at 278 nm in the o-SAC spectrum were attributed to vibronic structures undergoing spin-allowed π–π* transitions within the spiro[acridine-9,9′-fluorene] moiety. SA exhibited similar strong absorption peaks in this region (Fig. S12 ESI,†λabs = 268 nm (ε = 11![[thin space (1/6-em)]](https://www.rsc.org/images/entities/char_2009.gif) 500 M−1 cm−1), 297 nm (8600 M−1 cm−1)). Low-energy absorption between 310 and 340 nm with substantial tailing to 350 nm was observed. The broad absorption features were attributed to typical ICT transitions in the o-carborane cages. Low-energy absorption bands were not observed in the spectrum of SA (Fig. S12, ESI†). The UV-vis spectral properties were highly consistent with the theoretical calculations (vide infra).
500 M−1 cm−1), 297 nm (8600 M−1 cm−1)). Low-energy absorption between 310 and 340 nm with substantial tailing to 350 nm was observed. The broad absorption features were attributed to typical ICT transitions in the o-carborane cages. Low-energy absorption bands were not observed in the spectrum of SA (Fig. S12, ESI†). The UV-vis spectral properties were highly consistent with the theoretical calculations (vide infra).
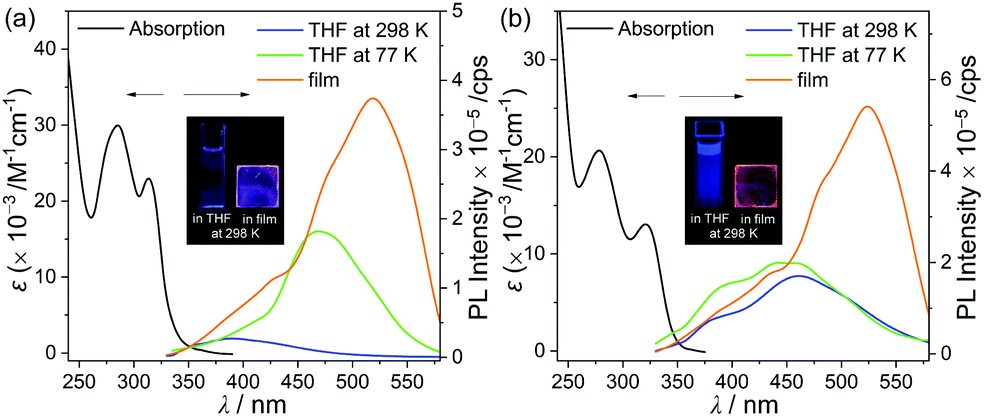 | ||
| Fig. 2 UV-vis absorption and PL spectra of (a) p-SAC (λex = 313 nm) and (b) o-SAC (λex = 321 nm). Black: absorption spectra in THF solution (5.0 × 10⁻⁵ M); blue: PL spectra in THF solution (5.0 × 10⁻⁵ M) at 298 K; green: PL spectra in THF solution (5.0 × 10⁻⁵ M) at 77 K; and orange: PL spectra in a film (5 wt% doped with PMMA) at 298 K. The inset figures show the emission color in each state under the irradiation of a hand-held UV lamp (λex = 295 nm). | ||
| λ abs /nm (ε × 10−3 M−1 cm−1) | λ ex/nm | λ em/nm | Φ em | τobs/ns | k r /×107 s−1 | k nr /×108 s−1 | |||||||||
|---|---|---|---|---|---|---|---|---|---|---|---|---|---|---|---|
| Tolb | THFb | ACNb | 77 Ka | Filmc | THFb | Filmc | THFb | Filmc | THFb | Filmc | THFb | Filmc | |||
| a 5.0 × 10⁻⁵ M in THF. b 5.0 × 10⁻⁵ M, observed at 298 K. c Measured in the film state (5 wt% doped with PMMA). d Absolute PL quantum yield. e k r = Φem/τobs. f k nr = kr(1/Φem − 1). | |||||||||||||||
| p-SAC | 285 (30.0), 313 (23.0) | 313 | 386 | 388 | 389 | 469 | 428 (sh), 520 | <0.01 | 0.05 | —g | 4.0 | — | 1.3 | — | 2.5 |
| o-SAC | 278 (20.7), 321 (13.0) | 321 | 418 | 391 (sh), 461 | 491 | 393 (sh), 445 | 440 (sh), 524 | 0.06 | 0.19 | 4.6 | 3.2 | 1.3 | 5.9 | 2.0 | 2.5 |
The origin of the electronic transitions within p-SAC and o-SAC was determined using time-dependent density functional theory (TD-DFT) calculations. The ground (S0) and first-excited (S1) states of the compounds were optimized at the B3LYP/6-31G(d) level of theory (Fig. 3 and Table 2). The calculated structure of o-SAC was based on its solid-state structure. An integral equation formalism of the polarizable continuum model (IEFPCM) was applied to account for the effect of tetrahydrofuran (THF) solvent.71 The S0 state calculations indicated that the lowest-energy electronic transitions for p-SAC and o-SAC were mainly associated with the highest occupied molecular orbital (HOMO) and transitions from the HOMO−1 to the lowest unoccupied molecular orbital (LUMO) (Fig. 3 and Table 2). The LUMO on the fluorene moieties was typically occupied (63% in p-SAC and 64% in o-SAC, Tables S4 and S6, ESI†), as well as a substantial proportion of the o-carborane units (29% in p-SAC and 27% in o-SAC). However, the HOMO and HOMO−1 of both compounds were predominantly localized on the triphenylamine (>96% in p-SAC and o-SAC, Tables S4 and S6 ESI†) and fluorene groups (>77% in p-SAC and o-SAC), respectively. Thus, the lowest-energy electronic transition (HOMO → LUMO) of p-SAC and o-SAC was attributed to ICT transitions from the triphenylamine to the fluorene and o-carborane units. Furthermore, the intense absorption bands centered at ca. 280 nm were mainly attributed to fluorene centered π–π* local transitions.
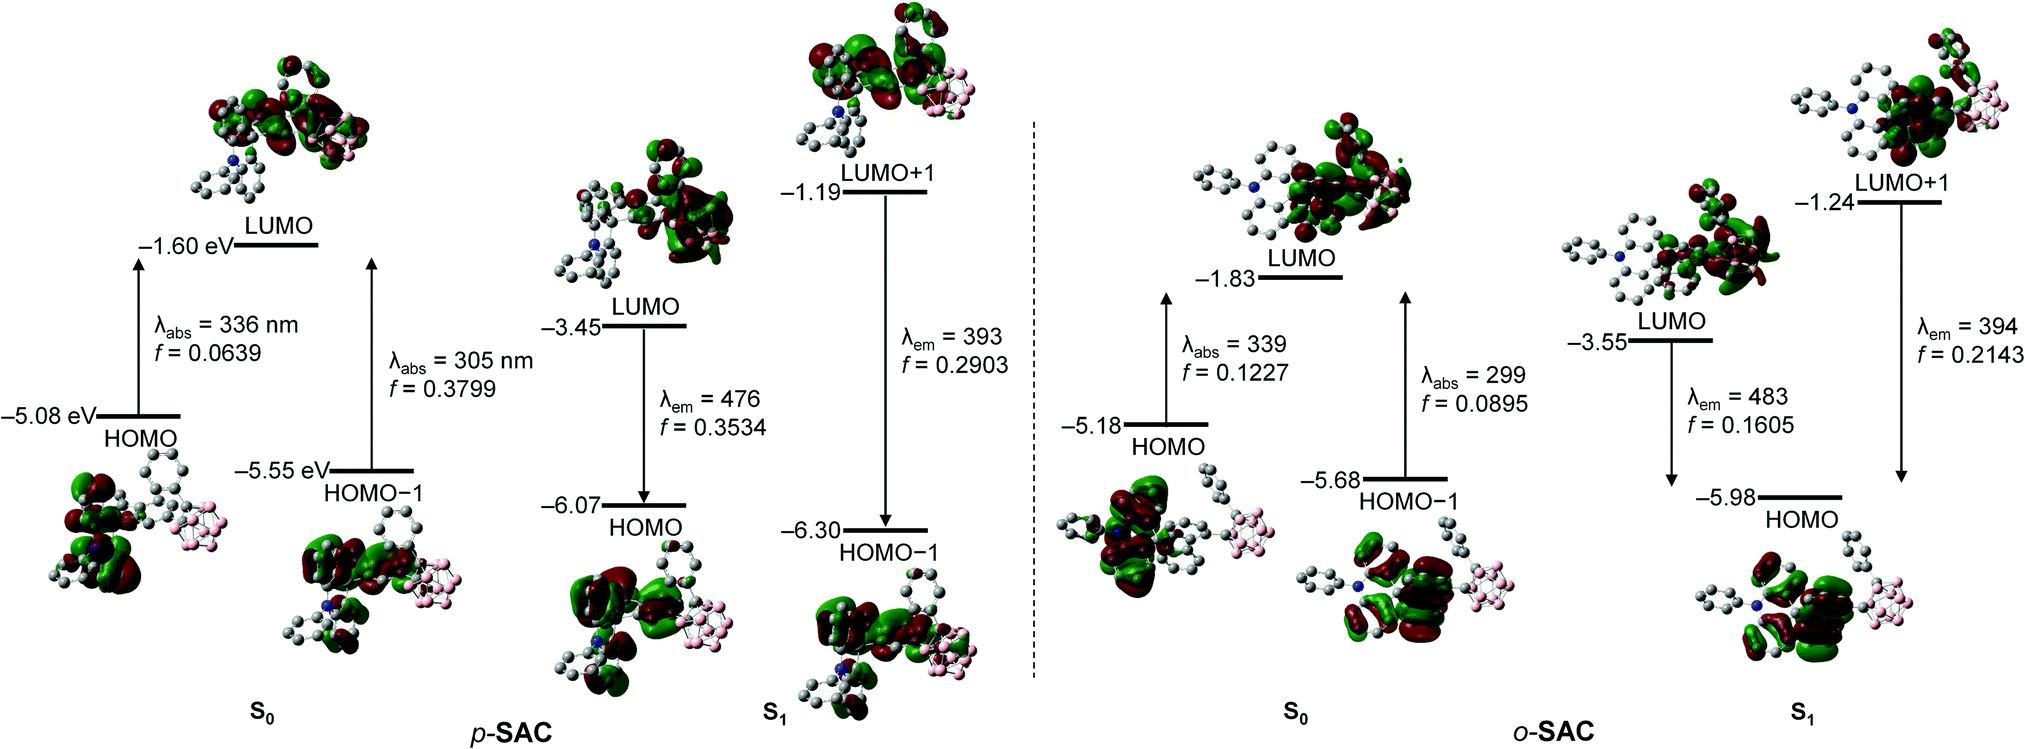 | ||
| Fig. 3 Frontier molecular orbitals of p-SAC and o-SAC in their ground states (S0) and the first excited singlet states (S1), with relative energies from DFT calculations (isovalue = 0.04). Transition energy (in nm) was calculated using the TD-B3LYP method with 6-31G(d) basis sets. | ||
| State | λ calc/nm | f calc | Assignmentb | |
|---|---|---|---|---|
| a Singlet energies for the vertical transition calculated at the optimized S1 geometries. b H = HOMO; L = LUMO. | ||||
| p-SAC | S0 | 336.44 | 0.0639 | H → L (98.6%) |
| 305.21 | 0.3799 | H−1 → L (94.9%) | ||
| S1 | 475.68 | 0.3534 | H → L (99.9%) | |
| 392.94 | 0.2903 | H−1 → L+1 (99.3%) | ||
| o-SAC | S0 | 338.66 | 0.1227 | H → L (98.3%) |
| 298.70 | 0.0895 | H−1 → L (97.1%) | ||
| S1 | 482.81 | 0.1605 | H → L (99.9%) | |
| 394.27 | 0.2143 | H → L+1 (94.6%) | ||
The emission properties of both o-carboranyl compounds were evaluated based on PL measurements under various conditions (Fig. 2 and Table 1). The PL spectra of p-SAC in THF at 298 K exhibited a faint emissive trace in the high-energy region at 388 nm. SA also exhibited emission in this region (λem = 387 nm, Fig. S12, ESI†), strongly suggesting that emission in this region corresponded to the π–π* transition on the spiro[acridine-9,9′-fluorene] moiety, and was thus classified as locally excited (LE) emission. The emission only shifted from 386 to 389 nm due to changes in solvent polarity when toluene was replaced with acetonitrile (ACN), thereby further confirming the occurrence of LE emission (Table 1 and Fig. S14, ESI†).
The PL spectrum of o-SAC in THF at 298 K exhibited additional low-energy emission at 461 nm with an LE-based emission shoulder pattern at 391 nm, resulting in blue colored emission (inset in Fig. 2). Furthermore, PL experiments were performed in solvents with different polarities, namely toluene, dichloromethane (DCM), and ACN (Fig. 4). The spectra indicated that low-energy emission was associated with the ICT transition. The PL spectra of o-SAC exhibited solvent-dependent emission bands that red-shifted dramatically with increasing solvent polarity from the violet region in toluene (λem = 418 nm, inset figure in Fig. 4b) to bluish-green in ACN (491 nm), as is characteristic of the positive solvatochromic effect. The emissive behavior of o-SAC was indicative that the excited states had a significantly polar character, as confirmed by the ICT transitions. Furthermore, solvatochromism led to a straight positive slope in the plot of Stokes shifts (from 7217 cm−1 in toluene to 10731 cm−1) against the empirical solvent polarity parameter [ET(30)] (Fig. 4c).78 The large Stokes shifts confirmed the ICT characteristics, while the computational results of the S1 state in both o-carboranyl compounds supported these origins of each electronic transition.
 | ||
| Fig. 4 (a) UV-vis absorption and (b) PL spectra of o-SAC (5.0 × 10⁻⁵ M) in various organic solvents. The emission color in each state under the irradiation of a hand-held UV lamp (λex = 295 nm) is given in the insets. (c) Stokes shift as a function of the empirical solvent-polarity parameter [ET(30)]. | ||
The computational results for the S1 states of p-SAC and o-SAC indicated that the high-energy emission was dominated by HOMO−1 (for p-SAC) or HOMO (for o-SAC) → LUMO+1 transitions (Fig. 3 and Table 2), respectively. The HOMO−1 of p-SAC, HOMO of o-SAC, and LUMO+1 of both compounds were significantly localized on the spiro[acridine-9,9′-fluorene] moiety. The localization was particularly high on the fluorene units (ca. 74–88%, Tables S4 and S6, ESI†), strongly suggesting that the experimentally observed LEs were attributed to π–π* transitions on the fluorene moieties. In addition, the low-energy emission of p-SAC and o-SAC was mainly associated with HOMO → LUMO transitions (Fig. 3 and Table 2). The LUMOs of both compounds were mainly occupied within the o-carborane cages (ca. 73%, Tables S4 and S6, ESI†) while the HOMOs were predominantly localized on the fluorene units (63% for p-SAC and 77% for o-SAC). These computational results further confirmed that the low-energy emission originated from ICT processes between the o-carborane cages and fluorene groups of the spiro[acridine-9,9′-fluorene] moieties.
The ICT-based low-energy emission of p-SAC in THF was not detected in the PL spectra at 298 K, but strong emission was observed at 77 K around 469 nm (Fig. 2a and Table 1). Further, the emissive pattern of o-SAC in THF at 77 K was characterized as a 445 nm centered ICT-based emission with an emissive shoulder at 393 nm (Fig. 2b and Table 1), which was similar to the observations at 298 K. It is well known that structural variation around the o-carborane cages in solution at 298 K (e.g. C–C bond variations or rotational motion of the cages) can cause nonradiative decay of ICT transitions. Thus, ICT-based emission corresponding to o-carborane only occurred in the rigid state.10,22,38,39,41,61 The optimized structures of p-SAC and o-SAC based on their S0 and S1 states facilitated structural fluctuations (Table 3). The bond lengths of the p-SAC and o-SACo-carborane cages in the S1 state were 2.39 and 2.42 Å, respectively. These were much longer compared to that in the S0 states (ca. 1.8 Å), as well as the experimentally measured value (1.76 Å) for o-SAC based on the X-ray structure. Thus, the observed features and previous considerations indicated that the structural variation of o-SAC in solution at 298 K was much more suppressed compared to that of p-SAC. The strain on the fluorene plane caused by steric hindrance was represented in the X-ray structure of o-SAC (Fig. 1), and further confirmed the restriction of structural variation.
The degree of structural fluctuation around the o-carborane cages of both carboranyl compounds was further investigated, as well as the relationship between the radiative mechanism for ICT-based emission and the structural motion of the o-carboranyl units. The energy of p-SAC and o-SAC in the S0 state was calculated as a function of the dihedral angle (Ψ) of the o-carboranyl cage (Table 3). Calculations were based on the B3LYP functional and the 6-31G(d) basis set. The thermodynamic stability of each compound was represented as the relative energy (ΔE/kcal mol−1) in reference to the S0-optimized structure of p-SAC and o-SAC in THF (i.e. the thermal energy of the optimized structures was considered as 0 kcal mol−1). The relative energy was calculated at each Ψ value from −180° to 180° at intervals of 30° (Fig. 5). The Ψ values of S0-optimized p-SAC and o-SAC were 91.8° and 91.5°, respectively, which closely reflected the experimental value for o-SAC based on the X-ray structure (93.7°). Further, the values were similar to the S1 state Ψ values, namely 90.6° for p-SAC and 92.0° for o-SAC. Thus, the structural formation of both compounds was almost fixed during radiative excitation and relaxation. Importantly, the relative energy barrier for p-SAC did not exceed 2.6 kcal mol−1 throughout the entire Ψ range (Fig. 5). However, the low energy region of o-SAC was mainly observed between Ψ = 90° and −90° (Fig. 5) and the energy gap between the minimum and maximum points was ca. 18 kcal mol−1 (18.1 kcal mol−1 at Ψ = 30°). The structures of o-SAC at Ψ = −30° and 0° were not optimized due to intramolecular steric hindrance limitations. The thermal energy value of 0.59 kcal mol−1 was calculated as kBT (kB = Boltzmann constant, 1.98 cal K−1 mol−1) at 298 K, and was compared to the relative energy values. The o-carborane cages in p-SAC freely rotated in the solution state at ambient temperature, but the S0 and S1 optimized structures (Ψ ≈ 90°) of o-SAC were fixed in all states. Consequently, the calculation and experimental results confirmed that the structural rigidity of o-SAC led to efficient radiative decay, which affected the ICT transitions associated with the o-carborane moieties.
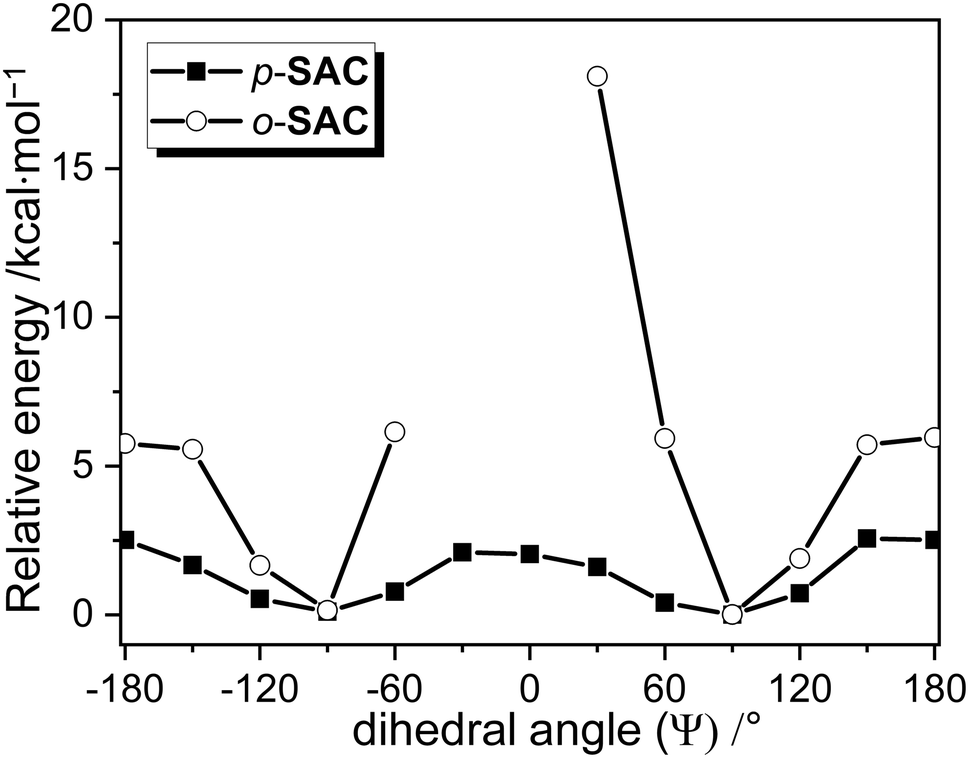 | ||
| Fig. 5 Relative energy diagrams (ΔE/kcal mol−1) for p-SAC and o-SAC, with relative energy as a function of dihedral angle (Ψ) in each ground (S0) state. The structures of Ψ = −30° and 0° in o-SAC were not possible due to intramolecular steric hindrance. | ||
Photophysical properties in solid states based on the aggregation induced emission phenomenon
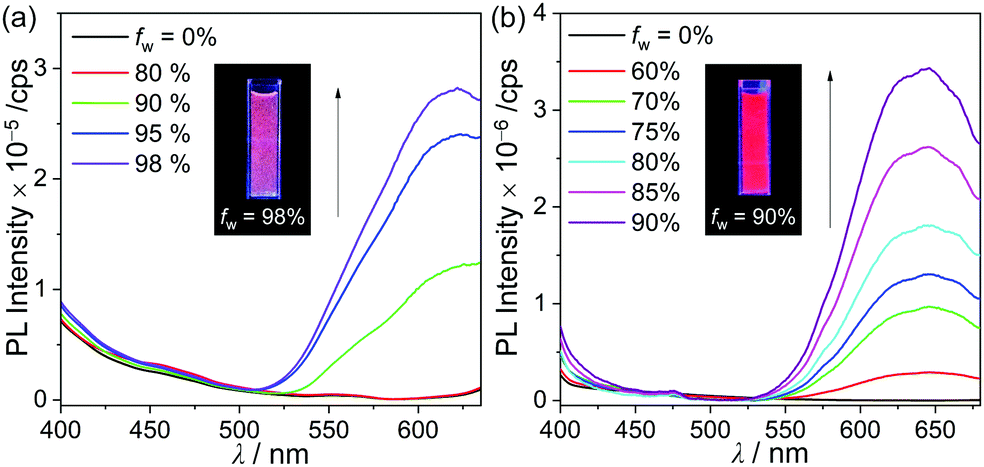
The PL spectra of p-SAC and o-SAC in the film state (5 wt% doped with poly(methyl methacrylate) (PMMA)) exhibited unusual emissive patterns. Both compounds were characterized by a broad emissive band in the low energy region (500–600 nm) and an ICT based emission shoulder centered at ca. 430 nm (Fig. 2 and Table 1). Thus, strong reddish-orange emission was observed in the rigid state (e.g. solid and solution at 77 K) (emission in film state, inset in Fig. 2). The origin of the low-energy emission was investigated based on further PL measurements of p-SAC and o-SAC in a THF–water mixture (5.0 × 10⁻⁵ M). The low energy emission around 600 nm was drastically enhanced in an increased water fraction (fw). Consequently, the maximized aggregation states in THF/water (fw ≈ 98% for p-SAC and 90% for o-SAC) were associated with intense emission patterns similar to those observed in the film state. These observations were characteristic of AIE phenomena. The strong AIE effect of both o-carboranyl compounds tripled the quantum yield (Φem) in the film state compared to that in solution at 298 K, where the Φem value of p-SAC increased from <1% in THF to 5% in the film and that of o-SAC increased from 6 to 19% (Table 1).The emission decay lifetimes (τobs) of both compounds lasted several nanoseconds, where the τobs ofp-SAC was 4.0 ns in film and 4.6 ns in THF, and that of o-SAC was 3.2 ns in film. Thus, the emission was attributed to fluorescence (Table 1 and Fig. S15, S16, ESI†). The fluorescence lifetime and quantum yield of p-SAC and o-SAC were used to calculate the radiative (kr) and nonradiative (knr) decay rate constants (Table 1). The film state kr value for o-SAC (5.9 × 10⁷ s−1) was about 4.5 times larger than that of p-SAC (1.3 × 10⁷ s−1), but the knr value of both compounds was very similar (2.5 × 10⁸ s−1). These results confirmed the structural instability of p-SAC. Specifically, the structure could not be fixed around the S0- and S1-optimized structures, which interrupted the radiative decay mechanism caused by the ICT transition in o-carborane and molecular aggregation. The kr value of o-SAC was much lower in THF (1.3 × 10⁷ s−1) than in the film state, but the knr values in the two states did not differ much (2.0 and 2.5 × 10⁷ s−1 in THF and film, respectively). Further, this structural fluctuation clearly reduced the efficiency of the radiative mechanism (Fig. 6).
 | ||
| Fig. 6 PL spectra of (a) p-SAC and (b) o-SAC in THF/distilled water mixtures (5.0 × 10⁻⁵ M, λex = 330 nm). The emission color in each state under the irradiation of a hand-held UV lamp (λex = 365 nm) is given in the insets. | ||
Applications of o-SAC as an emissive thermal indicator
The significantly different emissive colors of o-SAC when in solution (ICT based emission) and in a solid film (AIE phenomenon) indicated that the compound has potential as a thermal indicator,79 where the emission color differs according to temperature. The solubility of o-SAC was relatively low at high concentrations (ca. 10−3 M) in ACN. Its PL spectrum and the Commission Internationale de l'Eclairage 1931 (CIE 1931) color coordinates in ACN (7.0 × 10⁻⁴ M) between 20 °C and 60 °C were investigated. Intense red-emission centered at ca. 630 nm was observed at 20 °C due to AIE (Fig. 7a). The emissive character gradually decreased, while the ICT-based emission at ca. 490 nm increased with increasing temperature until 60 °C. These observations indicated that the phase of o-SAC changed from the colloidal state to the solution state. To elucidate the phase of o-SAC in ACN at 20 °C, dynamic light scattering (DLS) measurements were performed (Fig. S17, ESI†). The result reveals that the o-SAC particle has an average diameter of 2.0 μm in ACN at 20 °C (total range = 0.57–4.1 μm), indicating the colloidal suspension state. This temperature-dependent change in emissive features led to a dramatic change in emissive color from red at 20 °C, to orange at 35 °C, to yellowish-green at 50 °C, and to sky blue at 60 °C under a hand-held UV lamp (λex = 365 nm, inset in Fig. 7a). The change in luminescence response was quantified as a function of temperature, and the CIE 1931 color coordinates of o-SAC in ACN (7.0 × 10⁻⁴ M) were examined (Fig. 7b). The color coordinates demonstrated the emissive color change from red (CIE x, y = ca. 0.69, 0.27 at 20 °C) to sky blue (CIE x, y = ca. 0.06, 0.54 at 60 °C) via orange (CIE x, y = ca. 0.51, 0.44 at 35 °C) and bluish-green (CIE x, y = ca. 0.26, 0.55 at 50 °C) as temperature increased. The respective color coordinates at each temperature were maintained throughout consecutive heating and cooling cycles. The temperature dependent emissive behavior of o-SAC provided strong evidence of the optimal condition of o-SAC required to achieve each emissive color at specific temperatures. These changes were dependent on the phase transition between the colloid and solution states as the temperature increased. Consequently, o-SAC is a promising o-carboranyl compound for application as a temperature indicator with quantitative color coordinate changes in emissive color.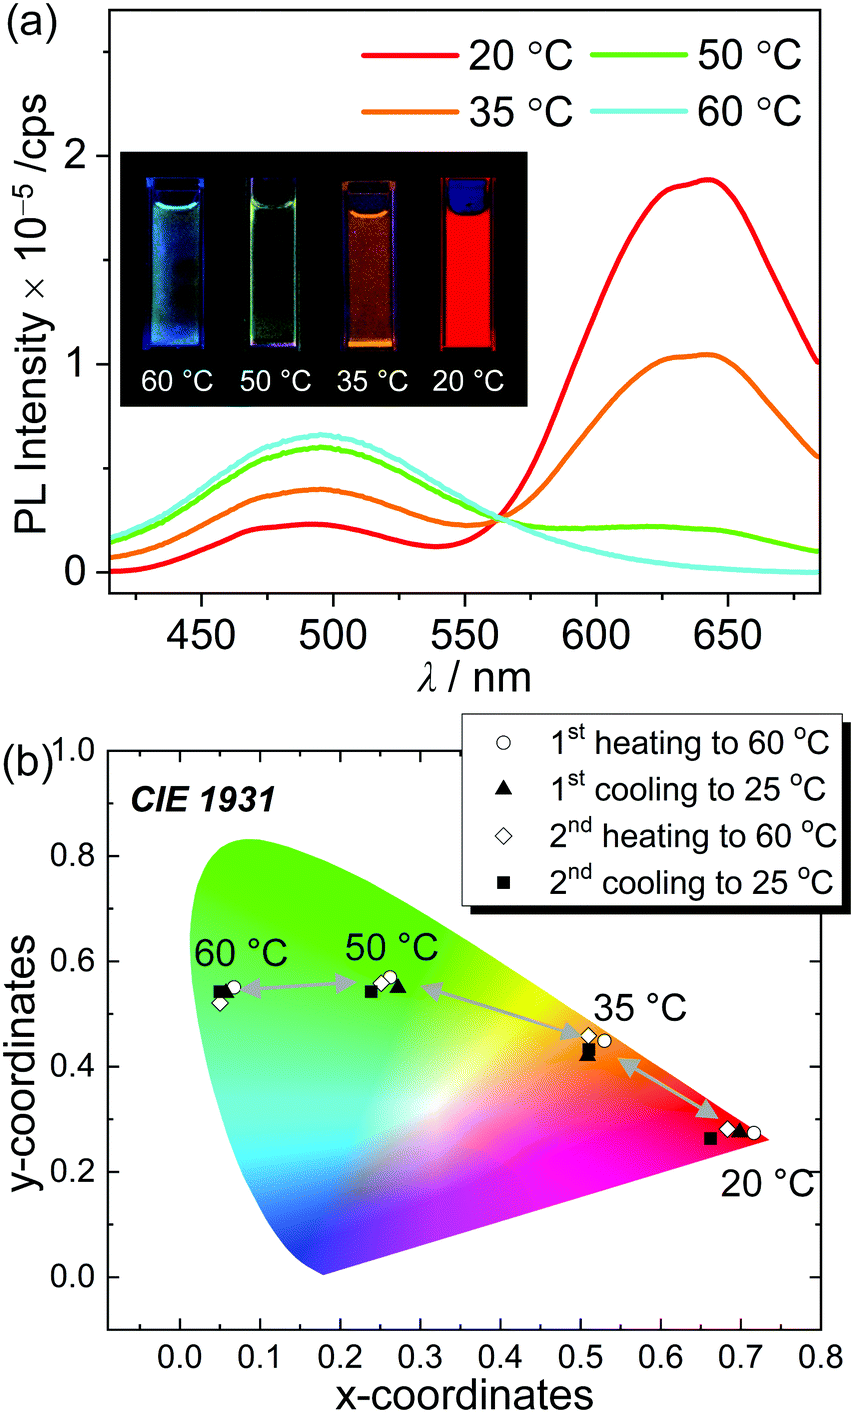 | ||
| Fig. 7 (a) PL spectra of o-SAC in ACN (7.0 × 10⁻⁴ M, λex = 330 nm) according to changes in temperature between 20 °C and 60 °C. The upper inset shows the emission color of o-SAC in ACN (7.0 × 10⁻⁴ M) viewed under a hand-held UV lamp (λex = 365 nm). (b) CIE 1931 color coordinates of the PL spectra in consecutive heating and cooling cycles. | ||
Conclusions
Two spiro[acridine-9,9′-fluorene] based o-carboranyl compounds (p-SAC and o-SAC) were prepared and characterized. The structural variation of o-SAC was more restricted than that of p-SAC. This was attributed to the severely distorted fluorene moiety in the solid-state structure of o-SAC, which was caused by intramolecular steric repulsion. The calculated energy barriers (based on rotational motion around the o-carborane cage) further contributed to the restriction. Consequently, the ICT-based radiative decay efficiency of o-SAC in solution state at 298 K was enhanced. Interestingly, both compounds demonstrated AIE characteristics, resulting in intense red emission in the solid state. However, only o-SAC exhibited a drastic change in emissive color between the solution and aggregated states. Furthermore, a relatively high-concentrated ACN solution of o-SAC exhibited distinct changes in emissive color due to the transition between a clear solution and colloid caused by changes in the temperature. The experimental and theoretical findings strongly suggest that the π-aromatic group appended to the o-carboranyl conjugate system in both o-carboranyl compounds can be used in visual sensory materials for detecting temperature.Conflicts of interest
There are no conflicts to declare.Acknowledgements
This work was supported by the National Research Foundation of Korea (NRF) grant (NRF-2020R1A2C1006400 and NRF-2016M3A7B4909246 for K. M. Lee and 2020R1I1A1A01073381 for J. H. Lee) funded by the Ministry of Science and ICT and the Ministry of Education.Notes and references
- V. I. Bregadze, Chem. Rev., 1992, 92, 209–223 CrossRef CAS.
- F. Issa, M. Kassiou and L. M. Rendina, Chem. Rev., 2011, 111, 5701–5722 CrossRef CAS.
- R. N. Grimes, Carboranes, Academic Press, London, 2nd edn, 2011 Search PubMed.
- M. F. Hawthorne, Angew. Chem., Int. Ed. Engl., 1993, 32, 950–984 CrossRef.
- W. Tjarks, B. A. Barnum, F.-G. Rong, R. F. Barth, I. M. Codogni and J. G. Wilson, Chem. Rev., 1998, 98, 1515–1562 CrossRef.
- M. F. Hawthorne and A. Maderna, Chem. Rev., 1999, 99, 3421–3434 CrossRef CAS.
- F. Issa, M. Kassiou and L. M. Rendina, Chem. Rev., 2011, 111, 5701–5722 CrossRef CAS.
- H. Jude, H. Disteldorf, S. Fischer, T. Wedge, A. M. Hawkridge, A. M. Arif, M. F. Hawthorne, D. C. Muddiman and P. J. Stang, J. Am. Chem. Soc., 2005, 127, 12131–12139 CrossRef CAS.
- Y. Shirai, J.-F. Morin, T. Sasaki, J. M. Guerrero and J. M. Tour, Chem. Soc. Rev., 2006, 35, 1043–1055 RSC.
- B. P. Dash, R. Satapathy, E. R. Gaillard, J. A. Maguire and N. S. Hosmane, J. Am. Chem. Soc., 2010, 132, 6578–6587 CrossRef CAS.
- A. M. Spokoyny, C. W. Machan, D. J. Clingerman, M. S. Rosen, M. J. Wiester, R. D. Kennedy, C. L. Stern, A. A. Sarjeant and C. A. Mirkin, Nat. Chem., 2011, 3, 590–596 CrossRef CAS.
- Z. Qiu, S. Ren and Z. Xie, Acc. Chem. Res., 2011, 44, 299–309 CrossRef CAS.
- Z.-J. Yao and G.-X. Jin, Coord. Chem. Rev., 2013, 257, 2522–2535 CrossRef CAS.
- S. P. Fisher, A. W. Tomich, S. O. Lovera, J. F. Kleinsasser, J. Guo, M. J. Asay, H. M. Nelson and V. Lavallo, Chem. Rev., 2019, 119, 8262–8290 CrossRef CAS.
- K.-R. Wee, Y.-J. Cho, S. Jeong, S. Kwon, J.-D. Lee, I.-H. Suh and S. O. Kang, J. Am. Chem. Soc., 2012, 134, 17982–17990 CrossRef CAS.
- R. Furue, T. Nishimoto, I. S. Park, J. Lee and T. Yasuda, Angew. Chem., Int. Ed., 2016, 55, 7171–7175 CrossRef CAS.
- A. González-Campo, E. J. Juárez-Pérez, C. Viñas, B. Boury, R. Sillanpää, R. Kivekäs and R. Núñez, Macromolecules, 2008, 41, 8458–8466 CrossRef.
- K. Kokado and Y. Chujo, Macromolecules, 2009, 42, 1418–1420 CrossRef CAS.
- K. Kokado, Y. Tokoro and Y. Chujo, Macromolecules, 2009, 42, 9238–9242 CrossRef CAS.
- J. J. Peterson, M. Were, Y. C. Simon, E. B. Coughlin and K. R. Carter, Macromolecules, 2009, 42, 8594–8598 CrossRef CAS.
- A. Ferrer-Ugalde, E. J. uárez-Pérez, F. Teixidor, C. Viñas and R. Núñez, Chem. – Eur. J., 2013, 19, 17021–17030 CrossRef CAS.
- T. Kim, H. Kim, K. M. Lee, Y. S. Lee and M. H. Lee, Inorg. Chem., 2013, 52, 160–168 CrossRef CAS.
- A. M. Spokoyny, Pure Appl. Chem., 2013, 85, 903–919 CAS.
- J. Poater, M. Solà, C. Viñas and F. Teixidor, Angew. Chem., Int. Ed., 2014, 53, 12191–12195 CrossRef CAS.
- H. J. Bae, J. Chung, H. Kim, J. Park, K. M. Lee, T.-W. Koh, Y. S. Lee, S. Yoo, Y. Do and M. H. Lee, Inorg. Chem., 2014, 53, 128–138 CrossRef CAS.
- Y. H. Lee, J. Park, J. Lee, S. U. Lee and M. H. Lee, J. Am. Chem. Soc., 2015, 137, 8018–8021 CrossRef CAS.
- Y. H. Lee, J. Park, S.-J. Jo, M. Kim, J. Lee, S. U. Lee and M. H. Lee, Chem. – Eur. J., 2015, 21, 2052–2061 CrossRef CAS.
- R. Núñez, M. Tarrés, A. Ferrer-Ugalde, F. Fabrizi de Biani and F. Teixidor, Chem. Rev., 2016, 116, 14307–14378 CrossRef.
- S. Mukherjee and P. Thilagar, Chem. Commun., 2016, 52, 1070–1093 RSC.
- J. Poater, M. Solà, C. Viñas and F. Teixidor, Chem. – Eur. J., 2016, 22, 7437–7443 CrossRef CAS.
- R. Núñez, I. Romero, F. Teixidor and C. Viñas, Chem. Soc. Rev., 2016, 45, 5147–5173 RSC.
- J. Cabrera-González, V. Sánchez-Arderiu, C. Viñas, T. Parella, F. Teixidor and R. Náñez, Inorg. Chem., 2016, 55, 11630–11634 CrossRef.
- K. O. Kirlikovali, J. C. Axtell, A. Gonzalez, A. C. Phung, S. I. Khan and A. M. Spokoyny, Chem. Sci., 2016, 7, 5132–5138 RSC.
- Y. Kim, S. Park, Y. H. Lee, J. Jung, S. Yoo and M. H. Lee, Inorg. Chem., 2016, 55, 909–917 CrossRef CAS.
- D. Tu, P. Leong, S. Guo, H. Yan, C. Lu and Q. Zhao, Angew. Chem., Int. Ed., 2017, 56, 11370–11374 CrossRef CAS.
- I. Nar, A. Atsay, A. Altındal and E. Hamuryudan, Inorg. Chem., 2018, 57, 2199–2208 CrossRef CAS.
- K. L. Martin, J. N. Smith, E. R. Young and K. R. Carter, Macromolecules, 2019, 52, 7951–7960 CrossRef CAS.
- K. Kokado and Y. Chujo, J. Org. Chem., 2011, 76, 316–319 CrossRef CAS.
- B. P. Dash, R. Satapathy, E. R. Gaillard, K. M. Norton, J. A. Maguire, N. Chug and N. S. Hosmane, Inorg. Chem., 2011, 50, 5485–5493 CrossRef CAS.
- L. Weber, J. Kahlert, R. Brockhinke, L. Böhling, A. Brockhinke, H.-G. Stammler, B. Neumann, R. A. Harder and M. A. Fox, Chem. – Eur. J., 2012, 18, 8347–8357 CrossRef CAS.
- K.-R. Wee, W.-S. Han, D. W. Cho, S. Kwon, C. Pac and S. O. Kang, Angew. Chem., Int. Ed., 2012, 51, 2677–2680 CrossRef CAS.
- S. Kwon, K.-R. Wee, Y.-J. Cho and S. O. Kang, Chem. – Eur. J., 2014, 20, 5953–5960 CrossRef CAS.
- H. Naito, Y. Morisaki and Y. Chujo, Angew. Chem., Int. Ed., 2015, 54, 5084–5087 CrossRef CAS.
- N. Shin, S. Yu, J. H. Lee, H. Hwang and K. M. Lee, Organometallics, 2017, 36, 1522–1529 CrossRef CAS.
- H. So, J. H. Kim, J. H. Lee, H. Hwang, D. K. An and K. M. Lee, Chem. Commun., 2019, 55, 14518–14521 RSC.
- J. Ochi, K. Tanaka and Y. Chujo, Angew. Chem., Int. Ed., 2020, 59, 2–17 CrossRef.
- K.-R. Wee, Y.-J. Cho, J. K. Song and S. O. Kang, Angew. Chem., Int. Ed., 2013, 52, 9682–9685 CrossRef CAS.
- A. Ferrer-Ugalde, A. González-Campo, C. Viñas, J. Rodríguez-Romero, R. Santillan, N. Farfán, R. Sillanpää, A. Sousa-Pedrares, R. Núñez and F. Teixidor, Chem. – Eur. J., 2014, 20, 9940–9951 CrossRef CAS.
- K. Nishino, H. Yamamoto, K. Tanaka and Y. Chujo, Org. Lett., 2016, 18, 4064–4067 CrossRef CAS.
- K. Nishino, H. Yamamoto, K. Tanaka and Y. Chujo, Asian J. Org. Chem., 2017, 6, 1818–1822 CrossRef CAS.
- H. Naito, K. Nishino, Y. Morisaki, K. Tanaka and Y. Chujo, Angew. Chem., Int. Ed., 2017, 56, 254–259 CrossRef CAS.
- X. Wu, J. Guo, Y. Cao, J. Zhao, W. Jia, Y. Chen and D. Jia, Chem. Sci., 2018, 9, 5270–5277 RSC.
- J. Li, C. Yang, X. Peng, Y. Chen, Q. Qi, X. Luo, W.-Y. Lai and W. Huang, J. Mater. Chem. C, 2018, 6, 19–28 RSC.
- X. Wu, J. Guo, J. Zhao, Y. Che, D. Jia and Y. Chen, Dyes Pigm., 2018, 154, 44–51 CrossRef CAS.
- A. V. Marsh, N. J. Cheetham, M. Little, M. Dyson, A. J. P. White, P. Beavis, C. N. Warriner, A. C. Swain, P. N. Stavrinou and M. Heeney, Angew. Chem., Int. Ed., 2018, 57, 10640–10645 CrossRef CAS.
- S. Kim, J. H. Lee, H. So, J. Ryu, J. Lee, H. Hwang, Y. Kim, M. H. Park and K. M. Lee, Chem. – Eur. J., 2020, 26, 548–557 CrossRef CAS.
- H. Tong, Y. Hong, Y. Dong, M. Häußler, J. W. Y. Lam, Z. Li, Z. Guo, Z. Guo and B. Z. Tang, Chem. Commun., 2006, 3705–3707 RSC.
- S. Inagi, K. Hosoi, T. Kubo, N. Shida and T. Fuchigami, Electrochemistry, 2013, 81, 368–370 CrossRef CAS.
- S.-Y. Kim, Y.-J. Cho, G. F. Jin, W.-S. Han, H.-J. Son, D. W. Cho and S. O. Kang, Phys. Chem. Chem. Phys., 2015, 17, 15679–15682 RSC.
- Y.-J. Cho, S. Y. Kim, M. Cho, W.-S. Han, H.-J. Son, D. W. Cho and S. O. Kang, Phys. Chem. Chem. Phys., 2016, 18, 9702–9708 RSC.
- B. H. Choi, J. H. Lee, H. Hwang, K. M. Lee and M. H. Park, Organometallics, 2016, 35, 1771–1777 CrossRef CAS.
- M. R. Son, Y.-J. Cho, S.-Y. Kim, H.-J. Son, D. W. Cho and S. O. Kang, Phys. Chem. Chem. Phys., 2017, 19, 24485–24492 RSC.
- X. Li, Y. Yin, H. Yan and C. Lu, Chem. – Asian J., 2017, 12, 2207–2210 CrossRef CAS.
- Y. Yin, X. Li, S. Yan, H. Yan and C. Lu, Chem. – Asian J., 2018, 13, 3155–3159 CrossRef CAS.
- S.-Y. Kim, J.-D. Lee, Y.-J. Cho, M. R. Son, H.-J. Son, D. W. Cho and S. O. Kang, Phys. Chem. Chem. Phys., 2018, 20, 17458–17463 RSC.
- K. Nishino, K. Uemura, M. Gon, K. Tanaka and Y. Chujo, Molecules, 2017, 22, 2009–2018 CrossRef.
- K. Nishino, K. Tanaka and Y. Chujo, Asian J. Org. Chem., 2019, 8, 2228–2232 CrossRef CAS.
- Z. Jiang, Z. Liu, C. Yang, C. Zhong, J. Qin, G. Yu and Y. Liu, Adv. Funct. Mater., 2009, 19, 3987–3995 CrossRef CAS.
- J. S. Binkley, J. A. Pople and W. J. Hehre, J. Am. Chem. Soc., 1980, 102, 939–947 CrossRef CAS.
- E. Runge and E. K. U. Gross, Phys. Rev. Lett., 1984, 52, 997–1000 CrossRef CAS.
- S. Miertuš, E. Scrocco and J. Tomasi, Chem. Phys., 1981, 55, 117–129 CrossRef.
- M. J. Frisch, G. W. Trucks, H. B. Schlegel, G. E. Scuseria, M. A. Robb, J. R. Cheeseman, G. Scalmani, V. Barone, G. A. Petersson, H. Nakatsuji, X. Li, M. Caricato, A. V. Marenich, J. Bloino, B. G. Janesko, R. Gomperts, B. Mennucci, H. P. Hratchian, J. V. Ortiz, A. F. Izmaylov, J. L. Sonnenberg, D. Williams-Young, F. Ding, F. Lipparini, F. Egidi, J. Goings, B. Peng, A. Petrone, T. Henderson, D. Ranasinghe, V. G. Zakrzewski, J. Gao, N. Rega, G. Zheng, W. Liang, M. Hada, M. Ehara, K. Toyota, R. Fukuda, J. Hasegawa, M. Ishida, T. Nakajima, Y. Honda, O. Kitao, H. Nakai, T. Vreven, K. Throssell, J. A. Montgomery, Jr., J. E. Peralta, F. Ogliaro, M. J. Bearpark, J. J. Heyd, E. N. Brothers, K. N. Kudin, V. N. Staroverov, T. A. Keith, R. Kobayashi, J. Normand, K. Raghavachari, A. P. Rendell, J. C. Burant, S. S. Iyengar, J. Tomasi, M. Cossi, J. M. Millam, M. Klene, C. Adamo, R. Cammi, J. W. Ochterski, R. L. Martin, K. Morokuma, O. Farkas, J. B. Foresman and D. J. Fox, Gaussian 16 Revision B.01, Gaussian. Inc., Wallingford, CT, 2016 Search PubMed.
- N. M. O'Boyle, A. L. Tenderholt and K. M. Langner, J. Comput. Chem., 2008, 29, 839–845 CrossRef.
- R. Dennington, T. A. Keith and J. M. Millam, GaussView 6, Semichem Inc., Shawnee Mission, KS, 2016 Search PubMed.
- M. F. Hawthorne, T. E. Berry and P. A. Wegner, J. Am. Chem. Soc., 1965, 87, 4746–4750 CrossRef CAS.
- T. E. Paxson, K. P. Callahan and M. F. Hawthorne, Inorg. Chem., 1973, 12, 708–709 CrossRef CAS.
- W. Jiang, C. B. Knobler and M. F. Hawthorne, Inorg. Chem., 1996, 35, 3056–3058 CrossRef CAS.
- C. Reichardt, Angew. Chem., Int. Ed. Engl., 1979, 18, 98–110 CrossRef.
- X.-D. Wang, O. S. Wolfbeis and R. J. Meier, Chem. Soc. Rev., 2013, 42, 7834–7869 RSC.
Footnotes |
| † Electronic supplementary information (ESI) available: 1H, 13C and 11B NMR spectra, emission decay curves, and computational details. CCDC 2008760 for o-SAC. For ESI and crystallographic data in CIF or other electronic format see DOI: 10.1039/d0tc03801f |
| ‡ The first and second authors contributed equally to this work. |
| This journal is © The Royal Society of Chemistry 2020 |