
 Open Access Article
 This Open Access Article is licensed under a
 Creative Commons Attribution 3.0 Unported Licence
In situ observation of the magnetocaloric effect through neutron diffraction in the Tb(DCO2)3 and TbODCO3 frameworks†
Richard J. C.
Dixey
ab,
Pascal
Manuel
c,
Fabio
Orlandi
 c,
Paromita
Mukherjee
d,
Siân E.
Dutton
d,
Gavin B. G.
Stenning
c and
Paul J.
Saines
*a
c,
Paromita
Mukherjee
d,
Siân E.
Dutton
d,
Gavin B. G.
Stenning
c and
Paul J.
Saines
*a
aSchool of Physical Sciences, Ingram Building, University of Kent, Canterbury, CT2 7NH, UK. E-mail: P.Saines@kent.ac.uk
bCentre for Condensed Matter and Material Physics, School of Physics and Astronomy, Queen Mary University of London, Mile End Rd, London, E1 4NS, UK
cISIS Facility, STFC Rutherford Appleton Laboratory, Chilton, Didcot, OX11 0QX, UK
dCavendish Laboratory, University of Cambridge, JJ Thomson Avenue, Cambridge, CB3 0HE, UK
First published on 14th August 2020
Abstract
Probing the magnetic structure of magnetocaloric materials in applied fields, can reveal detailed insight into the mechanism of magnetic refrigeration thereby linking the magnetic states that form under applied magnetic fields to changes in magnetic entropy. This study probes the long range magnetic order in Tb(DCO2)3 and TbODCO3 as a function of temperature and applied magnetic field, through neutron diffraction measurements. A triangular Ising antiferromagnetic phase is formed, in small applied magnetic fields in Tb(DCO2)3, a spin flip transition occurs to a simple ferromagnetic structure in higher applied fields. TbODCO3 undergoes a phase transition, in applied fields, into two magnetic phases; namely a buckled chain ferromagnetic phase along the b-axis and a canted antiferromagnetic phase, with a ferromagnetic component along c-axis. Both of the states observed in TbODCO3 are consistent with Ising-like anisotropy previously reported in TbODCO3 and the coexistance of these is likely the result of applying a magnetic field to a powdered sample.
Introduction
Advanced functional magnetic materials with finely tuned properties are relevant to a broad range of modern technologies, finding applications from data storage/transfer1–3 to medicine.4 Optimising such materials, including multiferroics5–7 and magnetocalorics,8–11 requires a detailed understanding of how they respond to an applied magnetic field. There is also great fundamental interest in magnetic phenomena that emerge with increasing applied magnetic fields, including metamagnetic spin–flop and spin–flip transitions,12–16 exotic magnetic states in Ising 1D chains and magnetisation plateaus.17–21 Since the bulk magnetic properties of a material are ultimately driven by the atomic level structure,8,22 understanding how the magnetic correlations in materials changes under applied magnetic fields is essential for innovation.The magnetocaloric effect (MCE) is an entropically driven temperature change observed in all magnetic materials when a magnetic field is applied and removed.11,23 In paramagnetic magnetocalorics the application of a magnetic field drives a phase transition to a highly ordered phase, which is often thought to resemble a field induced ferromagnet. This reduces the number of microstates (Ω) and the magnetic entropy (S), causing a change in temperature proportional to R![[thin space (1/6-em)]](https://www.rsc.org/images/entities/char_2009.gif) lnΩ. This effect can be used in devices, as an energy efficient alternative to vapour compression refrigeration.24 The MCE has been extensively studied in a multitude of compounds since its discovery in 1917,25 but this is mostly limited to bulk property studies.11 Magnetic field induced phase transitions are well established in magnetocaloric materials such as Ho3Ga5O12 and Ho3CrGa4O12,26–28 where strong Ising anisotropy has been shown to be an important factor in the magnetocaloric behaviour with respect to field while quasi-1D materials, such as CoV2O6, have also shown excellent magnetocaloric properties.21 It is well established that frustrated magnetism, where conflicting magnetic interaction prevent a single ordered ground state from emerging, can improve the MCE by allowing a denser packing of magnetic cations, as shown in the benchmark material Gd3Ga5O12.29,30 It is not easy to understand, however, how the large number of degenerate ground states of a particular material will be affected by the applied magnetic field and therefore the nature of the long range ordered states formed under this stimuli.31 Therefore, understanding microscopic changes in the magnetic states of high performance magnetocalorics is key.
lnΩ. This effect can be used in devices, as an energy efficient alternative to vapour compression refrigeration.24 The MCE has been extensively studied in a multitude of compounds since its discovery in 1917,25 but this is mostly limited to bulk property studies.11 Magnetic field induced phase transitions are well established in magnetocaloric materials such as Ho3Ga5O12 and Ho3CrGa4O12,26–28 where strong Ising anisotropy has been shown to be an important factor in the magnetocaloric behaviour with respect to field while quasi-1D materials, such as CoV2O6, have also shown excellent magnetocaloric properties.21 It is well established that frustrated magnetism, where conflicting magnetic interaction prevent a single ordered ground state from emerging, can improve the MCE by allowing a denser packing of magnetic cations, as shown in the benchmark material Gd3Ga5O12.29,30 It is not easy to understand, however, how the large number of degenerate ground states of a particular material will be affected by the applied magnetic field and therefore the nature of the long range ordered states formed under this stimuli.31 Therefore, understanding microscopic changes in the magnetic states of high performance magnetocalorics is key.
The Ln(HCO2)3 and LnOHCO3 frameworks (where Ln = Gd, Tb, Dy, Ho, Er) are both highly efficient and promising magnetocaloric materials over a wide temperature range (2–20 K) making them suitable alternatives to liquid helium cooling, for scientific and medical applications.8,32–34 Both Tb(HCO2)3 and AOHCO3 (A = Tb or Dy) outperform their high performance Gd analogues above 4 K, in applied fields that can be generated by a permanent magnet (below 2 T). The performance of the AOHCO3 phases are particularly impressive, retaining a greater magnetocaloric effect than the benchmark Gd3Ga5O12 up to nearly 10 K.33 In order to fully appreciate the subtleties of the magnetocaloric effect mechanism in these materials, it is important to understand the magnetic phases that develop in the presence of an applied magnetic field. Fig. 1 highlights the triangular motifs present in the LnOHCO3 and Ln(HCO2)3 frameworks that have been suggested to cause the frustrated magnetic interactions in these materials, that play a key role in their MCE effectiveness.8,33
 | ||
| Fig. 1 Diagrams of the nuclear structure of (a) Tb(DCO2)3 and (b) TbODCO3 viewed down the triangular packing of chains. The Tb, C, O and D atoms are shown in purple, black, red and grey, respectively. Tb–Tb distances in Tb(DCO2)3 are 6.16 Å, and 6.57 Å between Tbaα–Tbaβ and Tbaβ–Tbaβ respectively. Tb–Tb distances in TbODCO3 are 4.84, 5.09 and 5.13 Å, between Tbbα–Tbbβ, Tbbβ–Tbbγ, and Tbbα–Tbbγ, respectively connected though a CO3, However, distances between hypothetical chains are equal in both materials. | ||
We have previously established the magnetic states that form in both Tb(HCO2)3 and TbOHCO3 in the absence of applied magnetic fields.9,35 Tb(HCO2)3, which adopts R3m rhombohedral symmetry at all measured temperatures,36 shows strong diffuse scattering indicative of short range order below 20 K, where its magnetocaloric effect begins to be significant. This short range order is formed of ferromagnetically coupled linear chains of Ising-like moments aligned along the c-axis, antiferromagnetically coupled in a triangular array within the ab plane.8,33 Below 1.6 K it displays long range 1D order along the c-axis and the chain direction, and finite correlations in the ab plane, extending ∼50 Å.8,36 Long range order appears to be prevented by the frustrated interactions between chains leading to the emergence of a triangular Ising antiferromagnetic (TIA) state. TbODCO3, which adopts P212121 orthorhombic symmetry, also shows strong diffuse scattering below 20 K attributed to the formation of ferromagnetic correlations between the Ising-like cations in the buckled ferromagnetic chains along the b-axis, which are packed into an antiferromagnetic triangular like lattice.9 These buckled chains present an additional source of entropy in these systems, potentially responsible for the higher magnetocaloric effect observed.33 Below 1.2 K physical property measurements indicate the emergence of an ordered state and, in the isostructural HoODCO3, corresponds to a quasi-long range ordered antiferromagnet.9
It has been proposed that the suppression of the frustrated antiferromagnetic interactions in Tb(HCO2)3 and TbOHCO3 enable high entropy changes in small applied magnetic fields.8,33 This is consistent with the rapid increases in their magnetisation under modest fields,8,33 contributing to a high efficiency as a magnetocaloric.36 The mechanism for the magnetocaloric cycle in these materials, has not been experimentally observed. Neutron diffraction is the obvious method for probing the magnetic structure of these materials due to its sensitivity to magnetic moments. Therefore, in this study we have investigated the magnetic structure of these materials under applied fields. We have identified the ordered phases in these materials as a function of temperature and applied field, in order to understand how the microscopic interactions affect the magnetic entropy of the system. The diffraction patterns of Tb(DCO2)3 indicate it undergoes a phase transition from a correlated paramagnetic state through the disordered TIA phase to a fully ferromagnetic phase. Application of magnetic fields to TbODCO3, in contrast, leads to the coexistence of a ferromagnetic phase, with spins along the b-axes, and a canted antiferromagnetic phase, with a weak ferromagnetic component and the same easy axis. This establishes the magnetic states responsible for the efficient magnetocaloric effect of these materials in low applied fields, providing key insights into how these materials could be further enhanced.
Experimental methods
It is necessary to deuterate neutron samples to minimise the background caused by the incoherent scattering of hydrogen. We expect the deuteration of the framework for neutron studies will have an insignificant effect on the magnetic exchange correlations. Tb(DCO2)3 was synthesized by slowly adding 2 g of Tb(NO3)3·6H2O (99.9%, Sigma-Aldrich) to a solution of 4.75 mL of D-formic acid (95.0% Sigma-Aldrich), with 0.25 mL of ethanol added. After several minutes of stirring, NOx was released and the product precipitated out of solution. The products were collected by vacuum filtration, washed several times with ethanol, and dried in a desiccator.TbODCO3 was synthesised via a hydrothermal method, by reacting Tb(NO3)3·6H2O (99.9%, Sigma-Aldrich, 1 mmol) and Na2CO3 (99.5%, Sigma-Aldrich, 1 mmol) in D2O (99.9%, Sigma-Aldrich, 10 mL). The mixture was sealed in a Teflon-lined (23 mL) Parr-Bomb autoclave and heated at 170 °C for 72 h, followed by cooling to room temperature at a rate of 3 °C h−1. The samples were isolated by vacuum filtration, washed with D2O and dried in a desiccator. 2 g deuterated samples were produced under an N2 atmosphere in multiple batches.
The magnetic measurements of the hydrogenated polycrystalline samples (∼20 mg) were performed using Quantum Design MPMS SQUID magnetometers. Samples were placed in gelatin capsules enclosed inside a pierced straw with a uniform diamagnetic background. Variable field measurements above 2 K were measured on a standard MPMS, and measurements below 2 K were performed using a MPMS magnetometer, with a 3He insert. Low field and high field data on TbOHCO3 at 0.5 K, were collected in two measurements.
Powder neutron diffraction measurements were carried out on the high-resolution time-of-flight (TOF) WISH diffractometer at the ISIS neutron source, Rutherford Appleton Laboratory.37 Measurements were carried out between 1.5 K to 40 K, and applied magnetic fields between 0–3 T, generated using the Oxford instrument 10 T cryomagnet. Powders were loaded into 8 mm vanadium cans, wetted with d6-isopropyl alcohol, sealed with indium wire and flash frozen using the cryomagnet. The d6-isopropyl alcohol successfully minimised the effect of preferred orientation on the diffraction patterns in the application of the magnetic field. The sample was flash frozen in order to prevent the d6-isopropyl alcohol crystallisation and resulted in the formation of an amorphous solid, as indicated by the diffuse scattering centred around 4.2 Å.
Neutron absorption of Tb(DCO2)3 and TbODCO3 were negligible and so corrections were only applied during Rietveld refinements. Rietveld refinements were performed in FULLPROF.38,39 Aluminium reflections of the cryomagnet, were fitted with a Le Bail model to negate the effects of the highly textured surface,40 and un-indexable peaks in the highest resolution bank were excluded from refinements. A linear interpolation of points were used to fit the background and a convolution of back-to-back exponentials with a pseudo-Voight TOF function was used to fit the diffraction peak shapes. The full width half-maximums of the magnetic peaks were fit with an anisotropic broadening model.41 Symmetry analysis and determination of allowed magnetic structures was performed using the Bilbao Crystallographic server.42 Due to a 1:1 correlation between phase fraction and moment size, diffraction patterns with coexisting magnetic phases were fitted by fixing the phase fraction of each magnetic phases to be equal, and the vectors refined. The moment lengths refined are directly tied to this constraint.
Results and discussion
Magnetic property measurements
It has previously been shown that Tb(HCO2)3 and TbOHCO3 undergo transitions to the TIA phase at ∼1.6 K and an antiferromagnetic state at ∼1.2 K, respectively.9,36,43 Above their ordering temperatures these materials both contain short range ferromagnetic Ising chains in the correlated paramagnetic phase, asserted to be responsible for their highly efficient magnetocaloric effects.8,9 Variable field measurements above and below these transitions show features suggestive of the ordering behaviour. For magnetic measurements on a powder averaged lanthanide material with uniaxial Ising-like spin anisotropy, such as Tb(HCO2)3,36 we should expect the bulk magnetisation to approach 4.5 μB, as shown in eqn (1). | (1) |
This however, does not apply to TbOHCO3 which has been shown to have 4 Ising axes.9 This is broadly in agreement to the saturation values of Tb(HCO2)3 in applied fields above 1 T, as shown in Fig. 2, but some field induced breaking of the anisotropy is likely introduced in higher fields. Little difference can be seen in magnetisation behaviour of Tb(HCO2)3 between the 2 K data and the lower temperature data in the ordered phases. This can be attributed to the reported quasi-1D Ising like nature of the spins in Tb(HCO2)3,36,43 requiring small fields before the frustrated antiferromagnetic correlations are overcome prior to forming a ferromagnetic phase. Therefore, even in the ordered phase the frustrated ground state is prone to the formation of a ferromagnetic phase upon perturbation through an applied field. This is consistent with the reported behaviour of Tb(HCO2)3, and provides a strong evidence to hypothesis that frustrated Ising chains are a recipe for enhanced magnetocaloric materials. In contrast, TbOHCO3 shows considerable differences in magnetisation behaviour between 0.5 K and 2.0 K, where in the absence of an applied magnetic field ordered antiferromagnetic and correlated paramagnetic phases exist, despite both containing ferromagnetic Ising chains. TbOHCO3 shows a steeper magnetisation, and a higher saturation value in the paramagnetic phase, likely due to the strong ferromagnetic correlations along the chain directions but much weaker frustrated antiferromagnetic correlations.9 At lower temperatures where the antiferromagnetic correlations become more significant, a lower saturation value is observed.
 | ||
| Fig. 2 Applied field measurements of Tb(HCO2)3 and TbOHCO3 at various temperatures, above and below the magnetic phase transitions. Points in red shades indicate Tb(HCO2)3, and squares in blue shades indicate TbOHCO3. Hysteresis of TbOHCO3, in small applied fields at 0.5 K shown in the insert. Dotted line indicates 0.5gjJ for Tb3+. Arrows indicate direction of magnetisation. | ||
TbOHCO3 has been reported to contain four Ising axes, and therefore the saturation value of the bulk powder sample is expected to be larger than that of Tb(HCO2)3. We observe a saturation value slightly larger than that of Tb(HCO2)3 and approaching 2/3gjJ. As shown in the insert of Fig. 2, TbOHCO3 also shows an additional magnetisation plateau at ∼0.2 μB equal to M/Msat = 1/30. This plateau is not seen in the 2 K data, and emerges as a result of the effect of a field on the magnetic ground state. The exact nature of the plateau is currently unknown and should be subject to further investigations. Similar magnetisation plateaus have been observed in other rare earth,44,45 and magnetocaloric materials.46,47 In these low applied fields, some magnetic hysteresis is observed indicating a ferromagnetic component to the field induced magnetic phase. A 1/3 magnetisation plateau is sometimes observed in Ising chains materials, such as Ca3Co2O6, and single crystals or aligned powders of CoV2O6 (but not polycrystalline samples).21,48–51 This plateau is a result of a field induced metamagnetic ferrimagnetic state when Ising chains are arranged in a triangle. This plateau can be lost or greatly diminished in polycrystalline samples,21,50,51 therefore we postulate this is not observed here due to the loss of information associated with powder averaging. However, we may expect to recover these plateaus with magnetic fields applied to the c and b axes of Tb(HCO2)3 and TbOHCO3 single crystals, respectively along the chain direction.
To investigate the mechanism of the magnetisation behaviours in these magnetocaloric materials, and how this affects the adiabatic refrigeration cycle, we investigated these materials through neutron diffraction in applied fields. This was performed at the temperatures at which they are correlated paramagnets and where the MCE is most significant.
Tb(DCO2)3
At 1.5 K the magnetic field was swept from 0–3 T in variable steps. With an applied field of μ0H = 0.1 T, the appearance of new peaks was noted (see Fig. 3) and was found to be consistent with the formation of a magnetic phase that can be indexed with the k1-vector = (0,0,1). These peaks are consistent with the presence of the previously reported TIA phase, suggesting the same phase is being formed.8,36,43
 | ||
| Fig. 3 Waterfall plot of data from bank 2/9 of WISH, plotted on a log scale and offset for clarity, for Tb(DCO2)3 with respect to field, at 1.5 K. The peaks at ∼5.2 Å indicate the ferromagnetic phase, and the peaks highlighted with a box at ∼9.1 Å indicate the TIA phase. | ||
Refinement of the TIA phase, requires both the sharp, Bragg-like, and broad diffuse magnetic scattering to be simultaneously fitted, which is not possible with the data obtained in this study since, as explained above, it was not possible to precisely measure the diffuse scattering. As discussed in the study by Saines et al.,8 which was carried out without an applied field, when treated using conventional crystallographic approaches two possible magnetic phases can be fitted to the Bragg-like features. Both of these adopt P3m'1 magnetic symmetries, featuring ferromagnetic chains with spins aligned along the c-axis and antiferromagnetic alignment of these chains. The two magnetic phases vary only by the choice of the internal phase, to which diffraction is insensitive, with π/6 consisting of the ½ up, ½ up, down spin or π/4 consisting of up, down, zero spin structure on a triangle, with the latter resembling a partially disordered antiferromagnet (PDA). The growth of this magnetic phase with applied magnetic field and its appearance together with a k = 0 propagation vector, indicate that the magnetic phase must couple with the field. Considering only these two conventional magnetic structures, this suggests that the magnetic phase present here is the ½ up, ½ up, down phase. As expected, we find either of these models give a good fit to the data obtained here (see Fig. S3–S8, ESI†), but unambiguous determination of this is impossible from diffraction data alone.36 In any case we note that both these conventional crystallographic models are likely simplifications of the TIA state, which is considered to be a better model of this phase as it also fits the observed diffuse magnetic scattering that was clearly characterised in zero field data,43 but is also evident here (see Fig. S9, ESI†). We will therefore continue to refer to this ordered state as the TIA phase.
The interesting feature of the Bragg peaks observed in this applied field data, as compared to the previous zero-field studies, is the much smaller full width at half maximum (FWHM) of the peaks associated with the TIA phase, although they are still significantly broader than the instrumental resolution of WISH. We previously assigned the peak broadening of this phase to the inherent disorder of the TIA state due to its lack of conventional 3D crystallographic order.36,43 The smaller FWHM of this phase in applied field corresponds to a much larger correlation length, likely within the chains of the TIA state.
Raising the field to 0.2 T, increased the intensities of the peaks associated with the TIA phase, and additional intensity was observed on reflections caused by scattering from the nuclear structure, indicating a magnetic phase indexing to a k2-vector = (000) (see Fig. S5 and S6 for quality of selected fits, ESI†). The intensity of the magnetic reflections associated with the k2 phase can be described by a simple ferromagnetic structure, with all moments aligned along the c-axis. The alignment of the moments along the c-axis, is in agreement with the easy axis and Ising anisotropy of the spins, expected from a Tb3+ ion and observed in previous studies.8,52 At 0.2 T the maximum intensity of the reflections associated with the TIA phase is observed, with a refined magnetic moment of 0.86(7) μB. Between 0.2–0.6 T there is phase coexistence of the TIA and the ferromagnetic phase, with the TIA phase dropping in intensity at fields above 0.2 T, and the ferromagnetic phase growing in intensity. Here we have treated the observed magnetic scattering as phase coexistence, however, we cannot rule out that this scattering arises from a single phase of two moments up, and one down. Our preference is for a two phase model due to the presence of these phases existing separately, in zero and higher applied fields. Refinement of a single magnetic phase model produces a worse fit to the data at 0.2 T (Rwp-singlephase = 6.79% vs. Rwp-dualphase = 5.90%, 58° bank), due to slight differences in FWHM of peak associated with the two phases, caused by differing correlation lengths.
At 0.8 T only the ferromagnetic phase exists. Scattering from this phase increases in intensity up to 3 T (see Fig. S7 and S8 for this to this data), although it is near saturation (8.63(11) μB) at ∼2 T, as shown in Fig. 4.
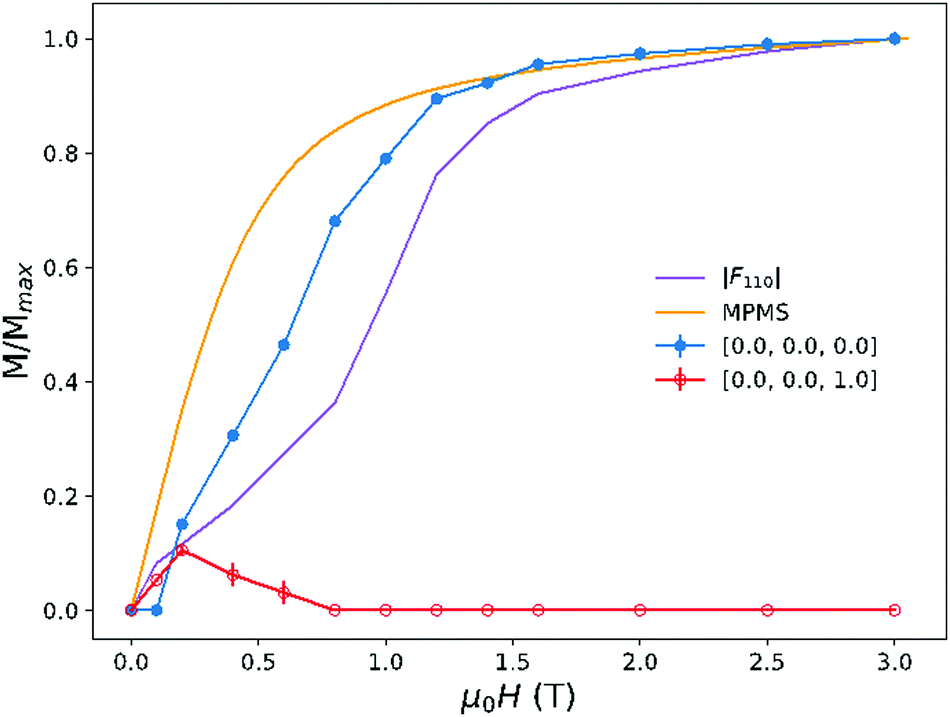 | ||
| Fig. 4 Evolution of the total ordered magnetic moments associated with k1 (red) and k2 (blue), in Tb(DCO2)3, with respect to field. Shown in orange is the magnetic moment as determined by the MPMS at 2 K. Shown in purple is the structure factor of the (110) reflection, the most intense peak associated with the ferromagnetic phase. | ||
The saturation value at 3 T, 8.86(10) μB, is close to the 9 μB value expected for Tb3+ from diffraction data, and has excellent agreement to our magnetic property measurements, validating the accuracy of the neutron diffraction results. We have plotted M/Mmax to negate the effect of uniaxial magnetic anisotropy on magnetisation data, allowing for comparison to moments refined from neutron data.
The formation of the k1 phase prior to the ferromagnetic phase indicates the small applied fields assists the system to build up long range ordering in the ab plane, until the Zeeman energy is larger than the interchain coupling and a metamagnetic transition occurs to a ferromagnet. That is, the highly entropic short range 1D ferromagnetic correlations that occur in zero field,36,43 enables the spins within the chains to be readily aligned in magnetic field, transitioning into a ferromagnet (see Fig. 5). This enables the number of microstates and entropy to be greatly and easily reduced.
 | ||
| Fig. 5 Diagram showing the phase transition from a ½ up ½ up down (k1) phase to a ferromagnetic (k2) phase in applied magnetic field. The Tb3+ atoms are not to scale and shown in purple, all other atoms have been excluded for clarity and magnetic vectors are shown as red arrows. The unit cell is shown as a black box. Upper figure shows the PDA phase, and the lower shows the ferromagnetic phase along the [100] axis. | ||
The alignment of the ferromagnetic chains in the correlated paramagnetic phase, to simple ferromagnetic structure leads to large changes in entropy for small applied magnetic fields, which has been suggested in previous studies.8,53 In this study we have confirmed and directly observed the evolution from the correlated paramagnetic phase through the TIA phase and ultimately to a ferromagnetic phase under moderate applied fields. This is consistent with the idea that the ferromagnetic chains, in this material, likely play a key role in its optimised magnetocaloric properties under low applied fields and the existence of the TIA plays some role in this.
Variable temperature measurements were performed subsequently to the variable field measurements. Before variable temperature measurements the applied field was removed, heated to 30 K to remove any magnetic correlations, cooled to base, and a 0.1 T field applied and left to equilibrate. Measurements were then taken at variable temperatures, with a 0.1 T applied field, between 1.5 and 40 K. The diffraction patterns are shown in Fig. 6.
 | ||
| Fig. 6 Contour plot of bank 2/9 of WISH for Tb(DCO2)3 with respect to temperature, with a 0.1 T applied field. The weak peaks at ∼5.2 Å indicates the ferromagnetic (FM) phase, and the strong peaks at ∼9 Å indicates the TIA phase. | ||
All intensity in the reflections is lost upon reaching the critical temperatures of ∼8 K, for the TIA phase and between 20 and 40 K for the ferromagnetic phase, respectively (see Fig. 7 for evolution of refined magnetic moments). At 1.5 K in a 0.1 T field we observe phase coexistence of the same k1 and k2 phases seen in earlier measurements, with refined moments of 6.57(5) and 3.10(4) μB for the TIA and ferromagnetic phases, respectively, with the greater extent of magnetic order compared to the previous measurements as a function of field. Differences in moment lengths can be attributed to the longer equilibration time at base temperature. Raising the temperature resulted in continuous reductions of the magnetic moments, before a rapid decrease in their intensities above 3 and 4 K for the TIA and ferromagnetic phases. We note that the critical temperature for the TIA phase observed here is higher than that observed in zero applied fields above 1.6 K, confirming it is stabilised by application of an applied magnetic field. Above this temperature diffuse scattering centred around ∼9.1 Å/0.5 Å−1 is observed (see Fig. S9, ESI†). The diffuse scattering observed is qualitatively similar to that observed in previous studies,8,36,43 and therefore can likely be attributed to short range 1D Ising chain correlations along the c-axis.
 | ||
| Fig. 7 Evolution of the ordered magnetic moments associated with k1 (red) and k2 (blue), in Tb(DCO2)3, with respect to temperature in a 0.1 T applied magnetic field. | ||
TbODCO3
 | ||
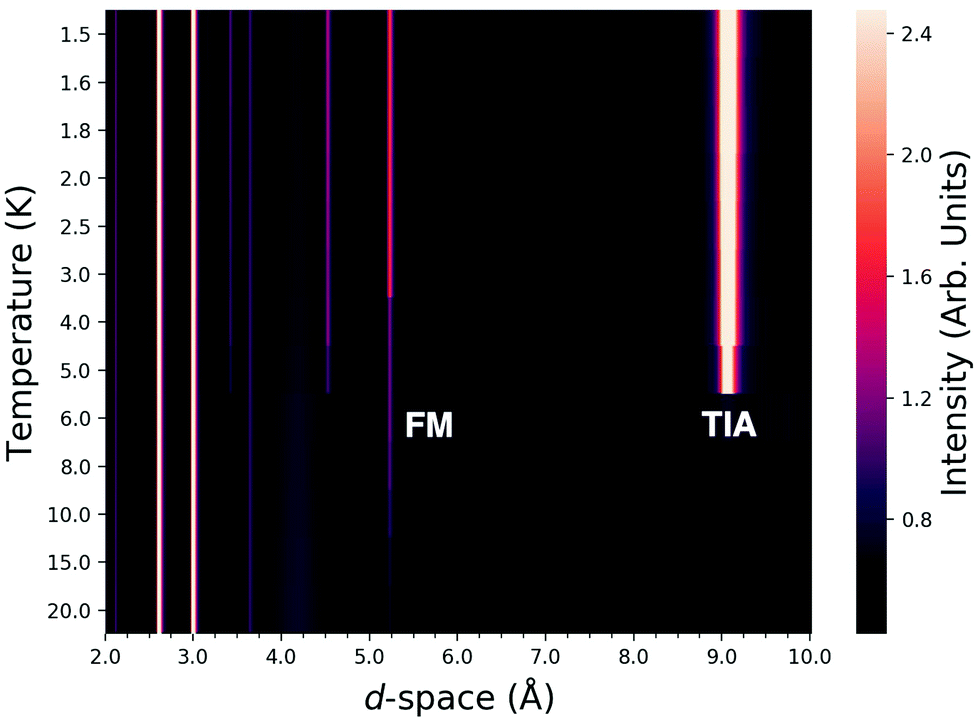
| Fig. 8 Evolution of the ordered magnetic moments associated with the applied field phases of TbODCO3 with respect to applied field. Growing peaks highlighted with boxes, can be seen at 5.3, 7.1 and 8.5 Å with greater applied magnetic fields. There is significant magnetic diffuse scattering at higher d-space, from which the Bragg peaks emerge. | ||
Strong magnetic diffuse scattering is observed at higher d-spacing, as shown in Fig. 8 and Fig. S8 (ESI†), consistent with previous zero field studies,9 from which the magnetic Bragg peaks emerge. All magnetic reflections of this material, are associated with the Γ-point, but cannot be fitted well by a single magnetic phase. Symmetry analysis of the k = 0 propagation vector acting on the P212121 space group produces four symmetry allowed magnetic structures, three with ferromagnetic components along the a, b and c-axis and one with no ferromagnetic component. Good fits were obtained with two coexisting k = 0 phases, but combining these into a single phase, which results in lowering the symmetry to P21 significantly worsens this fit.
In zero applied fields the k = 0 antiferromagnetic structure, with no ferromagnetic component, was observed at low temperatures in HoODCO3.15 In applied fields this antiferromagnetic phase is not likely to be observed in TbODCO3, as structures would be expected to contain a net ferromagnetic moment that can couple with applied field, consistent with the rapid increase in magnetisation observed in physical property measurements. Inspection of the other three magnetic structures reveals that only those with a ferromagnetic component along the b and c axes, produce a magnetic structure compatible with the reported easy axes of the Tb3+ moments.9 Fitting the data with a model comprised of these two separate magnetic phases leads to excellent fits, as shown in Fig. S11 and S12 (ESI†). Thus the magnetic phase can be described as a coexistence of a ferromagnetic phase and a canted antiferromagnetic phase. The ferromagnetic phase and the canted antiferromagnetic phases both adopt P21′21′21 magnetic symmetry and are differentiated by the presence of the mΓ4 and mΓ2 modes, respectively. The canted antiferromagnetic phase adopts the same unit cell as the nuclear, but the ferromagnetic phase is related to the nuclear unit cell by a {(1,0,0),(0,0,−1),(0,1,0)} transformation and a shift of the origin to (1/4,1/4,−1/4). For simplicity all figures are presented in the nuclear unit cell.
The ferromagnetic phase emerges in small magnetic fields (<0.1 T) with the canted antiferromagnetic phase coexisting and forming at <0.2 T applied fields, both growing with increasing magnetic field above 0.2 T. The ferromagnetic phase has a significant net ferromagnetic component along the b-axis (Fig. 9), with non-collinear moments in agreement with the easy axis suggested previously.9
 | ||
| Fig. 9 The two magnetic structures of TbODCO3 in an applied magnetic field at 3 T. Tb3+ ions are shown in purple, carbon shown in black, oxygen shown in black and deuterium shown in grey. Unit cell shown in black. Magnetic vectors shown as red arrows. (a) Shows the ferromagnetic structure while (b) shows the canted antiferromagnetic structure, which has a significant ferromagnetic component along the c-axis. The magnetic chains are highlight as translucent black lines. | ||
This reflects the non-collinear nature of the Ising-like short range ordered phase of TbODCO3. In this long range ordered structure, however, not only are the magnetic cations within the chains ferromagnetically coupled but they also have ferromagnetic inter-chain coupling. This indicates that the applied magnetic field has overcome the interchain antiferromagnetic coupling found in the short range ordered phase. The canted antiferromagnetic phase coexisting with a ferromagnetic phase in the presence of a magnetic field initially appeared peculiar since it has antiferromagnetic coupling within its chains, along the b-axis, in contrast to the ferromagnetic coupling that is dominant in the short range ordered state in the absence of an applied magnetic field.15 As seen in Table 1 the refined canted antiferromagnetic phase has non-collinear spins oriented towards the [±0.33, 1, ±0.66] axes with a net ferromagnetic component along the c-axis. This contrasts with the ferromagnetic phase where essentially the same easy axis is adopted but the dominant net ferromagnetic moment is along the b-axis. These two phases can of course be combined into one phase, however fits were found to be superior in a coexisting two phase model compared to the single phase model (Rwp-singlephase = 4.27% vs. Rwp-dualphase = 1.85%, 58° bank), which also produced unphysical moment lengths. Better fits were obtained due to a broader peak FWHM, and therefore shorter correlation length, in the canted antiferromagnetic phase compared to the ferromagnetic phase.
| Atomic site | u | v | w |
|---|---|---|---|
| Ferromagnet | |||
| Tb1 | 0.152(10) | 0.94(2) | 0.301(11) |
| Tb2 | 0.152(10) | 0.94(2) | −0.301(11) |
| Tb3 | −0.152(10) | 0.94(2) | −0.301(11) |
| Tb4 | −0.152(10) | 0.94(2) | 0.301(11) |
| Canted antiferromagnet | |||
| Tb1 | 0.223(12) | 0.85(2) | 0.483(11) |
| Tb2 | −0.223(12) | −0.85(2) | 0.483(11) |
| Tb3 | 0.223(12) | −0.85(2) | 0.483(11) |
| Tb4 | −0.223(12) | 0.85(2) | 0.483(11) |
The difference in the orientation of the net ferromagnetic component in the two observed phases allows the rationalisation of their co-existence by considering the application of an applied field to a polycrystalline sample. The near random particle orientation distribution in powder samples produces suitable powder averaging to allow indexing and characterisation of the nuclear phase in these materials. However with highly anisotropic single ion moments, in the application of a magnetic field sufficient powder averaging is lost. The applied magnetic field acting on each micro-crystallite forces the magnetic moments to align in the most favourable orientation that depends on the orientation of the applied field with respect to that micro-crystallite, with consideration of the local Ising easy axis. That is, if the magnetic field vector is applied closer to the b-axis of the randomly oriented particle, the ferromagnetic component of the moments will most likely be aligned along the b-axis producing the ferromagnetic phase. We hypothesise that the canted antiferromagnetic phase arises when the applied field is closer to the c-axis consisting of a ferromagnetic component observed along the c-axis, consistent with the observed magnetisation saturation value. We observe no magnetic phase with a ferromagnetic moment along a, and hypothesise the strong anisotropy prevents this magnetic phase forming, which would produce magnetic moments orientations that differ from the [±0.33, 1, ±0.66] easy axes reported for the Tb cations, established from previous reverse Monte Carlo studies.9
Both structures produce moments with easy axes close to those earlier reported and the long range ordered k = 0 state seen in HoODCO3,9 but both have ferromagnetic components along the b, and c axes for the ferromagnetic and canted antiferromagnetic structures, respectively. Fig. 10 shows the evolution of the ordered magnetic moments obtained from our refinements. For highly anisotropic single ions such as Tb3+, the magnetic moments refined from powder diffraction data must also be considered tentatively, because of constraints used in the refinement and that proper powder averaging is not achieved.
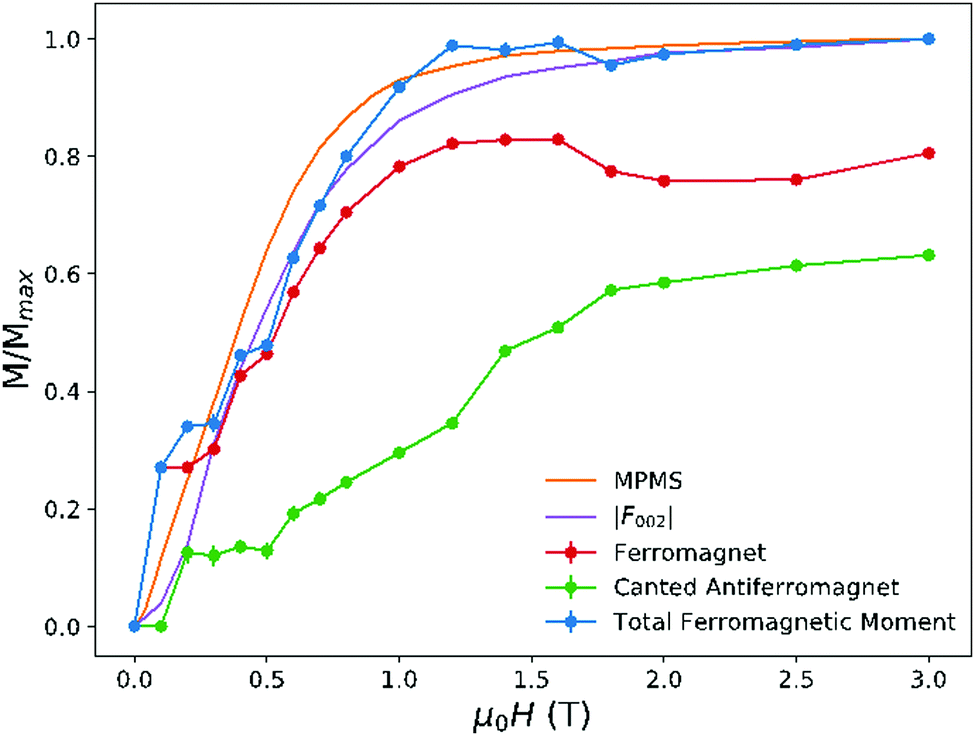 | ||
| Fig. 10 Evolution of the ordered magnetic moments associated with the ferromagnetic phases of TbODCO3 with respect to applied field. Shown in blue is the total ordered ferromagnetic moment as determined by Rietveld refinement of the diffraction pattern from neutron diffraction data. Shown in orange is the magnetic moment as determined by the MPMS at 2 K, and purple is the structure factor of the ferromagnetic (002) reflection. | ||
Despite this difficulty, the magnetic structures and moments determined are sensible and in agreement with magnetisation measurements, and therefore confident our model is close to the physical manifestation of these phenomena. We find excellent agreement between our neutron total ferromagnetic moment and magnetisation measurements, saturating at 2/3gjJ. We observe the same magnetisation plateau in magnetic form factor, as seen in the magnetisation measurements, at low fields. The co-existence of two k = 0 magnetic phases lead to the problem of having overlapping reflections, and the inability to refine moment size and phase fraction simultaneously. Contributions from each phase are therefore difficult to de-convolute, so absolute values from each phase are approximations and lead to noisy neutron magnetisation curves. The effect of the applied magnetic field on the evolution of the magnetic phases is also in broad agreement with magnetic susceptibility measurements showing typical magnetisation behaviour and beginning to saturate below 2 T. To completely understand the ground state of this material, for particular directions of applied magnetic fields, neutron diffraction sized single crystals would need to be obtained. This would allow fields to be applied along particular directions of the crystal structure in a more controlled fashion. However, given the challenges in growing large single crystal under hydrothermal conditions this will require considerable synthetic optimisation.
In a 3.0 T magnetic field, at 1.5 K, the ferromagnetic and canted antiferromagnetic phases have magnetic moments of 5.04(6) and 3.95(3) μB, respectively. While we cannot determine the moment size and phase fraction of these two phases unambiguously, the ordering of the ferromagnetic phase appears to occur more readily at low applied fields suggesting that only a small magnetic field along specific axis is required to suppress the interchain correlations and align the entire phase ferromagnetically. Furthermore, the ferromagnetic phase appears to also have either more complete magnetic order or be the dominant phase compared to the canted antiferromagnetic structure, particularly below 1.8 T. This may indicate that single crystal samples of TbODCO3 magnetised along the b-axis may show a single ferromagnetic phase and therefore would have even better magnetocaloric performance in low applied magnetic fields, than the powder analogue. In contrast applying a magnetic field vector along the c-axis to a single crystal, of this phase, is likely to only display the canted antiferromagnetic structure described above.
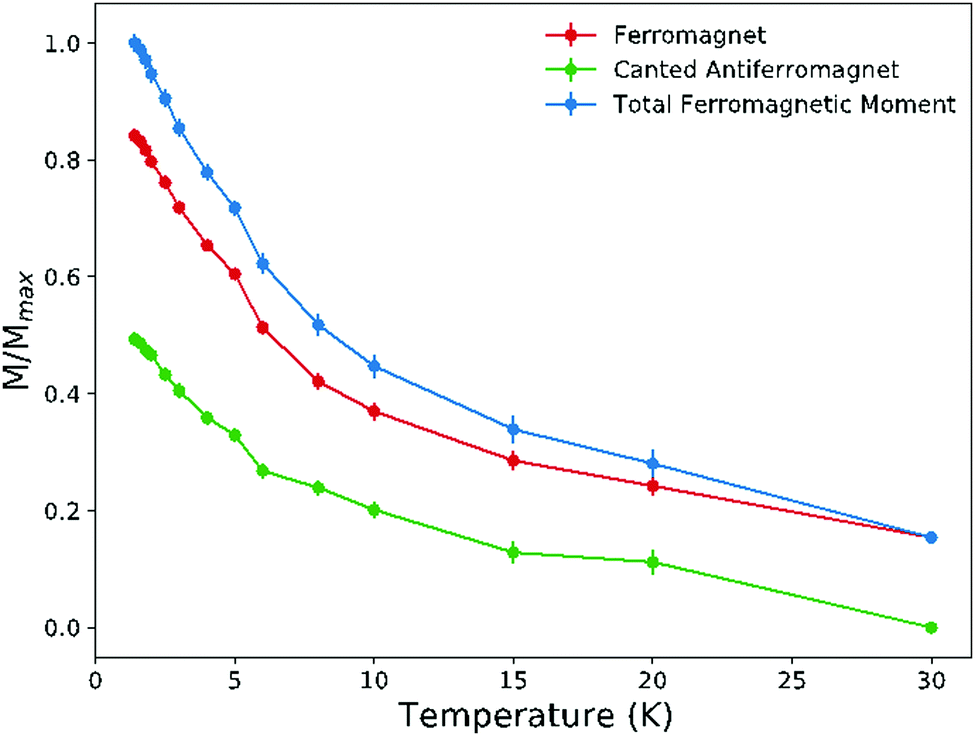 | ||
| Fig. 11 Evolution of the ordered magnetic moments associated with the ferromagnetic phases of TbODCO3 with respect to temperature in a 1 T applied field. Blue indicates the ordered magnetic moment as determined by Rietveld refinement of the diffraction pattern from neutron diffraction data. | ||
The continued presence of this ferromagnetic phase in a magnetic field to high temperatures, through the temperature range where TbOHCO3 has been found to have high magnetocaloric performance,33 indicates it readily forms under an applied magnetic field, which is beneficial to its magnetocaloric properties.
Conclusions
We have observed the mechanism for the magnetocaloric effect in two highly efficient low temperature magnetocaloric materials, with applications in liquid helium refrigeration replacement, through neutron diffraction. Our results show that the application of a magnetic field drives the transition from high entropy correlated paramagnetic phases, containing ferromagnetic Ising chains, to low entropy ordered phases. Specifically we suggest that the significant ferromagnetic correlations are of greatest importance in these materials enabling ordered magnetic states to emerge at low fields, once the frustrated antiferromagnetic interactions are suppressed. The short-range ordered states contain a greater number of microstates, compared with the ordered states, such that when a magnetic field is applied a large change in microstates and entropy is observed (ΔS = RlnΩ), resulting in large magnetocaloric effect. At sufficiently low temperatures the limit for entropy changes for random Ising spins approaches Rln2,26,54,55 but the correlated disordered nature of these materials maximises accessible entropy changes for low applied fields.8,33 Crucially, we have shown that such ordered states persist to temperatures above which the peak magnetocaloric properties are observed, such they are likely to play a key role in this performance. This has great implications in the design of new magnetocaloric materials optimised for low temperature refrigeration, and liquid helium replacement. The insights gained from this study highlight the power of neutron diffraction to provide significant insight into magnetic materials exhibiting unusual field induced transitions.
Here we have shown clearly that ferromagnetic Ising chains play a key role in the adiabatic refrigeration cycle of two promising materials, Tb(DCO2)3 and TbODCO3. These correlations allow Tb(DCO2)3 and TbODCO3 to outperform similar Ising magnetocaloric materials in low fields at these temperatures.26,46
Conflicts of interest
There are no conflicts to declare.Acknowledgements
RJCD would like to thank the University of Kent's for financial support through the provision of a Vice-Chancellors scholarship. We would also like to thank the Science and Technologies Facilities Council for access to the ISIS facility at Harwell and the Leverhulme Trust through funding via RPG-2018-268. S. E. D. would like to thank funding from the Winton Programme for the Physics of Sustainability. Low temperature MPMS measurements were carried out on the EPSRC Advanced Materials Characterization Suite (EP1M0052411) and at the materials characterisation lab at ISIS, Harwell.References
- R. L. Comstock, J. Mater. Sci.: Mater. Electron., 2002, 13, 509–523 CrossRef CAS.
- F. S. Guo, B. M. Day, Y. C. Chen, M. L. Tong, A. Mansikkamäki and R. A. Layfield, Science, 2018, 362, 1400–1403 CrossRef CAS.
- Z. Luo, A. Hrabec, T. P. Dao, G. Sala, S. Finizio, J. Feng, S. Mayr, J. Raabe, P. Gambardella and L. J. Heyderman, Nature, 2020, 579, 214–218 CrossRef CAS PubMed.
- Y. D. Xiao, R. Paudel, J. Liu, C. Ma, Z. S. Zhang and S. K. Zhou, Int. J. Mol. Med., 2016, 38, 1319–1326 CrossRef CAS PubMed.
- R. D. Johnson, P. Barone, A. Bombardi, R. J. Bean, S. Picozzi, P. G. Radaelli, Y. S. Oh, S. W. Cheong and L. C. Chapon, Phys. Rev. Lett., 2013, 110, 217206 CrossRef CAS PubMed.
- C. Vecchini, A. Bombardi, L. C. Chapon, N. Lee, P. G. Radaelli and S. W. Cheong, J. Phys.: Conf. Ser., 2014, 519, 012004 CrossRef.
- M. M. Vopson, Solid State Commun., 2012, 152, 2067–2070 CrossRef CAS.
- P. J. Saines, J. A. M. Paddison, P. M. M. Thygesen and M. G. Tucker, Mater. Horiz., 2015, 2, 528–535 RSC.
- R. C. Dixey, G. B. G. Stenning, P. Manuel, F. Orlandi and P. J. Saines, J. Mater. Chem. C, 2019, 7, 13111–13119 RSC.
- J. L. Liu, Y. C. Chen and M. L. Tong, Chem. Rec., 2016, 16, 825–834 CrossRef CAS PubMed.
- L. Mañosa, A. Planes and M. Acet, J. Mater. Chem. A, 2013, 1, 4925–4936 RSC.
- J. L. Manson, Q. Z. Huang, J. W. Lynn, H. J. Koo, M. H. Whangbo, R. Bateman, T. Otsuka, N. Wada, D. N. Argyriou and J. S. Miller, J. Am. Chem. Soc., 2001, 123, 162–172 CrossRef CAS PubMed.
- M. Kurmoo, Chem. Soc. Rev., 2009, 38, 1353–1379 RSC.
- P. J. Saines, M. Steinmann, J. C. Tan, H. H. M. Yeung, W. Li, P. T. Barton and A. K. Cheetham, Inorg. Chem., 2012, 51, 11198–11209 CrossRef CAS PubMed.
- Z. Hulvey, B. C. Melot and A. K. Cheetham, Inorg. Chem., 2010, 49, 4594–4598 CrossRef CAS PubMed.
- A. E. Thorarinsdottir and T. D. Harris, Chem. Rev., 2009, 38, 1353–1379 Search PubMed.
- N. J. Robinson, F. H. L. Essler, I. Cabrera and R. Coldea, Phys. Rev. B: Condens. Matter Mater. Phys., 2014, 90, 174406 CrossRef.
- I. Cabrera, J. D. Thompson, R. Coldea, D. Prabhakaran, R. I. Bewley, T. Guidi, J. A. Rodriguez-Rivera and C. Stock, Phys. Rev. B: Condens. Matter Mater. Phys., 2014, 90, 014418 CrossRef.
- R. Coldea, D. A. Tennant, E. M. Wheeler, E. Wawrzynska, D. Prabhakaran, M. Telling, K. Habicht, P. Smeibidl and K. Kiefer, Science, 2010, 327, 177–180 CrossRef CAS PubMed.
- T. J. S. Munsie, M. N. Wilson, A. Millington, C. M. Thompson, R. Flacau, C. Ding, S. Guo, Z. Gong, A. A. Aczel, H. B. Cao, T. J. Williams, H. A. Dabkowska, F. Ning, J. E. Greedan and G. M. Luke, Phys. Rev. B: Condens. Matter Mater. Phys., 2017, 96, 144417 CrossRef.
- M. Nandi and P. Mandal, J. Appl. Phys., 2016, 119, 133904 CrossRef.
- J. D. Bocarsly, E. E. Levin, S. A. Humphrey, T. Faske, W. Donner, S. D. Wilson and R. Seshadri, Chem. Mater., 2019, 31, 4873–4881 CrossRef CAS.
- A. M. Tishin and Y. I. Spichkin, Mater. Today, 2003, 6, 51–52 Search PubMed.
- J. Lyubina, J. Phys. D: Appl. Phys., 2017, 50, 053002 CrossRef.
- A. Smith, Eur. Phys. J. H, 2013, 38, 507–517 CrossRef.
- P. Mukherjee and S. E. Dutton, Adv. Funct. Mater., 2017, 27, 1701950 CrossRef.
- P. Mukherjee, A. C. Sackville Hamilton, H. F. J. J. Glass and S. E. Dutton, J. Phys.: Condens. Matter, 2017, 29, 405808 CrossRef CAS PubMed.
- P. Mukherjee, H. F. J. Glass, E. Suard and S. E. Dutton, Phys. Rev. B: Condens. Matter Mater. Phys., 2017, 96, 140412 CrossRef.
- J. A. M. Paddison, H. Jacobsen, O. A. Petrenko, M. T. Fernández-Díaz, P. P. Deen and A. L. Goodwin, Science, 2015, 350, 179–181 CrossRef CAS PubMed.
- J. A. Barclay and W. A. Steyert, Cryogenics, 1982, 22, 73–80 CrossRef CAS.
- R. Moessner and A. P. Ramirez, Phys. Today, 2006, 59, 24–29 CrossRef CAS.
- Y.-C. Chen, L. Qin, Z.-S. Meng, D.-F. Yang, C. Wu, Z. Fu, Y.-Z. Zheng, J.-L. Liu, R. Tarasenko, M. Orendáč, J. Prokleška, V. Sechovský and M.-L. Tong, J. Mater. Chem. A, 2014, 2, 9851–9858 RSC.
- R. J. C. Dixey and P. J. Saines, Inorg. Chem., 2018, 57, 12543–12551 CrossRef CAS PubMed.
- G. Lorusso, J. W. Sharples, E. Palacios, O. Roubeau, E. K. Brechin, R. Sessoli, A. Rossin, F. Tuna, E. J. L. McInnes, D. Collison and M. Evangelisti, Adv. Mater., 2013, 25, 4653–4656 CrossRef CAS PubMed.
- P. J. Saines and N. C. Bristowe, Dalton Trans., 2018, 47, 13257–13280 RSC.
- R. J. C. Dixey, F. Orlandi, P. Manuel, P. Mukherjee, S. E. Dutton and P. J. Saines, Philos. Trans. R. Soc., A, 2019, 377, 20190007 CrossRef CAS PubMed.
- L. C. Chapon, P. Manuel, P. G. Radaelli, C. Benson, L. Perrott, S. Ansell, N. J. Rhodes, D. Raspino, D. Duxbury, E. Spill and J. Norris, Neutron News, 2011, 22, 22–25 CrossRef.
- H. M. Rietveld, J. Appl. Crystallogr., 1969, 2, 65–71 CrossRef CAS.
- J. Rodríguez-Carvajal, Phys. B, 1993, 192, 55–69 CrossRef.
- A. Le Bail, Powder Diffr., 2005, 20, 316–326 CrossRef CAS.
- J. Rodriguez-Carvajal, M. T. Fernandez-Diaz and J. L. Martinez, J. Phys.: Condens. Matter, 1991, 3, 3215–3234 CrossRef CAS.
- J. M. Perez-Mato, S. V. Gallego, E. S. Tasci, L. Elcoro, G. de la Flor and M. I. Aroyo, Annu. Rev. Mater. Res., 2015, 45, 217–248 CrossRef CAS.
- D. R. Harcombe, P. G. Welch, P. Manuel, P. J. Saines and A. L. Goodwin, Phys. Rev. B: Condens. Matter Mater. Phys., 2016, 94, 174429 CrossRef.
- D. Brunt, G. Balakrishnan, D. A. Mayoh, M. R. Lees, D. Gorbunov, N. Qureshi and O. A. Petrenko, Sci. Rep., 2018, 8, 232 CrossRef CAS.
- K. Siemensmeyer, E. Wulf, H. J. Mikeska, K. Flachbart, S. Gabáni, S. Mat’Aš, P. Priputen, A. Efdokimova and N. Shitsevalova, Phys. Rev. Lett., 2008, 101, 177201 CrossRef CAS PubMed.
- P. Mukherjee, Y. Wu, G. I. Lampronti and S. E. Dutton, Mater. Res. Bull., 2018, 98, 173–179 CrossRef CAS.
- P. Mukherjee, E. Suard and S. E. Dutton, J. Phys.: Condens. Matter, 2017, 29, 405807 CrossRef CAS PubMed.
- Z. He, J. I. Yamaura, Y. Ueda and W. Cheng, J. Am. Chem. Soc., 2009, 131, 7554–7555 CrossRef CAS PubMed.
- H. Kageyama, K. Yoshimura, K. Kosuge, H. Mitamura and T. Goto, J. Phys. Soc. Jpn., 1997, 66, 1607–1610 CrossRef CAS.
- P. Lampen-Kelley, E. M. Clements, B. Casas, M. H. Phan, H. Srikanth, J. Marcin, I. Skorvanek, H. T. Yi and S. W. Cheong, J. Magn. Magn. Mater., 2020, 493, 165690 CrossRef CAS.
- M. Nandi, N. Khan, D. Bhoi, A. Midya and P. Mandal, J. Phys. Chem. C, 2014, 118, 1668–1673 CrossRef CAS.
- R. Skomski and D. J. Sellmyer, J. Rare Earths, 2009, 27, 675–679 CrossRef.
- R. Li, P. Manuel, F. Orlandi and C. Greaves, J. Mater. Chem. A, 2018, 6, 21149–21155 RSC.
- J. A. M. Paddison, H. S. Ong, J. O. Hamp, P. Mukherjee, X. Bai, M. G. Tucker, N. P. Butch, C. Castelnovo, M. Mourigal and S. E. Dutton, Nat. Commun., 2016, 7, 13842 CrossRef CAS PubMed.
- W. P. Wolf, Braz. J. Phys., 2000, 30, 794–810 CrossRef CAS.
Footnote |
| † Electronic supplementary information (ESI) available: Tables and figures of crystallographic details and local magnetic structure refinements. See DOI: 10.1039/d0tc03153d |
| This journal is © The Royal Society of Chemistry 2020 |