 Open Access Article
Creative Commons Attribution 3.0 Unported Licence
An insight into de Vries behaviour of smectic liquid crystals from atomistic molecular dynamics simulations†
Kristian
Poll
 and
Mark T.
Sims
 *
*
Department of Applied Sciences, Faculty of Health and Life Sciences, Northumbria University, Newcastle upon Tyne, NE1 8ST, UK. E-mail: mark.sims@northumbria.ac.uk
First published on 1st September 2020
Abstract
Fully atomistic molecular dynamics simulations have been performed on the ferroelectric liquid crystal compound 9HL, which exhibits de Vries character. Simulations were carried out at a range of temperatures, and both SmA* and SmC* phases were successfully simulated. Experimental trends in orientational order parameter, translational order parameter, layer spacing, and tilt angle were found to be matched by the simulations. The simulations were analysed in the context of multiple reported models developed from the interpretation of experimental data, none of which were found to individually describe the simulated behaviour. Further analysis demonstrated the formation of distinct aromatic and lactate sub-layers in the 9HL simulations. The aromatic sub-layers exhibited tilting behaviour at the SmA*/SmC* transition, whereas alignment within the lactate sub-layers was found to be relatively unchanged, maintaining a SmA-like configuration even in the SmC* phase. This behaviour provides a simple explanation for de Vries behaviour, where only a fraction of the layer structure exhibits an overall tilt in the SmC phase.
Introduction
Liquid crystal (LC) phases are differentiated by the extent of the orientational and positional order they exhibit. In the nematic phase LCs possess orientational order and molecules align along a preferred axis termed the director (n), whereas in the smectic phases LCs exhibit both orientational and positional order and molecules self-assemble into a lamellar structure. A variety of smectic sub-phases with distinct properties may be formed by some mesogenic compounds, giving rise to the extensive potential applications of smectic phases.1–3 Of the smectic sub-phases, the smectic A (SmA) phase, in which the director is coincident with the vector normal to the layers (k), and the smectic C (SmC) phase, in which the director is tilted with respect to the smectic layer normal, are the most prevalent.The chiral smectic C (SmC*) phase is exhibited by chiral molecules which form the SmC phase, or may be induced in non-chiral SmC systems with the addition of a chiral dopant.4,5 In 1975, Meyer et al. predicted, based on fundamental symmetry properties, that any positionally ordered tilted phase composed of chiral molecules should exhibit ferroelectric characteristics.6,7 Such ferroelectric liquid crystals (FLCs) exhibit a number of properties, but their electro-optic response has been the primary area of focus on these systems due to potential applications in display technology. Surface-stabilised ferroelectric liquid crystals (SSFLCs), which are anchored between the planar surfaces of a liquid crystal cell, exhibit a macroscopic polarisation and have the capacity to switch states on the microsecond timescale,8,9 much faster than the more common displays based on the twisted nematic phase. SSFLCs may also exhibit a bi- or tri-stable mode of operation,7,8,10 offering improved matrix addressing performance, favourable memory effects and the ability to display image content at high frame rates.11–13 As a result of the fast switching speed, FLCs have found potential use in field sequential colour display technology, employing LED backlights, which enable a wider colour gamut as well as lower operational power costs.14–16 Today, FLCs can be found operating in reflective microdisplays based on liquid crystal on silicon technology,17,18 but difficulties associated with the performance and manufacture of ferroelectric flat-panel displays have been a barrier to their more widespread use.
In typical smectic C* materials, an observable molecular tilt (θ) presents at the SmA*–SmC* phase transition, resulting in an associated contraction of the smectic layers on the order of cos(θ).19 In SSFLCs, this reduction in layer spacing commonly causes buckling of the layers, and results in chevron structures that degrade the optical quality of SSFLC-based devices.20,21 The chevron geometry decreases the effective switching angle and produces image irregularities termed zig-zag defects at the boundary between regions with opposite fold directions.20,22 The formation of these defects has represented a significant barrier to the development and widespread use of FLCs in technology.
However, several materials have been reported in which layer contraction at the SmA*–SmC* transition is significantly less than expected,22–27 providing a potential route to overcome many of the problems associated with FLC-based displays. This anomalous reduction of the layer shrinkage came to be known as de Vries behaviour, after the American crystallographer Adriaan de Vries proposed one of the first models to account for the effect.28 Following significant additional work, further models have been proposed based on experimental results,29–31 but no general theoretical model currently exists that can fully rationalise de Vries behaviour.
Several structural moieties have been shown to promote de Vries behaviour, with semi-perfluorinated,24,25,27,32 polysiloxane26,33–35 and polysilane36–40 terminal chains occurring as common structural features in these materials. The immiscibility between chemically different sub-units is commonly reported to result in the nanosegregation of distinct domains, having a crucial effect on the self-organisation of the smectic layers.39,40 Chiral lactate derivatives have also attracted considerable attention as a result of their large optical activity and good thermal stability, as well as the broad variety of liquid crystal phases they are reported to exhibit.41 Many studies have investigated the structural features of lactate derivatives, and assessed the impact of various aromatic cores and lactic acid ester units on the mesomorphic properties of potential de Vries materials.42–47
The seemingly incompatible onset of optical tilt with little or no layer shrinkage has led to a wide range of experimental techniques being employed in their study. This anomalous behaviour has led to the orientational order of molecules within mesophases being a significant area of research into these systems; X-ray diffraction, Raman scattering, infrared dichroism, NMR and birefringence measurements have all been used to quantify molecular orientation across the SmA*–SmC* transition, but results tend not to be fully conclusive.48–50 This difficulty in fully reconciling results of these experiments may partially be attributed to the inherent limitations of the methods in terms of the number of expansion coefficients of the orientational distribution function that can be obtained, and from the specific molecular feature that is being measured, for example birefringence or Raman scattering measurements may yield information on the orientational order of the aromatic core of a mesogen, but may be unable to probe the end-groups, whereas X-ray scattering may give information about the overall orientational order, but may be unable to provide information as to how this relates to orientational order of particular molecular sub-units.
Such differences in experimental techniques inevitably give rise to differences in resultant orientational order parameters, meaning that results may not necessarily be expected to be consistent between studies and therefore generating complexity when comparisons are made. Furthermore, severe approximations are often be applied in the interpretation of the data, typically of low, often cylindrical, molecular symmetry as well as of certain dominant molecular associations.48 Of the methods employed, X-ray scattering stands out due to its theoretical ability to provide the full orientational distribution function, but interpretation is significantly complicated not only by inevitable approximations of molecular symmetry, but also by significant difficulties in the processing of data after collection.48,51,52 Nevertheless, a large body of data on these systems has been obtained, and strong trends in behaviour have been highlighted that have given rise to the range of models that have been proposed to rationalise de Vries behaviour.
Although many investigations have attempted to explain de Vries behaviour, the molecular origin of supramolecular effects are often difficult to unambiguously interpret. As a result, the molecular explanation behind the reduction in layer contraction at the SmA*–SmC* transition is still an active area of scientific debate. While several theoretical models have been asserted, perhaps the most prevalent is the random diffuse cone model proposed by Adriaan de Vries.28,29 In this model, molecules are tilted in both the SmC* and the SmA* phase, with uncorrelated azimuthal tilt directions giving rise to the uniaxial SmA* phase and correlated azimuthal tilt angles in the SmC* phase. The uncorrelated tilt directions may be explained in one of two ways: molecular tilt directions may be uncoupled in adjacent layers but consistent within the same layer, or the molecular tilt may be totally uncorrelated within each smectic layer. A recent variation of this model is the clustered diffuse cone model, based on the observation of increased orientational order exhibited by molecules in the SmA* phase when subject to a strong magnetic field.53 In this model molecules are thought to form small clusters in which the azimuthal tilt angles are correlated, however there is no correlation in the tilt angles between clusters.54
An alternative model, referred to as the conformational change model,31,53 proposes that the layer contraction caused by the tilted molecules is offset by a conformational change. The molecular length must increase at the SmA*–SmC* transition, which is often stated to be due to an extension of the terminal chains in the SmC* phase.
Another model, referred to as the interdigitation model,26,55,56 is often applied to nano-segregated systems such as polysiloxane and polysilane-based materials. In this model molecules are not assumed to be tilted in the SmA* phase, but the terminal chains are thought to be interdigitated, which results in a low orientational order. The order is thought to increase in the SmC* phase, and layer contraction is compensated as molecules become tilted but the degree of interdigitation is reduced.
Although these separate models have been proposed to account for de Vries behaviour, all theoretical models are based on idealised cases, and the realistic explanation behind anomalous layer contraction can be reasonably expected to include aspects of more than one scenario.19
Simulation methods have become popular within the field of liquid crystal research, and used in combination with experimental techniques they have the capacity to elucidate behaviour not easily accessible from experimental observations alone. Atomistic simulations of liquid crystal phases have the potential to identify the underlying causes of complex mesophase behaviour, which can be influenced by subtle interactions at the molecular and sub-molecular level. Molecular dynamics (MD) studies of thermotropic liquid crystals have aimed to replicate the experimental observables associated with the nematic phase, such as phase transition temperatures, densities, conformational dynamics and molecular associations.57–59 This provided the basis for more advanced simulation techniques such as the prediction of EPR spectra,60 simulation of guest–host systems,61 and investigation of the twist-bend nematic phase.62 Simulations of smectic phases are not as prevalent due to the difficulties associated with modelling long-range translational order. Early simulations of smectic phases were limited by the computational feasibility of modelling relatively large systems over long timescales, and hence atomistic studies could provide only limited information on the structure and dynamics of layered phases.63–66 As CPU speeds have increased and as GPU use and efficient parallelisation methods have become more prominent, the atomistic simulation of smectic phases has become much more feasible, enabling studies in the range of a few thousand molecules that provide an insight into the molecular origin of translational order. Recent simulation studies of translationally ordered phases have replicated experimental observables in a variety of systems,67–71 investigated how molecules pack within the smectic layer structure,72,73 and investigated the influence of structural elements on the liquid crystal phase structure.74
The drive to accurately reproduce experimental observables, such as transition temperatures, densities, orientational and translational order parameters, has increased the requirement for more accurate force fields. As a result, many studies have focused on the parameterisation and verification of force fields, with the application of both experimental and theoretical approaches.75–77 Although many force fields aim to be able to predict experimental properties for a range of compounds, force fields that have been parameterised for accurate prediction of a specific family of molecules often lack the ability to perform well when applied to a different series of compounds. As a result, while general force fields are known to give less accurate predictions of absolute experimental values, they may be used to model experimental trends in a broader range of compounds and provide a means to assess phase structure under simulated conditions. The General Amber Force Field (GAFF),78 with further parameterisation specifically for liquid crystal simulations, has provided a molecular description that has successfully modelled the phase behaviour of a range of mesogens.79,80
Whilst molecular modelling techniques have been applied to a broad range of liquid crystal systems, de Vries behaviour has not been intensively studied through simulation with the current exception of one coarse-grain study,81 perhaps due to the difficulties associated with the simulation of large translationally ordered systems. Nevertheless, the investigation of de Vries behaviour could benefit significantly from atomistic simulations of such phases enabling the anomalous reduction in layer contraction to be probed at a molecular level, which is extremely difficult to accomplish with many experimental techniques.
The aim of this work was to investigate the molecular and phase structure giving rise to de Vries behaviour through the application of fully atomistic MD simulations. As outlined above, many models exist that attempt to account for weak layer contraction at the SmA*–SmC* transition, and while experimental studies have provided clues to the mechanism behind such behaviour, the main contributions on a molecular and sub-molecular level remain somewhat uncertain. Of the general classes of molecule exhibiting the behaviour, lactate derivatives provide a suitable simulation target due to their significant de Vries character and lack of relatively unusual structural units such as perfluorinated chains, siloxane units, or silane units that are not generally well parameterised in molecular force fields. The central focus of this investigation was thus the chiral-lactate derivative 9HL (shown in Fig. 1), which has been the subject of a significant number of studies and is reported to exhibit minimal layer contraction at the SmA*–SmC* transition.53,82
 | ||
| Fig. 1 The chemical structure of the compound 9HL (Cr 41.0 °C SmC* 67.2 °C SmA* 134.6 °C I).82 | ||
Methods
All simulations in this study were performed at a fully atomistic level and were performed within GROMACS 5.1.2,83–88 employing the General Amber Force Field78 with modified parameters suitable for liquid crystal simulation.79 Four conformations of 9HL were optimised at the B3LYP/6-31G(d)89,90 level within the Gaussian 09 software package91 to establish the lowest energy conformation, and atomic charges were calculated from the lowest energy geometry using the RESP method.92 Conformations and energies are provided in the ESI.† Initial topologies for MD simulations were generated using the Antechamber software93 within the Amber18 software package,94 before they were converted into GROMACS readable format using Acpype.95MD simulations were performed with 2 fs time steps, periodic boundary conditions, and all bonds were constrained at their equilibrium bond lengths using the LINCS algorithm.96 Short range van der Waals interactions were truncated after 1.2 nm, and long-range electrostatic interactions were calculated thorough the particle mesh Ewald method,97 also with a 1.2 nm cut-off. Initial configurations were prepared with the construction of a gas-phase lattice of 16 molecules with random head–tail molecular orientations. Each system was gradually compressed with the Berendsen isothermal–isobaric algorithm,98 enabling all orientational order to be lost before a liquid-phase density was obtained, providing an unbiased initial structure for the phases simulated thereafter. In subsequent simulations temperature was controlled via a Nosé–Hoover thermostat,99,100 while a pressure of 1 bar was maintained with an anisotropic Parrinello–Rahman barostat,101 enabling the relative dimensions of the periodic box to vary throughout the simulation. For each temperature, the system was equilibrated for 500–800 ns before being scaled up to 128 molecules via two-fold replication of the simulation box in each dimension. The equilibration and replication was then repeated with the 128-molecule configurations, resulting in 1024-molecule configurations from which the full simulations reported in the results section were undertaken. Simulations were performed until the phase structure, characterised via the calculation of orientational and translational order parameters, appeared equilibrated. This corresponded to a minimum simulation time of 500 ns and a maximum simulation time of 800 ns in the 1024-molecule configurations. Equilibration times, average values and their associated errors were determined using the method described by Chodera.102
The second-rank orientation order parameter, P2, and the director, n, at each trajectory frame of each simulation was calculated in a consistent way to previous studies.57–59 The axes from which these order parameters were calculated are defined in the main text. Translational order parameters, τ, were calculated using the method described in detail in previous studies.59,74
The simulation layer normal, k, calculated at each trajectory frame, was obtained by determination of a local layer normal for each molecular reference position, i, followed by diagonalisation of the associated ordering tensor, again as reported previously.103,104 The layer spacing, d, was defined as the distance corresponding to the maximum density fluctuation of the molecular reference positions along the calculated layer normal. The carbon atom on the central aromatic ring, closest to the 9-carbon aliphatic chain was defined as the position of the molecular centre of 9HL.
Coordinate files and MD trajectories were visualised with VMD v1.9.3.105
Results and discussion
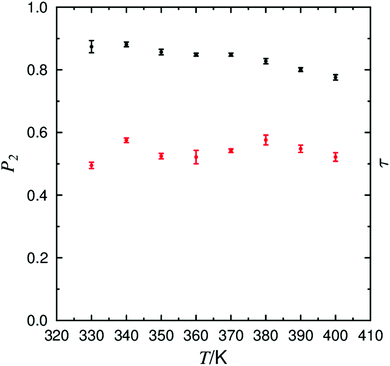
Fully atomistic MD simulations were performed on systems of pure 9HL at 10 K intervals between 330 K and 400 K. Simulation temperatures correspond to the experimentally reported SmA* and SmC* phase ranges, providing data points either side of the range of experimentally reported SmA to SmC transition temperatures (TA–C) of 337–347 K.82,106,107The presence of orientational order is a primary indicator of mesophase formation in MD simulations, and this was confirmed at all simulated temperatures. This is evident from the calculated P2 values plotted in Fig. 2, showing a general decrease in the orientational order as the temperature is increased. P2 values of ca. 0.85 are consistent with values of 0.8–0.85 reported for 9HL determined from experimental polarized Raman scattering and birefringence measurements, and only slightly higher than values of ca. 0.75 reported from 2H NMR spectra.53,106 The P2 values are significantly higher than the values of ca. 0.6 derived from X-ray scattering experiments, but these values are reported to be underestimated due to the influence of small molecular associations which have varying orientations within the phase.48 In this study, the principle molecular axis of 9HL was defined as that calculated from the minimum moment of inertia (MOI).
Experimentally, the relatively consistent P2 values in the SmA* and SmC* phases indicate that the expected reduction in layer thickness arising from the onset of molecular tilt is not sufficiently compensated by an increase in orientational order upon transition to the SmC phase, as has been reported for several other compounds.49,108–111 The P2 values in Fig. 2 are consistent with the experimental observations of 9HL, showing consistent orientational order across the temperature range incorporating the experimental SmA*–SmC* transition.
Fig. 3 shows snapshots of the simulations carried out at 340 K and 380 K, clearly showing that the orientational order is accompanied by the formation of layers at both temperatures, and indicating that the molecules are tilted relative to the layer normal at 340 K. This observation indicates that a calculated SmA–SmC transition also lies within this temperature range.
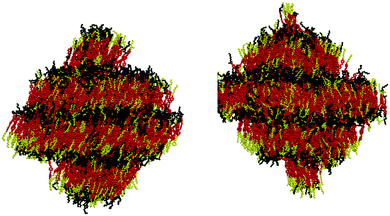 | ||
| Fig. 3 VMD visualisation of the layer structure of 9HL, showing the achiral aliphatic chain (yellow), aromatic core (red), and lactate chain (black), at 340 K (left) and 380 K (right), respectively. | ||
The degree of translational order within smectic phases is often characterised in terms of an additional order parameter, τ, which is dependent on the density fluctuations of the molecular positions along the layer normal.112 Values of τ may vary between 0 when there is no layering within the system, and 1 in a system with perfect layer structure.
The calculated τ values are also shown in Fig. 2, and average values of ca. 0.5–0.6 denote the formation of defined layer structures for all simulated temperatures, consistent with the snapshots shown in Fig. 3. These values are considerably lower than those derived from an X-ray scattering investigation of 9HL, in which τ has been determined to be 0.5 at TI–A rising to 0.8 at TA–C.48 Discrepancies between τ values determined by computational and experimental techniques may be the result of the methodology used to extract the translational order parameter from X-ray data, which has been reported to give higher τ values relative to the results from simulation in previous investigations.59,74 The high degree of translational order exhibited by 9HL experimentally is fairly typical of de Vries materials, in which the separation of chemical domains is often reported to be the primary driver of mesophase formation, consistent with the direct transition from the isotropic to SmA phase in materials which display de Vries behaviour.113 Although the general discrepancies between experimental and calculated translational order parameters prevent a direct quantitative comparison, the values calculated in this work for 9HL are significantly higher than those of ca. 0.15–0.2 calculated from comparable simulations of more conventional SmA phases formed by cyanobiphenyl mesogens.59,74,114
The characterisation of smectic mesophases depends on the type and degree of translational order they exhibit, and the transition between the SmA and SmC phase can be described as a tilt transition as the director tilts with respect to the layer normal. The tilt angles calculated from the simulations are shown in Fig. 4, demonstrating a decrease in tilt angle with increasing temperature. The most significant change in tilt angle occurs between 350 K and 360 K suggesting a simulated SmA*–SmC* transition between these two temperatures, relatively close to the reported experimental value of 340 K. The calculated tilt angle of ca. 18° in the simulated SmC* phase is similar to the experimentally derived spontaneous tilt of 15–20°,22,115 and considerably smaller than the 30° tilt measured from NMR spectroscopy.106
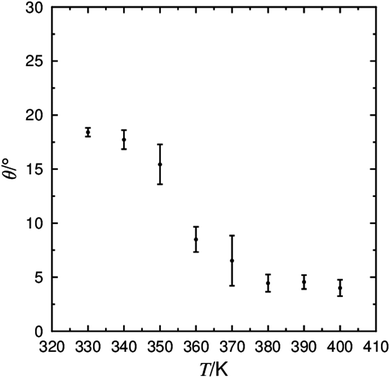 | ||
| Fig. 4 The average tilt angle between the layer normal (k) and the director (n) determined from simulations between 330 K and 400 K. | ||
The low, but non-zero molecular tilt calculated in the simulated SmA phase may go some way to explain the electroclinic effect observed in dielectric investigations of 9HL in the SmA* phase,22 and is consistent with the non-zero molecular tilt measured in the SmA* phase from 2H NMR measurements.106 The presence of a non-zero molecular tilt in the SmA phase has been proposed with the ‘diffuse cone’ model, in which the random nature of the molecular tilt results in a uniaxial SmA phase in a bulk material, but may result in a measureable tilt in the necessarily small SmA phase simulated here. Equally, a non-zero tilt angle in the SmA phase may be entirely an artefact of the necessarily small simulation size relative to the dimensions of a bulk experimental sample; in a bulk sample slight ripples in the layer structure of a SmA phase may be expected to average out over the sample, but in a small system such as the simulations reported here, such ripples would manifest themselves as an overall tilt angle.
The behaviour of the layer spacing at TA–C is the primary indicator of de Vries behaviour in smectic mesophases. The calculated layer spacing from the 9HL simulations are shown in Fig. 5, showing a general increase in layer spacing with increasing temperature from ca. 4.05 nm at 330 K to ca. 4.25 nm at 370 K, falling within the reported experimental range of layer spacings of between 3.9 nm115 and 4.3 nm.22 The layer shrinkage, commonly used as a benchmark for de Vries materials, can be somewhat ambiguous depending on the temperature at which the SmC layer spacing is defined, but the layer spacings determined from the simulations below the apparent calculated SmA–SmC transition are all <3% smaller than the layer spacing at the calculated transition, determined from the average of the layer spacings in the 350 K and 360 K simulations.
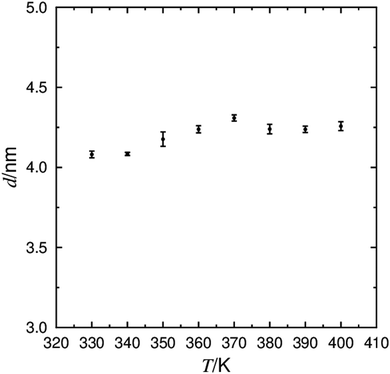 | ||
| Fig. 5 The average layer spacing defined by the C6 atom determined from simulations of 9HL between 330 K and 400 K, with associated error bars. | ||
Further to simply quoting a percentage shrinkage to quantify de Vries behaviour, it is also useful to quantify the reduction in layer shrinkage with respect to the molecular tilt. This may be done by calculating a reduction factor, R, corresponding to the ratio of the theoretical tilt angle, given by the decrease layer spacing in the SmC relative to that at the SmA–SmC transition, to the measured tilt angle. This factor approaches 0 as a liquid crystal phase becomes more ‘de Vries-like’, and approaches 1 when the shrinkage is consistent with the rigid rod model. The variation in reported experimental layer spacings and tilt angles means that absolute experimental R factors for 9HL have significant uncertainty associated with them, but they are generally less than 1 (see ESI†), indicating some de Vries character. The R values of 0.76, 0.78 and 0.45 determined from the simulations at 330 K, 340 K and 350 K, respectively, also indicate that the simulations exhibit de Vries character. Even after correcting for the non-zero tilt in the simulated SmA phase, R values from these simulations are still calculated to be below 1.
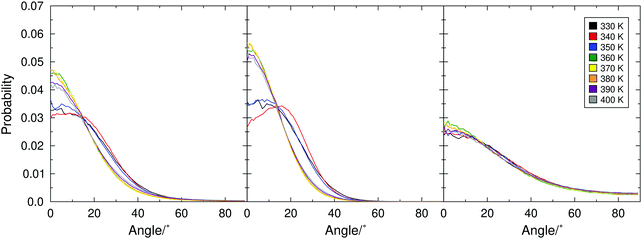
To further characterise the molecular tilt in the simulated phases, the histograms shown in Fig. 6 were generated from the angles between the layer normals and the directors, each calculated for the entire simulation box at each trajectory step of each simulation. These histograms show a clear shift between 350 K and 360 K that further supports the presence of a simulated SmA*–SmC* phase transition between these temperatures. The slight molecular tilt at temperatures above TA–C is also evident here, as discussed above. Whether or not the tilt angle in the simulations above 350 K is a simulation artefact or a real feature of the system, the combined data in Fig. 4–6 clearly demonstrate a phase transition from a significantly tilted phase at temperatures of ≤350 K to a phase exhibiting little tilt at ≥360 K. Furthermore, the reduction in layer spacing at this transition is less than would be expected from the calculated molecular tilt alone, i.e. the simulations clearly exhibit de Vries character.
The subsequent analyses are presented in sections that focus on different reported models explaining de Vries behaviour, assessing their consistency with the simulation results.
Diffuse cone model
The diffuse cone model suggests that molecules exhibit a non-zero tilt angle, with respect to k, even in the SmA phase.28,29 This distribution of the molecular tilt directions is described as a broad, diffuse cone around the layer normal, which may take a ‘volcano-like’ or a broad ‘sugarloaf’ shape. Such a distribution may not be detectable from second-rank order parameters alone such as those presented in Fig. 2, but they can be revealed by the orientational distribution of molecules in a system. Orientational distribution functions of the minimum MOI axes of the 9HL molecules are shown in Fig. 7, showing broad distribution functions with non-zero maxima in the simulated SmC phase (≤350 K), but showing distribution functions clearly centered at 0° in the simulated SmA phase (≥360).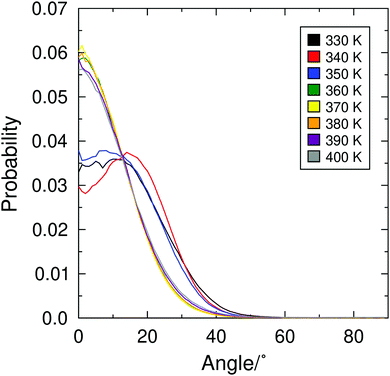 | ||
| Fig. 7 Orientational distribution functions (ODFs) of the minimum MOI vectors of the molecules vs.k, determined from simulations of 9HL at 10 K intervals between 330 K and 400 K. | ||
The fourth-rank orientational order parameters, P4, would be expected to be very small or negative for a SmA phase exhibiting “true” diffuse-cone behaviour.116P4 values associated with the distribution functions in Fig. 7 are given in Table S1 in the ESI,† and are generally in the range 0.4–0.6, consistent with experimental values determined from Raman scattering experiments.48 Even without the additional characterisation of the shape of the distribution functions, it is clear that there is a significant change in the distribution functions across the simulated transition temperature, which itself is inconsistent with the diffuse cone model in which the phase transition is characterised by azimuthal ordering alone.
The ODFs as well as visual inspection of the phase structure of 9HL (such as shown in Fig. 3) indicate an apparently conventional SmA phase that appears to be inconsistent with the diffuse cone model.
Conformational change model
The conformational change model proposes that the layer shrinkage caused by the tilt of the mesogen is offset by a simultaneous increase of the molecular length. The distribution of calculated molecular lengths, defined as the length of the vector between the terminal CH3 carbon atoms on the C9 aliphatic chain and the C6 lactate chain, at the different simulation temperatures are shown in Fig. 8, along with the average molecular length at each temperature, showing an overall increase in molecular length on cooling. This data indicates that any layer shrinkage on cooling due to molecular tilt is, to some degree, likely to be offset by an increase in the molecular length. Analysis of the simulations at 350 K and 360 K, either side of the simulated SmA–SmC transition, shows a reduction in layer spacing of 0.62 Å on cooling. Taking into account the calculated molecular tilt angles at these temperatures, the molecular length would have to exhibit a corresponding increase of 0.48 Å if this was the only factor offsetting the layer shrinkage. The average calculated increase in molecular length between 360 K and 350 K is 0.23 Å, indicating that whilst molecular elongation may contribute to the de Vries behaviour of 9HL, it is unlikely to be the only contributing factor.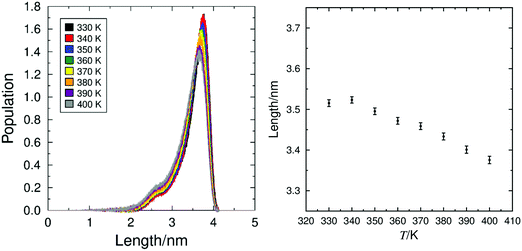 | ||
| Fig. 8 Distribution of molecular lengths of 9HL (left) and mean molecular lengths plotted against temperature (right), determined from simulations of 9HL at 10 K intervals between 330 K and 400 K. | ||
The presence of any specific major conformational changes of 9HL across the SmA*–SmC* transition was also investigated by analysing all of the dihedral angles other than those involving hydrogen atoms or those only involving atoms within, or directly substituted to, an aromatic ring. Plots of the populations of these angles are shown in Fig. S3 in the ESI,† demonstrating that there are no major changes, but subtle differences are observed that may be attributable to the temperature difference, consistent with the gradual elongation shown in Fig. 8.
Interdigitation model
The extent to which molecules overlap within and between layers has been proposed to offset layer shrinkage arising from molecular tilt in the interdigitation model of de Vries behaviour. Fig. 9 shows the percentage interdigitation of the two ends of the 9HL molecules, defined as the CH3 carbon atoms on the C9 aliphatic chain and on the C6 lactate chain. These values were determined in accordance with previous work, where an atom is considered interdigitated if it lies beyond the overall layer position defined by all molecules within a layer.74 A degree of interdigitation of 100% would indicate all atoms in oppositely orientated molecules overlap, whereas a value of 0% would indicate that there is no overlap between the atoms in oppositely orientated molecules.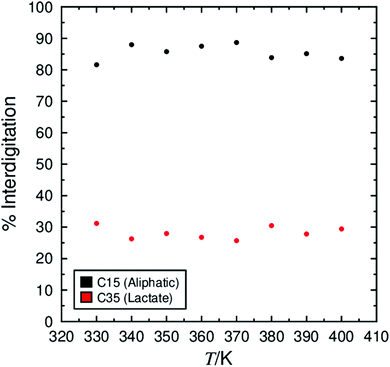 | ||
| Fig. 9 Degree of interdigitation of the lactate end-groups and aliphatic end-groups calculated over 50 ns windows. | ||
The degree of interdigitation of the aliphatic chains is shown to be consistently ca. 85% across the simulated temperature ranges. This high value indicates that most of the aliphatic chains in oppositely oriented molecules within the layer structure overlap with one another. In contrast, the values determined for the lactate chains are much lower at ca. 25%, indicating that only around a quarter of the lactate chains overlap with the equivalent groups in oppositely oriented molecules, but again the values are relatively consistent across the temperatures studied.
If molecular interdigitation was offsetting layer shrinkage arising from molecular tilt, a general decrease in interdigitation would be expected with decreasing temperature (increasing molecular tilt), which is not evident in Fig. 9. Furthermore, a sharp decrease would be anticipated between 350 K and 360 K where the tilt angle, θ, and cos(θ) are calculated to change the most. This decrease is also not evident in Fig. 9, indicating that in these simulations changes in molecular interdigitation are small, and are not calculated to have a significant effect on the layer spacing or de Vries characteristics of the simulated systems.
Sub-unit behaviour
The established models discussed in the previous sub-sections do not, in isolation, satisfactorily explain the simulated de Vries behaviour of 9HL. In view of the clear aromatic and lactate sublayers evident in Fig. 3, along with the very different nature of the sublayers highlighted by the degrees of interdigitation in the previous section, further analysis was performed on the different groups within 9HL to provide a more detailed picture of the simulated phases. A number of experimental studies report that tilt angle is not typically uniform across the whole molecule in de Vries materials, as some molecular sub-units may exhibit different tilt behaviour at the SmA*–SmC* transition.31,117 The ODFs of the minimum MOI axes of the atoms comprising the aliphatic chain, the aromatic core, and the lactate chain are shown in Fig. 10 and their respective order parameters are listed in Table 1, enabling a comparison of the tilt behaviour of the different molecular sub-units across the simulated temperature range.The ODFs clearly show that whole molecules do not tilt universally in the SmC phase, and that different molecular sub-units exhibit very different distribution functions. In the SmC phase (330–350 K) the aromatic groups exhibit a ‘volcano-like’ distribution function, the aliphatic chains exhibit more of a ‘sugarloaf-like’ distribution, and the lactate groups show a broad SmA-like distribution function, which is essentially indistinguishable to the distribution functions exhibited in the simulated SmA phase. In addition, the lactate groups are calculated to be significantly less orientationally ordered with respect to k, than the aromatic and aliphatic groups at all temperatures. The lactate unit comprises a significant percentage of the molecular length of 9HL, meaning that a significant portion of the molecule is calculated to remain non-tilted with respect to the layer normal, k, even in the SmC phase.
| T/K | Aliphatic | Aromatic | Lactate | |||
|---|---|---|---|---|---|---|
| P 2 | +/− | P 2 | +/− | P 2 | +/− | |
| 330 | 0.625 | 0.002 | 0.728 | 0.002 | 0.295 | 0.004 |
| 340 | 0.651 | 0.004 | 0.733 | 0.002 | 0.284 | 0.004 |
| 350 | 0.638 | 0.006 | 0.778 | 0.002 | 0.285 | 0.005 |
| 360 | 0.699 | 0.006 | 0.818 | 0.002 | 0.287 | 0.006 |
| 370 | 0.691 | 0.005 | 0.799 | 0.002 | 0.276 | 0.003 |
| 380 | 0.659 | 0.006 | 0.805 | 0.002 | 0.269 | 0.003 |
| 390 | 0.633 | 0.004 | 0.776 | 0.004 | 0.305 | 0.002 |
| 400 | 0.606 | 0.013 | 0.756 | 0.015 | 0.291 | 0.003 |
This contrasting behaviour in the relative tilts of the different sections of the 9HL molecules provides a potentially straightforward explanation for the de Vries-like behaviour: if the ODF of part of the molecule does not change significantly at the SmA–SmC transition then the overall layer will not shrink as much as a rigid-rod model would suggest. We note that such an explanation of de Vries behaviour has been investigated previously in the study of a perfluoroether terminated molecule,27 but in this case the model was considered to not satisfactorily explain the behaviour. The orientational behaviour of individual molecular sub-units have also previously been reported in siloxane-terminated mesogens, in which siloxane sub-units are less orientationally ordered and exhibit a significantly smaller tilt than the rest of the molecule.118,119 In addition, the orientational order of individual sub-units has previously been considered in the case of 9HL, but it was determined that their contribution to de Vries behaviour could not be clearly defined.48
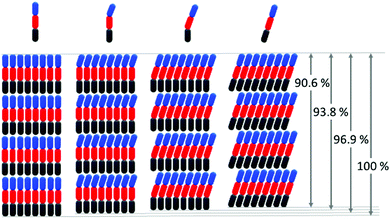
The general effect of partial molecular tilt on the layer spacing of a smectic material is shown schematically in Fig. 11, demonstrating that if just ⅓ or ⅔ of a molecule is tilted in the SmC phase, the overall layer thickness reduces by just 3.1% (R = 0.57) or 6.2% (R = 0.81), respectively, relative to the SmA phase as opposed to a 9.4% reduction if the whole molecule tilts by the same angle. More generally in this simplified picture, for a given tilt angle the overall layer shrinkage is simply proportional to the fraction of the overall molecular length that tilts.
A broader interpretation of this model is illustrated in Fig. 12, which shows the percentage layer shrinkage as a function of the fraction of the molecular length that tilts, and as a function of the tilt angle. This plot highlights that typical definitions of de-Vries character may be satisfied via either a large fraction of the molecular length tilting by a small angle, or by a smaller part of the molecular length tilting by a larger angle.
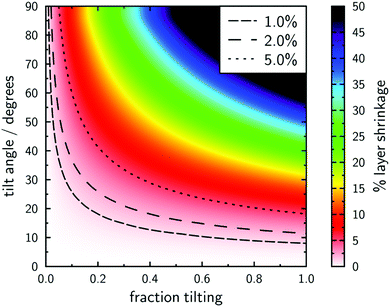 | ||
| Fig. 12 Plot of % layer shrinkage against the fraction of the molecule tilting and the tilt angle. Contours are shown for different reported definitions of materials with “de Vries” character.106,120,121 | ||
Conclusions
Fully atomistic MD simulations of 9HL were shown to closely reproduce a range of experimental trends such as orientational and translational order parameters, layer spacing, and tilt angle over a wide temperature range. Analysis of the simulations indicated that the nature of the layer contraction in the simulated phases of 9HL was not fully consistent with many of the conventional models applied to liquid crystal systems exhibiting de Vries character. The change in molecular conformation with temperature to a more elongated structure at lower temperatures enabled partial rationalisation of the small layer shrinkage but was not calculated to be sufficient as the only contributing factor.Investigation of molecular sub-units provided a more detailed insight into the structures of the simulated phases of 9HL. Orientational distribution functions of the sub-units indicated that molecules do not exhibit a uniform tilt across the whole molecule. Aromatic cores and aliphatic units display fairly ‘typical’ behaviour, with a significant change in the distribution function to a broad ‘sugarloaf-like’ or ‘volcano-like’ distribution upon transition to the SmC* phase. In contrast, the tilt distribution of the lactate units was not calculated to vary significantly between the SmA* and SmC* phases, exhibiting a broad distribution centred at zero tilt angle across all simulated temperatures.
Tilt angles in SmC phases are typically determined by methods that probe just part of a molecule, such as vibrational spectroscopy, NMR spectroscopy, or by birefringence measurements that rely on the anisotropy of the polarisability along a conjugated region of a molecule. These angles are therefore usually dependent only on the angle that the aromatic core of a mesogen makes with the director, so the partial-tilt behaviour described in this work enables a simple interpretation as to why layer shrinkage at the SmA–SmC transition may not appear consistent with a measured tilt angle.
Furthermore, the differences in the simulated order parameters of the aromatic and lactate groups in the SmA* phase enables reported discrepancies between orientational order parameters of 9HL to be rationalised. Reported values obtained from X-ray scattering are significantly lower than those obtained from Raman scattering experiments,48 consistent with the lower calculated order parameter of the lactate chains that contribute to the X-ray scattering pattern but not to the Raman scattering.
In some regards the de Vries behaviour of 9HL may be considered an anomaly due to its lack of chemically incompatible units, which are often considered important for mesogens to exhibit de Vries behaviour.122–124 However, despite the apparent lack of chemical incompatibility, the simulations of 9HL clearly show very distinct lactate-dominated sub-layers and aromatic-dominated sublayers, as well as exhibiting a high translational order parameter. This behaviour is consistent with the well-defined layers reported to be exhibited by perfluoroalkane and siloxane-containing mesogens, but in the case of 9HL the behaviour may be a geometric effect rather than purely a chemical effect.74
This study of 9HL also demonstrates further similarities with siloxane-containing mesogens, for which siloxane and hydrocarbon sub-units have been shown to exhibit different orientational order parameters in cases where X-ray scattering has enabled resolution of peaks arising from the different sub-units.118,119 It has also been reported the orientational order of siloxane sub-units does not necessarily show any change across the SmA/SmC transition,118 again consistent with the behaviour of the lactate chains exhibited in these simulations of 9HL. Given these similarities, it may be that the model described here may be applicable to a greater or lesser extent to other materials that exhibit de Vries behaviour.
We believe that this study is the first time that de Vries character has been simulated at an atomistic level, and the analysis presented here illustrates the value of such simulations in elucidating the complex molecular-level and sub-molecular-level contributions to the phase behaviour. It is generally accepted that de Vries behaviour arises due to multiple factors, and it seems likely that further similar simulations will aid in the understanding of these materials, and ultimately help in the design of improved materials in future.
Conflicts of interest
There are no conflicts to declare.Acknowledgements
The authors thank Northumbria University for the award of a PhD studentship to KP.References
- I. W. Hamley, Introduction to Soft Matter – Revised Edition. Introduction to Soft Matter: Synthetic and Biological Self-Assembling Materials, John Wiley & Sons, Ltd, Chichester, 2007 Search PubMed.
- P. J. Collings and M. Hird, Introduction To Liquid Crystals – Chemistry and Physics, Taylor & Francis Ltd, London, 2009 Search PubMed.
- D. Andrienko, J. Mol. Liq., 2018, 267, 520–541 CrossRef CAS.
- T. Kajitani, H. Masu, S. Kohmoto, M. Yamamoto, K. Yamaguchi and K. Kishikawa, J. Am. Chem. Soc., 2005, 127, 1124–1125 CrossRef CAS.
- M. P. Thompson and R. P. Lemieux, J. Mater. Chem., 2007, 17, 5068–5076 RSC.
- R. B. Meyer, Mol. Cryst. Liq. Cryst., 1977, 40, 33–48 CrossRef CAS.
- S. T. Lagerwall, N. A. Clark, J. Dijon and J. F. Clerc, Ferroelectrics, 1989, 94, 3–62 CrossRef CAS.
- N. A. Clark and S. T. Lagerwall, Appl. Phys. Lett., 1980, 36, 899 CrossRef CAS.
- S. T. Lagerwall, Ferroelectrics, 1984, 59, 25–67 CrossRef.
- A. D. L. Chandani, T. Hagiwara, Y. I. Suzuki, H. Ouchi, H. Takezoe and A. Fukuda, Jpn. J. Appl. Phys., 1988, 27, L729–L732 CrossRef CAS.
- J. R. Hughes, F. C. Saunders, M. J. Towler, P. J. Ayliffe, M. J. Birch, W. A. Crossland, P. W. Ross, P. W. H. Surguy, M. F. Bone and I. Coulson, Ferroelectrics, 1991, 122, 63–79 CrossRef.
- J. C. Jones, M. J. Towler and J. R. Hughes, Displays, 1993, 14, 86–93 CrossRef CAS.
- W. J. A. M. Hartmann, Ferroelectrics, 1991, 122, 1–26 CrossRef CAS.
- T. Takahashi, H. Furue, M. Shikada, N. Matsuda, T. Miyama and S. Kobayashi, Jpn. J. Appl. Phys., 1999, 38, 534–536 CrossRef.
- J. Bergquist and C. Wennstam, SID Symp. Dig. Tech. Pap., 2006, 37, 1594–1597 CrossRef.
- K. Toyooka, T. Miyashita and T. Uchida, SID Symp. Dig. Tech. Pap., 2001, 32, 174–177 CrossRef.
- D. Vettese, Nat. Photonics, 2010, 4, 752–754 CrossRef CAS.
- Z. Zhang, Z. You and D. Chu, Light: Sci. Appl., 2014, 3, 1–10 Search PubMed.
- J. P. F. Lagerwall and F. Giesselmann, ChemPhysChem, 2006, 7, 20–45 CrossRef CAS.
- T. P. Rieker, N. A. Clark, G. S. Smith, D. S. Parmar, E. B. Sirota and C. R. Safinya, Phys. Rev. Lett., 1987, 59, 2658–2661 CrossRef CAS.
- N. A. Clark and T. P. Rieker, Phys. Rev. A: At., Mol., Opt. Phys., 1988, 37, 1053–1056 CrossRef.
- F. Giesselmann, P. Zugenmaier, I. Dierking, S. T. Lagerwall, B. Stebler, M. Kaš, V. Hamplová and M. Glogarová, Phys. Rev. E: Stat. Phys., Plasmas, Fluids, Relat. Interdiscip. Top., 1999, 60, 598–602 CrossRef CAS.
- Y. Takanishi, Y. Ouchi, H. Takezoe, A. Fukuda, A. Mochizuki and M. Nakatsuka, Jpn. J. Appl. Phys., 1990, 29, L984–L986 CrossRef CAS.
- J. P. F. Lagerwall, F. Giesselmann and M. D. Radcliffe, Phys. Rev. E: Stat., Nonlinear, Soft Matter Phys., 2002, 66, 031703 CrossRef.
- J. P. F. Lagerwall, A. Saipa, F. Giesselmann and R. Dabrowski, Liq. Cryst., 2004, 31, 1175–1184 CrossRef CAS.
- M. S. Spector, P. A. Heiney, J. Naciri, B. T. Weslowski, D. B. Holt and R. Shashidhar, Phys. Rev. E: Stat. Phys., Plasmas, Fluids, Relat. Interdiscip. Top., 2000, 61, 1579–1584 CrossRef CAS.
- M. D. Radcliffe, M. L. Brostrom, K. A. Epstein, A. G. Rappaport, B. N. Thomas, R. Shao and N. A. Clark, Liq. Cryst., 1999, 26, 789–794 CrossRef CAS.
- A. D. Vries, Mol. Cryst. Liq. Cryst., 1977, 41, 27–31 CrossRef.
- A. de Vries, A. Ekachai and N. Spielberg, Mol. Cryst. Liq. Cryst., 1979, 49, 143–152 CrossRef CAS.
- M. Buivydas, S. T. Lagerwall, I. Dierking, F. Gouda and A. Mochizuki, Ferroelectrics, 1998, 212, 67–78 CrossRef CAS.
- K. Merkel, Phase Transitions, 2018, 91, 1000–1006 CrossRef CAS.
- J. P. F. Lagerwall, D. Coleman, E. Körblova, C. Jones, R. Shao, J. M. Otón, D. M. Walba, N. Clark and F. Giesselmann, Liq. Cryst., 2006, 33, 17–23 CrossRef CAS.
- J. Naciri, J. Ruth, G. Crawford, R. Shashidhar and B. R. Ratna, Chem. Mater., 1995, 7, 1397–1402 CrossRef CAS.
- G. Galli, M. Reihmann, A. Crudeli, E. Chiellini, Y. Panarin, J. Vij, C. Blanc, V. Lorman and N. Olsson, Mol. Cryst. Liq. Cryst., 2005, 439, 245–257 Search PubMed.
- M. Rössle, L. Braun, D. Schollmeyer, R. Zentel, J. P. F. Lagerwall, F. Giesselmann and R. Stannarius, Liq. Cryst., 2005, 32, 533–538 CrossRef.
- K. M. Mulligan and R. P. Lemieux, Liq. Cryst., 2015, 42, 1229–1235 CrossRef CAS.
- S. P. Sreenilayam, D. Rodriguez-Lojo, D. M. Agra-Kooijman, J. K. Vij, V. P. Panov, A. Panov, M. R. Fisch, S. Kumar and P. J. Stevenson, Phys. Rev. Mater., 2018, 2, 025603 CrossRef CAS.
- Q. Song, A. Bogner, F. Giesselmann and R. P. Lemieux, Chem. Commun., 2013, 49, 8202–8204 RSC.
- C. P. J. Schubert, C. Müller, A. Bogner, F. Giesselmann and R. P. Lemieux, Soft Matter, 2017, 13, 3307–3313 RSC.
- K. M. Mulligan, A. Bogner, Q. Song, C. P. J. Schubert, F. Giesselmann and R. P. Lemieux, J. Mater. Chem. C, 2014, 2, 8270–8276 RSC.
- B. Das, A. Pramanik, M. K. Das, A. Bubnov, V. Hamplová and M. Kašpar, J. Mol. Struct., 2012, 1013, 119–125 CrossRef CAS.
- A. Bubnov, V. Novotná, D. Pociecha, V. Hamplová and M. Kapar, Phase Transitions, 2012, 85, 849–860 CrossRef CAS.
- M. Kohout, A. Bubnov, J. Šturala, V. Novotná and J. Svoboda, Liq. Cryst., 2016, 43, 1472–1485 CrossRef CAS.
- Y. Semenova, Y. P. Panarin, A. Bubnov, M. Glogarová, M. Kašpar and V. Hamplová, Ferroelectrics, 2004, 311, 11–19 CrossRef CAS.
- V. Novotná, V. Hamplová, M. Kašpar, N. Podoliak, A. Bubnov, M. Glogarová, D. Nonnenmacher and F. Giesselmann, Liq. Cryst., 2011, 38, 649–655 CrossRef.
- A. Bubnov, M. Kašpar, V. Novotná, V. Hamplová, M. Glogarová, N. Kapernaum and F. Giesselmann, Liq. Cryst., 2008, 35, 1329–1337 CrossRef CAS.
- M. Stojanović, A. Bubnov, D. Ž. Obadović, V. Hamplova, M. Kašpar and M. Cvetinov, Phase Transitions, 2011, 84, 380–390 CrossRef.
- A. Sanchez-Castillo, M. A. Osipov, S. Jagiella, Z. H. Nguyen, M. Kašpar, V. Hamplov, J. MacLennan and F. Giesselmann, Phys. Rev. E: Stat., Nonlinear, Soft Matter Phys., 2012, 85, 061703 CrossRef CAS.
- N. Hayashi, A. Kocot, M. J. Linehan, A. Fukuda, J. K. Vij, G. Heppke, J. Naciri, S. Kawada and S. Kondoh, Phys. Rev. E: Stat., Nonlinear, Soft Matter Phys., 2006, 74, 051706 CrossRef.
- P. Rudquist, M. A. Osipov and F. Giesselmann, Liq. Cryst., 2018, 45, 2097–2108 CrossRef CAS.
- A. D. Vries, Mol. Cryst. Liq. Cryst., 1985, 131, 125–145 CrossRef.
- M. T. Sims, L. C. Abbott, R. M. Richardson, J. W. Goodby and J. N. Moore, Liq. Cryst., 2019, 46, 11–24 CrossRef CAS.
- V. Domenici, M. Lelli, M. Cifelli, V. Hamplova, A. Marchetti and C. A. Veracini, ChemPhysChem, 2014, 15, 1485–1495 CrossRef CAS.
- A. Gradišek, V. Domenici, T. Apih, V. Novotná and P. J. Sebastião, J. Phys. Chem. B, 2016, 120, 4706–4714 CrossRef.
- Z. Ahmed, C. Müller, J. J. Johnston, K. Nguyen, C. P. J. Schubert, K. Abitaev, S. Marino, F. Giesselmann and R. P. Lemieux, Liq. Cryst., 2019, 46, 896–904 CrossRef CAS.
- C. P. J. Schubert, A. Bogner, J. H. Porada, K. Ayub, T. Andrea, F. Giesselmann and R. P. Lemieux, J. Mater. Chem. C, 2014, 2, 4581–4589 RSC.
- J. Peláez and M. Wilson, Phys. Chem. Chem. Phys., 2007, 9, 2968–2975 RSC.
- G. Tiberio, L. Muccioli, R. Berardi and C. Zannoni, ChemPhysChem, 2009, 10, 125–136 CrossRef CAS.
- M. F. Palermo, A. Pizzirusso, L. Muccioli and C. Zannoni, J. Chem. Phys., 2013, 138, 204901 CrossRef.
- F. Chami, M. R. Wilson and V. S. Oganesyan, Soft Matter, 2012, 8, 6823–6833 RSC.
- M. T. Sims, L. C. Abbott, S. J. Cowling, J. W. Goodby and J. N. Moore, Phys. Chem. Chem. Phys., 2016, 18, 20651–20663 RSC.
- D. Chen, J. H. Porada, J. B. Hooper, A. Klittnick, Y. Shen, M. R. Tuchband, E. Korbloèa, D. Bedrov, D. M. Walba, M. A. Glaser, J. E. Maclennan and N. A. Clark, Proc. Natl. Acad. Sci. U. S. A., 2013, 110, 15931–15936 CrossRef CAS.
- Y. Lansac, M. A. Glaser, N. A. Clark and O. D. Lavrentovich, Nature, 1999, 398, 54–57 CrossRef CAS.
- Y. Lansac, M. A. Glaser and N. A. Clark, Phys. Rev. E: Stat., Nonlinear, Soft Matter Phys., 2001, 64, 051703 CrossRef CAS.
- P. Styring, Mol. Cryst. Liq. Cryst., 1999, 332, 199–206 CrossRef.
- H. Toriumi, M. Yoshida, N. Kamiya and M. Takeuchi, Mol. Cryst. Liq. Cryst., 2010, 402, 31–42 CrossRef.
- M. Böckmann, C. Peter, L. D. Site, N. L. Doltsinis, K. Kremer and D. Marx, J. Chem. Theory Comput., 2007, 3, 1789–1802 CrossRef.
- A. Pizzirusso, M. Savini, L. Muccioli and C. Zannoni, J. Mater. Chem., 2011, 21, 125–133 RSC.
- A. Pizzirusso, M. E. Di Pietro, G. De Luca, G. Celebre, M. Longeri, L. Muccioli and C. Zannoni, ChemPhysChem, 2014, 15, 1356–1367 CrossRef CAS.
- Y. Olivier, L. Muccioli and C. Zannoni, ChemPhysChem, 2014, 15, 1345–1355 CrossRef CAS.
- F. Yan and D. J. Earl, Soft Matter, 2011, 7, 10266–10273 RSC.
- M. Fujiwara, K. Satoh and S. Mita, Mol. Cryst. Liq. Cryst., 2005, 441, 307–317 CrossRef CAS.
- F. D. Tsourtou, O. Alexiadis, V. G. Mavrantzas, V. Kolonias and E. Housos, Chem. Eng. Sci., 2015, 121, 32–50 CrossRef CAS.
- M. T. Sims, L. C. Abbott, J. W. Goodby and J. N. Moore, Soft Matter, 2019, 15, 7722–7732 RSC.
- I. Cacelli, G. Prampolini and A. Tani, J. Phys. Chem. B, 2005, 109, 3531–3538 CrossRef CAS.
- I. Cacelli and G. Prampolini, J. Chem. Theory Comput., 2007, 3, 1803–1817 CrossRef CAS.
- I. Cacelli, C. F. Lami and G. Prampolini, J. Comput. Chem., 2008, 30, 366–378 CrossRef.
- J. Wang, R. M. Wolf, J. W. Caldwell, P. A. Kollman and D. A. Case, J. Comput. Chem., 2004, 25, 1157–1174 CrossRef CAS.
- N. J. Boyd and M. R. Wilson, Phys. Chem. Chem. Phys., 2015, 17, 24851–24865 RSC.
- N. J. Boyd and M. R. Wilson, Phys. Chem. Chem. Phys., 2018, 20, 1485–1496 RSC.
- F. Jenz, M. A. Osipov, S. Jagiella and F. Giesselmann, J. Chem. Phys., 2016, 145, 134901 CrossRef.
- M. Kaspar, V. Hamplova, S. A. Pakhomov, A. M. Bubnov, F. Guittard, H. Sverenyak, I. Stibor, P. Vanek and M. Glogarova, Liq. Cryst., 1998, 24, 599–605 CrossRef CAS.
- H. J. C. Berendsen, D. van der Spoel and R. van Drunen, Comput. Phys. Commun., 1995, 91, 43–56 CrossRef CAS.
- E. Lindahl, B. Hess and D. van der Spoel, J. Mol. Model., 2001, 7, 306–317 CrossRef CAS.
- D. Van Der Spoel, E. Lindahl, B. Hess, G. Groenhof, A. E. Mark and H. J. C. Berendsen, J. Comput. Chem., 2005, 26, 1701–1718 CrossRef CAS.
- B. Hess, C. Kutzner, D. Van Der Spoel and E. Lindahl, J. Chem. Theory Comput., 2008, 4, 435–447 CrossRef CAS.
- S. Pronk, S. Páll, R. Schulz, P. Larsson, P. Bjelkmar, R. Apostolov, M. R. Shirts, J. C. Smith, P. M. Kasson, D. Van Der Spoel, B. Hess and E. Lindahl, Bioinformatics, 2013, 29, 845–854 CrossRef CAS.
- M. J. Abraham, T. Murtola, R. Schulz, S. Páll, J. C. Smith, B. Hess and E. Lindah, SoftwareX, 2015, 1–2, 19–25 CrossRef.
- A. D. Becke, J. Chem. Phys., 1993, 98, 5648–5652 CrossRef CAS.
- C. Lee, W. Yang and R. G. Parr, Phys. Rev. B: Condens. Matter Mater. Phys., 1988, 37, 785–789 CrossRef CAS.
- M. J. Frisch, G. W. Trucks, H. B. Schlegel, G. E. Scuseria, M. A. Robb, J. R. Cheeseman, G. Scalmani, V. Barone, B. Mennucci, G. A. Petersson, H. Nakatsuji, M. Caricato, X. Li, H. P. Hratchian, A. F. Izmaylov, J. Bloino, G. Zheng, J. L. Sonnenberg, M. Hada, M. Ehara, K. Toyota, R. Fukuda, J. Hasegawa, M. Ishida, T. Nakajima, Y. Honda, O. Kitao, H. Nakai, T. Vreven, J. J. A. Montgomery, J. E. Peralta, F. Ogliaro, M. Bearpark, J. J. Heyd, E. Brothers, K. N. Kudin, V. N. Staroverov, R. Kobayashi, J. Normand, K. Raghavachari, A. Rendell, J. C. Burant, S. S. Iyengar, J. Tomasi, M. Cossi, N. Rega, J. M. Millam, M. Klene, J. E. Knox, J. B. Cross, V. Bakken, C. Adamo, J. Jaramillo, R. Gomperts, R. E. Stratmann, O. Yazyev, A. J. Austin, R. Cammi, C. Pomelli, J. W. Ochterski, R. L. Martin, K. Morokuma, V. G. Zakrzewski, G. A. Voth, P. Salvador, J. J. Dannenberg, S. Dapprich, A. D. Daniels, Ö. Farkas, J. B. Foresman, J. V. Ortiz, J. Cioslowski and D. J. Fox, Gaussian 09, Revision B.01, Gaussian Inc., Wallingford, CT, 2009 Search PubMed.
- C. I. Bayly, P. Cieplak, W. D. Cornell and P. A. Kollman, J. Phys. Chem., 1993, 97, 10269–10280 CrossRef CAS.
- J. Wang, W. Wang, P. A. Kollman and D. A. Case, J. Mol. Graphics Modell., 2006, 25, 247–260 CrossRef CAS.
- D. A. Case, I. Y. Ben-Shalom, S. R. Brozell, D. S. Cerutti, T. E. Cheatham, III, V. W. D. Cruzeiro, T. A. Darden, R. E. Duke, D. Ghoreishi, M. K. Gilson, H. Gohlke, A. W. Goetz, D. Greene, R. Harris, N. Homeyer, Y. Huang, S. Izadi, A. Kovalenko, T. Kurtzman, T. S. Lee, S. LeGrand, P. Li, C. Lin, J. Liu, T. Luchko, R. Luo, D. J. Mermelstein, K. M. Merz, Y. Miao, G. Monard, C. Nguyen, H. Nguyen, I. Omelyan, A. Onufriev, F. Pan, R. Qi, D. R. Roe, A. Roitberg, C. Sagui, S. Schott-Verdugo, J. Shen, C. L. Simmerling, J. Smith, R. SalomonFerrer, J. Swails, R. C. Walker, J. Wang, H. Wei, R. M. Wolf, X. Wu, L. Xiao, D. M. York and P. A. Kollman, AMBER 2018, University of California, San Francisco, 2018 Search PubMed.
- A. W. Sousa Da Silva and W. F. Vranken, BMC Res. Notes, 2012, 5, 1–8 CrossRef.
- B. Hess, H. Bekker, H. J. C. Berendsen and J. G. E. M. Fraaije, J. Comput. Chem., 1997, 18, 1463–1472 CrossRef CAS.
- T. Darden, D. York and L. Pedersen, J. Chem. Phys., 1993, 98, 10089–10092 CrossRef CAS.
- H. J. C. Berendsen, J. P. M. Postma, W. F. Van Gunsteren, A. Dinola and J. R. Haak, J. Chem. Phys., 1984, 81, 3684–3690 CrossRef CAS.
- S. Nosé, J. Chem. Phys., 1984, 81, 511–519 CrossRef.
- S. Nosé, Mol. Phys., 1984, 52, 255–268 CrossRef.
- M. Parrinello and A. Rahman, J. Appl. Phys., 1981, 52, 7182–7190 CrossRef CAS.
- J. D. Chodera, J. Chem. Theory Comput., 2016, 12, 1799–1805 CrossRef CAS.
- I. M. Withers, C. M. Care and D. J. Cleaver, J. Chem. Phys., 2000, 113, 5078–5090 CrossRef CAS.
- R. Pecheanu and N. M. Cann, Phys. Rev. E: Stat., Nonlinear, Soft Matter Phys., 2010, 81, 041704 CrossRef CAS.
- W. Humphrey, A. Dalke and K. Schulten, J. Mol. Graphics, 1996, 14, 33–38 CrossRef CAS.
- A. Marchetti, V. Domenici, V. Novotna, M. Lelli, M. Cifelli, A. Lesage and C. A. Veracini, ChemPhysChem, 2010, 11, 1641–1645 CrossRef CAS.
- M. Krueger and F. Giesselmann, Phys. Rev. E: Stat., Nonlinear, Soft Matter Phys., 2005, 71, 041704 CrossRef.
- R. Korlacki, V. P. Panov, A. Fukuda, J. K. Vij, C. M. Spillmann and J. Naciri, Phys. Rev. E: Stat., Nonlinear, Soft Matter Phys., 2010, 82, 031702 CrossRef.
- U. Manna, J. K. Song, J. K. Vij and J. Naciri, Appl. Phys. Lett., 2009, 94, 2007–2010 CrossRef.
- D. Nonnenmacher, S. Jagiella, Q. Song, R. P. Lemieux and F. Giesselmann, ChemPhysChem, 2013, 14, 2990–2995 CrossRef CAS.
- M. V. Gorkunov, M. A. Osipov, J. P. F. Lagerwall and F. Giesselmann, Phys. Rev. E: Stat., Nonlinear, Soft Matter Phys., 2007, 76, 051706 CrossRef CAS.
- C. Zannoni, in The Molecular Dynamics of Liquid Crystals, ed. G. R. Luckhurst and C. A. Veracini, Kluwer Academic, Dordrecht, 1994, pp. 11–40 Search PubMed.
- M. V. Gorkunov, M. A. Osipov, N. Kapernaum, D. Nonnenmacher and F. Giesselmann, Phys. Rev. E: Stat., Nonlinear, Soft Matter Phys., 2011, 84, 051704 CrossRef CAS.
- L. De Gaetani and G. Prampolini, Soft Matter, 2009, 5, 3517–3526 RSC.
- S. Bezner, M. Krueger, V. Hamplová, M. Glogarová and F. Giesselmann, J. Chem. Phys., 2007, 126, 1–7 CrossRef.
- S. T. Lagerwall, P. Rudquist and F. Giesselmann, Mol. Cryst. Liq. Cryst., 2009, 510, 148–157 CAS.
- K. Merkel, A. Kocot, J. K. Vij, P. J. Stevenson, A. Panov and D. Rodriguez, Appl. Phys. Lett., 2016, 108, 243301 CrossRef.
- H. Yoon, D. M. Agra-Kooijman, K. Ayub, R. P. Lemieux and S. Kumar, Phys. Rev. Lett., 2011, 106, 087801 CrossRef.
- D. M. Agra-Kooijman, H. Yoon, S. Dey and S. Kumar, Phys. Rev. E: Stat., Nonlinear, Soft Matter Phys., 2014, 89, 032506 CrossRef.
- V. Domenici, M. Cifelli, A. Marchetti, M. Lelli, V. Hamplova, M. Kaspar and C. A. Veracini, Mol. Cryst. Liq. Cryst., 2012, 553, 103–110 CrossRef CAS.
- J. C. Roberts, N. Kapernaum, Q. Song, D. Nonnenmacher, K. Ayub, F. Giesselmann and R. P. Lemieux, J. Am. Chem. Soc., 2010, 132, 364–370 CrossRef CAS.
- P. J. Collings, B. R. Ratna and R. Shashidhar, Phys. Rev. E: Stat., Nonlinear, Soft Matter Phys., 2003, 67, 021705 CrossRef.
- T. Murias, A. C. Ribeiro, D. Guillon, D. Shoosmith and H. J. Coles, Liq. Cryst., 2002, 29, 627–633 CrossRef CAS.
- Y. Takanishi, Y. Ouchi, H. Takezoe, A. Fukuda, A. Mochizuki and M. Nakatsuka, Jpn. J. Appl. Phys., 1990, 29, L984–L986 CrossRef CAS.
Footnote |
| † Electronic supplementary information (ESI) available. See DOI: 10.1039/d0tc02898c |
| This journal is © The Royal Society of Chemistry 2020 |

