 Open Access Article
Creative Commons Attribution 3.0 Unported Licence
An experimental and theoretical study of exciplex-forming compounds containing trifluorobiphenyl and 3,6-di-tert-butylcarbazole units and their performance in OLEDs†
R.
Keruckiene
 a,
M.
Guzauskas
a,
L.
Lapienyte
a,
J.
Simokaitiene
a,
D.
Volyniuk
a,
M.
Guzauskas
a,
L.
Lapienyte
a,
J.
Simokaitiene
a,
D.
Volyniuk
 a,
J.
Cameron
 b,
P. J.
Skabara
 *b,
G.
Sini
 *c and
J. V.
Grazulevicius
 *a
*a
aDepartment of Polymer Chemistry and Technology, Kaunas University of Technology, K. Barsausko St. 59, Kaunas, LT-50254, Lithuania. E-mail: juozas.grazulevicius@ktu.lt
bWestCHEM, School of Chemistry, University of Glasgow, Joseph Black Building, University Place, Glasgow, G12 8QQ, UK. E-mail: Peter.Skabara@glasgow.ac.uk
cLaboratoire de Physicochimie des Polymères et des Interfaces, CY Paris Cergy Université, EA 2528, 5 mail Gay-Lussac, Cergy-Pontoise Cedex 95031, France. E-mail: gjergji.sini@u-cergy.fr
First published on 2nd October 2020
Abstract
Derivatives of trifluorobiphenyl and 3,6-di-tert-butylcarbazole were synthesised as potential components of emitting layers of OLEDs. Molecular design of the compounds was performed taking into consideration the hydrogen bonding ability of the fluorine atom and electron-donating ability of the carbazole moiety. Their toluene solutions exhibited very high triplet-energy values of 3.03 eV and 3.06 eV. Ionisation energies of the compounds in the solid-state were found to be in the range from 5.98 to 6.17 eV. Density functional theory (DFT) calculations using the ωB97XD functional, with the ω parameter tuned in the presence of the solvent, uncovered singlet–triplet energy splitting in good agreement with the experimental results. The materials were tested in the emissive layers of OLEDs, showing the ability to form exciplexes with complementary electron-accepting 2,4,6-tris[3-(diphenylphosphinyl)phenyl]-1,3,5-triazine. Using the synthesised compounds as exciplex-forming materials, highly efficient exciplex emission-based OLEDs were developed. In the best case, a high maximum current efficiency of 24.8 cd A−1, and power and external quantum efficiencies of 12.2 lm W−1 and 7.8%, respectively, were achieved.
Introduction
Metal-free organic compounds are widely used in the active layers of organic light emitting diodes (OLEDs).1–3 Optimization of the properties of emitting layers in OLEDs remains a key research goal in this field. Recently, delayed emission has been extensively adopted for efficient OLEDs, but not all challenges have been solved yet.4–7 One of the promising ways to obtain cost-effective OLEDs is to employ exciplex-forming systems.8 An exciplex is defined as an excited-state complex obtained under photo- and electrical excitation between two molecules, one being electron-donating and the other electron-accepting.9 Exciplex formation plays a role in the conversion from the triplet excited state to the singlet state and hence provides a strategy to improve the performance of OLEDs.10,11 Due to their dominant CT character, exciplexes are not very effective in light emission. Nevertheless, as these systems possess a small ΔEST, they have the potential to effectively convert triplet excited states to singlets.9,12 Furthermore, the intermolecular interactions of the exciplex, involving non-covalent interactions such as hydrogen bonding or van der Waals interactions, between π-conjugated molecular units impact the morphology of the active layers, which also has a close link to the device performance.13,14 Consequently, the potential to establish such intermolecular interactions is an important criterion in the design of molecular structures, which is manifested through the functionalisation of organic molecules. In addition to making an impact on the stability, oxidation potential, and electrical and optical properties of materials,15 the number and position of substituents can provide molecules with the potential to establish intermolecular hydrogen and halogen bonds. Intermolecular hydrogen bonding can drive the formation of molecular assemblies with charge-transfer character and dipolar interactions.16,17 Halogen bonding offers versatility in interaction directions and structurally tuned packing fragments,18 which was proven to be useful in altering molecular packing for efficient charge transport.19 Fluorine can be regarded as a useful component of organic electroactive compounds. Recent studies have revealed that fluorine-induced intramolecular interactions including S⋯F and H⋯F interactions can promote backbone planarity,20 enhance the frontier orbital overlaps, tune the solubility, and change the packing motif of molecules.21–23 The extreme electronegativity of the fluorine atom pulls electrons from the backbone to stabilise frontier molecular orbitals, impacting electron transporting characteristics and resulting in a change in intermolecular interactions.24–26 The hydrophobic nature of fluorinated compounds can also induce air stability of devices by providing resistance to oxygen or water.27 The particular properties of fluorinated compounds, especially in establishing relatively strong intermolecular interactions, make them interesting candidates for use in exciplex-based OLED devices. To the best of our knowledge, only one fluorinated compound has been used in exciplex-forming systems so far.28In this work, two new compounds bearing trifluorophenyl and carbazole fragments are introduced. Molecular design of the compounds was performed taking into consideration the hydrogen bonding abilities of the fluorine atom and efficient electron-donating abilities of the carbazole moiety.21
The impact of the number of donor groups on the properties of the materials is discussed on the bases of results obtained by means of theoretical and experimental approaches. The compounds were shown to be capable of forming exciplexes with appropriate electron-accepting molecules. The exciplex forming molecular mixtures were tested as the emissive materials in OLEDs.
Results and discussion
Synthesis and thermal properties
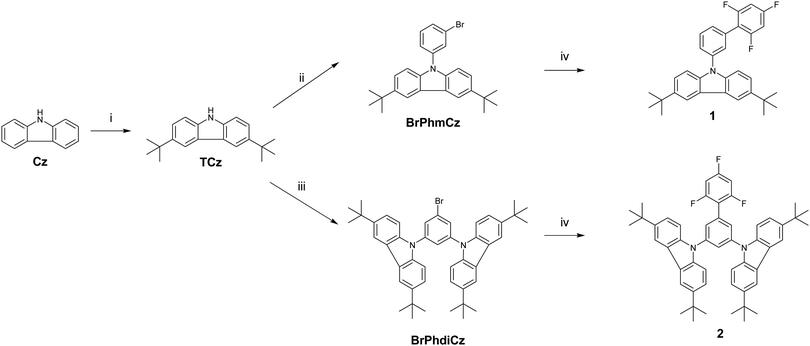
Compounds 1 and 2 were obtained by a three-step synthesis as illustrated in Scheme 1. Pd-Catalysed Suzuki–Miyaura29 cross-coupling of 2,4,6-trifluorophenylboronic acid with electron-donating 9-(3-bromophenyl)-3,6-di-tert-butylcarbazole or 9,9′-(5-bromo-1,3-phenylene)bis(3,6-di-tert-butylcarbazole) was utilised. The yields of products 1 and 2 were 37% and 39%, respectively. They were found to be soluble in common organic solvents. Their structures were confirmed by 1H NMR and ATR-IR spectroscopies and mass spectrometry. Descriptions of the synthesis and characterization of the compounds are given in the ESI.†Morphological transitions and thermal stabilities of derivatives 1 and 2 were investigated by using DSC and TGA (Fig. S1, ESI†). Their thermal characteristics are shown in Table 1.
As both compounds were isolated after the synthesis and purification as crystalline materials, endothermic melting signals were observed in the 1st heating scans of DSC measurements. Crystallisation and subsequent melting signals were observed during the cooling and 2nd heating scans for compound 2. The higher melting and crystallisation temperatures of 2 could be attributed to its more symmetrical crystalline structure and overall higher molar mass. No further morphological transitions of sample 1 were detected during cooling and heating scans of DSC measurements, indicating its tendency to be transformed to a solid amorphous state. TGA experiments revealed the complete weight loss of compound 1, indicating its sublimation, and the impossibility to determine the temperature of onset of thermal degradation.
Geometry and frontier orbitals
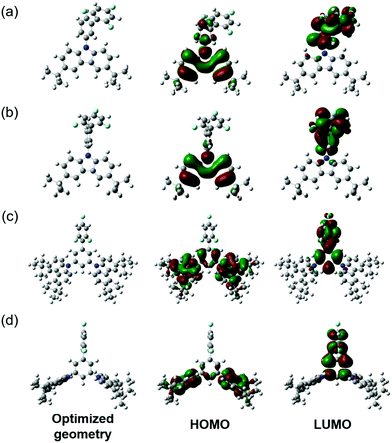
The geometries of the target molecules were analysed using DFT calculations at the ωB97XD/6-31++G(d,p) level of theory. The dihedral angles are defined in Fig. 1 and summarised in Table 2, whilst the optimised structure and the HOMO and LUMO plots are presented in Fig. 2. The geometry of both compounds was sensitive to the ω-value. It is worth briefly noting at this point that the role of the ω-parameter is to split the space of electron–electron interactions into long- and short ranges, the short range being treated at the DFT level, as opposed to the Hartree–Fock level for the long range interactions. By tuning the value of ω in the presence of a solvent, a good part of the medium polarization effect can be included in the geometry and electronic structure of the molecules, resulting in a better description of molecular properties in the bulk. Indeed, the optimisation of 1 carried out by using the default ω-value showed each of the dihedral angles to be in the range of 50–60°, showing significant twisting whilst being far from orthogonal. However, when this geometry was optimised using ω-CPCM instead of the default value, an increase in the dihedral angle was observed, with the trifluorobenzene-phenyl twist essentially orthogonal and the phenyl-carbazole dihedral angle ∼80°. An increase in the dihedral angle of ∼20–30° when using a tuned ω-value compared to the default (0.2 Bohr−1) is consistent with observations reported by Sallenave and co-workers studying carbazole-based materials.30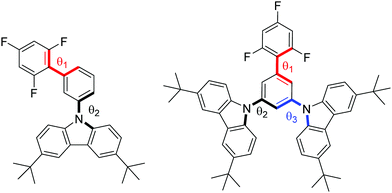 | ||
| Fig. 1 Structures of 1 (left) and 2 (right) with dihedral angles 1, 2 and 3 denoted in red, black and blue, respectively. | ||
| Dihedral 1 (°) | Dihedral 2 (°) | Dihedral 3 (°) | ||
|---|---|---|---|---|
| 1 | ω-default/diethyl ether | 55.7 | 53.9 | — |
| ω-CPCM | 89.5 | 81.5 | — | |
| 2 | ω-default/diethyl ether | 59.5 | 53.9 | 52.8 |
| ω-CPCM | 90.4 | 80.4 | 81.5 | |
Electrochemical and photoelectrical properties
Cyclic voltammetry was applied to study the electrochemical properties of derivatives 1 and 2 (Fig. S2, ESI†). Both compounds showed reversible oxidation waves. Ionisation energy (IECV, Table 3) values were estimated from the oxidation onset potentials against ferrocene (Eox onset vs. Fc). These values were found to be comparable and correlate well with the energy gap values estimated from the edges of the UV-Vis spectra, indicating similar π-electron conjugated systems in molecules 1 and 2.| Compound | Toluene solution/thin film | IECV (eV) | IEPE (eV) | ||||||
|---|---|---|---|---|---|---|---|---|---|
| λ Abs (nm) | λ FL (nm) | E optg (eV) | Stokes shift (cm−1) | S1![[thin space (1/6-em)]](https://www.rsc.org/images/entities/char_2009.gif) : :![[thin space (1/6-em)]](https://www.rsc.org/images/entities/char_2009.gif) T1 (eV) T1 (eV) |
ΔEST (eV) | PLQY (%) | |||
| λ Abs are wavelengths of absorption maxima; λFL are wavelengths of emission maxima; Stokes shift = λFl − λAbs; S1 is the singlet energy estimated as 1240/λFlu onset; T1 is the triplet energy estimated as 1240/λPH onset; ΔEST = T1 − S1; Eoptg is optical gap estimated as 1240/λAbs onset where λAbs onset is the wavelength of the onset of absorption; IEPE is the ionisation potential estimated by photoelectron emission spectrometry in air; IECV is the ionisation potential estimated by CV as IECV = Eonset ox vs. Fc + 5.1 eV.31,32 | |||||||||
| 1 | 297, 346/298, 347 | 354, 370/355, 366, 460 | 3.49 | 653/649 | 3.67![[thin space (1/6-em)]](https://www.rsc.org/images/entities/char_2009.gif) : :![[thin space (1/6-em)]](https://www.rsc.org/images/entities/char_2009.gif) 3.03/— 3.03/— |
0.64 | 13/1 | 5.15 | 5.98 |
| 2 | 297, 346/230, 345 | 352, 367/352, 374, 439 | 3.41 | 493/577 | 3.63![[thin space (1/6-em)]](https://www.rsc.org/images/entities/char_2009.gif) : :![[thin space (1/6-em)]](https://www.rsc.org/images/entities/char_2009.gif) 3.05/— 3.05/— |
0.58 | 28/1 | 5.28 | 6.17 |
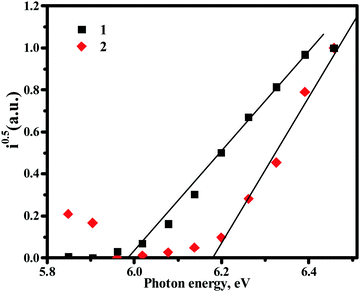
Ionisation energy values (Table 3 and Fig. 3) of the solid samples of compounds 1 and 2 were estimated by photoelectron emission spectrometry. The values of ionisation energies were found to be comparable for both the compounds and were a little higher than those estimated by cyclic voltammetry. Small differences in the values of ionisation energy obtained by employing different methods can be explained by the different environments in the solution and the solid-state.
Optical absorption properties
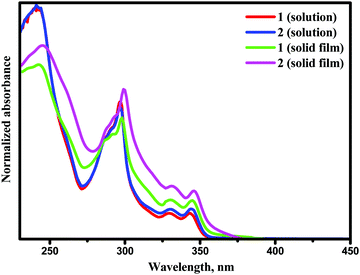
UV-Vis absorption spectra of the solutions and films of compounds 1 and 2 are shown in Fig. 4. Photophysical characteristics of the compounds are collected in Table 3. Energy gap values determined from the edges of the UV spectra of solutions of derivatives 1 and 2 in toluene were found to be close due to the presence of the same electron-donating moiety in both compounds. The spectra were similar to the absorption spectrum of a toluene solution of carbazole (Fig. S3, ESI†). This observation shows that in solutions and solid films of 1 and 2, mainly donor local excited states contribute to the absorption properties. Indeed, the oscillator strength corresponding to S1, which is a CT donor → acceptor transition, exhibits a negligible value, in turn stemming from the nearly orthogonal donor/acceptor dihedral angle. In this situation, the CT S0 → S1 transition becomes invisible or hidden by the more intense local-carbazole low energy band corresponding to the transition S0 → Sn (Table 3). This is consistent with observations from the theoretical calculations. Similarly, structured vibronic absorption bands were observed for the layers of 1 and 2.In order to obtain insights into the optical properties of compounds 1 and 2, TDDFT calculations were carried out on each of the optimised structures using geometries obtained with both default- and tuned ω-values. The results of these calculations are summarised in Table 4. When calculating S1 and T1 transitions, it is important that the nature of the excitation is described appropriately. In order to maximise the reverse intersystem crossing, there should be a change in the symmetry of the excited state, so typically in donor–acceptor compounds, the T1 excitation is a local excitation (LE) and S1 excitation is a charge transfer (CT) state.33 Natural transition orbitals (NTOs)34 for holes and electrons corresponding to the S1 and T1 states of compounds 1 and 2 are shown in Fig. 5 and 6, respectively, whilst the full list of TDDFT transitions for both compounds is presented in Fig. S4–S11 (ESI†). In order to further characterise these transitions, the spatial overlap (Λ) for all excitations has been reported.
| T1 (eV) | T1 (nm) | Λ T1 | S1 (eV) | S1 (nm) | Λ S1 | ΔEST | ||
|---|---|---|---|---|---|---|---|---|
| a The most dominant individual transitions from TDDFT calculations are shown in parentheses. Full lists of these transitions, with molecular orbital diagrams, are presented in Fig. S4–S11 (ESI). | ||||||||
| 1 | Default ω | 3.21 (H−1 → L+1)a | 385.7 | 0.68 | 4.21 (H → L+1)a | 294.7 | 0.67 | 1.00 |
| ω-CPCM | 3.17 (H−1 → L+2)a | 390.6 | 0.72 | 3.81 (H → L)a | 325.1 | 0.16 | 0.64 | |
| 2 | Default ω | 3.21 (H−2 → L+1)a | 386.2 | 0.72 | 4.24 (H → L+1)a | 292.6 | 0.67 | 1.03 |
| ω-CPCM | 3.17 (H−3 → L+3)a | 390.8 | 0.61 | 3.66 (H → L)a | 338.7 | 0.20 | 0.49 | |
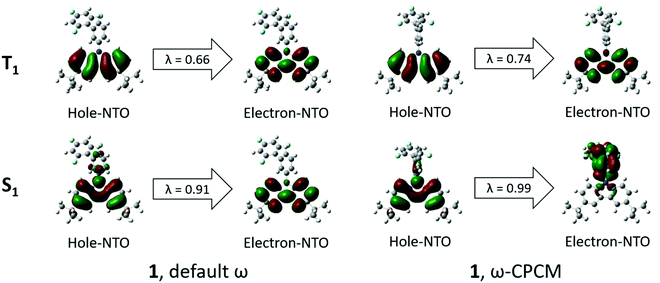 | ||
| Fig. 5 NTOs corresponding to S1 and T1 states for compound 1 obtained by means of the TDDFT method at the ωB97XD/6-31++G(d,p) level by using default ω (left) and ω-CPCM (right). λ = NTO eigenvalue. | ||
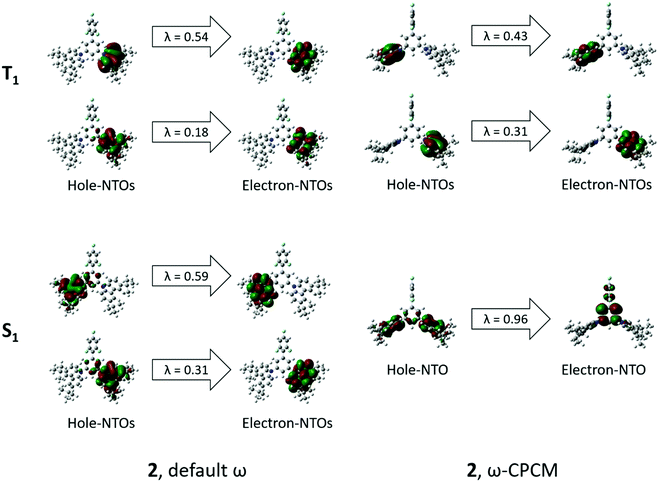 | ||
| Fig. 6 NTOs corresponding to S1 and T1 states of 2 obtained by means of the TDDFT method at the ωB97XD/6-31++G(d,p) level by using default ω (left) and ω-CPCM (right). λ = NTO eigenvalue. | ||
The NTOs corresponding to the T1 states of compounds 1 and 2 (Fig. 5 and 6) indicate that both holes and electrons are globally localised on the electron-donating carbazole units, irrespective of the geometry used, highlighting the 3LE nature of these transitions. The calculated T1 energies using both default ω and ω-CPCM methods show good agreement with one another for both compounds and show generally similar spatial overlap for the transitions.
However, the calculated S1 energies are significantly different when using the separate methods. Calculations with the default ω show an increased S1 energy in both compounds, resulting in a large calculated ΔEST. The NTOs with the default ω have a generally large spatial overlap with occupied and unoccupied orbitals involved in the dominant transitions localised on the carbazole units. Therefore, the S1 state does not show the CT character that would be expected for a donor–acceptor compound.
When the ω-CPCM value is used for the TDDFT calculations, the S1 energy is significantly reduced and this can be explained by the increased CT nature of the transitions. The spatial overlap, Λ, is significantly reduced with the electron-NTOs of 1 and 2 (Fig. 5 and 6) localised on the electron-deficient 1,3,5-trifluorobenzene groups. The predicted ΔEST energy is significantly reduced and in good agreement with experimental values (see optical emission properties section), although it is too high for the material to be used alone as a thermally activated delayed fluorescence (TADF) candidate. Furthermore, the individual T1 and S1 energies show relatively good agreement compared to experimentally determined values, which is useful in the design of exciplex emissive layers.
The singlet excitations from the TDDFT calculations are listed in Table S1 (ESI†). As previously mentioned, the S1 transitions show local excitations when default ω is used but CT states are observed in both compounds when ω-CPCM is used. The nature of the excitation is important when comparing with the experimental absorption spectrum. Compound 1 shows the S1 excitation to have a small oscillator strength (f = 0.01), whilst that of the first local excitation, S3, is higher (f = 0.04). In compound 2, there is a similar trend where the S1 excitation (f = 0.02) also has a lower oscillator strength than the lowest energy local excitation S5 (f = 0.07). This suggests that the UV/Vis absorption spectrum will be dominated by the absorption of the carbazole unit. The lowest energy local excitations for compounds 1 and 2 occur at 313 and 312 nm, respectively, which is in good agreement with the experimental peaks at 297 nm for both compounds (Table 3).
The sensitivity of the S1 excitation to the environment in TDDFT calculations has been shown and therefore it is important that this is taken into consideration when estimating ΔEST, using the ω-tuned functional as an effective means of improving the accuracy of the estimation.
Optical emission properties
The photophysical properties of compounds 1 and 2 are determined by their geometrical structures and the changes after excitation. The vibronically structured emission bands of the solutions of 1 and 2 in toluene at room temperature were observed in the deep blue region (Fig. 7), with PLQY values of 13% and 28%. This is supplemented by small Stokes shift values, which can be explained by minimal changes in geometry and solvent reorganisation upon excitation in the dilute toluene solutions of both the compounds. The triplet energy values determined from the onsets of the phosphorescence (PH) spectra of compounds 1 and 2 were found in the blue region. The experimental ΔEST values were found to be relatively high (Table 3). This observation is in good agreement with the results of theoretical calculations. Due to the potential application of 1 and 2 in the emissive layers of OLEDs, we further focused on the investigation of the solid-state photophysical properties of the compounds.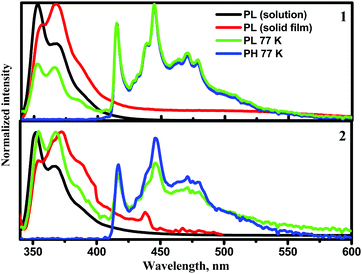 | ||
| Fig. 7 PL spectra of toluene solutions and of solid films of compounds 1 and 2 recorded at room temperature (λexc = 330 nm) and PL and PH spectra recorded at 77 K. | ||
The PL spectra of thin films of compounds 1 and 2 were also vibronically structured in the same range of ca. 350–400 nm as those of their toluene solutions (Fig. 7). The PLQY values of the solid samples were found to be low (∼1%) due to aggregation-induced quenching.35 The origin of the low-energy band was studied more extensively. PL spectra of the non-evacuated and evacuated neat thin films were recorded at room temperature (Fig. S12a and c, ESI†). The PL spectrum of compound 1 was found to be sensitive to oxygen. The ratio of PL intensities (Ievac/Ipre-evac) was 1.9. The PL intensity change in the low-energy band of compound 1 confirms the impact of triplet states possibly through reverse intersystem crossing (RISC). PL decay curves of the solid sample of 1 were recorded (Fig. S12b, ESI†). They contained two components, i.e. a short-lived component in the ns range corresponding to a local excited (1LE) state at higher energies and a CT component at lower energies.
The PL spectrum of the solid sample of compound 2 was not significantly sensitive to oxygen. A slight increase of PL intensity was observed after evacuation (Fig. S12c, ESI†). PL decay curves of the solid sample of compound 2 (Fig. S12d, ESI†) contained two short-lived components in the ns range corresponding to 1LE emission. Slight differences in emission spectra and their sensitivity to oxygen in the solid samples of compounds 1 and 2, and in sensitivity of the PL spectra to oxygen, are apparently related to the different substitution patterns of the trifluorobiphenyl moiety. Taking into account the aggregation-induced quenching of emission of 1 and 2, it was decided to test the photophysical properties of these compounds in doped systems.
Compounds 1 and 2 formed sky-blue exciplexes with the electron acceptor 2,4,6-tris[3-(diphenylphosphinyl)phenyl]-1,3,5-triazine (PO-T2T), which is one of the most widely studied exciplex-forming acceptors (Fig. 8).36,37 The spectra of solid films of molecular mixtures of 1 and 2 with PO-T2T showed significant red shifts in comparison to the PL spectra of non-doped films of the compounds. PL spectra of both exciplex-forming systems were found to be broad and typical of CT. The exciplex-forming mixtures 1: PO-T2T and 2: PO-T2T exhibited rather low PLQY values of 4% and 2% in air, respectively. The PL spectra of exciplexes 1: PO-T2T and 2: PO-T2T peaked at the wavelengths of 489 and 470 nm (2.48 and 2.67 eV), respectively (Fig. 8a). This observation can be explained by the relatively high IDP values of compounds 1 and 2 5.98 eV for compound 1 and 6.17 eV for compound 2 (Fig. 3 and Table 3) taking into account the equation38hνmaxex ≃ IDP − EAA − EC (2.54 eV for 1: PO-T2T and 2.67 eV for 2: PO-T2T), where IDP is the ionization potential of the donor (compound 1 or 2), EAA is the electron affinity of the acceptor (3.5 eV for PO-T2T), and EC is the electron–hole Coulombic attraction energy. It should be noted that the trifluorobiphenyl moiety was mainly used to increase the ionization potential of compounds 1 and 2, resulting in blue-shifted emission of exciplexes formed between compound 1 (or 2) and PO-T2T.
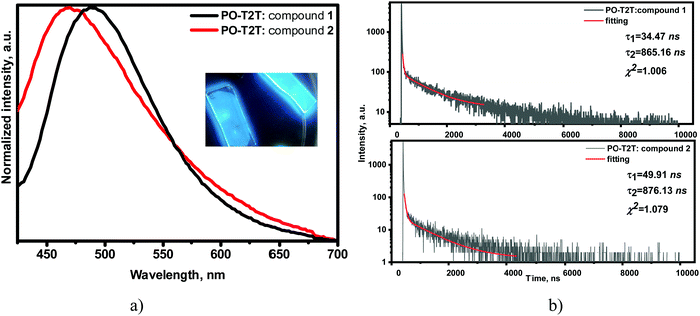 | ||
| Fig. 8 Normalised PL spectra with photo of emissive layers inset (a) and PL decay curves (b) of solid molecular mixtures of 1 or 2 with PO-T2T (λexc = 330 nm). | ||
The molecular mixtures 1: PO-T2T and 2: PO-T2T were characterised by PL decays in the μs region with shapes attributed to exciplex emission but not to monomer emission (Fig. 8b). The nanosecond-lived components of the decay curves represent prompt fluorescence, whilst the longer-lived components can be attributed to thermally activated delayed fluorescence. This assumption is in agreement with the PL decays of exciplexes 1: PO-T2T and 2: PO-T2T recorded at room temperature (295 K) and at the temperature of liquid nitrogen (77 K) (Fig. S13, ESI†). The intensity of the long-lived component is higher at 295 K than at 77 K, proving the TADF nature of the exciplex emissions. PL decay curves for the films of the mixtures of 1 with PO-T2T and of 2 with PO-T2T in air and under vacuum were recorded. The increasing intensity (shown by the arrows) of the delayed component of their emission under an inert atmosphere indicates a triplet contribution to the whole emission intensity (Fig. S14, ESI†). The TADF origin of the delayed fluorescence of the exciplex-forming systems 1: PO-T2T and 2: PO-T2T was additionally confirmed by recording the dependence of PL intensity on laser pump pulse. The slope values of the straight lines were found to be ca. 1 (Fig. S15, ESI†).39
Devices
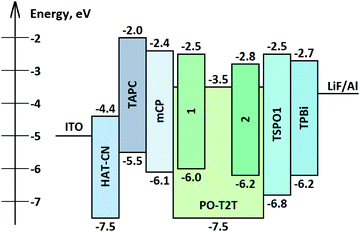
Fig. 9 shows the simplified structure and the equilibrium energy diagram of OLEDs with emitting layers (EMLs) of exciplex-forming mixtures of acceptor PO-T2T and donors 1 and 2. Components of the EML were deposited in a molar ratio of 1![[thin space (1/6-em)]](https://www.rsc.org/images/entities/char_2009.gif) :
:![[thin space (1/6-em)]](https://www.rsc.org/images/entities/char_2009.gif) 1. For better device performance, additional layers were used. A layer of 1,4,5,8,9,11-hexaazatriphenylenehexacarbonitrile (HAT-CN) was used as a hole injection layer (HIL), a layer of 4,4′-cyclohexylidenebis[N,N-bis(4-methylphenyl)benzenamine] (TAPC) was used as the hole transporting layer (HTL), a layer of 1,3-bis(N-carbazolyl)benzene (mCP) was used as the electron blocking layer (EBL), a layer of diphenyl[4-(triphenylsilyl)phenyl]phosphine oxide (TSPO1) was used as a hole blocking layer (HBL) and a layer of 1,3,5-tris(1-phenyl-1H-benzimidazol-2-yl)benzene (TPBi) was employed as an electron transporting layer (ETL). Thus, exploiting the device structure HAT-CN (10 nm)/TAPC (40 nm)/mCP (4 nm)/compound 1 or 2: PO-T2T (1
1. For better device performance, additional layers were used. A layer of 1,4,5,8,9,11-hexaazatriphenylenehexacarbonitrile (HAT-CN) was used as a hole injection layer (HIL), a layer of 4,4′-cyclohexylidenebis[N,N-bis(4-methylphenyl)benzenamine] (TAPC) was used as the hole transporting layer (HTL), a layer of 1,3-bis(N-carbazolyl)benzene (mCP) was used as the electron blocking layer (EBL), a layer of diphenyl[4-(triphenylsilyl)phenyl]phosphine oxide (TSPO1) was used as a hole blocking layer (HBL) and a layer of 1,3,5-tris(1-phenyl-1H-benzimidazol-2-yl)benzene (TPBi) was employed as an electron transporting layer (ETL). Thus, exploiting the device structure HAT-CN (10 nm)/TAPC (40 nm)/mCP (4 nm)/compound 1 or 2: PO-T2T (1![[thin space (1/6-em)]](https://www.rsc.org/images/entities/char_2009.gif) :
:![[thin space (1/6-em)]](https://www.rsc.org/images/entities/char_2009.gif) 1) (24 nm)/PO-T2T (4 nm)/TPBi (36 nm)/LiF (0.5 nm)/Al, OLEDs D1 and D2 containing compounds 1 or 2, respectively, were fabricated.
1) (24 nm)/PO-T2T (4 nm)/TPBi (36 nm)/LiF (0.5 nm)/Al, OLEDs D1 and D2 containing compounds 1 or 2, respectively, were fabricated.
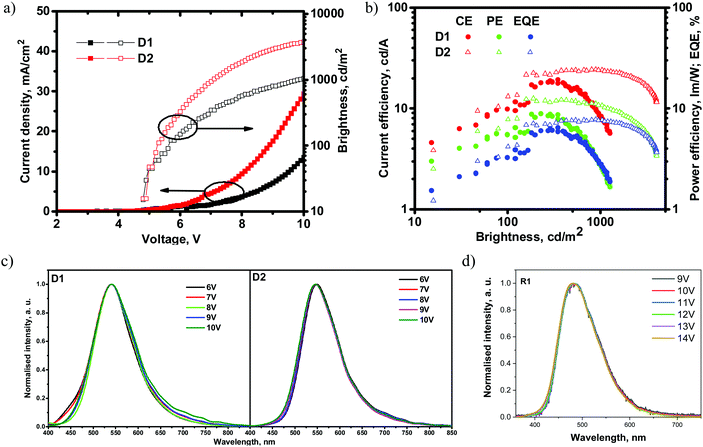
Fig. 10 and Table 5 show the EL characteristics of the exciplex-based OLEDs with derivatives 1 and 2. The overall OLED characteristics were better with D2, which was based on the emissive layer of the exciplex system 2: PO-T2T. OLED D2 showed a higher brightness of 4100 cd m−2, while that of D1 reached 1250 cd m−2. Also, D2 showed higher maximum current (CE), power (PE) and external quantum (EQE) efficiencies of 24.8 cd A−1, 12.2 lm W−1 and 7.8%, respectively. The corresponding characteristics of D1 were found to be 19.7 cd A−1, 12.2 lm W−1 and 6.5% (Table 5). The efficiency roll-off of D2 was better than that of D1 possibly because of the higher thermal stability of compound 2 relative to that of compound 1 (Table 1). When brightness was increased from 100 cd m−2 to 1000 cd m−2, the current, power and external quantum efficiencies also increased apparently due to the better charge carrier balance within the light-emitting layer at higher applied voltages. It should be noted that EQE values of both devices did not correlate with the PLQY values of solid films of 1 and 2. A similar observation was reported by Monkman et al.,38 who also used exciplex-forming mixtures with low PLQYs of films to obtain OLEDs with a high EQE. To the best of our knowledge, these are the best characteristics so far obtained from exciplex systems containing a fluorinated acceptor.28
| Device | λ max (nm) | V on (V) | Brightnessmax (cd m−2) | CE/PE/EQE (cd A−1/lm W−1/%) | CE/PE/EQE (cd A−1/lm W−1/%) | CE/PE/EQE (cd A−1/lm W−1/%) |
|---|---|---|---|---|---|---|
| Max | @100 cd m−2 | @1000 cd m−2 | ||||
| D1 | 541 | 4.8 | 1250 | 19.7/8.4/6.5 | 9.9/5.5/3.3 | 8.5/2.7/2.8 |
| D2 | 546 | 4.8 | 4100 | 24.8/12.2/7.8 | 13.2/7.8/4.2 | 24.3/10.7/7.7 |
Fig. 10c shows the electroluminescence (EL) spectra of D1 and D2. The EL spectra of the devices did not correlate with the PL spectra of 1: PO-T2T and 2: PO-T2T (Fig. 7). PL spectra were observed in the blue region (Fig. 7), while the EL spectra were in the green region (Fig. 10c). This result is quite intriguing since there is no such functional material in the device structure that could be characterized by a similar green emission. This observation may be explained by the formation of lower energy exciplexes, which were detected for other exciplex-forming mixtures such as mCP:PO-T2T.37 To prove this presumption, PL spectra of the films of the mixtures 1: PO-T2T and 2: PO-T2T were recorded before and after thermal annealing at ca. 120 °C trying to separate the lower energy exciplexes (Fig. S16, ESI†). Indeed, the annealed film of 1: PO-T2T showed a red-shifted PL spectrum peaking at 505 nm in comparison to the PL spectrum of the non-annealed film (489 nm). Meanwhile, the PL spectra of the non-annealed and annealed films of 2: PO-T2T were practically identical. This experimental result does not fully explain the differences between the PL and EL spectra of 1: PO-T2T and 2: PO-T2T (Fig. 8a, 10c and Table 5).
On the another hand, the EL spectra of devices D1 and D2 can be affected by exciplex emission of other exciplex-forming systems, especially knowing that exciplexes can be formed at the interfaces or even through spacers.39,40 In principle, at least several exciplex-forming systems, such as: mCP:PO-T2T (472 nm),41–43 TAPC:PO-T2T (550 nm),44 and TAPC:TPBi (442 nm),44 could be formed in the devices. In addition, TAPC is characterized by excimer (450 nm) and electromer (580 nm) emission,45 although none of these species emit in the green region. To determine the origin of EL emission, the device structure was simplified to the following one: ITO/HAT-CN (10 nm)/TCTA (40 nm)/compound 1 (4 nm)/compound 1: PO-T2T (24 nm)/PO-T2T (40 nm)/LiF/Al (device R1). This device R1 was used as the reference, and the layers of TAPC, mCP and TPBi were replaced by those of tris(4-carbazoyl-9-ylphenyl)amine (TCTA), compound 1, and PO-T2T, respectively. As a result, the EL spectrum of device R1 peaking at 480 nm was very similar to the PL spectrum of 1: PO-T2T (Fig. 7 and 10d). The simplified device R1 showed a relatively high turn-on voltage of 9.8 V and maximum EQE of 3.4% (Fig. S17, ESI†). Having the EL spectra of the device R1, it can be concluded that the EL spectra of devices D1 and D2 most probably resulted from overlapping of emissions of exciplexes of 1: PO-T2T (2: PO-T2T) and the TAPC-based exciplex TAPC:PO-T2T (or electromer of TAPC). As a result of such overlapping, green electroluminescence was obtained for devices D1 and D2. Similar EL behaviour was previously discussed elsewhere.46 Blue- and red-shifted EL spectra were well reproduced for other configurations of TAPC-free and TAPC-containing devices, respectively (Fig. S18, ESI†). These observations prove the presumption of overlapping of two or more EL species.
Conclusions
Two derivatives of trifluorobiphenyl and 3,6-di-tert-butylcarbazole were synthesised as potential components for emitting layers in OLEDs. Different experimental characterization methods and different DFT methods using the default- and tuned ω parameter were used to explore the structural, redox, and optoelectronic properties of the two compounds. The results indicate that the additional carbazole on compound 2 adds an additional electron rich unit for the formation of the donor–acceptor exciplex, but it has a minimal effect on the energy levels of compound 2 relative to compound 1. The synthesised compounds exhibited very high triplet-energy values of 3.03 eV and 3.06 eV in solutions, respectively. However, the singlet–triplet energy splitting, reaching 0.64 eV, was too high for the materials to be used alone as TADF emitters, but the compounds showed good exciplex-forming abilities in combination with the electron acceptor 2,4,6-tris[3-(diphenylphosphinyl)phenyl]-1,3,5-triazine. Using the synthesized compounds, highly efficient exciplex-based OLEDs were developed. In the best case, high maximum current, power and external quantum efficiencies of 24.8 cd A−1, 12.2 lm W−1 and 7.8%, respectively, were achieved for the devices based on exciplex electroluminescence.Conflicts of interest
There are no conflicts to declare.Acknowledgements
R. K. and L. L. acknowledge the Research, Development and Innovation Fund of Kaunas University of Technology (project grant no. PP-91C/19) for the financial support. The authors acknowledge the European Union's Horizon 2020 Research and Innovation Programme under the Marie Skłodowska-Curie grant agreement no. 823720. J. C. and P. J. S. also thank the EPSRC for funding (EP/N035496/2). Data associated with theoretical calculations is available at http://dx.doi.org/10.5525/gla.researchdata.1061.References
- T.-A. Lin, T. Chatterjee, W.-L. Tsai, W.-K. Lee, M.-J. Wu, M. Jiao, K.-C. Pan, C.-L. Yi, C.-L. Chung, K.-T. Wong and C.-C. Wu, Adv. Mater., 2016, 28, 6976–6983 CAS.
- X. Liang, H. B. Han, Z. P. Yan, L. Liu, Y. X. Zheng, H. Meng and W. Huang, New J. Chem., 2018, 42, 4317–4323 CAS.
- K. Shizu, H. Noda, H. Tanaka, M. Taneda, M. Uejima, T. Sato, K. Tanaka, H. Kaji and C. Adachi, J. Phys. Chem. C, 2015, 119, 26283–26289 CrossRef CAS.
- P. Data, M. Okazaki, S. Minakata and Y. Takeda, J. Mater. Chem. C, 2019, 7, 6616–6621, 10.1039/C9TC00909D.
- D. Wei, F. Ni, Z. Wu, Z. Zhu, Y. Zou, K. Zheng, Z. Chen, D. Ma and C. Yang, J. Mater. Chem. C, 2018, 6, 11615–11621 RSC.
- R. Komatsu, H. Sasabe, Y. Seino, K. Nakao and J. Kido, J. Mater. Chem. C, 2016, 4, 2274–2278 RSC.
- T. Komino, H. Nomura, T. Koyanagi and C. Adachi, Chem. Mater., 2013, 25, 3038–3047 CrossRef CAS.
- J. W. Sun, J.-H. Lee, C.-K. Moon, K.-H. Kim, H. Shin and J.-J. Kim, Adv. Mater., 2014, 26, 5684–5688 CrossRef CAS.
- H.-B. Kim, D. Kim and J.-J. Kim, Highly Efficient OLEDs, Wiley-VCH Verlag GmbH & Co. KGaA, Weinheim, Germany, 2018, pp. 331–376 Search PubMed.
- M. Chapran, E. Angioni, N. J. Findlay, B. Breig, V. Cherpak, P. Stakhira, T. Tuttle, D. Volyniuk, J. V. Grazulevicius, Y. A. Nastishin, O. D. Lavrentovich and P. J. Skabara, ACS Appl. Mater. Interfaces, 2017, 9, 4750–4757 CrossRef CAS.
- T.-C. Lin, M. Sarma, Y.-T. Chen, S.-H. Liu, K.-T. Lin, P.-Y. Chiang, W.-T. Chuang, Y.-C. Liu, H.-F. Hsu, W.-Y. Hung, W.-C. Tang, K.-T. Wong and P.-T. Chou, Nat. Commun., 2018, 9, 3111 CrossRef.
- B. Zhang and Z. Xie, Front. Chem., 2019, 7, 306 CrossRef CAS.
- D. D. Gebler, Y. Z. Wang, J. W. Blatchford, S. W. Jessen, D.-K. Fu, T. M. Swager, A. G. Macdiarmid and A. J. Epstein, Exciplex emission in bilayer polymer light-emitting devices, Appl. Phys. Lett., 1997, 70, 1644–1646 CrossRef CAS.
- K. Goushi, K. Yoshida, K. Sato and C. Adachi, Nat. Photonics, 2012, 6, 253–258 CrossRef CAS.
- V. Lukeš, D. Cagardová, M. Michalík and P. Poliak, Synth. Met., 2018, 240, 67–76 CrossRef.
- M. D. Curtis, J. Cao and J. W. Kampf, J. Am. Chem. Soc., 2004, 126, 4318–4328 CrossRef CAS.
- S. A. Sharber, R. N. Baral, F. Frausto, T. E. Haas, P. Müller and S. W. Thomas III, J. Am. Chem. Soc., 2017, 139, 5164–5174 CrossRef CAS.
- A. Mukherjee and G. R. Desiraju, Cryst. Growth Des., 2011, 11, 3735–3739 CrossRef CAS.
- Y. Kumar, S. Kumar, S. Kumar Keshri, J. Shukla, S. S. Singh, T. S. Thakur, M. Denti, A. Facchetti and P. Mukhopadhyay, Org. Lett., 2016, 18, 472–475 CrossRef CAS.
- G. Conboy, H. J. Spencer, E. Angioni, A. L. Kanibolotsky, N. J. Findlay, S. J. Coles, C. Wilson, M. B. Pitak, C. Risko, V. Coropceanu, J.-L. Brédas and P. J. Skabara, Mater. Horiz., 2016, 3, 333–339 RSC.
- P. Boufflet, Y. Han, Z. Fei, N. D. Treat, R. Li, D.-M. Smilgies, N. Stingelin, T. D. Anthopoulos and M. Heeney, Adv. Funct. Mater., 2015, 25, 7038–7048 CrossRef CAS.
- J. R. Loader, S. Libri, A. J. H. M. Meijer, R. N. Perutz and L. Brammer, CrystEngComm, 2014, 16, 9711–9720 RSC.
- H. Luo, X. Dong, Z. Cai, L. Wang and Z. Liu, Asian J. Org. Chem., 2018, 7, 592–597 CrossRef CAS.
- Y. Sakamoto, T. Suzuki, M. Kobayashi, Y. Gao, Y. Fukai, Y. Inoue, F. Sato and S. Tokito, J. Am. Chem. Soc., 2004, 126, 8138–8140 CrossRef CAS.
- Z. Chen, W. Zhang, J. Huang, D. Gao, C. Wei, Z. Lin, L. Wang and G. Yu, Macromolecules, 2017, 50, 6098–6107 CrossRef CAS.
- T. X. Carroll, T. D. Thomas, H. Bergersen, K. J. Børve and L. J. Sæthre, J. Org. Chem., 2006, 71(5), 1961–1968 CrossRef CAS.
- M. Gsänger, D. Bialas, L. Huang, M. Stolte and F. Würthner, Adv. Mater., 2016, 28, 3615–3645 CrossRef.
- M. Mamada, G. Tian, H. Nakanotani, J. Su and C. Adachi, Angew. Chem., Int. Ed., 2018, 57, 12380–12384 CrossRef CAS.
- L. Liu, B. Yang, H. Zhang, S. Tang, Z. Xie, H. Wang, Z. Wang, P. Lu and Y. Ma, J. Phys. Chem. C, 2008, 112, 10273–10278 CrossRef CAS.
- X. Sallenave, A. Bucinskas, S. Salman, D. Volyniuk, O. Bezvikonnyi, V. Mimaite, J. V. Grazulevicius and G. Sini, J. Phys. Chem. C, 2018, 122, 10138–10152 CrossRef CAS.
- C. M. Cardona, W. Li, A. E. Kaifer, D. Stockdale and G. C. Bazan, Adv. Mater., 2011, 23, 2367–2371 CrossRef CAS.
- R. Rybakiewicz, P. Gawrys, D. Tsikritzis, K. Emmanouil, S. Kennou, M. Zagorska and A. Pron, Electrochim. Acta, 2013, 96, 13–17 CrossRef CAS.
- M. Y. Wong and E. Zysman-Colman, Adv. Mater., 2017, 29(22), 1605444, DOI:10.1002/adma.201605444.
- R. L. Martin, J. Chem. Phys., 2003, 118, 4775–4777 CrossRef CAS.
- S. A. Jenekhe and J. A. Osaheni, Science, 1994, 265, 765–768 CrossRef CAS.
- W.-Y. Hung, G.-C. Fang, Y.-C. Chang, T.-Y. Kuo, P.-T. Chou, S.-W. Lin and K.-T. Wong, ACS Appl. Mater. Interfaces, 2013, 5, 6826–6831 CrossRef CAS.
- M. Guzauskas, D. Volyniuk, A. Tomkeviciene, A. Pidluzhna, A. Lazauskas and J. V. Grazulevicius, J. Mater. Chem. C, 2019, 7, 25–32 RSC.
- M. Colella, A. Danos and A. P. Monkman, J. Phys. Chem. Lett., 2019, 10, 793–798 CrossRef CAS.
- M. Cekaviciute, J. Simokaitiene, D. Volyniuk, G. Sini and J. V. Grazulevicius, Dyes Pigm., 2017, 140, 187–202 CrossRef CAS.
- Y. J. Pu, Y. Koyama, D. Otsuki, M. Kim, H. Chubachi, Y. Seino, K. Enomoto and N. Aizawa, Chem. Sci., 2019, 10, 9203–9208 RSC.
- J. H. Lee, S. H. Cheng, S. J. Yoo, H. Shin, J. H. Chang, C. I. Wu, K. T. Wong and J. J. Kim, Adv. Funct. Mater., 2015, 25, 361–366 CrossRef CAS.
- P. Yuan, X. Guo, X. Qiao, D. Yan and D. Ma, Adv. Opt. Mater., 2019, 7, 1801648 CrossRef.
- X.-K. Liu, Z. Chen, C.-J. Zheng, C.-L. Liu, C.-S. Lee, F. Li, X.-M. Ou and X.-H. Zhang, Adv. Mater., 2015, 27, 2378–2383 CrossRef CAS.
- X. Wei, L. Gao, Y. Miao, Y. Zhao, M. Yin, H. Wang and B. Xu, J. Mater. Chem. C, 2020, 8, 2772–2779 RSC.
- S. Yang and M. Jiang, Chem. Phys. Lett., 2009, 484, 54–58 CrossRef CAS.
- E. Skuodis, A. Tomkeviciene, R. Reghu, L. Peciulyte, K. Ivaniuk, D. Volyniuk, O. Bezvikonnyi, G. Bagdziunas, D. Gudeika and J. V. Grazulevicius, Dyes Pigm., 2017, 139, 795–807 CrossRef CAS.
Footnote |
| † Electronic supplementary information (ESI) available. See DOI: 10.1039/d0tc02777d |
| This journal is © The Royal Society of Chemistry 2020 |

