Monochromatic red electroluminescence from a homodinuclear europium(III) complex of a β-diketone tethered by 2,2′-bipyrimidine†
Received
4th May 2020
, Accepted 26th May 2020
First published on 26th May 2020
Abstract
A new homodinuclear complex [Eu(btfa)3]2bpm (1) was synthesized incorporating 4,4,4-trifluoro-1-phenyl-1,3-butanedione (btfa) as the primary and 2,2′-bipyrimidine (bpm) as the auxiliary ligand. The complex was characterized by analytical and spectroscopic techniques, with special emphasis on the crystal structure and photoluminescence (PL) properties, both experimentally and theoretically. Single crystal X-ray diffraction (SCXRD) analysis reveals that the two Eu(III) ions in 1 are eight coordinate, where the bpm behaves as a N4 donor linking the two Eu(III) ions symmetrically. Each Eu(III) ion displays a distorted square antiprismatic (DSAP, D4d) coordination geometry. Complex 1 displayed bright red emission with (CIE)x,y color coordinates = 0.670; 0.330 and an absolute photoluminescence quantum yield (PLQY) of 54.4%. The theoretical intensity parameters (Ω2 and Ω4), radiative (AR) and non-radiative (ANR) decay rates, intrinsic quantum yield (QEuEu), sensitization efficiency (ηsen) and PLQY were assessed using the LUMPAC software and showed very good agreement with the experimental values. Based on these, an energy transfer (ET) mechanism is proposed and discussed. Moreover, 1 was used as an emitter to fabricate single- and double-emitting layer (EML) red-emitting electroluminescent devices. Double-EML device at the optimum doping concentration of 4.0 wt% displayed impressive EL performances, brightness (B) = 812 cd m−2, maximum current efficiency (ηc) = 3.97 cd A−1, maximum power efficiency (ηp) = 3.89 lm W−1, and external quantum efficiency (EQE) = 2.8% at very low Vturn-on = 3.2 V with (CIE)x,y = 0.662, 0.321 which is close to the standard red color recommended by NTSC (0.67, 0.33).
1. Introduction
An upsurge in interest has occurred in the synthesis of highly photoluminescent organometallic complexes because of their potential use as an emitting layer (EML) in organic light-emitting diodes (OLEDs)1 for flat displays and solid-state lighting (SSL). Among the organo lanthanides, europium complexes (ECs) have received particular attention because of the presence of electric-dipole (ED) 5D0 → 7F2 transitions in the range of 611–616 nm with 80–90% total contribution of integral intensity and full width at half maximum (FWHM) 3–10 nm.2 Thus ECs are useful candidates for generating highly monochromatic red emissions. Moreover, such complexes display PLQY of up to 80% with a sensitization efficiency (ηsen) of 97% (close to 100%).2a,3
Although a range of mononuclear ECs has been synthesized and utilized as the emitting layer (EML) to fabricate red EL devices,4 synthesis of homodinculear ECs5 and OLED devices based on dinuclear complexes are scarce. A small number of OLEDs have been reported in the literature for homodinuclear Eu(III) complexes, for example, Jang et al.,6 reported the red emitting (CIEx,y = 0.66, 0.34) EL device of [Eu(dbm)3]2bpm complex (dbm = dibenzoylmethane), exhibiting maximum brightness (B) of 25.4 cd m−2 at voltage (V) = 16 V with the EQE of 0.021% at 11 V. Later Ma et al.,7 reported a dinuclear complex [Eu(tta)3PyO]2 (tta = thenoyltrifluoroacetonate, PyO = pyridine N-oxide) and its doped OLEDs which displayed a B = 340 cd m−2 at V = 19 V and a current efficiency of 2.4 cd A−1 at a current density of 0.14 mA cm−2, respectively. Liu et al.,8 synthesized a homodinuclear complex [Eu2(dbm)6(FPhOXD6Cz-Phen2)] and fabricated an EL device. The device with 4 wt% dopant concentration exhibited a maximum brightness of 48.5 cd m−2 at a driving voltage of 13.5 V. Later the same group9 synthesized two bis-derivatives of phenanthroline and reported their similar homodinuclear complexes by replacing the primary dbm by tta. The device with 8 wt% dopant concentration exhibited a B = 100.5 cd m−2 at V = 13.8 V with CIE color coordinates in the red region 0.644, 0.333. In order to expand the range of homodinuclear Eu-based EL materials and improve the efficiency of red-emitting devices incorporating homodinuclear ECs, we have synthesized a [Eu(btfa)3]2bpm (1) complex (Scheme 1) by utilizing a bridging bpm ligand. The rationale for choosing btfa as the primary ligand are manifold: (a) asymmetric nature of the ligand is likely to enhance ED transition probability2a,10 and (b) the presence of low-energy C–F oscillators in the trifluoromethyl (–CF3) group significantly decreases the nonradiative losses of the lanthanides, thereby enhancing the PL of the lanthanide complexes.11 Moreover, the presence of the btfa ligand usually induces extensive hydrogen bonding involving C–H, N–H and O–H bonds to form intriguing two-dimensional structures through intermolecular interactions and consequently diminishes the role of high energy oscillators (C–H, N–H and O–H) and thus improves PL properties.1b It is important to emphasize that the detailed photophysical properties such as radiative (AR) and non-radiative (ANR) decay rates, the Judd–Ofelt (J–O) intensity parameter (Ω2 and Ω4), radiative lifetime (τrad), intrinsic quantum yield (QEuEu), sensitization efficiency (ηsen) and, most importantly, the energy transfer (ET) mechanism, forward (WET) and backward (WBT) ET rates have not been reported so far in these types of homodinuclear complexes. In this paper, we have analyzed the photophysical properties of complex 1 and discussed them in detail, both experimentally and theoretically. Finally, complex 1 was successfully employed as an emitter to fabricate single- and double-EML red-emitting EL devices.
 |
| | Scheme 1 Synthesis of homodinuclear complex [Eu(btfa)3]2bpm (1) at RT. | |
2. Experimental section: materials and instrumentation
All chemicals were procured from commercial sources and used without further purification unless otherwise specified. Eu(III) chloride was purchased from Strem Chemicals, Inc. The precursor complex [Eu(btfa)3(H2O)2]2a was synthesized using literature procedures. Solvents used in the experiments were dried and distilled prior to use. Elemental analysis of 1 was performed on Euro EA-CHN Elemental Analyser. The attenuated total-reflectance (ATR) infrared (IR) spectrum of the pure solid sample was recorded on diamond using a Cary 630 FT-IR spectrometer. The electrospray ionization mass spectrum (ESI-MS) was obtained using a VG Autospec magnetic sector instrument.
2.1. Synthesis of [Eu(btfa)3]2bpm (1)
[Eu(btfa)3]2bpm (1).
The homodinuclear complex 1 was synthesized by adding an ethanolic solution of bpm (0.049 g, 0.307 mmol) dropwise to an ethanolic solution of [Eu(btfa)3(H2O)2]2a (0.51 g, 0.615 mmol) (Scheme 1). The reaction mixture was stirred overnight at room temperature (RT) and left for slow solvent evaporation for a week, after which period the mother liquor was decanted and the solid was washed with ice-cold ethanol followed by hexane and dried in the air. Calculated for C68H42Eu2F18N4O12: C, 46.59; H, 2.42; N, 3.20%, found C, 46.63; H, 2.41; N, 3.21%; ESI-MS+ ∼1775.5 for [(1) + Na], (Fig. S1, ESI†); FT-IR (solid; cm−1) ν(C![[double bond, length as m-dash]](https://www.rsc.org/images/entities/char_e001.gif) O)st. ∼ 1607, ν(C–F)st ∼ 1282 (Fig. S2, ESI†); melting point (Tm) = 216 °C, decomposition temperature (Td) at 5% weight = 301 °C.
O)st. ∼ 1607, ν(C–F)st ∼ 1282 (Fig. S2, ESI†); melting point (Tm) = 216 °C, decomposition temperature (Td) at 5% weight = 301 °C.
2.2. Single crystal X-ray diffraction analyses
The single-crystal X-ray structure determination was performed at room temperature on a Stoe IPS II diffractometer using monochromatic Mo-Kα radiation (λ = 0.71073 Å). A multiscan absorption correction was applied. The data reduction, including an empirical absorption correction using spherical harmonics, was implemented in LANA. The crystal structure was solved by direct methods using the online version of WinGX12 and then refined by full-matrix least-squares (SHELXL-2018) on F2.13 The non-hydrogen atoms were refined anisotropically. All of the hydrogen atoms were positioned geometrically in idealized positions and refined with the riding model approximation, with Uiso(H) = 1.2 Ueq(C). The molecular graphics were produced using the program MERCURY from the CSD package.14
2.3. Spectroscopic measurements and photophysical parameters
The details of the spectroscopic measurements of 1 are included in the ESI.† Important experimental photophysical parameters such as Ω2, Ω4, AR, ANR, τrad, QEuEu and ηsen were calculated using the following equations (1)–(7) and details are reported elsewhere.2c,e| |  | (1) |
| |  | (2) |
| |  | (3) |
| |  | (4) |
| |  | (6) |
| |  | (7) |
2.4. Computational chemistry: energy transfer (ET) rates
For proposing an ET mechanism in a given complex, it is necessary to obtain the theoretical ground state geometry of the complex. In view of this we have first optimized the ground state geometry of 1. Details of the ground state geometry optimization, singlet (S) and triplet (T) energy level and theoretical Judd–Ofelt (J–O) intensity parameter (Ω2 and Ω4) calculations are included in the ESI.† The ET rates involving the main ET channels for 1 were calculated with Malta's model,15 implemented into LUMPAC.16 According to this model, the ligand-metal ET by considering only the direct Coulombic interaction is calculated by:| |  | (8) |
| |  | (9) |
As a result of the reduced matrix element  , the multipolar mechanism (MM) governs the electronic excitation of the states 5D4 ← 7F0, 5G6 ← 7F0, and 5L6 ← 7F0 for Eu(III) ion, and the values of
  were taken from the work of Carnall et al..17 The ΩFEDλ corresponds to the forced electric dipole intensity parameters taken from the eqn (S2) (ESI†) neglecting the contribution from the dynamic coupling (DC).
Another contribution to the ligand-metal ET is due to the exchange mechanism (ExM), which is calculated by:
| |  | (10) |
The approach considered in this work to estimate eqn (10) is the one recently revisited by the group led by Malta,18 where the (1 − σ0) term is calculated as a function of the distance from the Ln(III) ion nucleus to the electronic barycenter of the ligand donor (or acceptor) state (eqn (11)). This distance is known as RL, and for its determination, it is necessary to estimate the coefficients of the molecular orbital of the atom i (ci) that contribute to the ligand state. Besides, it is also essential to calculate the distances from atom i (RL,i) to the Ln(III) ion. The ρ quantity is the overlap integral (ca. 0.05) between the valence shells of the Ln(III) ion and the ligating atom and Rmin is the smallest distance in the first coordination sphere.
| |  | (11) |
| |  | (12) |
The ExM is operative for the excitations 5D1 ← 7F0 and 5D0 ← 7F1 for the Eu(III) ion; as a consequence of the matrix elements  , which provides the following selection rule: |ΔJ| = 0,±1 (J = J′ = 0 excluded) and ΔS = 0 for the Ln(III) ion, the spin–orbit coupling can relax the latter. Details of the terms in eqn (8)–(10) are widely discussed in the ref. 18. LUMPAC 1.4.1 was used to calculate the ET rates for 1.
The factor F in eqn (8) and (10) expresses the energy mismatch spectral overlap and can be approximated by the following expression:
| |  | (13) |
In eqn (13) it is assumed that ligand bandwidth at half-height, γL (in s−1), is much larger than the widths of the 4f–4f transitions, γLn of Ln(III) ions. Δ (in erg) is the energy difference between donor and acceptor energy levels involved in the ligand-metal ET. Back ET rate is obtained simply by multiplying the direct ET rate by the Boltzmann factor e−|Δ|kBT, where T is considered as being the environment temperature and kB stands for the Boltzmann constant. Details of the theoretical quantum yield determination is included in the ESI.†
2.5. Fabrication of EL devices
The molecular structures of the materials used in the fabrication process are shown in Chart S1, ESI.† Indium titanium oxide (ITO) coated glass with the sheet resistance of 10 Ω sq−1 was used as the anode substrate. Prior to film deposition, patterned ITO substrates were cleaned with detergent, rinsed in de-ionized water, and finally dried in an oven. All organic layers were deposited at a rate of 0.1 nm s−1 under high vacuum (≤3.0 × 10⁻⁵ Pa). The doped EMLs were prepared by co-evaporating dopant and host material from two or three individual sources, and the doping concentration was modulated by controlling the evaporation rate(s) of dopant(s). LiF and Al were deposited in another vacuum chamber (≤8.0 × 10⁻⁵ Pa) at the rates of 0.01 and 1.0 nm s−1, respectively, without being exposed to the atmosphere. The thicknesses of these deposited layers and the evaporation rate of individual materials were monitored in a vacuum with quartz crystal monitors. A shadow mask was used to define the cathode and make eight emitting dots with an active area of 9 mm2 on each substrate. Current density–brightness–voltage (J–B–V) characteristics were measured by using a programmable brightness light distribution characteristics measurement system C9920-11. PL and EL spectra were measured with a calibrated Hitachi F-7000 fluorescence and an Ocean Optics spectrophotometer.
3. Results and discussion
3.1. Synthesis, characterization and single crystal X-ray structure
The synthesis of symmetrical homodinuclear complex, [Eu(btfa)3]2bpm (1) is shown in Scheme 1. Complex 1 was characterized by elemental analysis, FT-IR and ESI-MS and is soluble in common organic solvents (except hexane and carbon tetrachloride). The results attest to the stoichiometry proposed in Scheme 1 that each of the “Eu(btfa)3” fragments is coordinated to the bridging bpm ligand in a symmetrical fashion and this ancillary ligand behaves as a tetradentate N4 donor. To determine the solid-state structure of 1 suitable crystal was analyzed by a single-crystal X-ray analysis. The crystal structure (Fig. 1a) confirms the dinuclear structure for 1 in which the bpm ligand symmetrically bridges two Eu(III) centers (data are included in Tables S1–S7, ESI†) as postulated in Scheme 1. The asymmetric unit of the triclinic unit cell (space group P![[1 with combining macron]](https://www.rsc.org/images/entities/char_0031_0304.gif) ) contains half of the molecule with the symmetry related half being generated by a crystallographic center of symmetry which lies at the center of the bridging bpm ligand. The Eu(III) centers adopt an 8-coordinate geometry in a N2O6 ligand environment due to the presence of three chelating btfa groups. The Eu···Eu distance is ca. 6.914 Å and the Eu–O and Eu–N bond distances are comparable to those in previously published related molecules.5d The Eu–N bonds [to N(1) and N(2), from the ligand] are particularly long at 2.636(5) and 2.637(5) Å, respectively being partly pushed out of the coordination sphere whereas all Eu–O bonds are short, in the ranges of 2.337(4)–2.357(4) Å. The N(1)–Eu(1)–N(2) angles is 61.22(14)° whereas the O–Eu–O are in the ranges of 72.08(16)°–84.86(16)° and 112.31(17)°–49.50(16)°. As discussed in the introduction, the packing diagram of the complex exhibits extensive hydrogen-bonding interactions of CH⋯F between adjacent molecules to generate a two-dimensional network of molecules, Fig. 1(c). As mentioned above, we have optimized the ground state geometry of 1 computationally, the root-mean-square-deviation (RMSD) between the geometries optimized by B3LYP/SVP/MWB52 and PBE1PBE/SVP/MWB52 with the X-ray structure is 0.72 Å and 0.98 Å, respectively, omitting the hydrogen atoms. When only the two N2O6 polyhedra calculated are considered in the RMSD calculation, the corresponding values are 0.17 Å and 0.28 Å for B3LYP and PBE1PBE, respectively. Moreover, the geometry calculated with B3LYP is in excellent agreement with the experimental X-ray structure (Fig. S3, ESI†). The optimized B3LYP/SVP/MWB52 geometry (Fig. S4, ESI†) and angular data obtained is shown in Table S8, ESI† (Discussion is also included in the ESI†).
) contains half of the molecule with the symmetry related half being generated by a crystallographic center of symmetry which lies at the center of the bridging bpm ligand. The Eu(III) centers adopt an 8-coordinate geometry in a N2O6 ligand environment due to the presence of three chelating btfa groups. The Eu···Eu distance is ca. 6.914 Å and the Eu–O and Eu–N bond distances are comparable to those in previously published related molecules.5d The Eu–N bonds [to N(1) and N(2), from the ligand] are particularly long at 2.636(5) and 2.637(5) Å, respectively being partly pushed out of the coordination sphere whereas all Eu–O bonds are short, in the ranges of 2.337(4)–2.357(4) Å. The N(1)–Eu(1)–N(2) angles is 61.22(14)° whereas the O–Eu–O are in the ranges of 72.08(16)°–84.86(16)° and 112.31(17)°–49.50(16)°. As discussed in the introduction, the packing diagram of the complex exhibits extensive hydrogen-bonding interactions of CH⋯F between adjacent molecules to generate a two-dimensional network of molecules, Fig. 1(c). As mentioned above, we have optimized the ground state geometry of 1 computationally, the root-mean-square-deviation (RMSD) between the geometries optimized by B3LYP/SVP/MWB52 and PBE1PBE/SVP/MWB52 with the X-ray structure is 0.72 Å and 0.98 Å, respectively, omitting the hydrogen atoms. When only the two N2O6 polyhedra calculated are considered in the RMSD calculation, the corresponding values are 0.17 Å and 0.28 Å for B3LYP and PBE1PBE, respectively. Moreover, the geometry calculated with B3LYP is in excellent agreement with the experimental X-ray structure (Fig. S3, ESI†). The optimized B3LYP/SVP/MWB52 geometry (Fig. S4, ESI†) and angular data obtained is shown in Table S8, ESI† (Discussion is also included in the ESI†).
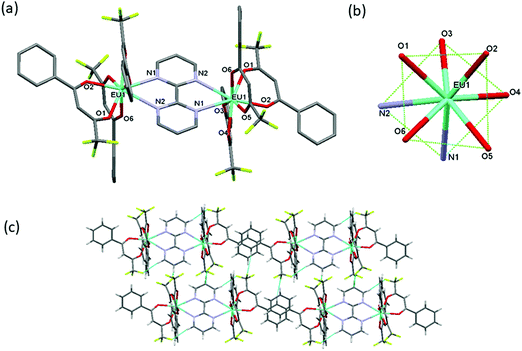 |
| | Fig. 1 (a) The molecular structure of the dinuclear complex 1 (b) coordination geometry of EuN2O6 polyhedron and (c) packing diagram displaying extensive CH···F interactions between adjacent molecules to generate a 2D-network. | |
To obtain greater insights into the nature of the coordination polyhedra around the Eu(III) center, the shape measure ‘S’ was estimated19 to evaluate the degree of distortion from an ideal 8-coordination geometry. The S-value is defined as the following expression:
where
m is the number of all possible edges, here
m = 18,
δi is the observed dihedral angle along the
ith edge of the experimental polyhedron
δ, and
θi is the same angle for the corresponding ideal polyhedral shape
θ. The most common eight-coordinate polyhedra are: the square antiprism (SAP,
D4d), the trigonal dodecahedron (DD,
D2d), and the bicapped trigonal prism (BTP,
C2v).
20 To calculate the value of the shape measure
S, all the donor atoms of the EuN
2O
6 polyhedron were arranged within six planes (Fig. S5, ESI
†), then the dihedral angles
δ and
θ were measured for adjacent triangular faces within each plane (Table S9, ESI
†). The calculated
S measures for
1, when compared to an ideal polyhedron, are:
S(
D4d) = 3.9°;
S(
D2d) = 5.0° and
S(
C2v) = 11.3°. These results show that the coordination polyhedron of the EuN
2O
6 center in
1 is best described as a slightly distorted square antiprism (SAP,
D4d).
3.2. Experimental and theoretical photophysical properties
The electronic spectrum of 1 was measured in dilute (1 × 10⁻⁵ M) DCM solution Fig. 2a. As a comparison, the spectrum of free bpm showed an intense π–π* transition at 254 nm. The spectrum of complex 1 displayed two well-defined absorption peaks at 260 nm and 323 nm originating from the π–π* transitions of both the bpm and btfa ligands. To understand the result more clearly, the absorption spectrum of 1 was calculated using the TD-DFT method (CAM-B3LYP, LC-BLYP, and PBE1PBE functionals) utilizing the B3LYP/SVP/MWB52 optimized geometry. Moreover, the effect of solvent DCM was also considered in the TD-DFT CAM-B3LYP calculation and the results clearly show that the inclusion of DCM did not provide much change in the absorption spectrum. Furthermore, the inclusion of more components for calculating the absorption spectrum does not vary significantly as the case for CAM-B3LPY and the TZVP basis set. When the X-ray structure was used for the CAM-B3LYP calculation instead of B3LYP geometry, the spectra are similar due to close agreement between the geometries. In addition for the CAM-B3LYP and LC-BLYP range-separated hybrid functionals, the spectra obtained from the B3LYP geometry are almost similar. Although Georgieva and coworkers21 have shown that the best functional for describing the absorption of [Eu(phen)2(NO3)3] complex is the PBE1PBE hybrid functional, for the complex studied here, PBE1PBE provided a spectrum that is substantially shifted for large values of wavelengths. Interestingly, INDO/S-CIS semiempirical model predicts the best result among all (Fig. 2b) and reproduced the experimental absorption spectrum, with a maximum of absorption at 249 and 286 nm.
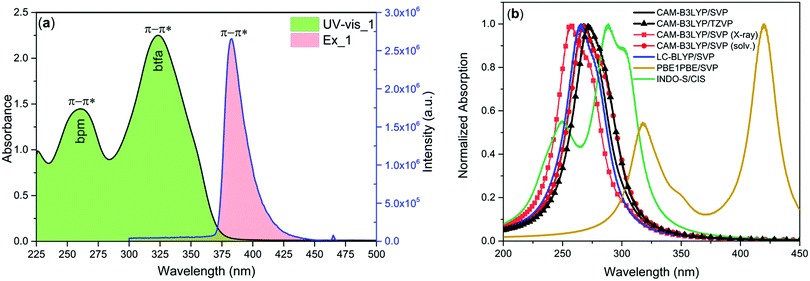 |
| | Fig. 2 (a) Electronic absorption and exciation spectra of 1 in DCM solution at RT. (b) Estimated electronic spectra by using different levels of theory for 1, considering the B3LYP geometry. | |
To further understand the origin of the transitions and involvement of the molecular orbitals (MOs), we performed the natural transition orbitals (NTOs) analysis (Fig. 3) that offers a simple representation of the transition density between the ground and the excited state.22 However, in some cases, many NTO transitions are provided for a given state and this occurred for the CAM-B3LYP/SVP/MWB52 level of theory, in which there are six relevant NTO transitions. Even so, the NTO analysis was useful to elucidate the orbital's nature involved in the UV electronic absorption transitions, such as shown in Fig. 3. It can be seen from Fig. 3 that the transition at 265 nm originates simultaneously from bpm and btfa while the transition at 278 nm emanates only from the primary btfa ligand. Moreover, the semiempirical INDO/S-CIS also provided qualitatively similar information to that extracted from the TD-DFT approach (Table S10 and Fig. S6, ESI†).
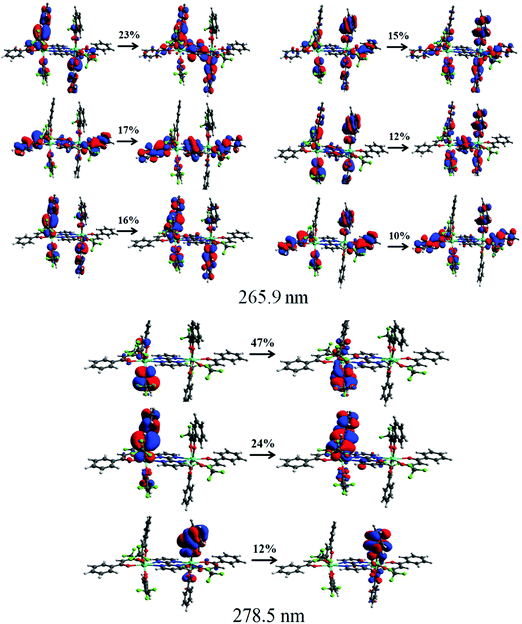 |
| | Fig. 3 Pictures of the NTOs mainly contributing to the singlet excited states corresponding to the absorption band at 265.8 and 278.5 nm calculated using the CAM-B3LYP/SVP//B3LYP/SVP with MWB52 ECP for Eu. The contribution percentages of the main NTOs are also included for each transition. | |
The steady-state excitation spectrum of 1 was obtained by monitoring the most intense emission transition 5D0 → 7F2 at 612 nm. The spectrum displays broadband between 300 and 450 nm with λmax = 382 nm and could be assigned to π–π* transition (Fig. 2a). Moreover, it displays a very faint intensity intraconfigurational f–f transition at 465 nm, suggesting that the antenna effect is dominant compared to the direct excitation at Eu(III) ion levels.2d
The PL spectrum of 1 was obtained by exciting it to λexmax = 382 nm and it displayed typical Eu(III) five emission transitions assigned to 5D0 → 7F0, 5D0 → 7F1, 5D0 → 7F2, 5D0 → 7F3, and 5D0 → 7F4, respectively as shown in Fig. 4. Details such as peak position, intensities relative to 5D0 → 7F1 transition and % contribution of each transition are tabulated in Table S11, ESI.† The spectrum is dominated by the ED hypersensitive 5D0 → 7F2 transition and contributes almost 80% of the total integral intensity and results in highly monochromatic (full width at half maximum (FWHM) = 4.71 nm, Table 1) red emission with (CIE)x,y color coordinates = 0.670; 0.330 (Fig. S7, ESI† and Table 1) similar to the National Television System Committee (NTSC) (x − 0.67; y − 0.33). Thus 1 could serve as dopant to fabricate red emitting EL. From the steady-state PL emission spectrum together with the time-resolved emission measurement, a range of important photophysical parameters can be obtained such as radiative (AR) and non-radiative (ANR) decay rate constants, Ω2 and Ω4, natural radiative lifetime (τrad) and intrinsic quantum yield (QEuEu). The data obtained are gathered in Table 1 utilizing the equations (1)–(7). Lifetime (τobs) of the 5D0 excited state of complex 1 was determined by the fitting of the decay curve (Fig S8, ESI† and Table 1). The decay curve fits well to mono-exponentail attributing to the single dominant emitting species and confirms the presence of a single unsplit 5D0 → 7F0 (% contribution 1.35% and FWHM = 1.26 nm) emission transition in the PL spectrum. 1 exhibited long τobs = 762.06 ± 1.87 μs and is similar to most dinuclear complexes reported in the literature.5d,23 To understand the effect of the ancillary bpm ligand on the photophysical properties of 1 fully, we further measured the steady-state PL and excited state τobs of the binary hydrated complex [Eu(btfa)3(H2O)2] under the same experimental conditions. The PL spectrum displayed as expected five well-resolved emission transitions, as discussed above (Fig. S9, ESI†) with lower intensities and shorter τobs = 175.66 ± 1.73 μs (Fig. S10, ESI†) than 1. The higher intensity and almost 4.35 times longer τobs of 1 could be attributed to the replacement of water molecules by the ancillary bpm ligand, which eventually decreases the ANR decay rate from 4853.38 s−1 to 380.34 s−1 (Table 1). The PLQY of 1 in solution showed a large value of 54.4% and the sensitization (ηsen) efficiency of 76.73%, which is 4.89 times higher than that of [Eu(btfa)3(H2O)2] (Table 1). These values suggest the potential of 1 to act a as dopant for red emitting OLEDs. The high PLQY and fast rate could be associated with two factors (Table 1). Firstly, the suppression of radiationless transitions is caused by vibrational excitations due to the presence of C–F bonds. Furthermore, the presence of C–F bonds minimizes the role of C–H oscillators by forming an extensive hydrogen bonds (CH⋯F, Fig. 1c). Secondly, achievement of strong ED 5D0 → 7F2 transition is due to the asymmetrically distorted square antiprism geometric structure.24 Finally, the Ω2 and Ω4 parameter is calculated (Table 1), the high values of Ω2 = 28.25 × 10⁻²⁰ cm2 together with high R21 = 16.02 suggests that Eu(III) ion in 1 is surrounded by a highly polarizable environment.2c Parameter Ω4 is related to the long-range effects such as hydrogen bonding and π–π stacking. The substantial large value, Ω4 ≈ 8.50 × 10⁻²⁰ cm2 of this parameter is an indication of the presence of these effects and further attested by the single crystal X-ray structure which showed extensive hydrogen bonding interactions of CH⋯F (Fig. 1c). Table 1 shows the intensity parameters calculated for the X-ray and B3LYP geometries, and the best agreement was obtained with the X-ray crystal structure geometry. The calculation of the wavefunction to obtain the quantities necessary to evaluate the values of charge factor and the polarizability of atoms directly coordinated to the Eu(III) ion (electronic densities and electrophilic superdelocalizabilities) was carried out using the RM1 semiempirical model (Table S12, ESI†). As shown in Table S9, ESI,† the D/C ratio is about 2.0 for the complex, and this indicates that the experimental intensity parameters were well adjusted.25
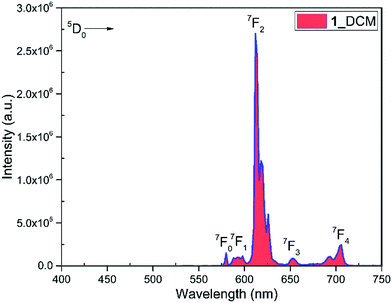 |
| | Fig. 4 PL spectrum of complex 1 in DCM (1 × 10⁻³ M) at RT. | |
Table 1 Experimental and theoretical photophysical parameters of complex 1 at room temperature
|
|
Ω
2
|
Ω
4
|
FWHM (nm) |
τ
obs
|
τ
rad
|
A
R
|
A
NR
|
Q
EuEu
|
Q
LEu
|
R
21
|
η
sen
|
CIE(x,y) |
| ×10−20 cm2 |
(μs) |
(s−1) |
(%) |
(%) |
|
Calculated using eqn (1).
Calculated using eqn (5).
Calculated using eqn (2) and (3).
Calculated using eqn (4).
Calculated using eqn (6).
Calculated using eqn (7). Value in the square parentheses are for [Eu(btfaa)3(H2O)2] and were determined using eqn (1–7).
|
|
1
|
28.25a |
8.50a |
1.26; 4.70 |
762.06 ± 1.87 |
1072b |
932c |
380.34d |
71.02e |
54.5 |
16.02 |
76.73f |
0.670; 0.330 |
| [25.85] |
[10.05] |
|
[175.66 ± 1.73] |
[1122] |
[860.91] |
[4853.38] |
[15.07] |
— |
[14.63] |
[15.68] |
0.668; 0.330 |
| Theoretical (X-ray) |
27.32 |
10.49 |
— |
— |
|
878.13 |
434.04 |
66.92 |
60.31 |
— |
90.13 |
— |
| Theoretical (B3LYP) |
20.79 |
14.65 |
— |
— |
|
764.40 |
547.7 |
58.26 |
52.61 |
— |
90.30 |
— |
3.3. Intermolecular energy transfer (IET) mechanism
We have calculated 25 triplet excited states (T1–T25) for 1 and each state is characterized by some electronic transitions involving MOs. Table 2 shows the relevant triplet states centered on the ligands coordinated to the Eu(III) ions in 1 as well as the electron transition configurations mainly contributing to the states. The lowest triplet state (T1 = 22531.3 cm−1) is mainly centered on the different btfa ligands and the states in the range of T2–T11 (not shown) have also a great contribution from the electronic transitions involving the β-diketonate ligand. On the other hand, the state with energy equal to 29938.1 cm−1 (T12) is the lowest triplet state predominantly centered on the bpm ligand. Such characterizations of the molecular groups were assigned based on the MOs presented in Fig. 5. For the calculation of the RL distance from a given donor to acceptor state is considered that the atomic coefficients involved in the virtual MOs that receive the electron density in the electronic transition. As all virtual MOs regarding the 29938.1 cm−1 state are centered in the bpm ligand (LUMO+9 MO is not shown in Fig. 5), the corresponding RL is lower than the one corresponding to the lowest triplet state.
Table 2 Electron transition configurations calculated with the CAM-B3LYP/SVP/MWB52//B3LYP/SVP/MWB53 for the most relevant triplet states of 1
| Energy |
Ligand |
R
L
|
Major contribution |
Total |
| 22531.3 cm−1 |
btfa |
6.28 Å |
HOMO−4 → LUMO+3 (16.90%) |
61.8% |
| HOMO → LUMO+3 (16.24%) |
| HOMO−1 → LUMO+3 (13.62%) |
| HOMO−5 → LUMO+3 (6.65%) |
| HOMO−4 → LUMO+4 (5.30%) |
| HOMO → LUMO+4 (3.07%) |
| 29938.1 cm−1 |
btfa–bpm |
4.37 Å |
HOMO−24 → LUMO (56.32%) |
90.4% |
| HOMO−26 → LUMO (25.21%) |
| HOMO−33 → LUMO+9 (6.46%) |
| HOMO−40 → LUMO+1 (2.41%) |
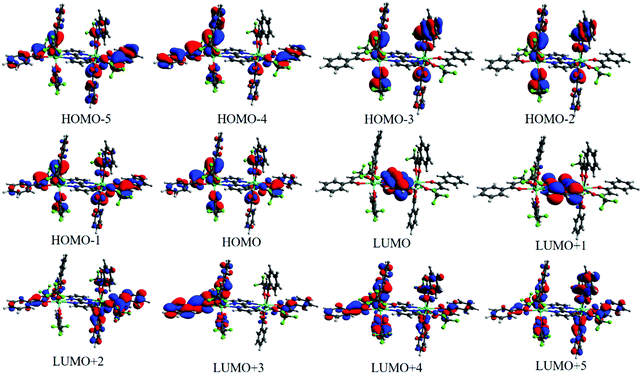 |
| | Fig. 5 MOs in the range from HOMO−5 to LUMO+5 calculated with the CAM-B3LYP/SVP/MWB52//B3LYP/SVP/MWB52 to help to understand the main MOs involved in each state. | |
In order to model the ET process of 1, the energy-level diagram is postulated and is shown in Fig. 6. The most relevant levels considered for the Eu(III) ion were 5D4 (∼27![[thin space (1/6-em)]](https://www.rsc.org/images/entities/char_2009.gif) 586 cm−1), 5D1 (∼19
586 cm−1), 5D1 (∼19![[thin space (1/6-em)]](https://www.rsc.org/images/entities/char_2009.gif) 027 cm−1), and 5D0 (∼17
027 cm−1), and 5D0 (∼17![[thin space (1/6-em)]](https://www.rsc.org/images/entities/char_2009.gif) 293 cm−1), and the energy-level values were taken from the work of Carnall et al.17 The ligand–metal ET rates presented in Fig. 6 were calculated employing the LUMPAC software package.16 The 5D4 ← 7F0 excitation in Eu(III) is governed by the MM mechanism, which depends on the forced electric dipole contribution for the intensity parameters (ΩFEDλ). These parameters were calculated using the QDC model and are shown in Table S12 (ESI†). The WET values are lower for the T(bfta–bpm) → 5D4 transfer channel, suggesting that the MM mechanism is not the dominant ET process in 1. On the other hand, the higher values of WET rate of T(bfta) → 5D1 ≈ 2.1 × 10⁷ s−1 and T(bfta) → 5D0 ≈ 1.5 × 10⁷ s−1 indicate the Dexter mechanism as being dominant for the ligand-to-metal ET process. It is important to mention that these ET are related to the 5D1 ← 7F0 and 5D0 ← 7F1 excitations, considering that the 7F1 state is thermally populated.2c We have further estimated the Eu(III) → Eu(III) ET rates in the present dinuclear complex. Rodrigues and coworkers26 estimated that for a Eu(III)–Eu(III) distance of around 4 Å, using Kushida's expressions27 by adapting Malta's work,15 the ET rate value related to the Eu(5D1) → Eu(5D0) energy channel is of the order of 104 s−1. Utilizing the same approach for the Eu(III)–Eu(III) distance in 1 studied here (ca. 7 Å), the value obtained is of the order of 102 s−1 and is not included in energy level diagram as the triplet → Eu(5D0) transfer is of the order of 107 s−1. The normalized populations for the states considered for the PL process were calculated considering all rates contained in Fig. 6. The populations associated with the S0 and 5D0 states (eqn (S8), ESI†) were equal to 0.13 and 0.87, respectively, providing a theoretical PLQY for 1 = 52.6%, which agrees very well with the experimental value.
293 cm−1), and the energy-level values were taken from the work of Carnall et al.17 The ligand–metal ET rates presented in Fig. 6 were calculated employing the LUMPAC software package.16 The 5D4 ← 7F0 excitation in Eu(III) is governed by the MM mechanism, which depends on the forced electric dipole contribution for the intensity parameters (ΩFEDλ). These parameters were calculated using the QDC model and are shown in Table S12 (ESI†). The WET values are lower for the T(bfta–bpm) → 5D4 transfer channel, suggesting that the MM mechanism is not the dominant ET process in 1. On the other hand, the higher values of WET rate of T(bfta) → 5D1 ≈ 2.1 × 10⁷ s−1 and T(bfta) → 5D0 ≈ 1.5 × 10⁷ s−1 indicate the Dexter mechanism as being dominant for the ligand-to-metal ET process. It is important to mention that these ET are related to the 5D1 ← 7F0 and 5D0 ← 7F1 excitations, considering that the 7F1 state is thermally populated.2c We have further estimated the Eu(III) → Eu(III) ET rates in the present dinuclear complex. Rodrigues and coworkers26 estimated that for a Eu(III)–Eu(III) distance of around 4 Å, using Kushida's expressions27 by adapting Malta's work,15 the ET rate value related to the Eu(5D1) → Eu(5D0) energy channel is of the order of 104 s−1. Utilizing the same approach for the Eu(III)–Eu(III) distance in 1 studied here (ca. 7 Å), the value obtained is of the order of 102 s−1 and is not included in energy level diagram as the triplet → Eu(5D0) transfer is of the order of 107 s−1. The normalized populations for the states considered for the PL process were calculated considering all rates contained in Fig. 6. The populations associated with the S0 and 5D0 states (eqn (S8), ESI†) were equal to 0.13 and 0.87, respectively, providing a theoretical PLQY for 1 = 52.6%, which agrees very well with the experimental value.
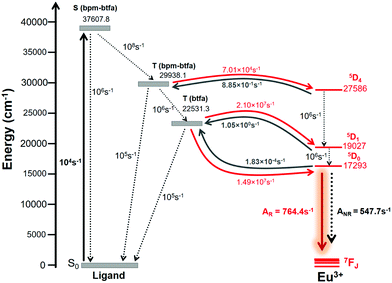 |
| | Fig. 6 Schematic energy-level diagram, ET processes, and transfer rates considered for 1. The rates shown are typical experimental values for the non-radiative rates in coordination compounds.28 | |
3.4. EL performance of 1
Thermal stability is an important factor for the device fabrication processes, and a low decomposition temperature (Td) of the complex would lead to depletion in the EL performance of the OLED.2b In view of this, the thermal stability of 1 was determined simultaneously by thermogravimetric analysis (TGA) and differential thermogravimetric analysis (DTA) in the temperature range between 20–800 °C (Fig. 7). The Td of the complex was higher than 302 °C with 5% weight loss, which facilitates the EL device fabrication by thermal evaporation. DTA curve shows an endothermic peak at 215 °C representing the Tm of 1 (Fig. S11, ESI†).
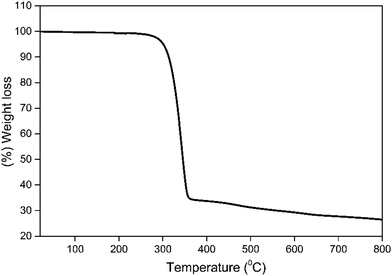 |
| | Fig. 7 TGA profile of 1 under a dinitrogen atmosphere. | |
The excellent thermal stability coupled with ideal photophysical properties (high color purity and high PLQY) of 1 prompted us to utilize it as an emitter to fabricate single- and double-EML devices by thermal evaporation under high vacuum with the following general device configuration (details of the device configuration is in ESI†):
Single-EML devices.
ITO/HAT-CN (6 nm)/HAT-CN (0.2 wt%): TAPC (50 nm)/1 (x wt%): 26DCzPPy (10 nm)/Tm3PyP26PyB (60 nm)/LiF (1 nm)/Al (100 nm).
Double-EML devices.
ITO/HAT-CN (6 nm)/HAT-CN (0.2 wt%): TAPC (50 nm)/1 (x wt%): TcTa (10 nm)/1 (x wt%): 26DCzPPy (10 nm)/Tm3PyP26PyB (60 nm)/LiF (1 nm)/Al (100 nm).
The doping concentration of 1 was modulated to be 2.0 wt%, 3.0 wt%, 4.0 wt% and 5.0 wt%, respectively. The evaporation temperature increases gradually from 133 to 141 °C as the doping concentration increases. The low thermal evaporation temperature of 1 thus ensures negligible decomposition during the thermal evaporation process.
The normalized profile of the EL spectra of 1 based single- and double-EML devices is shown in Fig. 8. The EL spectra for the single-EML device in the region between 550–750 nm is similar to the steady-state PL spectra of 1. However, it does show the host emission from 375–500 nm (Fig. 8a), but its intensity decreases with increasing doping concentration suggesting that ET transfer from the host to 1 is more efficient in Device 4. The single-EML Device 4 emitted pure red emission in spite of the presence of very faint host emission and the devices displayed red EL with (CIE)x,y color coordinates of (x = 0.631, y = 0.308, Fig. S12, ESI,†Table 3). The double-EML device with TcTa host in conjunction of 26DCzPPy host displayed similar EL sharp profile in the region between 550–750 nm, which is dominated by the 613 nm emission transition (Fig. 8b). Interestingly, the double-EML device exhibited host emission in the region between 350–450 nm, with the maxima at 390 nm which could be due to the host TcTa emission.29 As the doping concentration increases the intensity of this peak gradually decreases, suggesting an improved ET efficiency from the host to 1. These clearly suggest that in the device luminescence process, both carrier trapping and Förster ET may co-exist simultaneously.30 At the optimum doping concentration i.e., Devices 7 and 8 exhibited pure red EL with (CIE)x,y color coordinates of (x = 0.662, y = 0.321 and x = 0.666, y = 0.322, Fig. 9, Table 3). In this case, as shown in Fig. 8, the relative intensity of the host emission decreases gradually with increasing doping concentration, which suggests increasing carriers trapping on the europium(III) molecules and the increasing energy transfer from the host to the europium(III) complex. Compared with the single-EML devices, the double-EML devices displayed a relatively lower host emission, which can be rationalized by the fact that the wider recombination zone helps to facilitate the energy transfer from the host to the europium(III) complex because more europium(III) molecules participate in the EL processes.
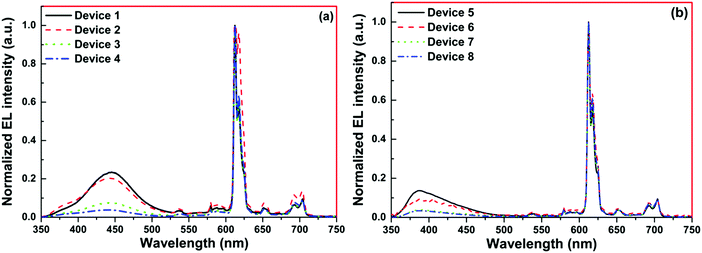 |
| | Fig. 8 Normalized EL spectra of single and double EML devices (a) 1, 2, 3 and 4 and (b) 5, 6, 7 and 8 of 1 operating at 10 mA cm−2. | |
Table 3 Key properties of single- and double-EML EL device of 1
|
|
V
turn-on (V) |
B
(cd m−2) |
η
(cd A−1) |
η
p
(lm W−1) |
EQEd (%) |
CIEx,ye |
|
The data for maximum brightness (B).
Maximum current efficiency (ηc).
Maximum power efficiency (ηp).
Maximum external quantum efficiency (EQE).
CIEx,y at 10 mA cm−2.
|
| Single EML devices |
| Device 1 |
3.1 |
1365 |
0.88 |
0.80 |
0.6 |
0.491, 0.244 |
| Device 2 |
3.2 |
907 |
1.23 |
1.17 |
0.9 |
0.596, 0.292 |
| Device 3 |
3.1 |
772 |
2.03 |
1.82 |
1.4 |
0.520, 0.258 |
| Device 4 |
3.4 |
601 |
1.96 |
1.81 |
1.4 |
0.631, 0.308 |
| Double EML devices |
| Device 5 |
3.4 |
1033 |
0.94 |
0.82 |
0.7 |
0.491, 0.244 |
| Device 6 |
3.4 |
939 |
1.15 |
1.00 |
0.8 |
0.592, 0.299 |
| Device 7 |
3.2 |
812 |
3.97 |
3.89 |
2.8 |
0.662, 0.321 |
| Device 8 |
3.4 |
633 |
3.22 |
2.97 |
2.3 |
0.666, 0.322 |
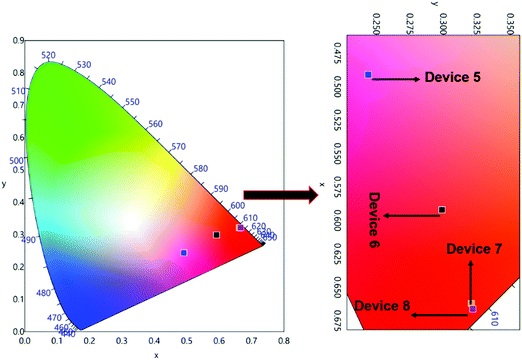 |
| | Fig. 9 CIE 1931 chromaticity diagrams of devices 5, 6, 7 and 8 of 1 with a magnified view at 10 mA cm−2. | |
The EL efficiency and current density curves, together with the voltage (V)–brightness (B) and current density curves as an inset are shown in Fig. 10. The detailed EL performance of 1 such as B, ηc, ηp and EQE of single- as well as double-EML devices are gathered in Table 3. At the 5.0 wt% (Device 4) doping concentration the single-EML device exhibited B = 601 cd m−2, ηc = 1.96 cd A−1, ηp = 1.81 lm W−1 with an EQE = 1.4% at very low Vturn-on = 3.4 V with (CIE)x,y = 0.631, 0.308. The double-EML device at the optimum doping concentration of 4.0 wt% (Device 7) displayed an impressive EL performance B = 812 cd m−2, ηc = 3.97 cd A−1, ηp = 3.89 lm W−1, and EQE = 2.8% at very low Vturn-on = 3.2 V with (CIE)x,y = 0.662, 0.321 which is close to the standard red color recommended by NTSC (0.67, 0.33). The ηc, ηp and EQE of Device 7 is two times higher than those of Device 4. The low Vturn-on suggests barrier-free carrier injection, balanced carrier transport and recombination and as well as high ET efficiency from the exciplex host to 1. Interestingly, the device based on 1 displayed higher EL performance than homodinculear complexes reported in the literature (Chemical structure is shown in Chart 1).6–9
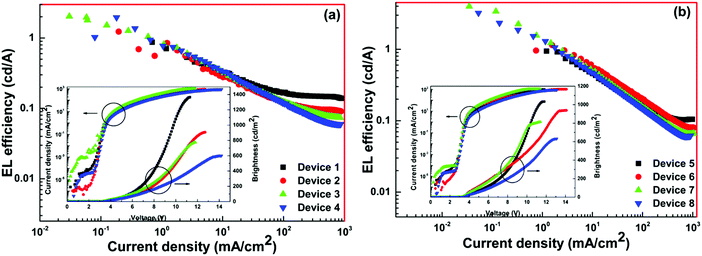 |
| | Fig. 10 EL efficiency–current density characteristics of the devices. Inset: Current density–brightness–voltage characteristics of devices. | |
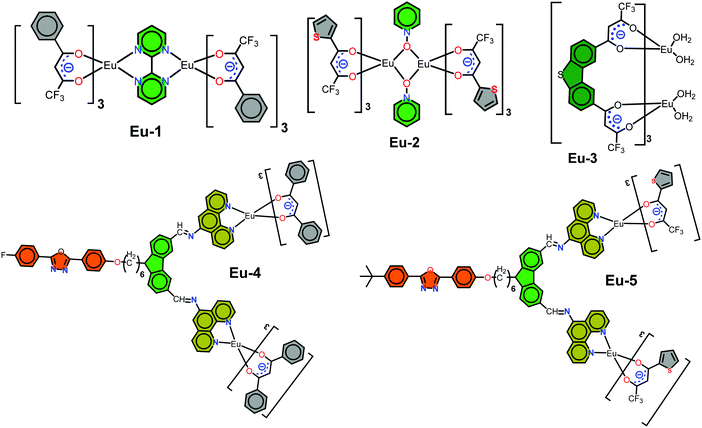 |
| | Chart 1 Chemical structure of the homodinuclear complexes utilized as emitter to fabricate red OLEDs. | |
4. Conclusion
A novel red-emitting homodinuclear Eu(III) complex 1 with (CIE)x,y color coordinates = 0.670; 0.330 and QLEu = 54.5% has been synthesized and characterized. The ET process is dominated by the Dexter mechanism from the ligand-centered triplet state → Eu(5D1) ≈ 2.1 × 10⁷ s−1 and triplet → Eu(5D0) ≈ 1.49 × 10⁷ s−1. Furthermore, the theoretically evaluated photophysical properties show excellent agreement with the experimental results. Finally, the complex was successfully utilized as an emitter to fabricate EL devices. The double-EML device at the optimum doping concentration of 4.0 wt% (Device 7) displayed an impressive EL performance B = 812 cd m−2, ηc = 3.97 cd A−1, ηp = 3.89 lm W−1, and EQE = 2.8% at very low Vturn-on = 3.2 V with (CIE)x,y = 0.662, 0.321 which is close to the standard red color recommended by NTSC (0.67, 0.33). Highly monochromatic color together with the low Vturn-on of the EL device represents an interesting potential for optoelectronic applications.
Conflicts of interest
There are no conflicts to declare.
Acknowledgements
MSK acknowledges His Majesty's Trust Fund for Strategic Research (Grant No. SR/SQU/SCI/CHEM/16/02) for funding. RI thanks HM's Trust Fund for a postdoctoral fellowship. WYW thanks the Hong Kong Research Grants Council (PolyU 153058/19P), Hong Kong Polytechnic University (1-ZE1C) and the Endowed Professorship in Energy from Ms Clarea Au (847S) for the financial support. LZ is grateful to the financial aid from National Natural Science Foundation of China (21771172), Youth Innovation Promotion Association of Chinese Academy of Sciences (2013150). PCQ thanks the Foundation of Wenzhou Science & Technology Bureau (No. W20170003) and the National Natrual Science Foundation of China (No. 21828102). PRR is grateful to the Engineering and Physical Sciences Research Council (EPSRC) for continued funding (Grant EP/K004956/1).
References
-
(a) A. Haque, L. Xu, R. A. Al-Balushi, M. K. Al-Suti, R. Ilmi, Z. Guo, M. S. Khan, W. Y. Wong and P. R. Raithby, Chem. Soc. Rev., 2019, 48, 5547–5563 RSC;
(b) R. Ilmi, S. Kansız, N. K. Al-Rasbi, N. Dege, P. R. Raithby and M. S. Khan, New J. Chem., 2020, 44, 5673–5683 RSC;
(c) R. Ilmi, I. Juma Al-busaidi, A. Haque and M. S. Khan, J. Coord. Chem., 2018, 71, 3045–3076 CrossRef CAS.
-
(a) M. S. Khan, R. Ilmi, W. Sun, J. D. L. Dutra, W. F. Oliveira, L. Zhou, W.-Y. Wong and P. R. Raithby, J. Mater. Chem. C, 2020, 8, 5600–5612 RSC;
(b) R. Ilmi, M. S. Khan, W. Sun, L. Zhou, W.-Y. Wong and P. R. Raithby, J. Mater. Chem. C, 2019, 7, 13966–13975 RSC;
(c) R. Ilmi, M. S. Khan, Z. Li, L. Zhou, W.-Y. Wong, F. Marken and P. R. Raithby, Inorg. Chem., 2019, 58, 8316–8331 CrossRef CAS PubMed;
(d) R. Ilmi, S. Anjum, A. Haque and M. S. Khan, J. Photochem. Photobiol., A, 2019, 383, 111968 CrossRef CAS;
(e) R. Ilmi, S. Kansız, N. Dege and M. S. Khan, J. Photochem. Photobiol., A, 2019, 377, 268–281 CrossRef CAS;
(f) R. Ilmi, A. Haque, I. J. Al-Busaidi, N. K. Al Rasbi and M. S. Khan, Dyes Pigm., 2019, 162, 59–66 CrossRef CAS.
- O. Moudam, B. C. Rowan, M. Alamiry, P. Richardson, B. S. Richards, A. C. Jones and N. Robertson, Chem. Commun., 2009, 6649–6651 RSC.
-
(a) H. Xu, Q. Sun, Z. An, Y. Wei and X. Liu, Coord. Chem. Rev., 2015, 293–294, 228–249 CrossRef CAS;
(b) L. Wang, Z. Zhao, C. Wei, H. Wei, Z. Liu, Z. Bian and C. Huang, Adv. Opt. Mater., 2019, 1801256 CrossRef.
-
(a) S. Swavey and R. Swavey, Coord. Chem. Rev., 2009, 253, 2627–2638 CrossRef CAS;
(b) R. Ilmi and K. Iftikhar, Inorg. Chem. Commun., 2010, 13, 1552–1557 CrossRef CAS;
(c) R. Ilmi and K. Iftikhar, Inorg. Chem. Commun., 2012, 20, 7–12 CrossRef CAS;
(d) R. Ilmi and K. Iftikhar, Polyhedron, 2015, 102, 16–26 CrossRef CAS;
(e) R. Ilmi and K. Iftikhar, Polyhedron, 2017, 127, 191–202 CrossRef CAS.
- H. Jang, C.-H. Shin, B.-J. Jung, D.-H. Kim, H.-K. Shim and Y. Do, Eur. J. Inorg. Chem., 2006, 718–725 CrossRef CAS.
- H. You, J. Fang, L. Wang, X. Zhu, W. Huang and D. Ma, Opt. Mater., 2007, 29, 1514–1517 CrossRef CAS.
- Y. Liu, J. Wang, Y. Wang, Z. Zhang, M. Zhu, G. Lei and W. Zhu, Dyes Pigm., 2012, 95, 322–329 CrossRef CAS.
- Y. Liu, K. Chen, K. Xing, Y. Wang, H. Jiang, X. Deng, M. Zhu and W. Zhu, Tetrahedron, 2013, 69, 4679–4686 CrossRef CAS.
- K. Miyata, T. Nakagawa, R. Kawakami, Y. Kita, K. Sugimoto, T. Nakashima, T. Harada, T. Kawai and Y. Hasegawa, Chem. – Eur. J., 2011, 17, 521–528 CrossRef CAS PubMed.
-
(a) Y. Zheng, J. Lin, Y. Liang, Q. Lin, Y. Yu, Q. Meng, Y. Zhou, S. Wang, H. Wang and H. Zhang, J. Mater. Chem., 2001, 11, 2615–2619 RSC;
(b) Y. Hasegawa, Y. Kimura, K. Murakoshi, Y. Wada, J.-H. Kim, N. Nakashima, T. Yamanaka and S. Yanagida, J. Phys. Chem., 1996, 100, 10201–10205 CrossRef CAS.
- L. Farrugia, J. Appl. Crystallogr., 1999, 32, 837–838 CrossRef CAS.
-
(a)
G. Sheldrick, SADABS, Program for Empirical Absorption Correction of Area Detector Data, University of Göttingen, Göttingen, Germany, 1996 Search PubMed;
(b) G. Sheldrick, Acta Crystallogr., Sect. A, 2015, 71, 3–8 CrossRef PubMed.
- C. F. Macrae, P. R. Edgington, P. McCabe, E. Pidcock, G. P. Shields, R. Taylor, M. Towler and J. van de Streek, J. Appl. Crystallogr., 2006, 39, 453–457 CrossRef CAS.
- O. L. Malta, J. Non-Cryst. Solids, 2008, 354, 4770–4776 CrossRef CAS.
- J. D. Dutra, T. D. Bispo and R. O. Freire, J. Comput. Chem., 2014, 35, 772–775 CrossRef CAS PubMed.
-
W. T. Carnall, H. Crosswhite and H. M. Crosswhite, Energy level structure and transition probabilities in the spectra of the trivalent lanthanides in LaF3, United States, 1978 Search PubMed.
-
A. N. Carneiro Neto, E. E. S. Teotonio, G. F. de Sá, H. F. Brito, J. Legendziewicz, L. D. Carlos, M. C. F. C. Felinto, P. Gawryszewska, R. T. Moura, R. L. Longo, W. M. Faustino and O. L. Malta, in Handbook on the Physics and Chemistry of Rare Earths, ed. J.-C. G. Bünzli and V. K. Pecharsky, Elsevier, 2019, vol. 56, pp. 55–162 Search PubMed.
- J. Xu, E. Radkov, M. Ziegler and K. N. Raymond, Inorg. Chem., 2000, 39, 4156–4164 CrossRef CAS PubMed.
- M. G. B. Drew, Coord. Chem. Rev., 1977, 24, 179–275 CrossRef CAS.
- I. Georgieva, N. Trendafilova, T. Zahariev, N. Danchova and S. Gutzov, J. Lumin., 2018, 202, 192–205 CrossRef CAS.
- R. L. Martin, J. Chem. Phys., 2003, 118, 4775–4777 CrossRef CAS.
- H.-Y. Li, J. Wu, W. Huang, Y.-H. Zhou, H.-R. Li, Y.-X. Zheng and J.-L. Zuo, J. Photochem. Photobiol., A, 2009, 208, 110–116 CrossRef CAS.
- Y. Hasegawa, M. Yamamuro, Y. Wada, N. Kanehisa, Y. Kai and S. Yanagida, J. Phys. Chem. A, 2003, 107, 1697–1702 CrossRef CAS.
- J. D. L. Dutra, N. B. D. Lima, R. O. Freire and A. M. Simas, Sci. Rep., 2015, 5, 13695 CrossRef PubMed.
- C. V. Rodrigues, L. L. Luz, J. D. L. Dutra, S. A. Junior, O. L. Malta, C. C. Gatto, H. C. Streit, R. O. Freire, C. Wickleder and M. O. Rodrigues, Phys. Chem. Chem. Phys., 2014, 16, 14858–14866 RSC.
-
(a) T. Kushida, J. Phys. Soc. Jpn., 1973, 34, 1334–1337 CrossRef CAS;
(b) T. Kushida, J. Phys. Soc. Jpn., 1973, 34, 1327–1333 CrossRef CAS;
(c) T. Kushida, J. Phys. Soc. Jpn., 1973, 34, 1318–1326 CrossRef CAS.
- O. L. Malta, F. R. G. E. Silva and R. Longo, Chem. Phys. Lett., 1999, 307, 518–526 CrossRef CAS.
- W. Song, H. L. Lee and J. Y. Lee, J. Mater. Chem. C, 2017, 5, 5923–5929 RSC.
-
(a) P.-P. Sun, J.-P. Duan, H.-T. Shih and C.-H. Cheng, Appl. Phys. Lett., 2002, 81, 792–794 CrossRef CAS;
(b) F. Liang, Q. Zhou, Y. Cheng, L. Wang, D. Ma, X. Jing and F. Wang, Chem. Mater., 2003, 15, 1935–1937 CrossRef CAS.
Footnote |
| † Electronic supplementary information (ESI) available. CCDC 2000896. For ESI and crystallographic data in CIF or other electronic format see DOI: 10.1039/d0tc02181d |
|
| This journal is © The Royal Society of Chemistry 2020 |
 Open Access Article
 *a,
Weidong
Sun
b,
José D. L.
Dutra
 c,
Nawal K.
Al-Rasbi
a,
Liang
Zhou
 *b,
Peng-Cheng
Qian
 *d,
Wai-Yeung
Wong
 *e,
Paul R.
Raithby
 *f and
Muhammad S.
Khan
 *a
*a
![[double bond, length as m-dash]](https://www.rsc.org/images/entities/char_e001.gif) O)st. ∼ 1607, ν(C–F)st ∼ 1282 (Fig. S2, ESI†); melting point (Tm) = 216 °C, decomposition temperature (Td) at 5% weight = 301 °C.
O)st. ∼ 1607, ν(C–F)st ∼ 1282 (Fig. S2, ESI†); melting point (Tm) = 216 °C, decomposition temperature (Td) at 5% weight = 301 °C.


 , the multipolar mechanism (MM) governs the electronic excitation of the states 5D4 ← 7F0, 5G6 ← 7F0, and 5L6 ← 7F0 for Eu(III) ion, and the values of
  were taken from the work of Carnall et al..17 The ΩFEDλ corresponds to the forced electric dipole intensity parameters taken from the eqn (S2) (ESI†) neglecting the contribution from the dynamic coupling (DC).


 , which provides the following selection rule: |ΔJ| = 0,±1 (J = J′ = 0 excluded) and ΔS = 0 for the Ln(III) ion, the spin–orbit coupling can relax the latter. Details of the terms in eqn (8)–(10) are widely discussed in the ref. 18. LUMPAC 1.4.1 was used to calculate the ET rates for 1.
![[1 with combining macron]](https://www.rsc.org/images/entities/char_0031_0304.gif) ) contains half of the molecule with the symmetry related half being generated by a crystallographic center of symmetry which lies at the center of the bridging bpm ligand. The Eu(III) centers adopt an 8-coordinate geometry in a N2O6 ligand environment due to the presence of three chelating btfa groups. The Eu···Eu distance is ca. 6.914 Å and the Eu–O and Eu–N bond distances are comparable to those in previously published related molecules.5d The Eu–N bonds [to N(1) and N(2), from the ligand] are particularly long at 2.636(5) and 2.637(5) Å, respectively being partly pushed out of the coordination sphere whereas all Eu–O bonds are short, in the ranges of 2.337(4)–2.357(4) Å. The N(1)–Eu(1)–N(2) angles is 61.22(14)° whereas the O–Eu–O are in the ranges of 72.08(16)°–84.86(16)° and 112.31(17)°–49.50(16)°. As discussed in the introduction, the packing diagram of the complex exhibits extensive hydrogen-bonding interactions of CH⋯F between adjacent molecules to generate a two-dimensional network of molecules, Fig. 1(c). As mentioned above, we have optimized the ground state geometry of 1 computationally, the root-mean-square-deviation (RMSD) between the geometries optimized by B3LYP/SVP/MWB52 and PBE1PBE/SVP/MWB52 with the X-ray structure is 0.72 Å and 0.98 Å, respectively, omitting the hydrogen atoms. When only the two N2O6 polyhedra calculated are considered in the RMSD calculation, the corresponding values are 0.17 Å and 0.28 Å for B3LYP and PBE1PBE, respectively. Moreover, the geometry calculated with B3LYP is in excellent agreement with the experimental X-ray structure (Fig. S3, ESI†). The optimized B3LYP/SVP/MWB52 geometry (Fig. S4, ESI†) and angular data obtained is shown in Table S8, ESI† (Discussion is also included in the ESI†).
) contains half of the molecule with the symmetry related half being generated by a crystallographic center of symmetry which lies at the center of the bridging bpm ligand. The Eu(III) centers adopt an 8-coordinate geometry in a N2O6 ligand environment due to the presence of three chelating btfa groups. The Eu···Eu distance is ca. 6.914 Å and the Eu–O and Eu–N bond distances are comparable to those in previously published related molecules.5d The Eu–N bonds [to N(1) and N(2), from the ligand] are particularly long at 2.636(5) and 2.637(5) Å, respectively being partly pushed out of the coordination sphere whereas all Eu–O bonds are short, in the ranges of 2.337(4)–2.357(4) Å. The N(1)–Eu(1)–N(2) angles is 61.22(14)° whereas the O–Eu–O are in the ranges of 72.08(16)°–84.86(16)° and 112.31(17)°–49.50(16)°. As discussed in the introduction, the packing diagram of the complex exhibits extensive hydrogen-bonding interactions of CH⋯F between adjacent molecules to generate a two-dimensional network of molecules, Fig. 1(c). As mentioned above, we have optimized the ground state geometry of 1 computationally, the root-mean-square-deviation (RMSD) between the geometries optimized by B3LYP/SVP/MWB52 and PBE1PBE/SVP/MWB52 with the X-ray structure is 0.72 Å and 0.98 Å, respectively, omitting the hydrogen atoms. When only the two N2O6 polyhedra calculated are considered in the RMSD calculation, the corresponding values are 0.17 Å and 0.28 Å for B3LYP and PBE1PBE, respectively. Moreover, the geometry calculated with B3LYP is in excellent agreement with the experimental X-ray structure (Fig. S3, ESI†). The optimized B3LYP/SVP/MWB52 geometry (Fig. S4, ESI†) and angular data obtained is shown in Table S8, ESI† (Discussion is also included in the ESI†).


![[thin space (1/6-em)]](https://www.rsc.org/images/entities/char_2009.gif) 586 cm−1), 5D1 (∼19
586 cm−1), 5D1 (∼19![[thin space (1/6-em)]](https://www.rsc.org/images/entities/char_2009.gif) 027 cm−1), and 5D0 (∼17
027 cm−1), and 5D0 (∼17![[thin space (1/6-em)]](https://www.rsc.org/images/entities/char_2009.gif) 293 cm−1), and the energy-level values were taken from the work of Carnall et al.17 The ligand–metal ET rates presented in Fig. 6 were calculated employing the LUMPAC software package.16 The 5D4 ← 7F0 excitation in Eu(III) is governed by the MM mechanism, which depends on the forced electric dipole contribution for the intensity parameters (ΩFEDλ). These parameters were calculated using the QDC model and are shown in Table S12 (ESI†). The WET values are lower for the T(bfta–bpm) → 5D4 transfer channel, suggesting that the MM mechanism is not the dominant ET process in 1. On the other hand, the higher values of WET rate of T(bfta) → 5D1 ≈ 2.1 × 10⁷ s−1 and T(bfta) → 5D0 ≈ 1.5 × 10⁷ s−1 indicate the Dexter mechanism as being dominant for the ligand-to-metal ET process. It is important to mention that these ET are related to the 5D1 ← 7F0 and 5D0 ← 7F1 excitations, considering that the 7F1 state is thermally populated.2c We have further estimated the Eu(III) → Eu(III) ET rates in the present dinuclear complex. Rodrigues and coworkers26 estimated that for a Eu(III)–Eu(III) distance of around 4 Å, using Kushida's expressions27 by adapting Malta's work,15 the ET rate value related to the Eu(5D1) → Eu(5D0) energy channel is of the order of 104 s−1. Utilizing the same approach for the Eu(III)–Eu(III) distance in 1 studied here (ca. 7 Å), the value obtained is of the order of 102 s−1 and is not included in energy level diagram as the triplet → Eu(5D0) transfer is of the order of 107 s−1. The normalized populations for the states considered for the PL process were calculated considering all rates contained in Fig. 6. The populations associated with the S0 and 5D0 states (eqn (S8), ESI†) were equal to 0.13 and 0.87, respectively, providing a theoretical PLQY for 1 = 52.6%, which agrees very well with the experimental value.
293 cm−1), and the energy-level values were taken from the work of Carnall et al.17 The ligand–metal ET rates presented in Fig. 6 were calculated employing the LUMPAC software package.16 The 5D4 ← 7F0 excitation in Eu(III) is governed by the MM mechanism, which depends on the forced electric dipole contribution for the intensity parameters (ΩFEDλ). These parameters were calculated using the QDC model and are shown in Table S12 (ESI†). The WET values are lower for the T(bfta–bpm) → 5D4 transfer channel, suggesting that the MM mechanism is not the dominant ET process in 1. On the other hand, the higher values of WET rate of T(bfta) → 5D1 ≈ 2.1 × 10⁷ s−1 and T(bfta) → 5D0 ≈ 1.5 × 10⁷ s−1 indicate the Dexter mechanism as being dominant for the ligand-to-metal ET process. It is important to mention that these ET are related to the 5D1 ← 7F0 and 5D0 ← 7F1 excitations, considering that the 7F1 state is thermally populated.2c We have further estimated the Eu(III) → Eu(III) ET rates in the present dinuclear complex. Rodrigues and coworkers26 estimated that for a Eu(III)–Eu(III) distance of around 4 Å, using Kushida's expressions27 by adapting Malta's work,15 the ET rate value related to the Eu(5D1) → Eu(5D0) energy channel is of the order of 104 s−1. Utilizing the same approach for the Eu(III)–Eu(III) distance in 1 studied here (ca. 7 Å), the value obtained is of the order of 102 s−1 and is not included in energy level diagram as the triplet → Eu(5D0) transfer is of the order of 107 s−1. The normalized populations for the states considered for the PL process were calculated considering all rates contained in Fig. 6. The populations associated with the S0 and 5D0 states (eqn (S8), ESI†) were equal to 0.13 and 0.87, respectively, providing a theoretical PLQY for 1 = 52.6%, which agrees very well with the experimental value.


