
 Open Access Article
 This Open Access Article is licensed under a Creative Commons Attribution-Non Commercial 3.0 Unported Licence
Pyrolysis study of solution-derived superconducting YBa2Cu3O7 films: disentangling the physico-chemical transformations†
Bohores
Villarejo
a,
Cornelia
Pop
a,
Sussagna
Ricart
 a,
Bernat
Mundet
a,
Anna
Palau
a,
Pere
Roura-Grabulosa
b,
Jordi
Farjas
b,
Teresa
Puig
*a and
Xavier
Obradors
*a
a,
Bernat
Mundet
a,
Anna
Palau
a,
Pere
Roura-Grabulosa
b,
Jordi
Farjas
b,
Teresa
Puig
*a and
Xavier
Obradors
*a
aInstitut de Ciència de Materials de Barcelona, CSIC, Campus de la UAB, 08193 Bellaterra, Catalonia, Spain. E-mail: xavier.obradors@icmab.es; teresa.puig@icmab.es
bUniversity of Girona, Montilivi Campus, Edif. PII, E17071 Girona, Catalonia, Spain
First published on 1st July 2020
Abstract
Chemical solution deposition (CSD) of epitaxial YBa2Cu3O7 (YBCO) films is a high throughput, cost-effective approach to grow high critical current superconducting conductors for power applications. Achieving high critical currents requires to grow epitaxial films with large thicknesses and this is still an open issue in CSD. Metalorganic precursor solution deposition can be tailored to achieve high film thicknesses, however, the pyrolysis step may heavily compromise the film quality due to the in-plane stress generated by a strong film shrinkage. Here, we disclose the complex relationship existing during the pyrolysis process between the physico-chemical transformations and the microstructure of the films. A low-fluorine trifluoroacetate (TFA) and propionate (prop) route to YBCO films with a final thicknesses in the range of 700–800 nm was studied to understand the phenomena. Morphological analysis by in situ optical microscopy video imaging under specific heating rates allowed to identify the thermokinetic conditions leading to permanent or reversible wrinkling and crack formation. The origin of the microstructural transformations during the pyrolysis of thick films has been disentangled through parallel in situ analyses of the chemical, thermal and mechanical properties, together with film thickness measurements. A key finding has been the identification of an intermediate liquid phase relieving the compressive stress responsible of wrinkling. Disclosing the origin of the physico-chemical transformations opens the path towards defining optimized pyrolysis processing conditions for high quality single deposition of CSD films.
Introduction
The growth of large area or long length functional and multifunctional thin films can be made through a very promising low cost approach: chemical solution deposition (CSD) which uses different types of chemical solutions as precursors.1–7 The solutions can be deposited on substrates through several methodologies allowing to control the film thickness, such as spin coating, dip coating, web coating or ink jet printing (IJP).8,9 Afterwards, to develop the functionality of the thin films, solution drying, pyrolysis and growth steps are required.In many applications of functional films, the ability to achieve large thicknesses (in the range of 1 μm) is a pre-requisite to have competitive performances, for instance, piezoelectrics, ferroelectrics, superconductors, etc. Particularly, developing superconductors for power applications requires a high critical current (Ic), i.e. the maximum current which can be transported without dissipation.10–16 For epitaxial thin films and coated conductors (CCs) of high temperature superconductor (HTS) (such as YBa2Cu3O7,YBCO), it is possible to increase Ic linearly with thickness, t; i.e. Ic = Jct, where Jc is the critical current density.14
Extensive efforts have been made to increase film thickness in CSD growth based on metalorganic precursors, however, many uncertainties still remain in the control of the pyrolysis and growth processes which limits the progress in this issue.17–24 Both stages need actually to be optimized to achieve high Ic values in CSD superconducting films. The main difficulty in the pyrolysis stage arises from the strong shrinkage associated to the decomposition of the metalorganic network of the film which generates in-plane stress because the film is attached to the substrate.1,25,26 To overcome this limitation, it is usual to increase the film thickness through multideposition of the solution with intermediate pyrolysis or drying steps.23,24,27 Since multideposition is a cumbersome and time-consuming method, it is desirable to obtain thick films in a single deposition. To this aim, further progress in our understanding of the complex and interlinked physico-chemical transformations occurring during the pyrolysis process is required. This knowledge will be crucial for increasing the film thickness in a single deposition, with the corresponding time and cost reduction.
The most troubling sources of film morphological defects associated to the pyrolysis step are film wrinkling and cracking, both related to the in-plane stress generated during the process.1,2,21,28–30 Progress in understanding these phenomena has been steady in recent years investigating model systems; however, the use of these ideas in CSD current practice is still limited and, consequently, defining efficient strategies to avoid wrinkling and cracking in thick films is still a great challenge. Most of the experimental studies of these phenomena rely on ex situ observations performed after film processing completion or by film quenching since the corresponding annealing temperatures. Hence, the analyses of the complex physico-chemical interlinked phenomena are severely restricted in scope, for instance, the relevance of the dynamic phenomena can’t be ascertained. In situ analysis based on complementary tools is therefore highly desirable to gain a deep insight on the mechanisms of the pyrolysis process.
We report on complementary in situ and ex situ physico-chemical analyses of the pyrolysis process of low-fluorine carboxylate YBCO precursors, which evidences that film microstructure is determined by complex interlinked thermodynamic and kinetic phenomena. Previous analysis of the pyrolysis of trifluoroacetate (TFA) solutions for YBCO film growth already demonstrated that the purity of the solutions (particularly with low water content), and cleanness of the deposition process (to avoid impurities) are essential to achieve high quality homogeneous films.10–13,28,31,32 Moreover, the use of low-fluorine solutions for YBCO film growth, beyond the benefit for the environment, possess a reduced hygroscopic behavior, which contributes to achieve improved film quality during pyrolysis33–35 or may also allow to perform faster pyrolysis processes.36 It is therefore an important issue to carry out a detailed investigation of the decomposition mechanisms and their influence on the microstructure of YBCO films based on these solutions.
The first goal of this work, is to determine the temperature windows where the morphological defects develop and how they are influenced by kinetic and thermodynamic factors. This analysis has been performed using a heating unit with temperature, atmosphere and gas flow control attached to an optical microscope (OM), thus allowing to record in situ videos at different heating rates. Three different characteristic temperature regions were identified and then analysed by mass-loss (thermogravimetric analysis, TGA; evolved gas analysis, EGA; mass spectrometry, MS), heat exchange (differential thermal analysis, DTA; differential scanning calorimetry, DSC), thickness evolution (optical interferometry, OI), Fourier transformation infra-red (FT-IR) spectra of volatile species and viscosity (thermomechanical analysis, TMA) in situ experiments. These results were complemented with FT-IR spectra analysis of the non-volatile films species, quenched after different annealing times. The thermomechanical analysis (TMA) of the films used to determine the evolution of the film viscosity37 turned out to have a high relevance in our quest for a global understanding of the phenomena observed during the pyrolysis process. A thorough consideration of all these complementary physico-chemical analytical results has provided a unifying picture of the complex evolution pattern governing the morphology and the microstructure of the solution derived films after the pyrolysis step. A very relevant output of this work is that we have determined the conditions to achieve highly reproducible and high quality CSD YBCO films, with final thickness in the range of 700–800 nm, in a single deposition by ink jet printing (IJP). The progress in disentangling the mechanisms controlling the different stages of the pyrolysis process in solution derived YBCO films has become, therefore, crucial to further advance in the development of high quality CSD epitaxial films with increased thickness and so enhanced superconducting performances.
Results and discussion
Identification of morphological defects
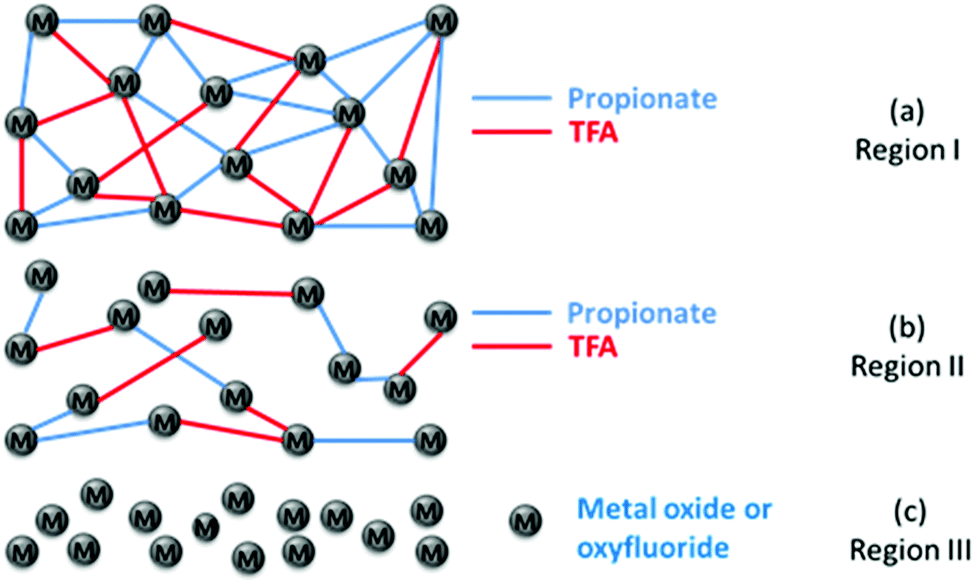
The main objective of this work is to analyze the pyrolysis process of low-fluorine metalorganic salt precursors deposited on single crystalline substrates in order to achieve homogeneous precursor films as thick as possible in a single deposition to grow epitaxial YBCO films. Previous works analyzed several aspects of the pyrolysis process of TFA precursors for CSD growth of YBCO thin films and provided evidence of a complex interplay among chemical, thermodynamic and mechanical properties of the films.5,12,21,27,32,33,38 Here we concentrate our interest on increasing the film thickness in a single deposition process, using characterization tools that enable us to go well beyond the existing knowledge about the pyrolysis process, mainly studied through in situ measurements of physico-chemical properties. Increasing the film thickness can be achieved through multideposition processes, however, this approach generates segregated interlayers of CuO which may compromise the film homogeneity during growth (Fig. 1(a)).11,13,27 This compositional separation is associated to sublimation of Cu(TFA)2 which then leads to enrichment of CuO at the surface of the films.13,21,27,39 In contrast, single deposition avoids the interlayer formation and restricts the CuO enrichment to the surface of the films (Fig. 1(b)).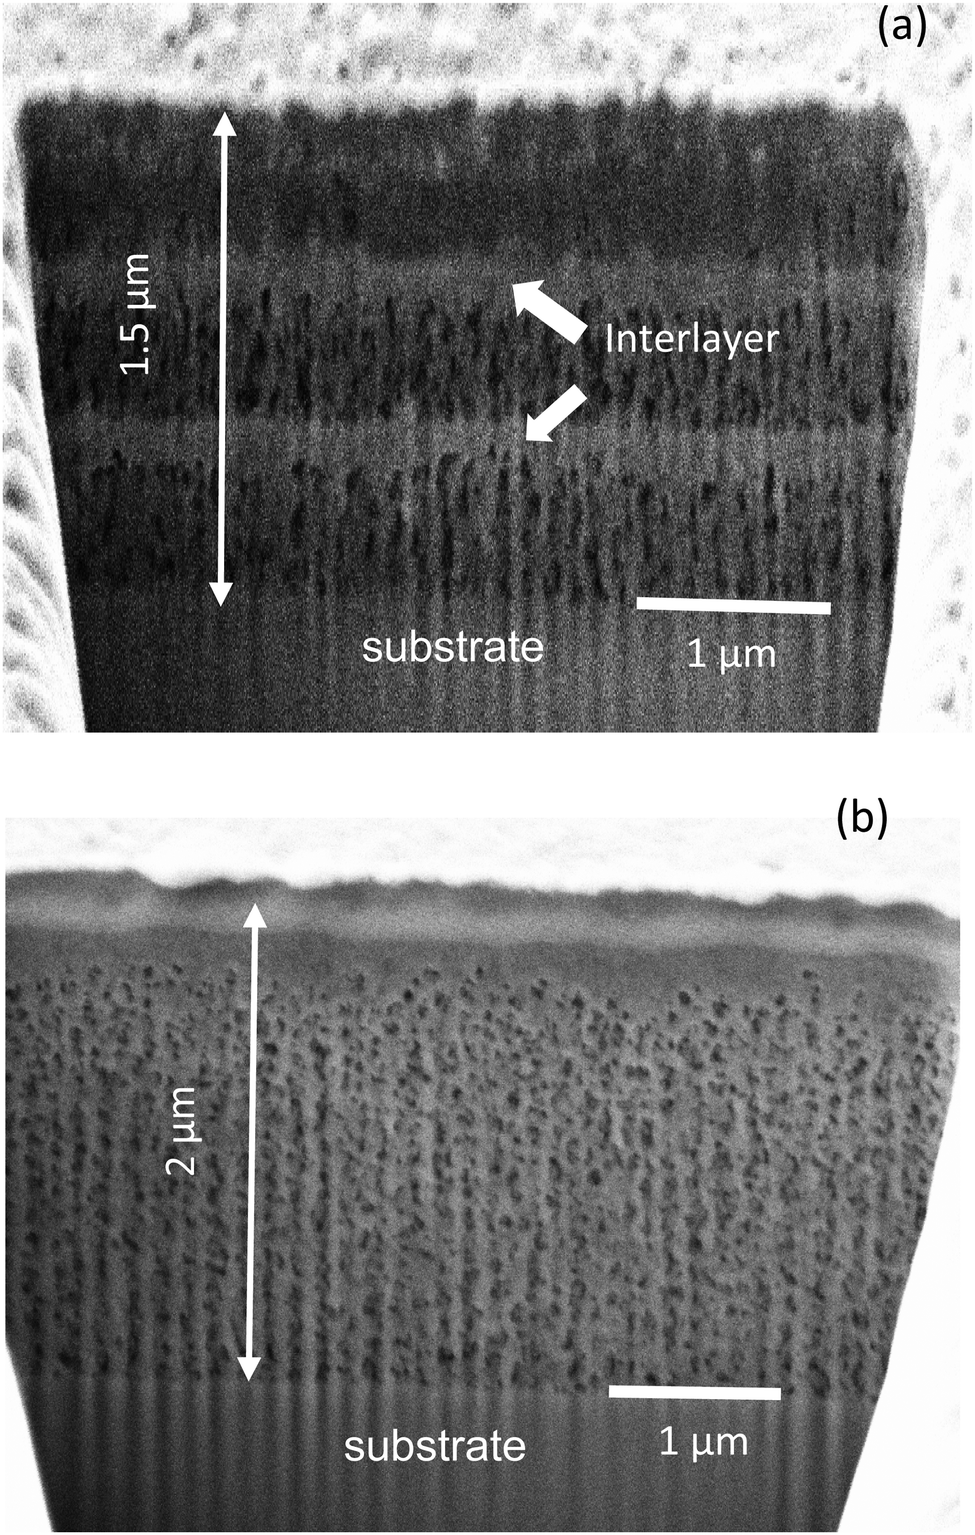 | ||
| Fig. 1 Scanning electron microscopy (SEM) micrographs of YBCO pyrolyzed films' cross section obtained by focused ion beam (FIB). In (a) 3 coatings with a thickness after pyrolysis of 500 nm were performed by spin coating, showing CuO segregated interlayers. The final film thickness would be around 700–800 nm. (b) Micrograph of a pyrolyzed film with a single coating made by IJP, presenting a fairly homogeneous cross section, except for the formation of a CuO nanolayer at the surface. The final film thickness would be around 1.000 nm. | ||
As we mentioned before, analysis of the pyrolysis of functional thin films has shown that generation of stress σ may lead to the formation of wrinkles or the generation of cracks which severely degrade the superconducting properties.28 It is, therefore, compulsory to investigate the physico-chemical conditions controlling the formation of these inhomogeneities. The main issue to be considered is that by increasing the film thickness the tendency to form wrinkles and cracks increases.1,2,17 For instance, it has been previously established that cracks are formed in films when the film thickness exceeds a critical value tc under a tensile stress σ:1,2,26
 | (1) |
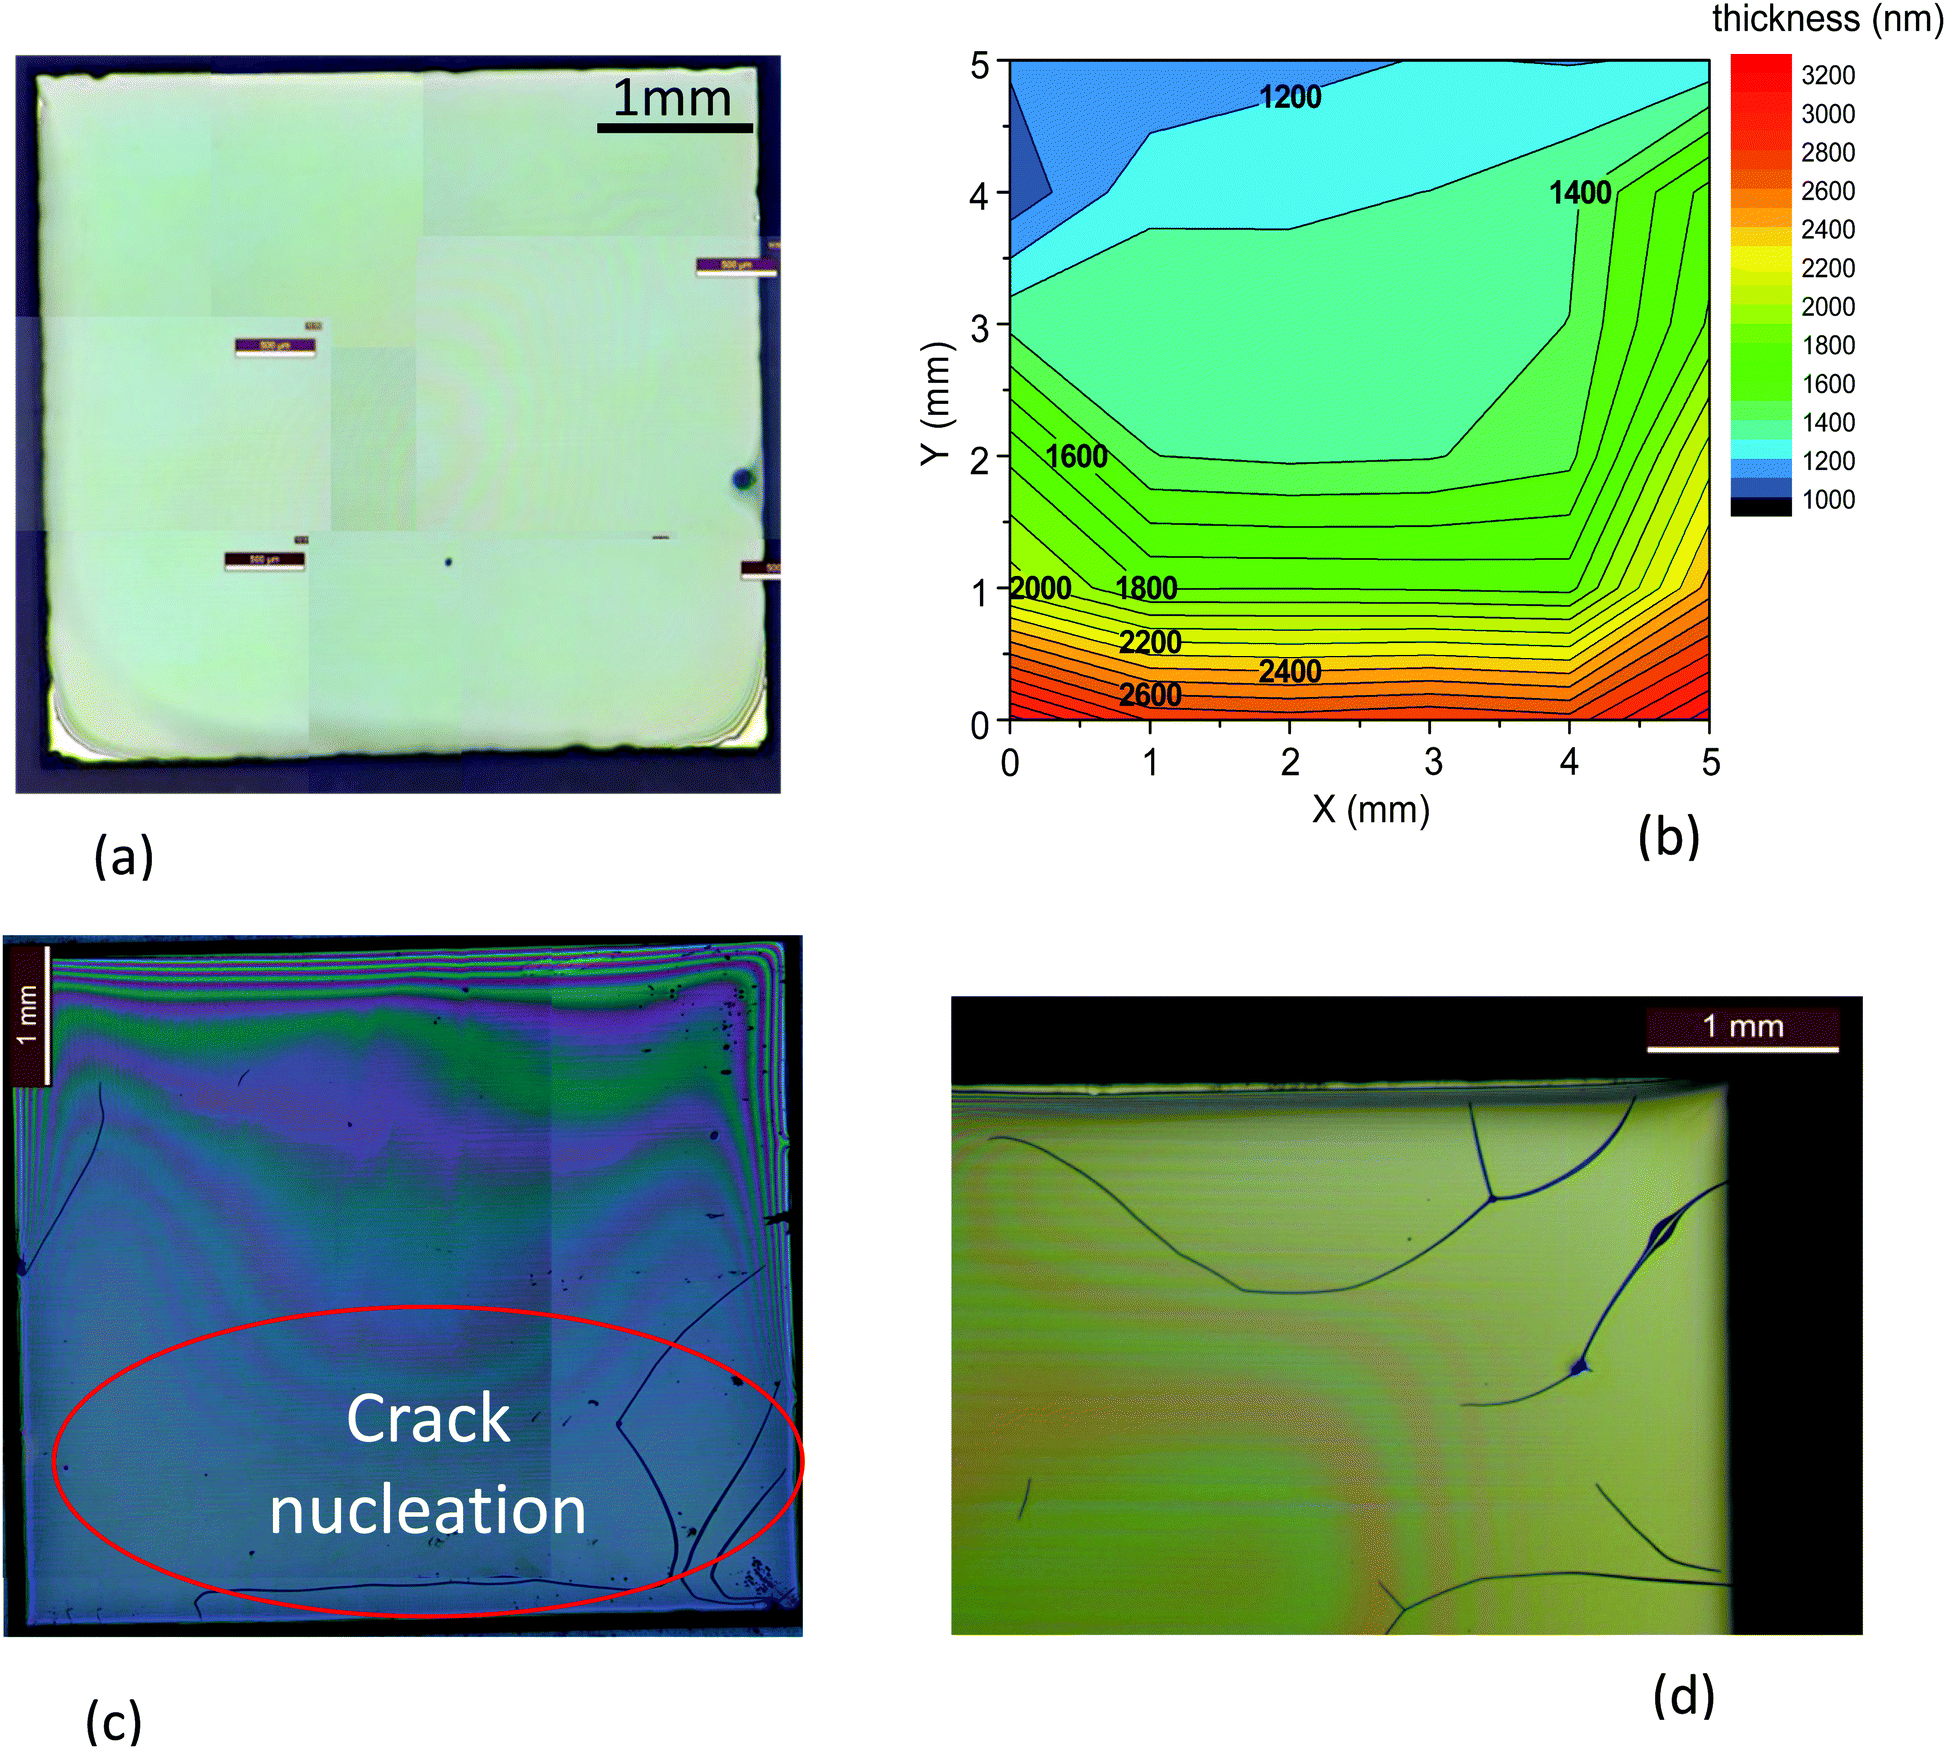 | ||
| Fig. 2 Optical microscopy image of (a) a film after solution deposition and drying (typical thickness of 7 μm) showing a very good homogeneity; (b) typical thickness map of a homogeneous film after pyrolysis, as determined by interferometry; (c) a pyrolized film showing a typical case where cracks have been formed at the edges where the thickness is higher; (d) detail of cracks formed at the edges of a film. All the films deposited by IJP using a solution 1 with a nominal thickness of 700 nm after growth. | ||
The influence of film thickness on cracking is easily identified in Fig. 2(b, c) and Video S1 (ESI†). Fig. 2(b) shows an example of film thickness inhomogeneity where a larger thickness is observed at the substrate edges due to the coffee ring effect,40 a common effect that often happens when using IJP. This is precisely where the cracks nucleate because the critical thickness is surpassed. Then, the crack propagates to significant parts of the film (see also a detail of the film edge in Fig. 2(d)). Once these cracks are formed during the pyrolysis process, they remain after the YBCO growth at high temperature (see Fig. S1, ESI†) and so they strongly degrade the superconducting performance of the films. Other crack nucleation centers are impurities or defects in the deposited wet film, as it is also identified in the OM video recording during the pyrolysis process (Video S1, ESI†).
The second typical morphological defect consists of characteristic thickness variations known as wrinkles (Fig. 3). Wrinkle formation mechanism has been widely investigated in model systems, such as bilayer films formed by a metal layer on top of a compliant thin polymer.41–43 For a given film thickness, when the compressive stress goes beyond a certain limit a surface instability occurs leading to wrinkle formation.42,44 In the case of CSD films wrinkling is formed during solution drying25,45 or pyrolysis.28 Modelling of wrinkling formation has been performed in different film and multilayer configurations and this has allowed to determine the critical stress σc and the relationship among the wavelength of the branches, the film thickness and the mechanical properties of the films:41,42,44,46
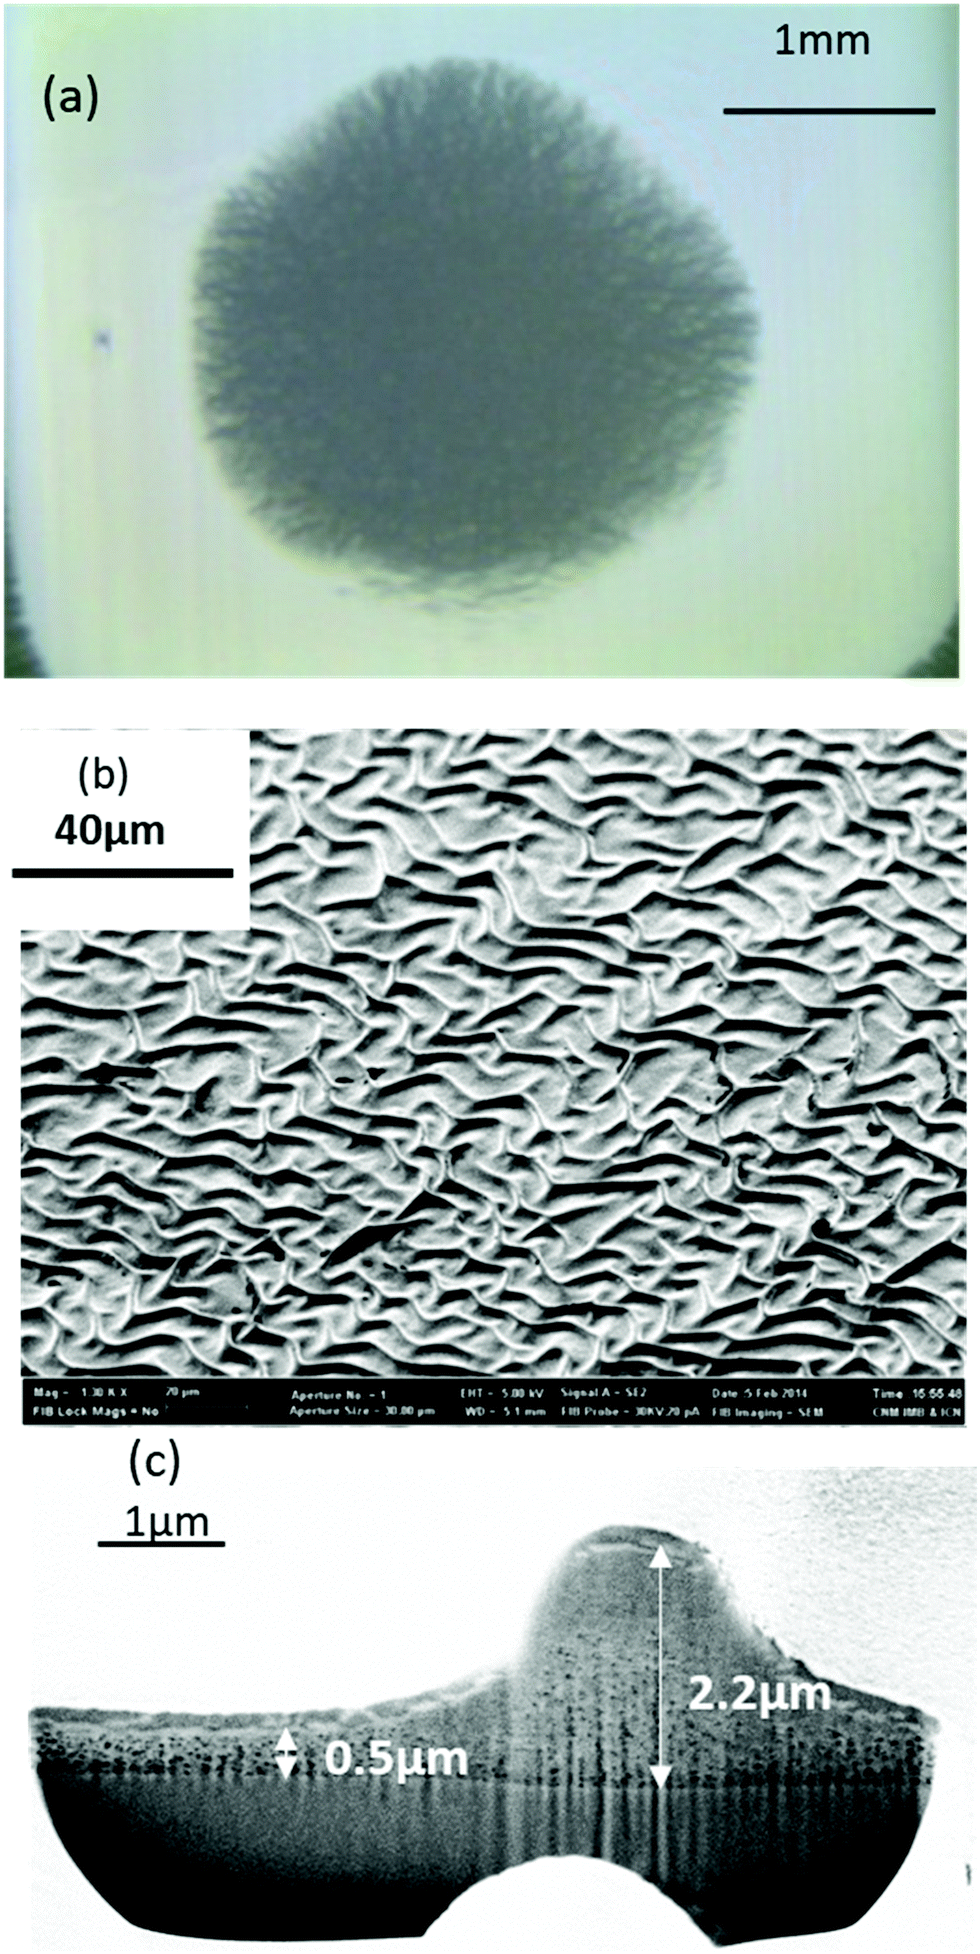 | ||
| Fig. 3 (a) OM image of a typical wrinkling structure appearing in a YBCO film when the heating rate is too high; (b) SEM image of a film surface displaying wrinkles after pyrolysis when the film was heated at 15 °C min−1; (c) cross section FIB-SEM micrograph of a wrinkled film. Films deposited using a solution 1 with a nominal thickness of 700 nm after growth. | ||
The wrinkled structure is clearly identified in our YBCO films, both through OM (Fig. 3(a)), SEM images of the film surface (Fig. 3(b)) and FIB cross sections (Fig. 3(c)). See also Fig. S2 (ESI†) for additional SEM images of a film surface wrinkled after pyrolysis at different magnifications.
It's clear, therefore, that a thorough analysis of the physico-chemical parameters controlling both phenomena, wrinkling and cracking, is required to develop homogeneous CSD YBCO films with large thicknesses. In the next sections we investigate in detail the main issues controlling these phenomena by means of in situ analytical methodologies. We will show that only through a joint consideration of a wide range of analyses we can provide a comprehensive interpretation of the complex interrelationships of chemical, thermal and mechanical properties which control the film morphology.
In situ morphology analysis by optical microscopy
A very useful technique in the analysis of the film morphology is to record in situ video OM images during the pyrolysis process. A series of video recordings performed under different thermal conditions (heating ramps, gas flow) reproducing the experimental conditions of the conventional tubular furnaces allowed us to identify the temperature ranges where each morphological film instability occurs under specific conditions. For instance, we immediately identified a first region (I), i.e. the solution drying regime, occurring below T ∼ 150 °C, where the film remains homogeneous even if we use high heating ramps such as 20 °C min−1 (see Video S1, ESI†). We decided therefore to keep this heating ramp in region I (drying) for all our experiments.The second region (II) that we could identify through the OM video images, is where wrinkling develops. Wrinkling is easily identified in the OM images through the black “stain” seen in Fig. 4, where a sequence of OM images recorded at different temperatures is shown (see also Video S1, ESI†). Several heating ramps where investigated and we concluded that wrinkling starts at T > 180 °C while the heating rate determines if the wrinkled structure becomes stable or can be reversed. Fig. 4 corresponds to a typical example of a reversed wrinkled structure which is obtained with a heating ramp of 5 °C min−1. Video S2 (ESI†) reports another example of reversal wrinkling, obtained by heating at 2 °C min−1 while Video S3 (ESI†) corresponds to an example of wrinkling which remains stable after over-passing a typical temperature of 220–240 °C. In this last case, the heating ramp was 15 °C min−1. It is worth to note that the heating rates where wrinkling is initiated as well as those where the structure becomes permanent depend on the solution composition. We found, for instance, that solutions 1 and 2 (see Experimental section for the description of solutions) display wrinkling when heating at 2 °C min−1 or higher, while solution 1 + DEA displays wrinkling only at heating rates higher than 5 °C min−1 (see also Video S4, ESI†). On the other hand, the wrinkled structure becomes stable in films from solution 1 at a heating rate of 5 °C min−1 while for the other two solutions stable wrinkles appear only when heating rate is higher than 10 °C min−1 (see Video S5, ESI†). We conclude, therefore, that the critical stress σc for wrinkling formation is easier to achieve at high heating rates. Hence, we propose that the stress generated during the physico-chemical transformations have a thermo-kinetic character which origin needs to be disclosed to keep the control on his film instability. The reversibility of wrinkling is actually quite an unusual phenomenon, it has only been observed in very specific polymeric materials and so it is an issue that deserves a detailed investigation in the present case.47
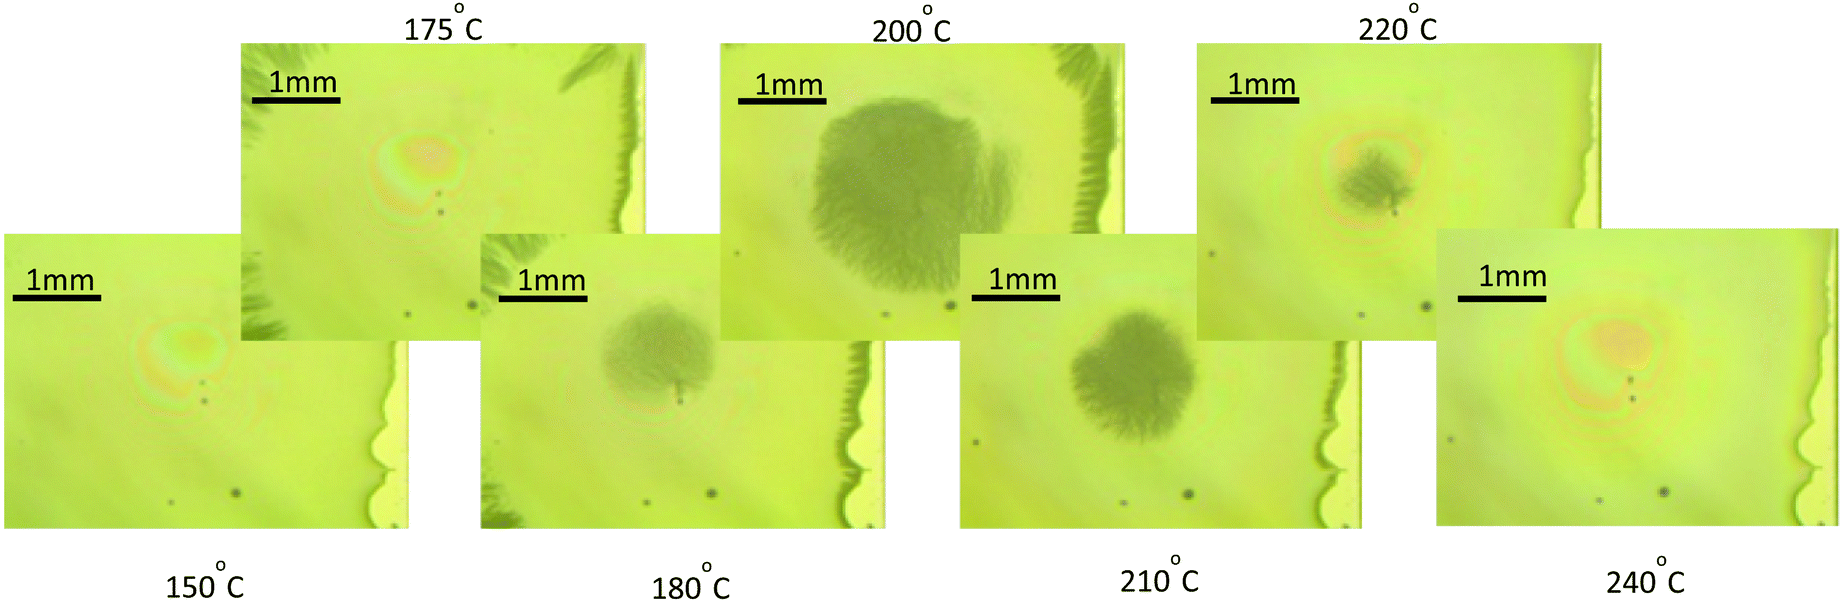 | ||
| Fig. 4 Sequence of OM images of a YBCO film (solution 1) obtained at different temperatures during the pyrolysis using a heating ramp 5 °C min−1. The black “stain” corresponds to film wrinkling and it is seen that under these conditions its formation is reversible. | ||
A third temperature region (III), associated to the formation of cracks, was identified through the OM video recordings (Video S1, ESI†).
Fig. 5 displays a series of OM images in the temperature range 260–280 °C which shows that crack formation occurs within this temperature range, well above the range where wrinkling formation was identified (see also Video S1, ESI†). Here typical maximum heating ramps that we could use to avoid crack formation were in the range of 5 °C min−1, although no systematic analysis of this kinetic effect was performed.18 Overall, we have summarized the optimal heating ramps in Fig. 6. Three temperature regions are indicated together with the range of heating ramps leading to homogeneous films when the final YBCO film thickness remains close to 700 nm.
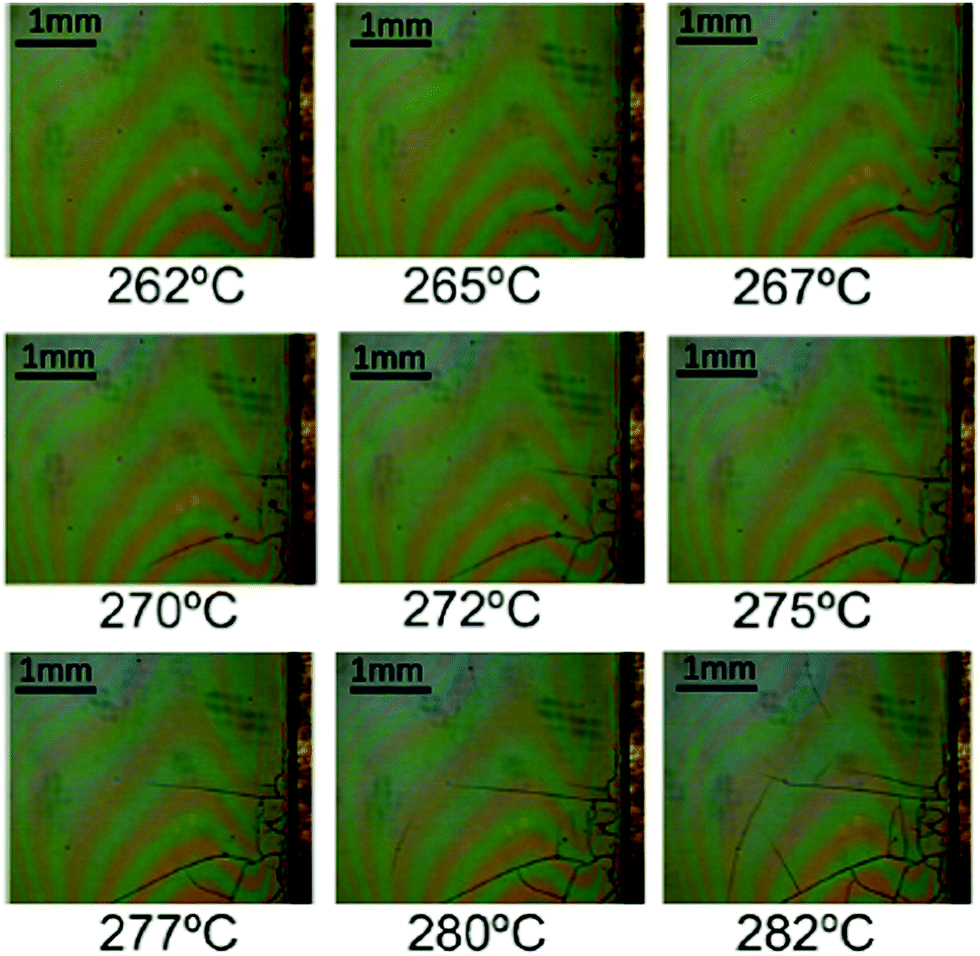 | ||
| Fig. 5 Sequence of OM images of a YBCO film (solution 1) obtained at different temperatures and showing the formation of cracks. The heating rate is 5 °C min−1. | ||
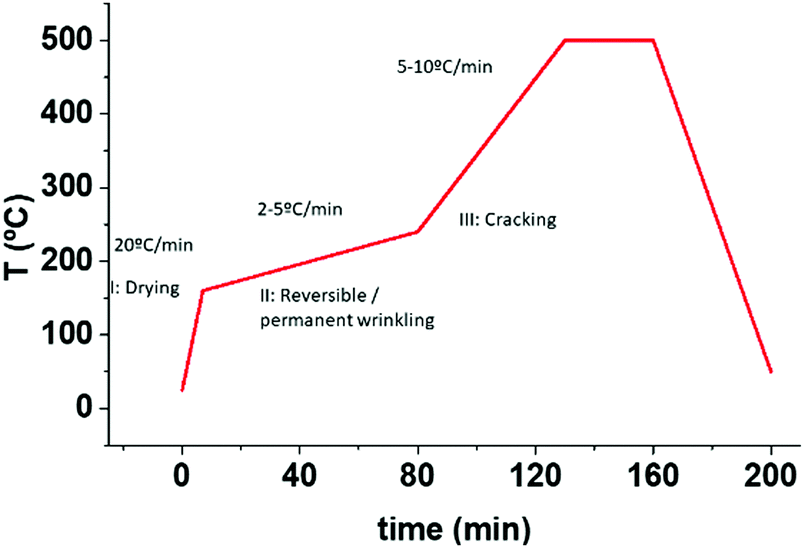 | ||
| Fig. 6 Summary of the three different identified temperature regions correlated with the corresponding phenomena. The required temperature ramps are also indicated. (I) Solution drying; (II) reversible or irreversible wrinkling formation; (III) crack formation. | ||
To conclude this section, we would like to stress that we have identified the three different temperature windows, where the films dries (region I), where the films start to pyrolyze and may eventually lead to a wrinkled structure (region II) and, finally, where the pyrolysis completes and may lead to crack formation (region III). In the next sections, we concentrate on investigating the physico-chemical transformations occurring.
Thermal decomposition of the precursor
Thermogravimetric analysis (TGA) and differential scanning calorimetry (DSC) is used to investigate the evolution of films during pyrolysis. Due to the enhanced gas and heat transport, films decompose differently than powders.48 For this reason, thermal analysis has been performed directly on films deposited on LAO substrates. A dynamic atmosphere of a mixture of oxygen and air (80 and 20 ml min−1 respectively) is set to facilitate the removal of the organic fraction. Besides, the use of a humid atmosphere enhances copper and yttrium salts decomposition through hydrolysis and avoids metal-salt sublimation.39,49Precursors are prepared from yttrium trifluoroacetate, barium acetate and copper acetate salts (1![[thin space (1/6-em)]](https://www.rsc.org/images/entities/char_2009.gif) :2:3 molar ratio) dissolved in propionic acid (solution 1) or a mixture of butanol and propionic acid (solution 2). It has been stated that, in the presence of propionic acid, acetate ligands are replaced by propionate ligands while the fluorinated moiety remains in the film.33 Due to the high electropositivity of barium cations, TFA ligands have a higher tendency to bond with barium cations. So dried films are expected to contain a network of mixed Cu, Ba and Y cations bonded to propionate and TFA ligands, where copper is mainly bonded to propionate ligands and TFA ligands will preferably bond to barium cations. So the dried films are mixed with Cu(prop)2, Y(prop)3, Y(TFA)3, Ba(TFA)2 and Ba(prop)2 salts. Although the behavior of the mixed salts is more complex and differs from the simple sum of its components, the thermal decomposition of single salts provides valuable information to disclose the decomposition of the mixed salt. The decomposition mechanism of metal propionates depends on the metal cation.50 In humid oxygen, Cu(prop)2 decomposes between 100 and 200 °C in two stages: hydrolysis and oxidation, releasing propionic acid to yield CuO.39 Y(prop)3 decomposes between 200–400 °C in two stages: hydrolysis and oxidation, releasing propionic acid and acetaldehyde plus CO2, respectively, leading to yttrium oxycarbonate that, eventually, decomposes to yield yttria.49 The more stable propionate is Ba(prop)2 that decomposes between 250–500 °C;51 it decomposes in a single oxidative stage to form barium carbonate upon release of acetaldehyde and CO2.51 Besides, the thermal decomposition of Y(TFA)3 and Ba(TFA)2 entails the formation of fluorides upon release of CO, CO2 and (CF3CO)2O52 that in the presence of water forms trifluoroacetic acid53 and CHF3.54 In the form of films Y(TFA)3 decomposes between 200 °C and 270 °C while Ba(TFA)2 decomposes in the temperature range from 250 to 350 °C.52 It should be stressed that the existence of a mixed salt alters the nature of the final product after pyrolysis with respect single salts. For instance, the presence of TFA ligands prevents the formation of barium carbonate, and the overlapping of the decomposition of Y and Ba propionates and TFAs results in the formation of (Ba1−xYx)F2+x (BYF). This crystalline phase together with CuO were identified as the final pyrolysis products by X-ray diffraction (see Fig. S4, ESI†).
:2:3 molar ratio) dissolved in propionic acid (solution 1) or a mixture of butanol and propionic acid (solution 2). It has been stated that, in the presence of propionic acid, acetate ligands are replaced by propionate ligands while the fluorinated moiety remains in the film.33 Due to the high electropositivity of barium cations, TFA ligands have a higher tendency to bond with barium cations. So dried films are expected to contain a network of mixed Cu, Ba and Y cations bonded to propionate and TFA ligands, where copper is mainly bonded to propionate ligands and TFA ligands will preferably bond to barium cations. So the dried films are mixed with Cu(prop)2, Y(prop)3, Y(TFA)3, Ba(TFA)2 and Ba(prop)2 salts. Although the behavior of the mixed salts is more complex and differs from the simple sum of its components, the thermal decomposition of single salts provides valuable information to disclose the decomposition of the mixed salt. The decomposition mechanism of metal propionates depends on the metal cation.50 In humid oxygen, Cu(prop)2 decomposes between 100 and 200 °C in two stages: hydrolysis and oxidation, releasing propionic acid to yield CuO.39 Y(prop)3 decomposes between 200–400 °C in two stages: hydrolysis and oxidation, releasing propionic acid and acetaldehyde plus CO2, respectively, leading to yttrium oxycarbonate that, eventually, decomposes to yield yttria.49 The more stable propionate is Ba(prop)2 that decomposes between 250–500 °C;51 it decomposes in a single oxidative stage to form barium carbonate upon release of acetaldehyde and CO2.51 Besides, the thermal decomposition of Y(TFA)3 and Ba(TFA)2 entails the formation of fluorides upon release of CO, CO2 and (CF3CO)2O52 that in the presence of water forms trifluoroacetic acid53 and CHF3.54 In the form of films Y(TFA)3 decomposes between 200 °C and 270 °C while Ba(TFA)2 decomposes in the temperature range from 250 to 350 °C.52 It should be stressed that the existence of a mixed salt alters the nature of the final product after pyrolysis with respect single salts. For instance, the presence of TFA ligands prevents the formation of barium carbonate, and the overlapping of the decomposition of Y and Ba propionates and TFAs results in the formation of (Ba1−xYx)F2+x (BYF). This crystalline phase together with CuO were identified as the final pyrolysis products by X-ray diffraction (see Fig. S4, ESI†).
Fig. 7 shows the TG–DSC analysis of a film deposited from solution 1 heated at 20 °C min−1 in humid oxygen. Similar TGA curves were recorded with the two other solutions (see Fig. S3, ESI†). For solution 1 + DEA, the presence of a chelating agent shifts the decomposition endset to higher temperature;55 for this reason, the final pyrolysis temperature for solution 1 + DEA was chosen to be 500 °C. In all cases, the total mass loss is consistent with the final formation of CuO and BYF (Fig. 7(a) and Fig. S3, ESI†).
 | ||
| Fig. 7 Simultaneous TG–DSC analysis for a film with solution 2 heated at 20 °C min−1 in humid O2 atmosphere: (a) TG curve; (b) time derivative of the TG signal (dTG) and DSC curve. | ||
These nanocrystalline phases coexist with amorphous phases which were previously identified by TEM.13,27,56,57
The analysis of the thermal evolution of the film precursor has been elucidated thanks to the identification of volatiles by in situ FT-IR and in situ mass spectrometry (MS) (Fig. 8(a, b) and Fig. S5, ESI†). It is worth noting that, although the MS analysis is based on the analysis of the complete fragmentation pattern (not shown), it is not conclusive because of coincidence of m/z values for fragments arising from different volatiles; for instance, the main CO fragment (m/z = 28) coincides with the second most intense fragment of propionic acid, and both TFA acid and CHF3, have one m/z = 69 fragment. For this reason, the combined FT-IR and MS analysis has been crucial to identify univocally the most relevant volatiles.
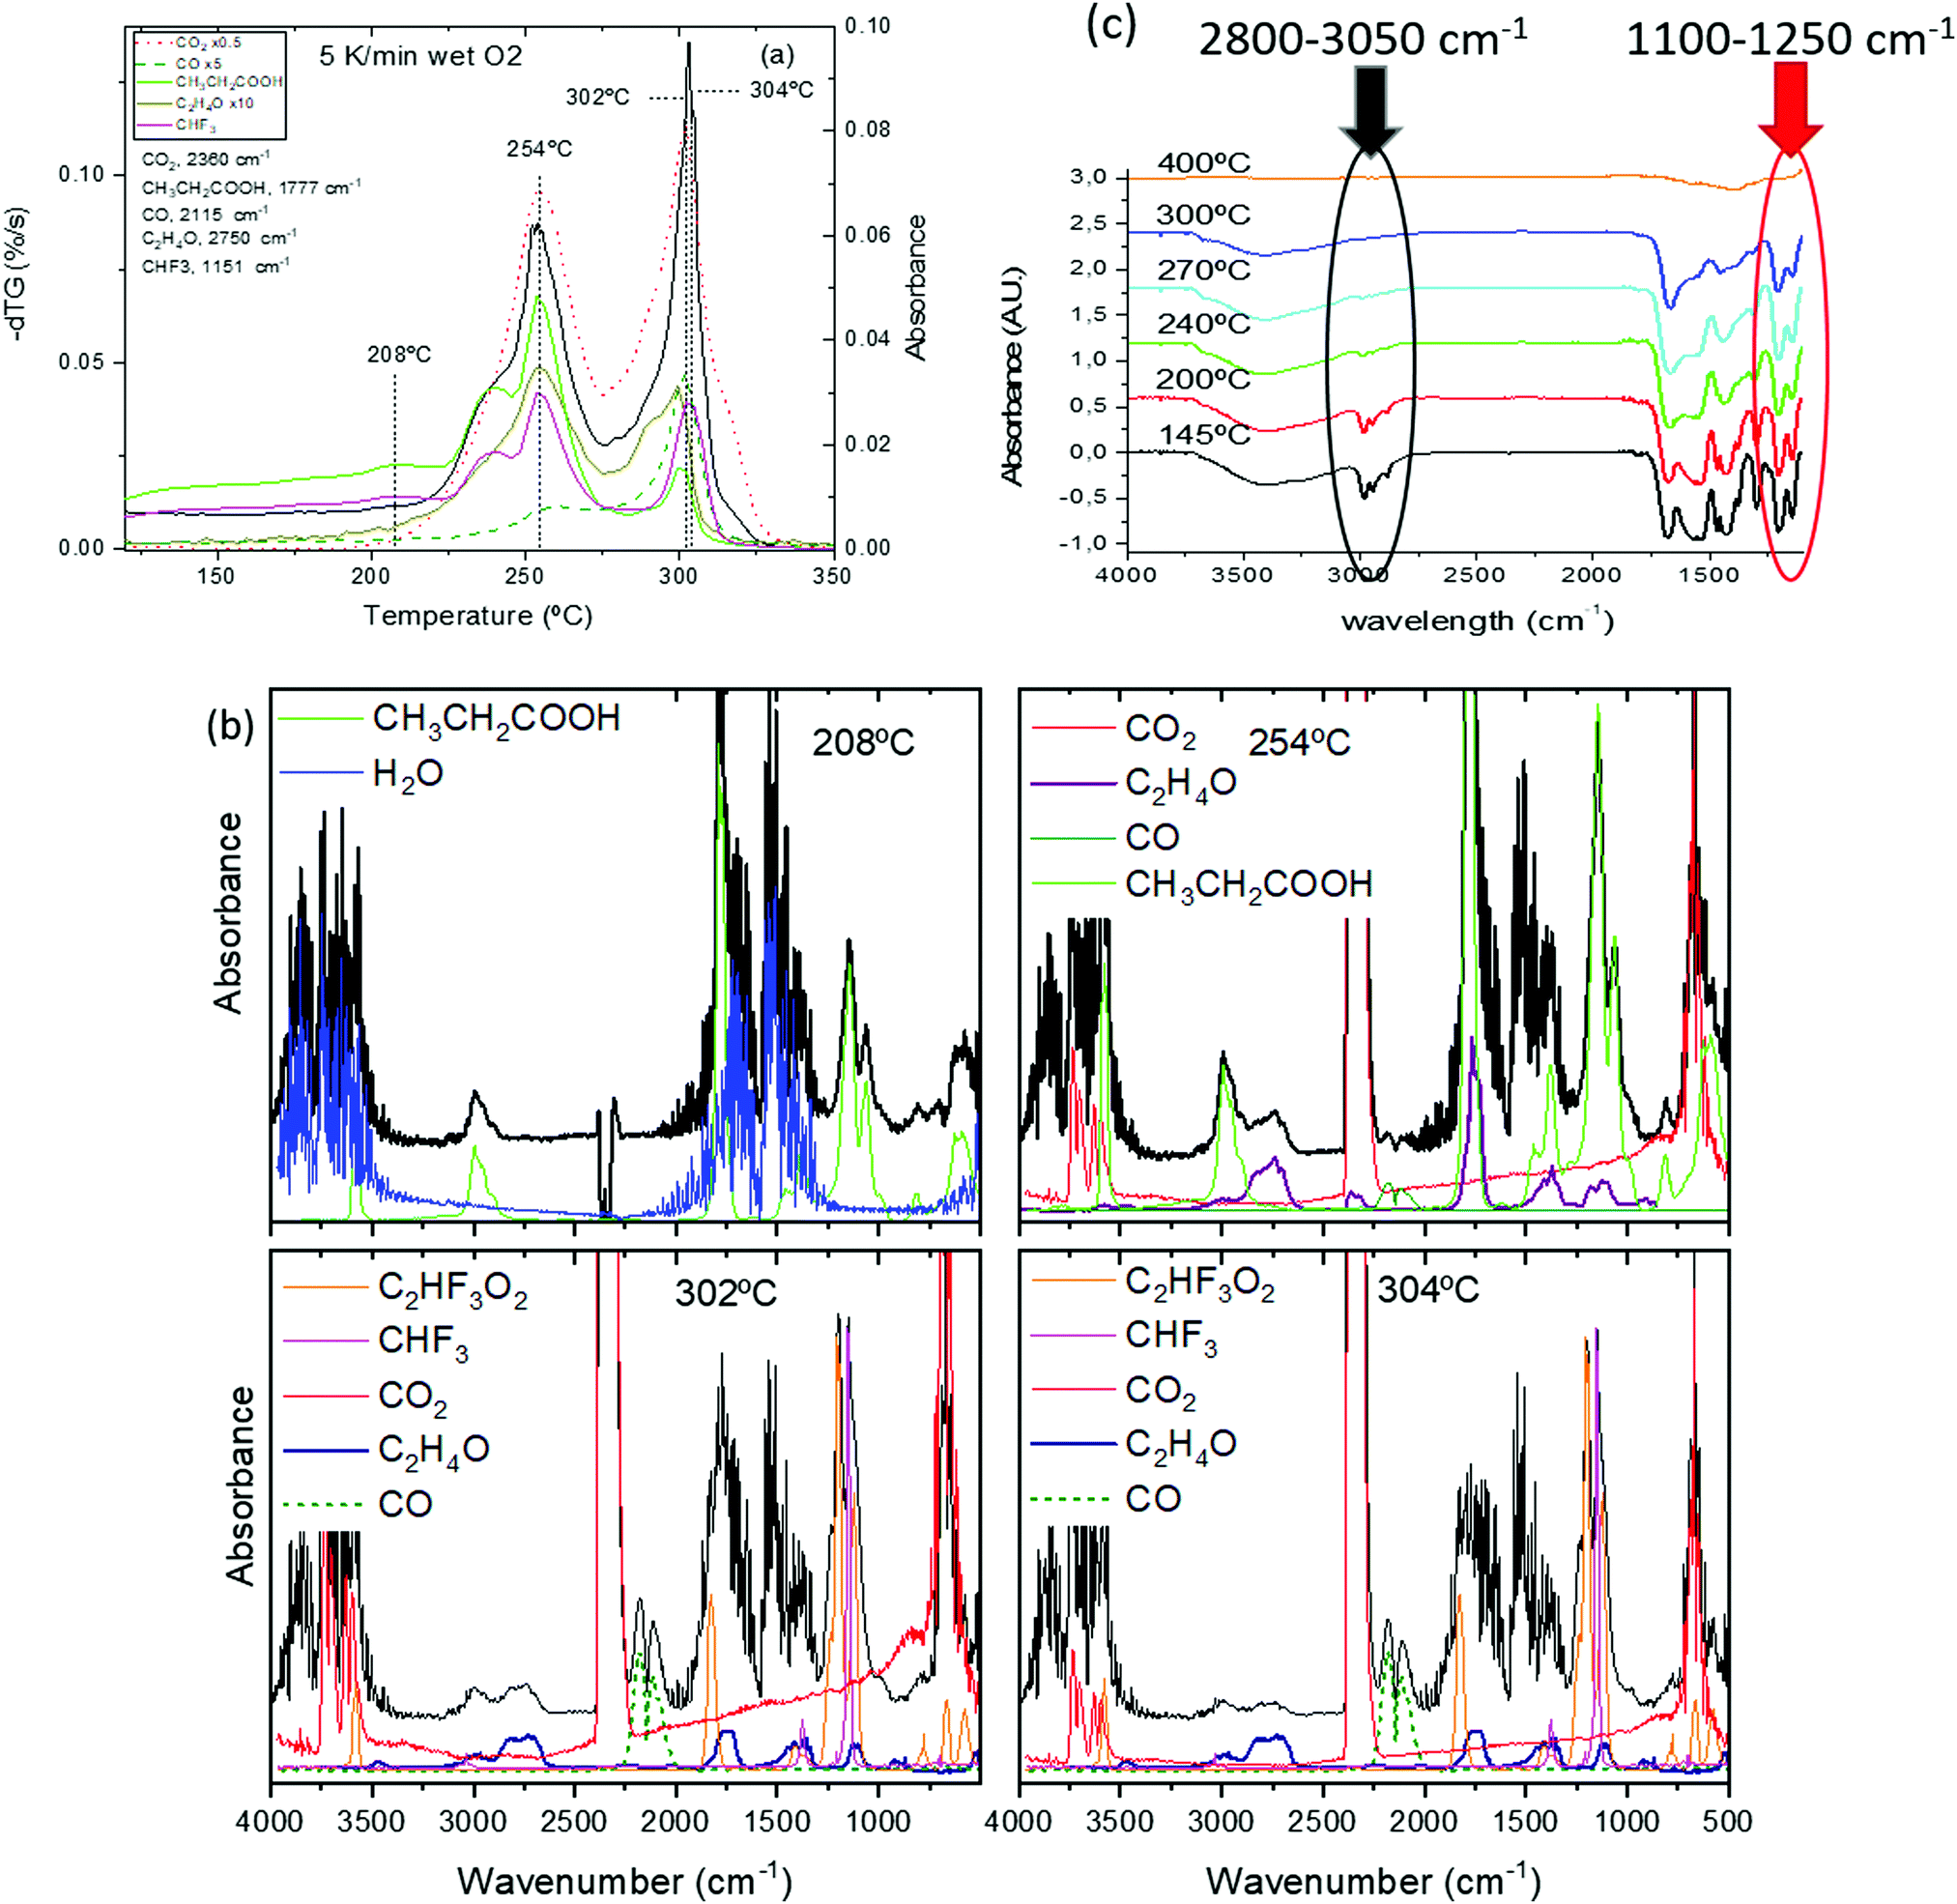 | ||
| Fig. 8 (a) Simultaneous TG-EGA analysis of a film with solution 1 heated at 5 °C min−1 in humid O2 atmosphere: transformation rate (−dTG) together with the evolution of the intensity of the in situ IR absorption peaks representative of the main volatiles detected during pyrolysis. The frequency related to each volatiles is indicated in the figure. Some signals have been multiplied by a factor 0.5, 5 or 10 to facilitate comparison. FT-IR spectra at the indicated selected temperatures are shown in (b); (b) upshifted curves (black lines) are selected FT-IR spectra of the volatiles evolved during the TG experiments in (a). The remaining (colored) curves are the reference spectra obtained from the NIST library;58 (c) FT-IR spectra for a film with solution 1 + DEA recorded at room temperature after quenching from the indicated temperatures. The film was heated following a sequence of 25 °C min−1, 1 °C min−1 and 5 °C min−1 in the temperature intervals of RT–150 °C, 150–240 °C and 240–500 °C. The absorbance band of the alkane group (C–H str.) used for the propionate determination is encircled in black. Inside the red circle we find the bands corresponding to fluoromethyl (C–F str.) absorbance, assigned to TFA molecule. | ||
At temperatures below 150 °C the weight loss corresponds to solvent drying. For solutions 1 and 1 + DEA, we observe the evolution of propionic acid while, for solution 2, acetic acid and butanol are detected (see Fig. S6, ESI†). The presence of acetic acid in solution 2, where a mixture of butanol and propionic acid (80/20) is used as solvent, is related to the ligand exchange between acetate salts and propionic acid to yield propionates and acetic acid. Above 150 °C, the DSC curve (Fig. 7(b)) shows the onset of an exothermic signal that cannot be related to evaporation (which is endothermic) but indicates the beginning of decomposition. This onset coincides with that of decomposition of Cu(prop)2,39 the salt that is expected to decompose first to yield CuO and propionic acid. Indeed, the simultaneous TG-EGA analysis (Fig. 8(a and b) – 208 °C curves) confirms that the main volatile formed during this first decomposition stage is propionic acid, as expected for the hydrolysis/oxidation of Cu(prop)2.39 It is worth noting that, no acetic acid has been detected. Since the hydrolysis and oxidation of Cu acetate entails the formation of acetic acid, its absence confirms the scrambling between propionate and acetate radicals in the solution.
Above 230 °C, we observe the formation of CO2, acetaldehyde (C2H4O) and, in a lower amount, CO (see Fig. 8(b), 254 °C curve). The formation of these volatiles can be attributed to the oxidation of both yttrium and copper propionates. Indeed, in humid atmosphere, Cu(prop)2 fully decomposes in the temperature range between 100 and 200 °C, while Y(prop)3 exhibits a two-step decomposition process, where the first step ranges between 150 and 275 °C. Thus, the first decomposition stage between 150 and 275 °C (peak at 254 °C in Fig. 8(a)) could be attributed to the complete decomposition of Cu(prop)2 and a partial decomposition of the propionate ligands bonded to Y cations. As expected, no sign of the decomposition of TFA ligands is observed (the apparent evolution of CHF3 in Fig. 8(a) is an artefact caused by the coincidence with an intense absorption of propionic acid). Indeed, detailed analysis of the complete FT-IR spectrum shows no significant traces of any fluorinated volatile bellow 292 °C (see Fig. 8(b), curves of 208 and 254 °C).
The second decomposition stage, between 275 and 320 °C (peak at 302 °C in Fig. 8(a)) also involves several processes. The volatiles are mainly CO2, CO, acetaldehyde, CHF3 and TFA acid (see. Fig. 8(b), 302 °C curve). The first three volatiles can be attributed to the complete decomposition of the remaining propionate ligands (bonded to both Y and Ba cations). The formation of TFA acid has been observed during the decomposition of both Y(TFA)3 and Ba(TFA)2 in the presence of water. Also, the temperature range for decomposition for the single salts is in agreement with the temperature range of this last stage. Thus, both Y and Ba TFAs decompose during this last stage. However, the formation of CHF3 has only been observed during the decomposition of Ba(TFA)2.51,52 So the formation of CHF3 indicates that a significant amount of TFA groups are linked to Ba cations. Note, that this simultaneous decomposition of Y and Ba propionates and TFAs results in the formation of BYF, (see Fig. S4(a), ESI†).
Although, both propionate and TFA decompositions overlap, the decomposition of TFA ligands is shifted to slightly higher temperatures. This is apparent in Fig. 8(b) when comparing the 302 and 304 °C curves The intensity of the absorption related to CHF3 is nearly identical in both spectra but the signal related to acetaldehyde significantly decreases at 304 °C; i.e., TFA ligands remain in place up to the very last moment of the precursor decomposition. These results are consistent with the ex situ FT-IR analysis of the solid residue at different temperatures, Fig. 8(c). FT-IR spectra of a film with solution 1, Fig. 8(c), were recorded after quenching the films from different temperatures. Concerning the TFA groups, their presence is revealed in two regions: between 1100 and 1250 cm−1 and around 3450 cm−1. In the first region, two strong absorptions (1150 and 1210 cm−1) are related to the stretching of the C–F bond.53,54 On the other hand, since TFA salts are very hygroscopic, the broad band visible around 3450 cm−1 is related to the O–H stretching mode of the adsorbed water after film exposure to the ambient. Concerning the propionate groups, they have characteristic absorptions around 3000 cm−1 (C–H stretching modes) and in the carbonyl region (COO stretching modes between 1900–1500 cm−1).39,49 The existence of these regions is more apparent in Fig. S7 (ESI†) where Y(TFA)3 and NaProp are plotted together with solution 1 quenched from 145 °C. From Fig. 9 it is apparent that, in the temperature range between 145 and 300 °C, the bands related to the propionate ligand steadily decrease while the TFA bands remain nearly constant up to 270 °C and begin to decrease at 300 °C. To quantify the evolution of propionate and TFA ligands during pyrolysis, we have integrated the IR spectra in two regions: for the propionates, we integrated the band between 2800 and 3050 cm−1 of alkane absorptions while, for the TFA, we have integrated the contribution of C–F stretching in the band between 1100–1250 cm−1 (see Fig. 8(c)). The result has been plotted in Fig. 9 together with the evolution of the fragment m/z = 28 determined from the EGA-MS measurement (see Fig. S5, ESI†). Since fragment m/z = 28 is directly related to propionates decomposition, in Fig. 9 there is good agreement between the diminution of the amount of propionates and the EGA evolution. More interesting is the fact that, up to 300 °C, most propionate ligands have already decomposed while most of the TFA ligands remain. If we assume that all the TFA ligands remain after solution drying, we can evaluate the organic fraction that evolves from propionates and trifuoroacetates. The expected mass loss for the precursor to yield BYF and CuO is 54.7% (42.0% comes from propionates and 12.7% from trifuoroacetates). From TG, we know that at 275 °C, 31% of the precursor's mass has already evolved that corresponds to around 75% of the propionates, i.e. it represents the decomposition of 7.5 out of 10 propionate ligands of the precursor. Taking into account that the decomposition of trifluoroacetates represents 1/4th of the total mass evolved during pyrolysis and that the TFA ligands decompose at the very end of the pyrolysis stage, then TFA ligands remain unaltered even when a large percentage of the organic fraction has evolved. The presence of such skeleton of TFA ligands during pyrolysis may be the reason of the reduced shrinking at the first stages of decomposition (see below).
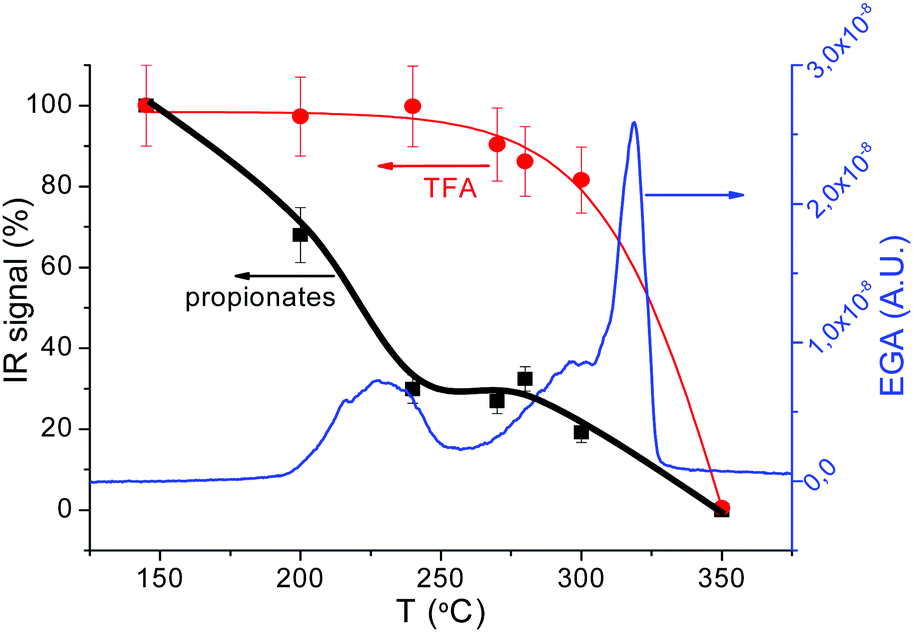 | ||
| Fig. 9 Comparison of the data obtained from IR spectroscopy and EGA during the pyrolysis of a film deposited with 1 + DEA solution. The blue curve corresponds to the EGA-MS analysis, m/z = 28 (propionates, CO), while the dots, with their guidelines, are the values obtained from the integration of IR bands, black for the integration between 2800–3050 cm−1 (propionates) and red for the bands between 1100–1200 cm−1 (TFA). | ||
In summary, our complementary analysis of the chemical transformations of low-fluorine CSD YBCO films has allowed us to conclude that, as indicated in Table 1, the metalorganic precursors experience two successive decomposition steps, which need to be considered to disclose the driving forces for wrinkling and cracking.
| Region | Evolved gases | Final solid phase |
|---|---|---|
| I: RT–150 °C | Solvent evaporation | Cu propionates, Ba and Y TFA/prop salts |
| II: 150–240 °C | CH3CH2COOH, CO2, C2H4O, CO | CuO, partial decomposition propionate bonds, mixed Ba and Y TFA/prop salts |
| III: 240–305 °C | C2HF3O2, CHF3, CO2, C2H4O, CO | CuO and BYF |
In situ film thickness evolution determined by optical interferometry
As we have mentioned at the beginning of this section, disclosing the reasons for wrinkling and cracking during pyrolysis requires understanding how the stress arises. We have already demonstrated that kinetic effects are relevant in the formation of these film instabilities (for instance the influence of the heating rate). This means that we need to identify thermo-kinetic effects associated to the pyrolysis treatment which may influence the generated in-plane stress. For this reason, a very significant contribution to the required analysis is to determine the film thickness evolution during the heating profile of the pyrolysis. This information can be obtained by in situ optical interferometry (OI), as we have described in the Methods section. This methodology can be reliably used only in the absence of wrinkling, so we were forced to perform these measurements using slow enough heating rates. As we have described before, after solution deposition our films (final film thickness in the range of 700–800 nm) were dried following the heating process of region I (20 °C min−1 up to 150 °C) leading to films with a typical thickness of 7 μm. We started, therefore, the thickness measurements in region II where at most a heating rate of 5 °C min−1 could be used to avoid wrinkling. Fig. 10(a) reports a typical result of the film thickness evolution of a film with final thickness in the range of 700 nm when heating rate is 5 °C min−1. To facilitate the correlation with the chemical transformations described in the previous section, we include in the same figure the mass evolution determined by TGA performed at a heating rate of 20 °C min−1. As a complementary information of the relationship between thickness reduction and mass loss, we calculated the mean density of the film (Fig. 10(b)) from these measurements.25 In solution-derived thin films the stress generated during the heating process characterizing the pyrolysis step has two different sources: the volume shrinkage associated to the chemical transformations, and the differential thermal expansion between the film and the substrate.18,19,61 | ||
| Fig. 10 (a) Comparison among mass and thickness evolution during pyrolysis measured by TGA and interferometry respectively. Film thickness is measured for a film with a final thickness of 700 nm prepared by IJP; (b) density changes with temperature. Density was calculated by dividing the mass obtained from the TGA measurements with the film volume measured by interferometry. In orange we highlighted the compressive stressed region where wrinkling is formed; in green the wrinkling release zone; in red the tensile stressed region where film cracks. (c) Thickness evolution over time during isotherms at 190 °C, 210 °C, 240 °C and 260 °C and mass evolution at 240 °C. In the negative time values we represented the thickness and mass decrease before reaching the isotherms, where the films were heated at 5 °C min−1. | ||
The first contribution has been modelled in the sol–gel derived films having a viscoelastic behaviour where syneresis stress, i.e. film contraction due to liquid mass loss, is dominant and it was concluded that stress is mainly tensile.1,2,25,26 The generated stress is proportional to the volumetric evaporation rate of solvents or the exhaust gases from decomposition reactions through the film surface and to the relaxation time of the viscous state while it is inversely proportional to the corresponding shear viscosity.25 The second contribution to stress is associated to differences in thermal expansion of films and substrates and it can be tensile or compressive, depending on the corresponding thermal expansion coefficients.20 The balance between these two contributions will determine if film instabilities, wrinkling or cracking, occurs through compressive or tensile stresses, respectively.
As we have described in the previous sections, our films may display wrinkling in the temperature range of 150–240 °C (region II) and within this temperature range the film thickness and the organic mass loss have decreased both ∼20% from the initial values before starting the pyrolysis (Fig. 10(a)). We remind also that within this temperature window only the propionates are decomposing (Fig. 8 and 9) and so this thickness decrease reflects the evolution towards a sparse metalorganic bonding skeleton in the film. This small film shrinking will generate a weak in-plane tensile stress in the metalorganic film due to the substrate clamping effect which, as we mentioned before, is kinetically controlled by the heating rate and so the decomposition rate and the film viscoelasticity.1,26,44
We also examined at which point the film thickness measured during a temperature ramp is influenced by kinetic effects, taking into account that we are in a viscoelastic regime and that the metalorganic decomposition process (mass loss) is thermally activated. For that reason, we performed analyses of the film thickness in isothermal regimes at different temperatures.
We recorded the film thickness evolution after a heating rate of 5 °C min−1 up to the selected temperature and then we continued the experiment at constant temperature. Fig. 10(c) reports the experimental results for several temperatures together with the mass loss registered following the same heating ramp and a final isothermal annealing at 240 °C. As it is discerned, the kinetic behaviour is identified in both cases by a continuous decrease of the thickness and the mass loss. It is straightforward to note, however, that the thickness decrease is slightly higher than the mass loss. This would indicate that indeed the film structure has some tendency to increase its compactness with time, i.e. thickness is essentially influenced by the mass loss but some viscoelastic behaviour cannot be discarded. The extrapolated thickness values at very long times at each temperature are also indicated in Fig. 10(a), where they can be compared with those measured under a heating ramp of 5 °C min−1.
We wonder now why wrinkling appears and why it displays a reversible or irreversible behaviour, depending on the heating rate (Fig. 4, Videos S2 and S3, ESI†).
Owing to the fact that the thermal expansion of metalorganic films is usually much higher than that of the substrate,19 it's very likely that the compressive stress required to generate wrinkles arises during heating, i.e. we should have a negative stress σc = [Ef(αs − αf)ΔT]/(1 − νf) where αf > αs, being αf and αs the thermal expansion coefficients of the film and substrate, respectively. The observation of wrinkling in the films should then arise from this compressive stress term that would overcome the small tensile stress associated to shrinking and so the total stress would go beyond the corresponding critical value for wrinkling.42 This conclusion is also in agreement with the observed heating rate dependence of wrinkling mentioned previously. Due to the fact that fast heating rates promote a reduced decomposition of the metalorganics and keep the film thickness fairly constant, we should expect a reduced tensile stress contribution. So, the overall stress would become more compressive and it would enhance wrinkling of the films.
Within this temperature window the mean density of the film remains fairly stable (Fig. 10(b)). We conclude, therefore, that within region II the compressive stress becomes the dominant term and if it goes beyond a critical value it leads to a wrinkled surface (Fig. 11(a)). The observation of the geometry of the wrinkled structure is also very useful to analyse the distribution of the compressive stress.41–43 The labyrinth-like structure of the wrinkles at the center of the films (Fig. 3, 4, Videos S1 and S5, ESI†) suggests that an isotropic differential thermal expansion generates a corresponding isotropic compressive stress.42,59,60 At the film edges, on the other hand, a tendency towards a radial stripe wrinkled structure is observed which suggests that a circular compressive stress is formed there. This could arise from an accelerated gas diffusion at the edges leading to a higher shrinkage and so to tensile radial stress with a corresponding circular compressive stress.59
 | ||
| Fig. 11 (a) Schema of the distribution of the in-plane stress associated to a gradient of the metalorganic composition across the films within the temperature region II where wrinkling occurs. A bilayer structure is formed because the top layer decomposes before. The difference in thermal expansion among both layers leads to a compressive stress (red arrow) in the top layer which would display a reduced thermal expansion; (b) schema of the in-plane tensile stress (red arrow) in the film within the temperature region III due to the films shrinkage which may eventually lead to crack formation. | ||
In the next section we will further analyse why the observed wrinkled surface instability may remain reversible or become irreversible.
We should conclude now this section by mentioning that region III, where cracking has been observed when the heating rate is too high, is also easily identified in the analysis of the film thickness and density evolution (Fig. 10(a and b)). Cracking initiated at defects and film edges occurs at temperatures in the range 240–290 °C and 290–320 °C, respectively (Fig. 5 and Video S1, ESI†). From 240 to 320 °C, the film thickness is reduced from 75% to the final 25% of the initial value after the pyrolysis, while the film density increases around 85% of the initial value (Fig. 10(b)). So in this temperature range, the tensile stress associated to film shrinkage is very likely the dominant term (Fig. 11(b)). In this region the remaining 25% of propionates and all TFA decompose breaking the Fluorine bonds leading to the formation of a nanoporous (∼50% final volume) film containing nanoparticles (BYF and CuO) and amorphous phases (Table 1). We consider that, within region II TFA groups constitute a molecular skeleton that impedes film shrinking. Once these groups evolve in region III, this skeleton collapses producing very high film shrinking. The in-plane tensile stress, associated to the film shrinkage impeded by the substrate, is the dominant driving force in the evolution of the mechanical properties of the films in this region III, producing their eventual cracking.
In situ thermomechanical analysis of the films
As a final analysis of the pyrolysis process, we investigated the thermomechanical properties of the films by using the TMA system described in the Experimental section. Essentially, the TMA consists of recording the displacement of a cannula in contact with the film under a constant load and the final displacement when the force is unloaded.37 A typical example of the recorded curve for a solid is indicated in Fig. S8 (ESI†) where the elastic recovery and the plastic deformation, when the force is unloaded, are identified. On the other hand, when TMA is performed in a viscous film or a liquid we observe a progressive displacement and no elastic recovery (see Fig. S9, ESI†). In this case, the recorded displacement vs. time (the loading curve) can be used to determine the viscosity of the liquid if the parameters corresponding to the geometrical factors of the cannula (radius R) and the applied force F are known.37 The viscosity is obtained by fitting the experimental curve with the formula:37,61,62 | (2) |
We performed TMA on several YBCO low-fluorine CSD films recording data at several temperatures within the range of the pyrolysis process. A typical example of the loading curves is presented in Fig. 12(a), corresponding to a 1 + DEA solution. The loads applied at different temperatures are indicated. Notice that during an extended temperature range of the pyrolysis, a variable viscosity versus temperature is achieved. This indicates that the CSD YBCO films have essentially a liquid-like behavior during this temperature range. The fitted value of the viscosity versus temperature of the 1 + DEA film is displayed in Fig. 12(b), while Fig. S10 (ESI†) shows similar results for other solutions. A characteristic feature of all the films is that the viscous behavior is initiated when we enter into region II (T > 150 °C) and also that the viscosity decreases to a minimum within this temperature region (η ∼ 600 Pa s). Finally, the transition to region III occurs when the viscosity increases again and the viscoelastic behavior is transformed to that typical of a stiff solid (increase of η at least by a factor 10). Direct assessment of a viscous deformation of the film is achieved by optical observation of the footprint left behind by the probe tip after a TMA experiment. When the sample was tested at the temperature region where a liquid state is formed the footprint is identified (see Fig. 12(c)). Due to the pressure exerted by the probe, the footprint surface is more flat than the wrinkled surface around it. The film has been drawn by the pressure exerted by the probe. These results help to understand the overall film instabilities described in detail in previous sections. Region II is where the reversible or irreversible wrinkling structures were observed and now we can infer that, actually, this region is characterized by a liquid-like behavior of the film with a minimum in the viscosity, precisely where the wrinkling is reversed in certain cases. Reversing the wrinkled structure requires that the relaxation time of the liquid state is not too long when compared to the heating rate and that the amplitude of the wrinkles is not too big. It's obvious then that small heating rates should promote reversibility of the wrinkled structures. Hence, the formation of an intermediate liquid state in the pyrolysis process is helping us to obtain high quality YBCO films by CSD. We must say that, as it will be shown in a forthcoming work,37 formation of a liquid during the pyrolysis heat treatment of precursor films is not an unusual phenomenon.63 In the present case the liquid appears on the metalorganic skeleton precursor of YBCO films presumably because of its amorphous structure that softens during heating.
 | ||
| Fig. 12 (a) Displacement curves over time obtained from the TMA measurements of films prepared with 1 + DEA solution. The applied load was 2 g except for the measurements performed at 140 °C and 320 °C; (b) temperature dependence of the viscosity values obtained from the TMA measurements of films prepared with 1 + DEA solution; (c) room temperature optical microscopy image evidencing the viscous deformation of a YBCO precursor film after a TMA experiment. The footprint (circular central region) has been produced by the TMA probe at 200 °C. Notice that the wrinkles are absent in the footprint. Optical image: 0.6 × 0.6 mm2. | ||
Unified picture of the pyrolysis process
A final summary of the overall behavior of the low-fluorine CSD YBCO films during the pyrolysis is gathered from the main physico-chemical characteristics defining the different temperature regions of Table 2. Region I is not mentioned anymore there because, as discussed before, it corresponds to the solvent drying process where no relevant microstructural modifications are observed, even at high heating rates. Region II is identified as the temperature window where only part of the propionates decomposes thus diluting the metalorganic bond skeleton. The film thickness reduction is moderate in this region (Fig. 13(a and b)). Through in situ measurements of the thickness evolution of the films of region II, we conclude that the tensile stress associated to film shrinkage is small. Thus, the higher thermal expansion of the metalorganic film with respect to the substrate leads to a compressive stress in the film. This temperature region is where wrinkling occurs becoming irreversible or not depending on the depth of the formed wrinkles. The relevance of the wrinkled structure can, therefore, be controlled by the heating rate. In fact, the heating rate determines the strength of the tensile stress which counteract the dominant compressive stress of the film originated from the differential thermal expansion between the film and the substrate. It's also very significant that this coincides with a liquid-like behavior of the film which promotes mass flow towards a planar structure and so a reversible wrinkled structure is detected.| Film parameter | Region II 150–240 °C | Region III 240–290 °C | Region III 290–320 °C |
|---|---|---|---|
| Stress type | Compressive (elastic recovery T < 200 °C) | Tensile (no elastic recovery) | Strong tensile (elastic recovery) |
| Stress effect on microstructure | Wrinkling labyrinth (initiated edges) (reversible 180–220 °C) | Cracking initiated at defects | Cracking initiated at edges |
| Organic mass loss | 0–50% | 50–90% | 90–100% |
| Thickness reduction | 0–30% | 30–65% | 65–75% |
| Mean density increase | Quasi stable | 0–40% | 40–85% |
| Decomposed precursor | Propionates (0–70%) | Propionates (70–80%) | Propionates (80–100%) |
| TFA (0–15%) | TFA (15–100%) | ||
| Viscosity | Decreasing with temperature. Lowest values | Increasing with temperature | No viscous behavior (nanoporous solid) |
 | ||
| Fig. 13 (a) Schema of the initial bonding skeleton of the metalorganic film after drying (end of region I), including all the propionate and TFA bonds with metal ions; (b) schema of the bonding skeleton at the end of region II, after losing most of the propionate bonds (70%); (c) schema of the porous nanometric stacking of the oxide and oxyfluoride after the pyrolysis process has been completed. | ||
Region III is where the tensile stress characterizing most of the CSD films is dominant, because here is where strong film shrinkage occurs, as evidenced by the film thickness reduction. Within this temperature region the remaining metalorganic skeleton is progressively destroyed. It is worth to remark the key role played by the TFA bonds to minimize the film shrinkage in this region, and so the tendency to generate cracks, an issue very relevant which would be strongly modified in fluorine free CSD films. In the initial stage of this region III the nucleation of cracks is facilitated by impurities or defects within the film, thus signalling the high relevance of process cleanness to achieve high quality thick films. On the other hand, when the film is free of these defects, crack nucleation is more scarce, being only observed at the thicker edges of the film. This is promoted when a coffee-ring effect occurs during solution deposition and drying. Hence, it stresses the relevance of achieving high film thickness homogeneity from the deposition till the drying stage. At this advanced stage of temperature in region III, the film viscosity is increased owing to the transformation of the metalorganics towards the porous nanoparticle ceramic (Fig. 13(c)). In the initial stages of region III, the film keeps the viscoelastic behavior (no elastic recovery is observed in TMA) while in the advanced stage, the elastic recovery is already observed by signalling the transformation towards a nanoporous solid. At the end of this region III, the film thickness is reduced by 75% and the film density is increased by 85%, as compared to the initial values of the dried films in region I. This strong volume shrinkage of the film attached to the substrate leads to an in-plane tensile stress which first generates cracks nucleating at defects (T ∼ 240–290 °C) and then, when the film becomes stiffer at the film edges (T ∼ 290–320 °C) (Table 2).64 We expect the identification of these regions to be general in the pyrolysis of CSD YBCO films. However, given the relevant role of the TFA groups in some of these regions, we anticipate that the temperature ranges and the consequences on the microstructure integrity will be strongly modified for fluorine free precursors, where the use of additional additives may be necessary.
Pyrolysis and growth of homogeneous thick YBa2Cu3O7 films
To conclude our study of the YBCO thick film formation using the low-fluorine CSD approach, we report on a typical case of homogeneous YBCO film grown after an optimized pyrolysis process. Fig. 14(a and b) present an OM image of a homogeneous YBCO film after pyrolysis and the corresponding film thickness map determined by means of OI, respectively. Fig. 1(b) displays a typical FIB-SEM cross section image showing a highly homogeneous composition and microstructure. As observed in Fig. 14(b), a fairly good thickness homogeneity is achieved in the range of 1.200–1.600 nm after the pyrolysis. Once these films are grown following the process described previously5,23 an epitaxial structure is achieved for YBCO, as demonstrated by X-ray diffraction patterns (Fig. 15(a and b)). A low resolution cross section scanning transmission electron microscopy (STEM) image confirms that a fairly good microstructural homogeneity is achieved in YBCO films prepared through a single deposition (Fig. 15(c)). The final film thickness of the grown films are typically in the range of 700–800 nm with fairly good epitaxial quality and homogeneous microstructure.23 The critical current density and total critical current demonstrated in these epitaxial films at 77 K and self-field are in the range of Jc = 3–4 MA cm−2 and Ic = 380–400 A cm−1 w−1, respectively. Therefore, demonstrating the attractive superconducting performances of single deposition thick CSD YBCO films.24,27,65 We should note that these high performances are strongly reduced when films are wrinkled or cracked.5,56,57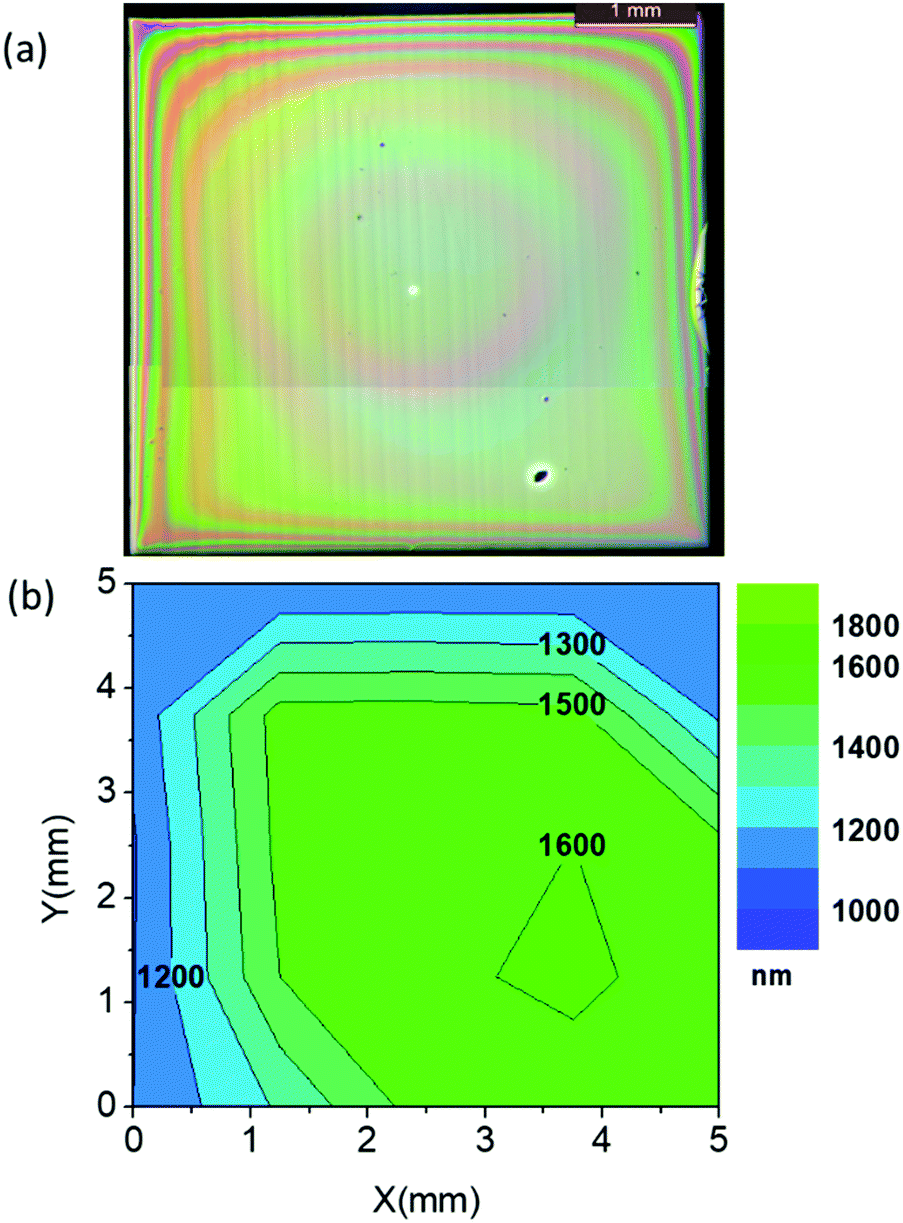 | ||
| Fig. 14 Thickness homogeneity achieved after an optimized pyrolysis process in the three identified regions (25 °C min−1; 1 °C min−1; 5 °C min−1) for a YBCO film prepared by IJP with solution 1 with a final thickness after growth in the range of 700–800 nm. (a) Optical microscopy image; (b) optical interferometry mapping of the film thickness. | ||
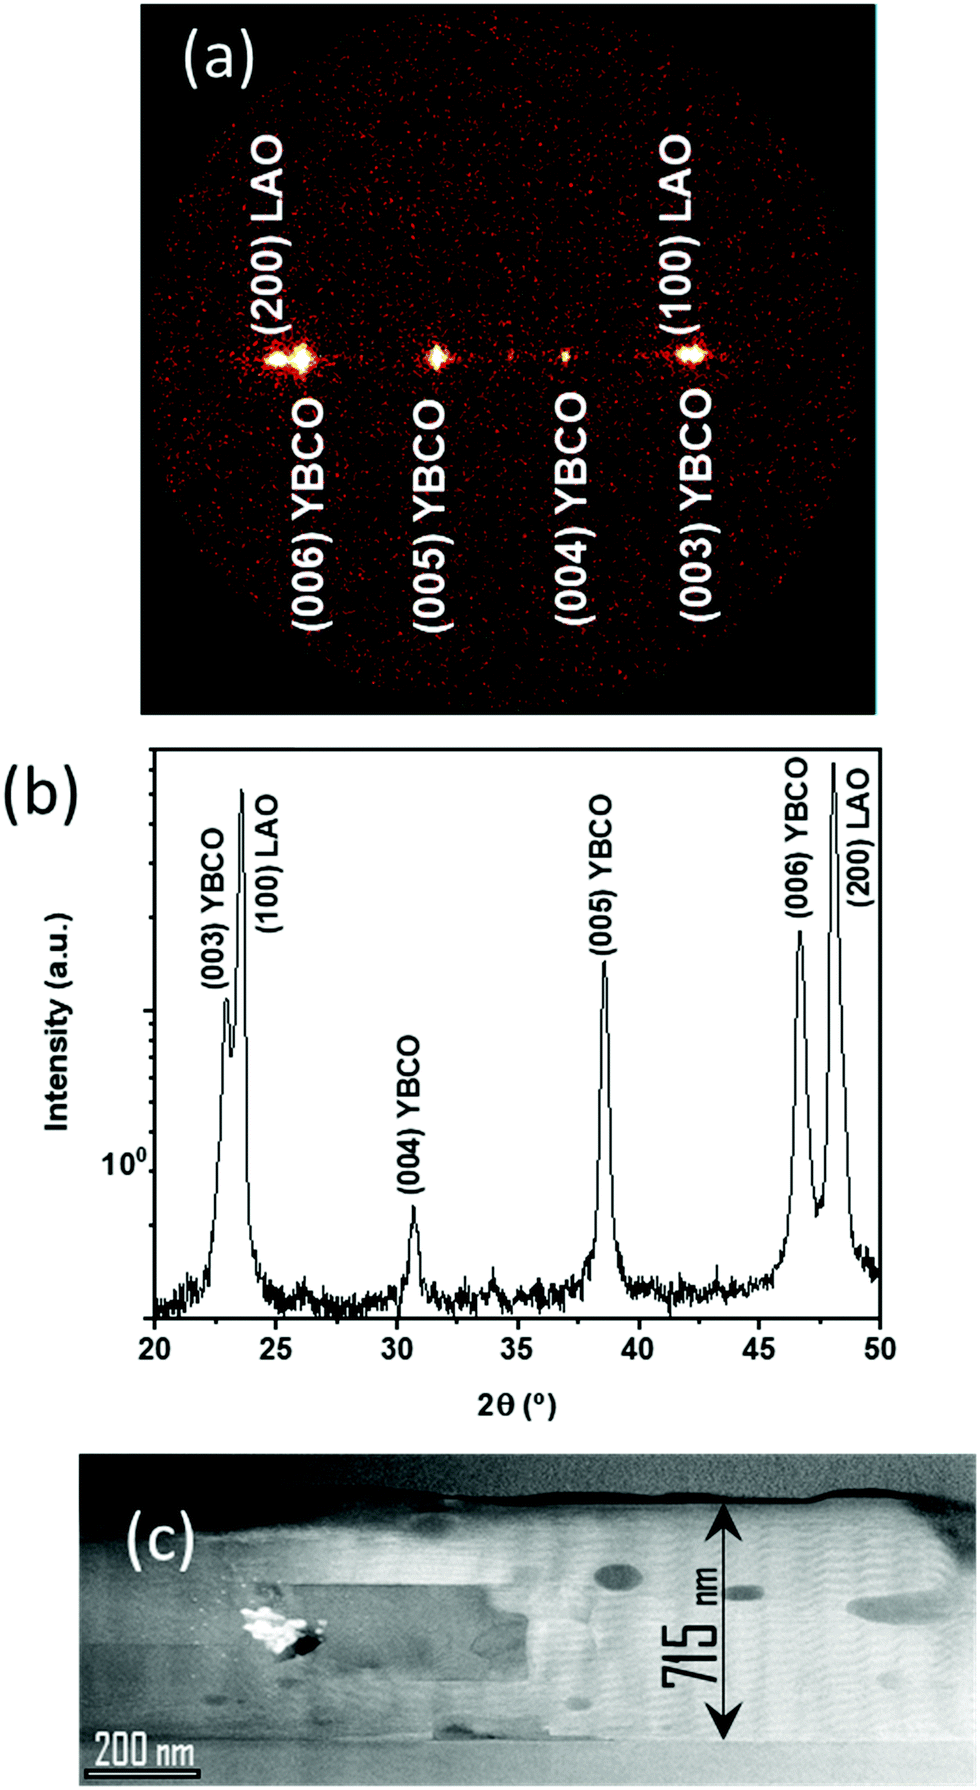 | ||
| Fig. 15 Growth of epitaxial YBCO film with a thickness of 800 nm from a solution 2 and IJP after optimal pyrolysis conditions in the three identified regions (25 °C min−1; 5 °C min−1; 5 °C min−1). (a) GADDS and (b) integrated θ–2θ XRD pattern of a YBCO film after growth; (c) low resolution STEM cross section image of a YBCO film with a thickness of 715 nm. | ||
Conclusions
In conclusion, we have performed a thorough analysis of the morphological, chemical, thermal and mechanical properties of the YBCO films derived from low-fluorine carboxylate precursors during the pyrolysis process. We show that the use of in situ physico-chemical characterization tools is extremely useful to disentangle the key mechanisms governing the interlinked phenomena occurring during the pyrolysis process. A unified picture has emerged concerning the influence of the carboxylate decomposition process and the films evolution, an issue very relevant to achieve high quality epitaxial films by CSD. The specific picture here discussed will depend on the presence of some TFA precursors, otherwise strong deviations are anticipated. We have identified the sequence of chemical transformations of the metalorganic skeleton leading to in-plane stress generation in the film. The identification of an intermediate liquid phase with a temperature dependent viscosity is a key finding providing the clue to understand why surface wrinkling can be reversible in certain cases. Our analysis has allowed to propose procedures to avoid the morphological transformations degrading the superconducting properties of the films, i.e. wrinkling and crack formation.The identification of the relevant parameters controlling the different stages of the pyrolysis has allowed us to optimize the pyrolysis process. Further progress in increasing the thickness of CSD YBCO films in a single deposition is envisaged, thus enhancing the attractiveness as a practical route for advanced manufacturing of superconducting films and conductors.
Experimental section
YBa2Cu3O7 precursor solutions
The YBCO precursor solutions used in this work were prepared by acetate–trifluoroacetate (low fluorine) route, as described in detail previously.33,35 Two Y, Ba, Cu metallorganic precursor solutions have been investigated using several salts, solvents and additives. In these fluorine reduced solutions, the precursors for CSD process were yttrium trifluoroacetate (Y-TFA, Aldrich), barium acetate (Ba(OAc)2, Aldrich) and copper acetate (Cu(OAc)2, Aldrich). A stoichiometric amount (Y:Ba:Cu = 1:2:3) of the precursors was dissolved in propionic acid (C2H5COOH, Aldrich, solution 1) and butanol/propionic acid (C4H9OH:C2H5COOH Scharlau:Aldrich, 80/20 solution 2). To solution 1, diethanolamine (DEA, Aldrich) was added in 0,5% in volume (solution 1 + DEA) (Table 3). The main purpose of using modified low-fluorine precursor inks concerns achieving good wettability and homogeneous films after deposition.
Thin films preparation
From the low-fluorine precursor solutions, final film thicknesses in the range ∼200–300 nm YBCO are obtained by spin-coating deposition on (001) LaAlO3 single crystal substrates (5 mm × 5 mm) at 6000 rpm during 2 minutes. For the thicker films (700–800 nm) either single pass IJP or spin coating multideposition was used as previously described.8,23 Solution 1 was used for multideposition spin coating while when used in IJP it leads to quite inhomogeneous films. Adding DEA to solution 1 improved the homogeneity of the IJP films but it was still unsatisfactory. The best ink for IJP was solution 2 which has suitable properties for inkjet printing deposition and leads to homogeneous films (Table 3).8,23 For IJP a piezoelectric actuator was used working with an asymmetric bipolar pulse (length 53 μs, width +23 V and −13 V). The droplet volume was 140 pL, the solution concentration of 0.5 M and the drop pitches were 60 × 60 μm for a final film thickness of 700 nm.| Ink | Precursors | Solvents additives (v/v%) | Concent. (∑metals) | Deposition |
|---|---|---|---|---|
| 1 | Ba(OAc)2 | Propionic acid | 0.5 M | IJP, inhomogeneous. spin coat |
| Cu(Oac)2 | ||||
| Y(TFA)3 | ||||
| 1 + DEA | Ba(OAc)2 | Propionic acid + DEA (5%) | 0.5 M | IJP, improved homogeneity |
| Cu(Oac)2 | ||||
| 2 | Ba(OAc)2 | Propionic acid/butanol (20%/80%) | 0.5 M | IJP, good homogeneity |
| Cu(Oac)2 | ||||
| Y(TFA)3 | ||||
IJP was used to prepare thick films for OM morphological observations, videos recordings, OI for thickness determination, TMA characterization and STEM and critical currents characterization of grown YBCO films. Spin coating was used to prepare films used for physico-chemical characterization tools such as TGA, DSC, EGA and FTIR.
The deposited coatings were first dried at 150 °C, at which stage they are amorphous, and then pyrolyzed in oxygen atmosphere to form precursor films. The heating rate was kept at between 2–15 °C min−1 in the temperature range from 100 °C to 500 °C, as described in the main text. Film solvent drying was carried out at 145 °C in air and heating during 45 min. The humid gas during pyrolysis was injected by bubbling the dry gas through deionized water (dew point 25 °C) into the tubular furnace when the furnace temperature was higher than 110 °C. The gas flow was 0.12 l min−1. Subsequently, the YBCO precursor layers were crystallized at 820 °C in humid N2/0.02% O2. In the last stage the crystallized films were oxygenated at 450 °C for 4 h in a dry oxygen atmosphere.23
Characterization measurements
The systematic analysis of the metalorganic solutions was carried out by measuring the viscosity with a Haake RheoStress 600 rheometer (ordinary interval around 12–16 mPa s at 22 °C), the contact angle with a DSA 100 analyzer (ordinary interval around 30°–35° on LAO substrates), the metal stoichiometry was checked by a volumetric assay and this was balanced to the 1:2:3 stoichiometry if necessary by the addition of metal-salts, and the water content in the solutions was measured by the Karl–Fischer method in order to keep it below 1 wt%.33
Simultaneous thermogravimetric (TG) and differential scanning calorimetry (DSC) analyses were performed in a Mettler Toledo thermo-balance, model TGA/DSC1, at 5 and 20 °C min−1 under a gas flow of 100 ml min−1 of a mixture of high purity humid O2 and synthetic air (Praxair, ≥99.999%). To simultaneously monitor the evolution of the volatiles during precursor decomposition, evolved gas analysis (EGA) was performed by coupling the TG furnace to a Fourier-transform infrared (FTIR) gas analyzer from Bruker (model ALPHA). A 40 cm long steel tube kept at 200 °C was used to connect the TG gas exhaust to the IR gas cell. A FTIR spectrum is recorded each 35 s with a wavenumber step of 2 cm−1. Samples consisted on films deposited on LAO substrates. Simultaneous TG/DTA analysis of the films were also performed at a heating rate of 5 °C min−1 in a humid O2 atmosphere using a Setaram Setsys Evolution 16 thermobalance. Mass spectroscopy (MS)-EGA was performed with a Spectra Quadrupole (Micro Vision Plus) from MKS Instruments heating rate of 5 °C min−1.39,49 EGA-MS of films was performed in vacuum (total pressure around 10−5 bar); films were heated up in a quartz tube directly connected to the MS chamber. The vacuum was achieved with a turbomolecular pump in series with a rotary pump. Ex situ infrared spectroscopy (FT-IR) was performed by a model Vertex 70 from Bruker on samples quenched after annealing at different times at fixed temperatures after heating at a rate of 5 °C min−1. EGA-MS experiments were performed by means of a quadrupole analyzer MKS model Microvision Plus. Optical microscopy (OM) images were recorded with an optical Olympus BX51 microscope coupled to a small heating stage (pyrolyzer), allowing to record in situ videos during the pyrolysis process. The pyrolizer could control the gas flow and temperature, and heating ramps up to 50 °C min−1. Thermomechanical analysis (TMA) experiments were carried out with the Setsys Evolution 1700 apparatus of Setaram equipped with fused quartz holder and hemispherical probe of radius 2.5 mm.37 A TMA experiment for viscosity measurement consists of approaching the holder end to the sample at zero load until it touches its surface. Then, a constant finite (positive) load is applied pushing the probe into the liquid film.
Film thickness measurements were carried out by optical interferometry (OI) using an apparatus from Filmetrics, model F20-UV with a spot size in the range of 0.7–1.0 μm. The accuracy of these measurements was verified by using a P16 profilometer from KLA Tencor to determine the film thickness at different stages (dried films, intermediate pyrolysis, fully pyrolyzed films). We concluded, therefore, that it was not necessary to modify the optical parameters of the films used to fit the film thickness evolution during the pyrolysis. In situ evolution of the film thickness could be determined when the OI was coupled to the pyrolyzer while thickness homogeneity maps could be obtained using an XY displacement stage. Film thicknesses in the range of 20 nm to 40 μm can be measured using a wavelength range from 190 to 1100 nm.
X-ray diffraction of the pyrolyzed and crystallized YBCO films was performed using a Bruker AXS GADDS diffractometer equipped with a 2D detector and operating with Cu Kα radiation. The surface morphology of the YBCO films was investigated using a scanning electron microscopy (SEM, FEI Quanta 200 FEG) and the FIB cross section images were performed by using a dual beam (SEM, FIB) Zeiss 1560 XB apparatus. Scanning transmission electron microscopy (STEM, FEI Titan 60-300 Microscope) was used to record cross section images of the YBCO films after growth. The superconducting properties were measured inductively using a SQUID magnetometer equipped with a 7 T superconducting coil (Quantum Design, San Diego, CA). The critical current density was determined using the Bean critical state model.
Authors contribution
X. O, T. P. and S. R. conceived and designed the experiments. B. V. and C. P. performed the synthetic experiments. B. V. performed the thermal annealing, optical and SEM characterization experiments. J. F. and P. R. performed the thermal and thermomechanical analysis of the films. B. M. prepared the samples and obtained the TEM images of the samples. A. P. performed the FIB and SQUID analyses. The manuscript was written through contributions from all the authors. All authors have given approval to the final version of the manuscript.Conflicts of interest
The authors declare no competing financial or non-financial interest.Acknowledgements
Authors acknowledge the EUROTAPES project (EU-FP7 NMP-LA-2012-280432) from EU Commisssion – DG RI, ULTRASUPERTAPE (ERC-2014-ADG-669504) from European Research Council, COACHSUPENERGY (MAT2014-51778-C2-1-R and MAT2014-51778-C2-2-R) and SuMaTe (RTI2018-095853-B-C21 and RTI2018-095853-B-C22) from MINECO (co-financed by the European Regional Development Fund), 2017-SGR 753 from Generalitat de Catalunya, and COST Action NANOCOHYBRI (CA16218). ICMAB authors acknowledge the Center of Excellence award Severo Ochoa SEV-2015-0496. Authors acknowledge the Scientific Services at ICMAB and ICN2 Electron Microscopy Division. We thank CNM-IMB for the use of their FIB services.References
- F. F. Lange, Science, 1996, 273, 903–909 CrossRef CAS PubMed.
- R. W. Schwartz, T. Schneller and R. Waser, C. R. Chim., 2004, 7, 433–461 CrossRef CAS.
- X. Obradors, T. Puig, M. Gibert, A. Queralto, J. Zabaleta and N. Mestres, Chem. Soc. Rev., 2014, 43, 2200–2225 RSC.
- N. Bassiri-Gharb, Y. Bastani and A. Bernal, Chem. Soc. Rev., 2014, 43, 2125–2140 RSC.
- X. Obradors, T. Puig, S. Ricart, M. Coll, J. Gazquez, A. Palau and X. Granados, Supercond. Sci. Technol., 2012, 25, 123001 CrossRef.
- I. Bretos, R. Jiménez, J. Ricote and M. L. Calzada, Chem. Soc. Rev., 2018, 47, 291–308 RSC.
- M. V. Kelso, N. K. Mahenderkar, Q. Chen, J. Z. Tubbesing and J. A. Switzer, Science, 2019, 364, 166–169 CAS.
- M. Vilardell, X. Granados, S. Ricart, I. Van Driessche, A. Palau, T. Puig and X. Obradors, Thin Solid Films, 2013, 548, 489–497 CrossRef CAS.
- I. Van Driessche, J. Feys, S. C. Hopkins, P. Lommens, X. Granados, B. A. Glowacki, S. Ricart, B. Holzapfel, M. Vilardell and A. Kirchner, et al. , Supercond. Sci. Technol., 2012, 25, 65017 CrossRef.
- A. Gupta, R. Jagannathan, E. I. Cooper, E. A. Giess, J. I. Landman and B. W. Hussey, Appl. Phys. Lett., 1988, 52, 2077–2079 CrossRef CAS.
- X. Obradors, T. Puig, A. Pomar, F. Sandiumenge, N. Mestres, M. Coll, A. Cavallaro, N. Roma, J. Gazquez and J. C. Gonzalez, et al. , Supercond. Sci. Technol., 2006, 19, S13 CrossRef CAS.
- T. Araki and I. Hirabayashi, Supercond. Sci. Technol., 2003, 16, R71 CrossRef CAS.
- T. G. Holesinger, L. Civale, B. Maiorov, D. M. Feldmann, J. Y. Coulter, D. J. Miller, V. A. Maroni, Z. Chen, D. C. Larbalestier and R. Feenstra, et al. , Adv. Mater., 2008, 20, 391–407 CrossRef CAS.
- D. Larbalestier, A. Gurevich, D. M. Feldmann and A. Polyanskii, Nature, 2001, 414, 368–377 CrossRef CAS PubMed.
- Y. Shiohara, T. Taneda and M. Yoshizumi, Jpn. J. Appl. Phys., 2011, 51, 10007 CrossRef.
- X. Obradors and T. Puig, Supercond. Sci. Technol., 2014, 27, 44003 CrossRef.
- H. Kozuka, M. Kajimura, T. Hirano and K. Katayama, J. Sol-Gel Sci. Technol., 2000, 19, 205–209 CrossRef CAS.
- H. Kozuka, J. Sol-Gel Sci. Technol., 2006, 40, 287–297 CrossRef CAS.
- K. Ohno, H. Uchiyama and H. Kozuka, J. Appl. Phys., 2012, 111, 14901 CrossRef.
- P. Cop, S. Kitano, K. Niinuma, B. M. Smarsly and H. Kozuka, Nanoscale, 2018, 10, 7002–7015 RSC.
- A. Llordes, K. Zalamova, S. Ricart, A. Palau, A. Pomar, T. Puig, A. Hardy, M. K. Van Bael and X. Obradors, Chem. Mater., 2010, 22, 1686–1694 CrossRef CAS.
- S. Morlens, N. Roma, S. Ricart, A. Pomar, T. Puig and X. Obradors, J. Mater. Res., 2007, 22, 2330–2338 CrossRef CAS.
- C. Pop, B. Villarejo, F. Pino, B. Mundet, S. Ricart, M. de Palau, T. Puig and X. Obradors, Supercond. Sci. Technol., 2019, 32, 15004 CrossRef.
- H. Rijckaert, P. Cayado, R. Nast, J. Diez Sierra, M. Erbe, P. López Dominguez, J. Hänisch, K. De Buysser, B. Holzapfel and I. Van Driessche, Coatings, 2020, 10, 17 CrossRef CAS.
- S. J. Kwon, J.-H. Park and J.-G. Park, Phys. Rev. E: Stat., Nonlinear, Soft Matter Phys., 2005, 71, 11604 CrossRef.
- C. J. Brinker and G. W. Scherer, Sol-gel science: the physics and chemistry of sol-gel processing, Academic Press, 2013 Search PubMed.
- K. Nakaoka, R. Yoshida, K. Kimura, T. Kato, Y. Usui, T. Izumi and Y. Shiohara, Supercond. Sci. Technol., 2017, 30, 55008 CrossRef.
- K. Zalamova, N. Romà, A. Pomar, S. Morlens, T. Puig, J. Gázquez, A. E. Carrillo, F. Sandiumenge, S. Ricart and N. Mestres, et al. , Chem. Mater., 2006, 18, 5897–5906 CrossRef CAS.
- L. H. Jin, C. S. Li, Z. M. Yu, J. Q. Feng, S. N. Zhang, A. Sulpice, Y. Wang and P. X. Zhang, Appl. Surf. Sci., 2015, 355, 736–742 CrossRef CAS.
- Z. Gu, C. Cui, J. Yu, C. Bai, Y. Guo, Y. Lu, Z. Liu, Q. Lu, L. Sang and C. Cai, IEEE Trans. Appl. Supercond., 2016, 26, 1–7 Search PubMed.
- J. T. Dawley, P. G. Clem, M. P. Siegal, D. R. Tallant and D. L. Overmyer, J. Mater. Res., 2002, 17, 1900–1903 CrossRef CAS.
- J. Yoshida, K. Tada, T. Tanaka, N. Mori, K. Yamada, R. Teranishi, M. Mukaida, T. Kiss, M. Inoue and Y. Shiohara, et al. , Phys. C, 2008, 468, 1550–1553 CrossRef CAS.
- X. Palmer, C. Pop, H. Eloussifi, B. Villarejo, P. Roura, J. Farjas, A. Calleja, A. Palau, X. Obradors, T. Puig and S. Ricart, Supercond. Sci. Technol., 2016, 29, 024002 CrossRef.
- P. Cayado, B. Mundet, H. Eloussifi, F. Vallés, M. Coll, S. Ricart, J. Gázquez, A. Palau, P. Roura, J. Farjas, T. Puig and X. Obradors, Supercond. Sci. Technol., 2017, 30, 125010 CrossRef.
- N. Roma, S. Morlens, S. Ricart, K. Zalamova, J. M. Moreto, A. Pomar, T. Puig and X. Obradors, Supercond. Sci. Technol., 2006, 19, 521 CrossRef CAS.
- M. Li, P. Cayado, M. Erbe, A. Jung, J. Hänisch, B. Holzapfel, Z. Liu and C. Cai, Coatings, 2020, 10, 31 CrossRef CAS.
- P. Roura-Grabulosa, J. Farjas, P. López-Olmedo, B. Villarejo, S. Ricart, X. Obradors and T. Puig, to be published.
- M. Erbe, J. Hänisch, T. Freudenberg, A. Kirchner, I. Mönch, S. Kaskel, L. Schultz and B. Holzapfel, J. Mater. Chem. A, 2014, 2, 4932–4944 RSC.
- S. Rasi, F. Silveri, S. Ricart, X. Obradors, T. Puig, P. Roura-Grabulosa and J. Farjas, J. Anal. Appl. Pyrolysis, 2019, 140, 312–320 CrossRef CAS.
- D. Soltman and V. Subramanian, Langmuir, 2008, 24, 2224–2231 CrossRef CAS PubMed.
- N. Bowden, S. Brittain, A. G. Evans, J. W. Hutchinson and G. M. Whitesides, Nature, 1998, 393, 146 CrossRef CAS.
- J. Y. Chung, A. J. Nolte and C. M. Stafford, Adv. Mater., 2011, 23, 349–368 CrossRef CAS PubMed.
- J. Genzer and J. Groenewold, Soft Matter, 2006, 2, 310–323 RSC.
- T. Tanaka, S.-T. Sun, Y. Hirokawa, S. Katayama, J. Kucera, Y. Hirose and T. Amiya, Nature, 1987, 325, 796–798 CrossRef CAS.
- E. P. Chan and A. J. Crosby, Soft Matter, 2006, 2, 324–328 RSC.
- H. Mei, R. Huang, J. Y. Chung, C. M. Stafford and H.-H. Yu, Appl. Phys. Lett., 2007, 90, 151902 CrossRef.
- H. Huang, J. Y. Chung, A. J. Nolte and C. M. Stafford, Chem. Mater., 2007, 19, 6555–6560 CrossRef CAS.
- D. Sanchez-Rodriguez, J. Farjas, P. Roura, S. Ricart, N. Mestres, X. Obradors and T. Puig, J. Phys. Chem. C, 2013, 117, 20133–20138 CrossRef CAS.
- S. Rasi, S. Ricart, X. Obradors, T. Puig, P. Roura and J. Farjas, J. Anal. Appl. Pyrolysis, 2018, 133, 225–233 CrossRef CAS.
- M. S. Akanni, E. K. Okoh, H. D. Burrows and H. A. Ellis, Thermochim. Acta, 1992, 208, 1–41 CrossRef CAS.
- S. Rasi, S. Ricart, X. Obradors, T. Puig, P. Roura-Grabulosa and J. Farjas, J. Anal. Appl. Pyrolysis, 2019, 141, 104640 CrossRef CAS.
- H. Eloussifi, J. Farjas, P. Roura, S. Ricart, T. Puig, X. Obradors and M. Dammak, Thermochim. Acta, 2013, 556, 58–62 CrossRef CAS.
- H. Eloussifi, J. Farjas, P. Roura, J. Camps, M. Dammak, S. Ricart, T. Puig and X. Obradors, J. Therm. Anal. Calorim., 2012, 108, 589–596 CrossRef CAS.
- J. Farjas, J. Camps, P. Roura, S. Ricart, T. Puig and X. Obradors, Thermochim. Acta, 2012, 544, 77–83 CrossRef CAS.
- S. Rasi, S. Ricart, X. Obradors, T. Puig, P. Roura-Grabulosa and J. Farjas, J. Anal. Appl. Pyrolysis, 2019, 143, 104685 CrossRef.
- J. Gazquez, F. Sandiumenge, M. Coll, A. Pomar, N. Mestres, T. Puig, X. Obradors, Y. Kihn, M.-J. Casanove and C. Ballesteros, Chem. Mater., 2006, 18, 6211–6219 CrossRef CAS.
- K. Nakaoka, J. Matsuda, Y. Kitoh, T. Goto, Y. Yamada, T. Izumi and Y. Shiohara, Phys. C, 2007, 463, 519–522 CrossRef.
- W. E. Wallace, in Infrared spectra, ed. P. J. Linstrom and W. G. Mallard, NIST Chem WebBook, NIST Stand Ref Database, Institute of Standards and Technology, Gaithersburg, MD, 2019, p. 20899 Search PubMed.
- P. J. Yoo and H. H. Lee, Phys. Rev. Lett., 2003, 91, 154502 CrossRef PubMed.
- H. Vandeparre and P. Damman, Phys. Rev. Lett., 2008, 101, 124301 CrossRef PubMed.
- A. A. Svintsov, O. V. Trofimov and S. I. Zaitsev, J. Vac. Sci. Technol., B: Microelectron. Nanometer Struct.–Process., Meas., Phenom., 2007, 25, 2435–2438 CrossRef CAS.
- C. Wang, Y.-C. Liao, J. P. Chu and C.-H. Hsueh, Mater. Des., 2017, 123, 112–119 CrossRef CAS.
- P. Roura, J. Farjas, J. Camps, S. Ricart, J. Arbiol, T. Puig and X. Obradors, J. Nanopart. Res., 2011, 13, 4085–4096 CrossRef CAS.
- C. J. Brinker, A. J. Hurd, P. R. Schunk, G. C. Frye and C. S. Ashley, J. Non-Cryst. Solids, 1992, 147, 424–436 CrossRef.
- T. Izumi, M. Yoshizumi, M. Miura, Y. Sutoh, T. Nakanishi, A. Nakai, Y. Ichikawa, Y. Yamada, T. Goto and A. Yajima, et al. , Phys. C, 2008, 468, 1527–1530 CrossRef CAS.
Footnote |
| † Electronic supplementary information (ESI) available: Videos S1–S5 of optical microscopy of films during heating where the regimes corresponding to wrinkling and cracking formation. Fig. S1–S10 of additional characterization of the films. See DOI: 10.1039/d0tc01846e |
| This journal is © The Royal Society of Chemistry 2020 |