 Open Access Article
Creative Commons Attribution 3.0 Unported Licence
Structural and electronic evolution in the Cu3SbS4–Cu3SnS4 solid solution†
Kan
Chen
 *a,
Cono
Di Paola
b,
Savio
Laricchia
b,
Michael J.
Reece
a,
Cedric
Weber
b,
Emma
McCabe
 c,
Isaac
Abrahams
 *d and
Nicola
Bonini
b
aSchool of Engineering and Materials Science, Queen Mary University of London, Mile End Road, London E1 4NS, UK. E-mail: kan.chen@qmul.ac.uk
bDepartment of Physics, King's College London, London WC2R 2LS, UK
cSchool of Physical Sciences, University of Kent, Canterbury, Kent, CT2 7NH, UK
dSchool of Biological and Chemical Sciences, Queen Mary University of London, Mile End Road, London E1 4NS, UK. E-mail: i.abrahams@qmul.ac.uk
First published on 15th July 2020
Abstract
Cu3Sb1−xSnxS4 samples with 0.0 ≤ x ≤ 1.0 were synthesized from pure elements by mechanical alloying combined with spark plasma sintering. The structural and electronic properties of these compounds were characterized by powder X-ray and neutron diffraction, X-ray photoelectron spectroscopy (XPS), magnetic susceptibility and electrical and thermal transport measurements, and the experimental results compared against those calculated from hybrid density functional theory. A full solid solution is found between famatinite (Cu3SbS4) and kuramite (Cu3SnS4), with low x-value compositions in the Cu3Sb1−xSnxS4 system exhibiting the ordered famatinite structure and compositions above x = 0.7 showing progressive disorder on the cation sublattice. The semiconducting behaviour of Cu3SbS4 becomes increasingly more metallic and paramagnetic with increasing Sn content as holes are introduced into the system. Neutron diffraction data confirm that the sulfur stoichiometry is maintained, while XPS results show Cu remains in the monovalent oxidation state throughout, suggesting that hole carriers are delocalized in the metallic band structure. The order–disorder transition is discussed in terms of the defect chemistry and the propensity towards disorder in these compounds.
1. Introduction
Over the past few years, several copper-based multinary sulfides such as the Cu–Sn–S, Cu–Sn–Zn–S and Cu–Sb–S compounds have been reported as promising thermoelectric materials and high-efficiency absorbers for photovoltaic applications.1–9 The multinary nature of these compounds is the key feature that enables the tunability and versatility of the electronic and transport properties of these systems. However, the large compositional space makes it quite difficult to control competing phases or compositional variations within a sample, as well as to characterize and fully exploit cation disorder and defect chemistry in these compounds. For instance, compositional fluctuations within a sample and cation disorder have been identified as limiting factors in the performance of kesterite, Cu2ZnSnS4, solar cells.10 On the other hand, while detrimental in photovoltaic absorbers, cation disorder can be beneficial in materials for thermoelectric applications, as it can introduce additional phonon scattering mechanisms, providing a way to reduce the lattice thermal conductivity.11 Understanding the origin and the effect of atomic disorder and the competition among different phases in multinary compounds is therefore crucial for the optimization of these materials for next-generation photovoltaic and thermoelectric devices.Here, we explore the structural and electronic properties of the quaternary Cu3Sb1−xSnxS4 system that lies in the compositional space between famatinite, Cu3SbS4, and kuramite, Cu3SnS4. This is an interesting system, as the two end-members share the same underlying zinc blende derived lattice, with structural parameters differing by only about 0.6%,12 suggesting the possibility of forming a solid solution with stable intermediate compositions. On the other hand, the two parent compounds display quite different electronic and structural properties and the possibility of mixing the two phases provides a direct way to explore the coexistence or crossover between the semiconducting (ordered) and metallic (disordered) phases.
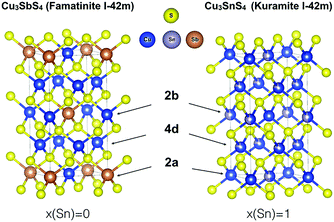
Indeed, famatinite (Fig. 1) is a semiconductor with a crystal structure characterized by the ordered arrangement of S-based tetrahedral motifs, where each S atom is surrounded by one antimony and three copper atoms (S–Cu3Sb). The bonding and electronic properties of this compound are intimately related to the fact that the S–Cu3Sb building block provides a way to fully satisfy the octet rule for the sulfur atom; indeed the number of electrons, N, in the valence orbitals of each sulfur is 8, if we assume that Sb and Cu are in the +5 and +1 oxidation states, respectively. In contrast, kuramite is a metallic-like compound that displays partial disorder on the cation sites (Fig. 1). The structure can be viewed as a random arrangement of different S-based motifs, where S atoms are surrounded by four cations, of which at least one is a Cu atom.
While in principle there are four possible building blocks (S–CuSn3, S–Cu2Sn2, S–Cu3Sn and S–Cu4), it is worth noting that in none of these tetrahedra is the sulfur octet rule fully satisfied. Assuming the oxidation state of Sn is +4, N is 9.25, 8.5, 7.75, and 7 for S–CuSn3, S–Cu2Sn2, S–Cu3Sn, and S–Cu4, respectively. One might expect that the more energetically favoured motifs might correspond to smaller deviations from the octet rule, but this has not yet been investigated in detail in this system. In addition, it is important to point out that in the literature it has been suggested that kuramite might also contain Cu in the +2 oxidation state (in particular, two Cu+ and one Cu2+ per formula unit).13 While electron paramagnetic resonance spectroscopy has been used to support this thesis, X-ray photoelectron spectroscopy (XPS) studies have reported contradictory results.14 Indeed, Xiong et al.15 and Hu et al.16 reported the coexistence of Cu+ and Cu2+ in nanorods and tube-like nanoshells, respectively, while more recently Goto et al.17 found no evidence for the presence of Cu2+ in polycrystalline Cu-deficient kuramite samples. To shed light on the local electronic environment around Cu in kuramite (and therefore on the valence state of Cu), what is needed is a better understanding of the mixed ionic-covalent character of the Cu–S bond in kuramite, as well as of the metallic nature of this compound.
In previous work we have shown that famatinite can be doped with group 14 elements such as Ge and Sn, with very positive effects on their thermoelectric properties.6,9 However, while for Ge doping a competitive second phase (Cu2GeS3) was formed even at very low doping concentrations (x ∼ 0.125 on the Sb site), Sn proved to be very soluble at the doping levels investigated (up to x = 0.15), we found evidence that Sn substitutes for Sb atoms in the 2a crystallographic site, with no kuramite-like cation disorder. Thus, it is still unclear what level of Sn content can trigger cation disorder and, more importantly, how the disorder can affect the bonding and electronic properties of the compound. In addition, Sn is a very effective p-type dopant at low concentrations, but the evolution of the electronic structure and the carrier density at high Sn content has not yet been investigated. This is very relevant for thermoelectric applications; even though kuramite exhibits metallic behaviour, it has been shown that the carrier concentration of this compound can be favourably tuned by the addition of excess Sn, as well as in stannite–kuramite solid solutions, Cu2+xFe1−xSnS4−y with x ∼ 0.8.1,3 It is also noteworthy that the metallic character of kuramite has attracted interest in the field of dye-sensitized solar cells, where this compound has been suggested as a platinum-free cathode.18
In the present work, we investigate the stability, and structural and electrical properties of the famatinite–kuramite solid solution system as a function of Sn content. Using XPS, X-ray and neutron diffraction, and magnetic measurements supported by theoretical calculations, a detailed description of the order–disorder transition is presented. This transition is found to leave a fingerprint in the electronic properties at high Sn content.
2. Experimental and computational details
2.1 Synthesis
Polycrystalline Cu3Sb1−xSnxS4 (0.0 ≤ x ≤ 1.0) samples were prepared by mechanical alloying (MA) combined with spark plasma sintering (SPS). Starting powders of Cu (99.5%, Alfa Aesar), Sb (99.5%, Alfa Aesar), Sn (99.999%, Alfa Aesar), and S (reagent grade, purified by sublimation, Sigma-Aldrich) were loaded into a stainless-steel jar with stainless steel balls and sealed in an inert atmosphere of argon. The powder mixture was milled at a rotation speed of 420 rpm for 20 h in a planetary ball mill (QM-3SP2, Nanjing University, China). The powders were sintered at 723 K for 3 min, at a pressure of 50 MPa, using a SPS furnace (FCT HPD 25, FCT System GmbH, Germany).2.2 Characterization
X-ray photoelectron spectroscopy (XPS) data were collected on an ESCALAB 250 X-ray photoelectron spectrometer (Thermo Corp.) All spectra were calibrated using C1s with a binding energy of 284.8 eV. The Cu, Sb and Sn contents were determined by inductively coupled plasma optical emission spectrometry (ICP-OES) and the S content was determined by combustion analysis (LECO). Field-cooled (FC) and zero-field-cooled (ZFC) magnetisation was measured on warming in an applied field of 1000 Oe using a QD MPMS. Samples were sealed in gelatine capsules in an argon-filled glove-box prior to the magnetization measurements.The phase behaviour of the samples was examined using X-ray powder diffraction (XRD) with a PANalytical X’Pert Pro diffractometer fitted with an X’Celerator detector. Data were collected at room temperature using Ni filtered Cu-Kα (λ1 = 1.54056 Å and λ2 = 1.54439 Å) radiation, in flat plate θ/θ geometry, over the 2θ range 5–120°, in steps of either 0.033° or 0.0167°, with an effective count time of 200 s per step. For detailed structural analysis, neutron powder diffraction data were collected on the Polaris diffractometer at the ISIS Facility, Rutherford Appleton Laboratory, UK. Data collections of ca. 1000 μA h proton beam equivalent were made on samples contained in 11 mm diameter thin walled vanadium cans. Data collected on back-scattering (average angle 146.72°) and 90° (average angle 92.5°) detector banks were used in subsequent refinements. A combined X-ray and neutron Rietveld approach was used for structure refinement using the GSAS suite of programmes.19 The models of Pfitzner et al.12 for Cu3SbS4 and Goto et al.3 for Cu3SnS4, both in space group I![[4 with combining macron]](https://www.rsc.org/images/entities/char_0034_0304.gif) 2m, were used as starting models for the structure refinement. The fitted diffraction profiles are given in the ESI† (Fig. S1–S4). Crystal and refinement parameters are summarized in Table 1.
2m, were used as starting models for the structure refinement. The fitted diffraction profiles are given in the ESI† (Fig. S1–S4). Crystal and refinement parameters are summarized in Table 1.
| a For definition of R-factors see ref. 19. b Main phase Cu3SnS4 (0.9315(7) weight fraction), secondary phase: CuS (0.068(2) weight fraction). | ||||
|---|---|---|---|---|
| Composition | x = 0.0 | x = 0.4 | x = 0.7 | x = 1.0b |
| Formula | Cu3SbS4 | Cu3Sb0.6Sn0.4S4 | Cu3Sb0.3Sn0.7S4 | Cu3SnS4 |
| M r | 881.26 g mol−1 | 878.81 g mol−1 | 876.97 g mol−1 | 875.14 g mol−1 |
| Crystal system | Tetragonal | Tetragonal | Tetragonal | Tetragonal |
| Space group |
I![[4 with combining macron]](https://www.rsc.org/images/entities/char_0034_0304.gif) 2m 2m |
I![[4 with combining macron]](https://www.rsc.org/images/entities/char_0034_0304.gif) 2m 2m |
I![[4 with combining macron]](https://www.rsc.org/images/entities/char_0034_0304.gif) 2m 2m |
I![[4 with combining macron]](https://www.rsc.org/images/entities/char_0034_0304.gif) 2m 2m |
| Unit cell dimensions | a = 5.3872(12) Å | a = 5.3809(4) Å | a = 5.3763(5) Å | a = 5.3928(29) Å |
| c = 10.748(2) Å | c = 10.7358(8) Å | c = 10.7383(9) Å | c = 10.758 (6) Å | |
| Volume | 311.9(2) Å3 | 310.84(7) Å3 | 310.39(8) Å3 | 312.9(5) Å3 |
| Z | 2 | 2 | 2 | 2 |
| D calc | 4.691 Mg m−3 | 4.695 Mg m−3 | 4.692 Mg m−3 | 4.645 Mg m−3 |
| R-factorsa | Neut., b.s. | Neut., b.s. | Neut., b.s. | Neut., b.s. |
| R wp = 0.0227 | R wp = 0.0235 | R wp = 0.0230 | R wp = 0.0227 | |
| R p = 0.0297 | R p = 0.0331 | R p = 0.0326 | R p = 0.0291 | |
| R ex = 0.0035 | R ex = 0.0034 | R ex = 0.0033 | R ex = 0.0034 | |
| R F 2 = 0.0653 | R F 2 = 0.0587 | R F 2 = 0.0657 | R F 2 = 0.0481 | |
| Neut. 90° | Neut. 90° | Neut. 90° | Neut. 90° | |
| R wp = 0.0237 | R wp = 0.0271 | R wp = 0.0264 | R wp = 0.0296 | |
| R p = 0.0281 | R p = 0.0383 | R p = 0.0397 | R p = 0.0503 | |
| R ex = 0.0023 | R ex = 0.0023 | R ex = 0.0023 | R ex = 0.0023 | |
| R F 2 = 0.0874 | R F 2 = 0.1096 | R F 2 = 0.1219 | R F 2 = 0.1237 | |
| X-ray | X-ray | X-ray | X-ray | |
| R wp = 0.0956 | R wp = 0.0686 | R wp = 0.0704 | R wp = 0.1040 | |
| R p = 0.0757 | R p = 0.0525 | R p = 0.0544 | R p = 0.0827 | |
| R ex = 0.0873 | R ex = 0.0467 | R ex = 0.0430 | R ex = 0.0898 | |
| R F 2 = 0.1710 | R F 2 = 0.1068 | R F 2 = 0.1302 | R F 2 = 0.2186 | |
| Totals | Totals | Totals | Totals | |
| R wp = 0.0234 | R wp = 0.0259 | R wp = 0.0254 | R wp = 0.0270 | |
| R p = 0.0584 | R p = 0.0499 | R p = 0.0519 | R p = 0.0662 | |
| χ 2 = 44.37 | χ 2 = 41.37 | χ 2 = 41.36 | χ 2 = 61.34 | |
| No. of variables | 109 | 109 | 109 | 119 |
| No. of profile points used | 3979 (Neut., b.s.) | 3966 (Neut., b.s.) | 3966 (Neut., b.s.) | 4002 (Neut., b.s.) |
| 2300 (Neut., 90°) | 2355 (Neut., 90°) | 2355 (Neut., 90°) | 2357 (Neut., 90°) | |
| 3289 (X-ray) | 6469 (X-ray) | 6580 (X-ray) | 3289 (X-ray) | |
| No. of reflections | 1316 (Neut., b.s.) | 1558 (Neut., b.s.) | 1498 (Neut., b.s.) | 2867 (Neut., b.s.) |
| 1152 (Neut., 90°) | 1424 (Neut., 90°) | 1418 (Neut., 90°) | 2826 (Neut., 90°) | |
| 181 (X-ray) | 181 (X-ray) | 186 (X-ray) | 363 (X-ray) | |
The electrical resistivity and Seebeck coefficient were measured using a commercial instrument (LSR-3/110, Linseis) in a He atmosphere. The uncertainty in resistivity and Seebeck coefficient values is less than 5%. The thermal diffusivity was measured using the flash diffusivity method (LFA 457, Netzsch). The specific heat capacity (Cp) was estimated using the Dulong–Petit law. The uncertainty in thermal diffusivity measurements was less than 5%. The density was measured using the Archimedes method with an uncertainty of less than 1% and all of the samples had a relative density greater than 98%. The thermal conductivity was calculated using the thermal diffusivity, specific heat capacity and density.
2.3 Computational methods
The theoretical calculations were performed within density functional theory (DFT) using the projector augmented wave method (PAW),20 as implemented in the Vienna ab initio simulation package (VASP).21,22 Both the Perdew, Burke and Ernzerhof (PBE) and Heyd, Scuseria and Ernzerhof (HSE06) hybrid functionals were used. A primitive cell of 8 atoms was used to describe Cu3SbS4 in the famatinite crystal structure, while a supercell of 64 atoms (2 × 2 × 2) was built to model the Cu3Sb1−xSnxS4 systems with x = 0.000, 0.125, 0.250, 0.500 and 0.750. To capture the disorder we used special quasi-random structures built with the Supercell program.23 Larger unit cells were also tested, but 64-atom cells were found to offer the best compromise between speed and accuracy in describing the disorder using HSE06. Lattice parameters and internal positions were fully relaxed (but constraining the cell to be tetragonal). A plane wave energy cutoff of 550 eV and a 6 × 6 × 6 k-point grid were used for the sampling of the Brillouin zone of the primitive cell. Core binding energies were computed within the Δ self-consistent field approximation at the DFT level of theory. The calculations were done using the Questaal package,‡ within a Full Potential Linear Muffin-Tin Orbital (FP-LMTO) framework.24 The smoothed LMTO basis used in this work includes atomic orbitals with l ≤ lmax = 4, with the 4d orbitals of Sb, Sn and Cu added in the form of local orbitals.25 The electronic transport parameters were computed using the Wannier interpolation with the BoltzWann code.26 The temperature and doping level dependent transport properties were computed using standard Boltzmann transport theory within the constant relaxation time approximation, and doping was simulated via a shift of the chemical potential.3. Results and discussion
3.1 Stability and structural properties
Compositional analysis results for selected compositions in the Cu3Sb1−xSnxS4 system are given in Table S1 in the ESI,† and confirm the expected stoichiometry in each case. Fig. 2 shows X-ray diffraction patterns for compositions in the Cu3Sb1−xSnxS4 system. The basic tetragonal structure is seen to be maintained throughout the compositional range, with only the x = 0.9 and 1.0 compositions showing a small amount of a secondary phase, identified as CuS. With increasing Sn content, the relative intensity of some peaks at low angles decreased, indicating a change in the local atomic arrangements.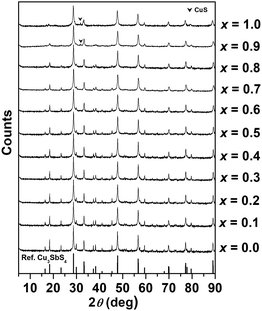 | ||
| Fig. 2 X-ray powder diffraction patterns of compositions in the Cu3Sb1−xSnxS4 system (reference: Cu3SbS4, PDF # 00-035-0581). | ||
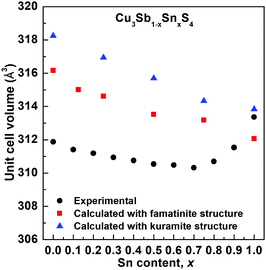
The compositional variation of unit cell volume is shown in Fig. 3. A steady decrease in the unit cell volume is seen up to around x = 0.7. This is inconsistent with the substitution of Sb5+ by the larger Sn4+ cation (r = 0.60 Å and 0.69 Å, respectively, comparison based on 6 coordinate geometry since data for 4-coordinate geometry are unavailable for Sb5+), but would be consistent with the oxidation of some Cu+ to Cu2+ (r = 0.57 Å and 0.46 Å, respectively, for the ions in 4-coordinate geometry).27 Above x = 0.7, the volume increases significantly. Interestingly, the lattice parameter ratio (Fig. S5, ESI†) is seen to reach a maximum at around x = 0.4, indicating that this composition is nearly cubic.
In order to assess changes in local structure, neutron diffraction data were collected for the key compositions x = 0.0, 0.4, 0.7 and 1.0 (Fig. S1–S4, ESI†). In the work of Goto et al.,3 for the x = 1.0 composition, it was assumed that electroneutrality was maintained through S2− vacancies, i.e. that the composition has a stoichiometry approximating to Cu3SnS3.5. In the present case, no evidence was found for S2− vacancies, with refinement of the S site occupancy always resulting in full occupancy. Therefore, in the final refinements the S site occupancy was fixed at 1.0. A number of cation ordering models were refined using the X-ray and neutron data for the x = 1.0 composition. The reliability factors for each of these models is given in the ESI† (Tables S2 and S3). Only the X-ray reliability factors showed significant differences between the models, since the X-ray data show the greatest scattering contrast between Cu and Sn. The results show that for this composition, the ordered model of famatinite gives a poorer fit than most of the disordered models. However, the model of Goto et al.,3 with Sn disordered over 2b and 4d sites, cannot be distinguished from the model with Sn disordered over the 2a and 4d sites, but it does have a marginally smaller χ2 value than the fully random model, with Sn randomly distributed over all cation sites. In fact, the models with Sn distributed over 2b/4d sites and 2a/4d sites are crystallographically almost indistinguishable (both 2b and 2a sites have −42m symmetry and are related by a translation of 0, 0, 0.5) and thus the cation ordering found by Goto et al.3 is confirmed in the present study. It should be noted here that it is possible to model the diffraction data for the x = 1.0 composition with a fully disordered cubic sphalerite structure in space group F![[4 with combining macron]](https://www.rsc.org/images/entities/char_0034_0304.gif) 3m. The fit yields slightly higher R-factors than any of the tetragonal models (Rwp = 0.0236, 0.0305 and 0.1037, for neutron back scattering, neutron 90° and X-ray data, respectively) and does not differentiate between the 3 cation sites of the I
3m. The fit yields slightly higher R-factors than any of the tetragonal models (Rwp = 0.0236, 0.0305 and 0.1037, for neutron back scattering, neutron 90° and X-ray data, respectively) and does not differentiate between the 3 cation sites of the I![[4 with combining macron]](https://www.rsc.org/images/entities/char_0034_0304.gif) 2m structure. The famatinite and kuramite models were refined for compositions x = 0.0, 0.4 and 0.7, and in all cases the famatinite model was found to give a better fit. The results show that with increasing Sn content, the famatinite ordering is maintained up to at least x = 0.7. The increase in unit cell volume at high x-values (Fig. 3) suggests that above x = 0.7 the more disordered kuramite-type structure is adopted.
2m structure. The famatinite and kuramite models were refined for compositions x = 0.0, 0.4 and 0.7, and in all cases the famatinite model was found to give a better fit. The results show that with increasing Sn content, the famatinite ordering is maintained up to at least x = 0.7. The increase in unit cell volume at high x-values (Fig. 3) suggests that above x = 0.7 the more disordered kuramite-type structure is adopted.
The final refined structural parameters for x = 0.0, 0.4, 0.7 and 1.0 compositions are given in Table 2, with the corresponding fitted diffraction profiles given in the ESI† as Fig. S1–S4. The degree of distortion of the tetrahedra can be quantified using a simple distortion index DOTO,28 as follows:
| (a) | ||||
|---|---|---|---|---|
| Composition | x = 0.0 | x = 0.4 | x = 0.7 | x = 1.0 |
| 2a site Occ. | Sb 1.0 | Sb, 0.6 | Sb, 0.3 | Cu 1.0 |
| Sn, 0.4 | Sn, 0.7 | |||
| 2a site Uiso (Å2) | 0.0059(3) | 0.0054(3) | 0.0080(4) | 0.0189(6) |
| 2b site Occ. | Cu, 1.0 | Cu, 1.0 | Cu, 1.0 | Cu, 0.58(6) |
| Sn, 0.42(6) | ||||
| 2b site Uiso (Å2) | 0.0180(4) | 0.0150(4) | 0.0158(5) | 0.0091(5) |
| 4d site Occ. | Cu, 1.0 | Cu, 1.0 | Cu, 1.0 | Cu, 0.71(3) |
| Sn, 0.29(3) | ||||
| 4d site Uiso (Å2) | 0.0192(2) | 0.0186(2) | 0.0165(3) | 0.0210(4) |
| 8i site | S, 1.0 | S, 1.0 | S, 1.0 | S, 1.0 |
| 8i site x | 0.2519(5) | 0.2541(4) | 0.2556(4) | 0.2497(13) |
| 8i site z | 0.1298(2) | 0.1290(2) | 0.1304(1) | 0.1261(6) |
| 8i site Uiso (Å2) | 0.0103(1) | 0.0117(1) | 0.0095(1) | 0.0129(1) |
| (b) | ||||
|---|---|---|---|---|
| 2a-S | 2.373(3) | 2.379(3) | 2.396(2) | 2.338(10) |
| 2b-S | 2.349(3) | 2.328(3) | 2.327(2) | 2.342(9) |
| 4d-S | 2.302(2) | 2.304(1) | 2.2945(9) | 2.326(4) |
| S-2a-S | 110.21(6) × 3 | 109.83(6) × 3 | 109.98(5) × 3 | 109.67(19) × 3 |
| S-2a-S′ | 107.99(12) × 3 | 108.76(13) × 3 | 108.46(9) × 3 | 109.1(4) × 3 |
| S-2b-S | 110.65(6) × 3 | 110.73(7) × 3 | 111.24(5) × 3 | 109.61(21) × 3 |
| S-2b-S′ | 107.15(12) × 3 | 106.98(13) × 3 | 106.00(9) × 3 | 109.2(4) × 3 |
| S-4d-S | 111.68(7) × 2 | 111.37(9) × 2 | 111.92(6) × 2 | 110.09(28) × 2 |
| S-4d-S′ | 108.38(3) × 4 | 108.53(5) × 4 | 108.26(3) × 4 | 109.16(14) × 4 |
| 2b-S-4d | 109.79(10) × 2 | 110.26(9) × 2 | 110.60(7) × 2 | 109.34(28) × 2 |
| 2b-S-2a | 107.57(7) | 107.87(9) | 107.23(6) | 109.13(28) |
| 2a-S-4d | 108.96(10) × 2 | 108.50(9) × 2 | 108.18(7) × 2 | 109.46(28) × 2 |
| 4d-S-4d | 111.68(7) | 111.35(9) | 111.88(7) | 110.09(28) |
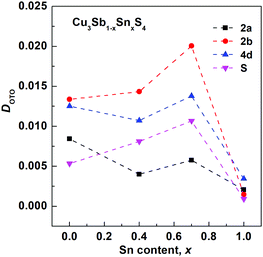 | ||
| Fig. 4 Composition variation of tetrahedral distortion index DOTO for tetrahedral sites in the Cu3Sb1−xSnxS4 system. | ||
3.2 Simulations
Fig. 5 shows the compositional variation of the formation energies of the two lowest energy structures. With increasing Sn content, the structures become increasingly more stable, in agreement with the experimentally observed high solubility of Sn in Cu3SbS4. The DFT results show that the most stable structures throughout the compositional range are those that exhibit famatinite-like ordering, in which Sn substitutes Sb in the 2a site (squares in Fig. 5). The second most stable structure, with slightly higher formation energy, is characterized by a kuramite-like configuration, in which Sn substitutes Sb in the 2a site as well as Cu in either the 2b or 4d sites (triangles in Fig. 5). It is interesting to observe that the energy gap between the famatinite-like and the kuramite-like structures decreases with increasing Sn content. This indicates that partial occupation of Sn in Cu sites becomes increasingly more energetically favourable as x increases, and at large Sn content there is competition between the two phases. The DFT results appear to be in good agreement with the observed structural changes, with the famatinite-like structure significantly more stable than the kuramite-like structure for compositions x ≤ 0.7. Indeed, the calculated unit cell volume (Fig. 3) shows the same decreasing trend as seen experimentally, with a relatively small difference in absolute values. At higher x-values, there is little difference between the formation energy of the two structures. The experimental trend in unit cell volume suggests a change to kuramite-like ordering, and the DFT results indicate that this would involve an increase in unit cell volume as observed (Fig. 3). It is worth noting that the predicted increase in volume is less marked than observed experimentally, mainly because the DFT hybrid model over estimates the volume for the Sb-containing structures with respect to the experimental values, but does reproduce the fully substituted end member, Cu3SnS4, reasonably accurately.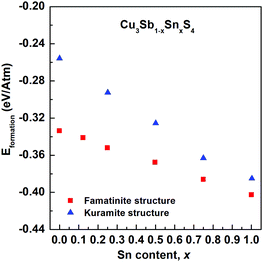 | ||
| Fig. 5 Compositional variation of calculated formation energies for famatinite (red squares) and kuramite-like (blue triangles) structures. | ||
A close look at the most stable kuramite-like structures obtained in the DFT screening reveals that they are characterized by the coexistence of the S–Cu3Sn (or S–Cu3Sb) motifs (typical of famatinite-like structures), with S–Cu2Sn2 (or S–Cu2SnSb) and S–Cu4 motifs. The minimum energy cost to create these latter types of motif, starting from a famatinite-like arrangement, is the formation energy of CuSn (or CuSb) antisite defects.
The calculations show the that the antisite formation energy in Cu3SbS4 is 3 eV, while in famatinite-like Cu3SnS4 the value is significantly lower, about 0.9 eV (assuming the chemical potentials to be zero). The values clearly indicate a greater propensity to disorder in Cu3SnS4 than in Cu3SbS4. It is interesting to note that when compared to Cu2ZnSnS4, cation disorder, which has a detrimental impact on the electronic transport properties crucial for photovoltaic applications, is less energetically favourable in Cu3SbS4. Indeed, in Cu2ZnSnS4 the CuSn formation energy obtained with hybrid DFT is 2.4 eV, assuming zero chemical potentials, and can decrease down to 1.2 eV, depending on the chemical potentials used.29
3.3 Local electronic environment and oxidation state of Cu
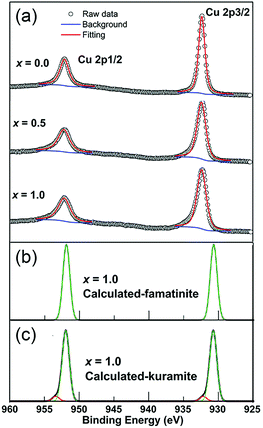
Fig. 6 shows the high resolution XPS spectra of the Cu 2p core levels of representative samples of Cu3Sb1−xSnxS4 (x = 0.0, 0.5, 1.0). For all samples the Cu spectra show well separated spin orbital components of Cu 2p1/2 and Cu 2p3/2, with binding energies of 952.3 eV and 932.5 eV, respectively, and a separation of 19.8 eV, consistent with reported values for Cu+.30–32 There is no significant shift in binding energy with composition. Importantly, no satellite peaks corresponding to Cu2+ were observed (a peak at around 942 eV is typical for Cu2+),33,34 despite the appearance of CuS as a small secondary phase at the highest x-values. The spectra of compositions with higher Sn content show a tail on the higher binding energy side of the main peak, which can be attributed to Cu+ in a slightly different chemical environment.Calculated Cu 2p spectra of x = 1.0 based on famatinite-like and kuramite-like ordered DFT models are shown in Fig. 6b and c. DFT reproduces the position of the Cu 2p1/2 peak very well, but underestimates the position of the Cu 2p3/2 peak by about 2 eV. There is no difference in the predicted binding energies for the Cu 2p peaks for the two models. However, the high binding energy tails in the spectrum of the x = 1.0 composition are accurately simulated by Cu+ environments with high numbers of Sn atoms as next-nearest-neighbours. This type of local ordering has a finite statistical probability of occurring in the kuramite model only.
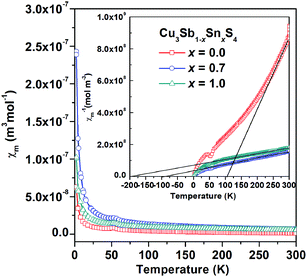
Fig. 7 shows the thermal variation of magnetic susceptibility on heating for the x = 0.0, 0.7 and 1.0 compositions, with the plots for inverse susceptibility inset. Little difference was observed between field-cooled (FC) and zero-field-cooled (ZFC) data. A weak local maximum is observed in the susceptibility data at ∼50 K for the x = 0.0 and x = 1.0 compositions. This may indicate long-range antiferromagnetic order, but could also be associated with the presence of a small amount of antiferromagnetic impurity. Above ∼250 K, Curie–Weiss like behaviour is observed for the x = 0.0 composition and analysis suggests a paramagnetic moment of 0.37 μB per formula unit and a Weiss temperature of ∼ 110 K (Fig. 7 inset). The question therefore arises as to the origins of the weak paramagnetism in Cu3SbS4, since there are nominally no unpaired electrons in this composition. No evidence was seen in the diffraction data at x = 0.0 for a possible paramagnetic impurity, although a small amount of impurity phase could be below the detection limit of the diffraction experiments. Since no evidence was found in the diffraction data or compositional analysis for sulfur vacancies, another possibility is charge compensation through the oxidation of Cu to the 2+ oxidation state or the presence of S2−δ species. This would have the effect of introducing low concentrations of paramagnetic centres into the system, while maintaining overall stoichiometry. Increasing the Sn content increases the magnetic susceptibility which could reflect increasing Pauli paramagnetism as the systems become more metallic with increasing Sn content.
There is little compositional variation in the Sb 3d and Sn 3d XPS peaks (Fig. S6 and Table S4, ESI†), the intensities of the Sb 3d and Sn 3d peaks change accordingly with composition which further confirms that Sb is replaced by Sn. The binding energy of Sb 3d and Sn 3d are consistent with Sb and Sn in predominantly 5+ and 4+ oxidation states, respectively.32,35,36 However, while the Sb 3d XPS data show predominantly Sb in the 5+ oxidation state, the presence of a small amount of Sb3+ would be almost indiscernible, since the binding energies of the 3d electrons on the +5 and +3 oxidation states are separated by only about 3 eV.37,38
Fig. 8 shows the fitted S 2p XPS spectra for selected compositions. At x = 0.0, the S 2p1/2 and S 2p3/2 peaks are located at binding energies of 163.2 eV and 162.0 eV with a separation of 1.2 eV, which are consistent with those reported in other metal sulfides.31,32,39 As the Sn content increases, the S 2p peaks shift to lower binding energies and additional weaker higher energy peaks appear. As discussed above, one possible explanation is to consider the presence of S2−δ species, which in the absence of sulfur vacancies would be required for electroneutrality. This is an attractive hypothesis, and similar conclusions were made in the Ag1−xSn1+xSe2 system, where charge balance was maintained by Se2−δ species, and the Se 3d XPS spectra fitted accordingly. In the present case, fits to two species for the x = 1.0 data, yield fractions of 0.4 and 0.6 for the S2−δ and S2− species, respectively, corresponding to a δ value of 0.625. Calculations for the other compositions reveal similar δ values (Fig. S6, ESI†). Since the system is essentially covalent in nature, this suggests that the bonds to S would weaken with increasing level of Sn substitution and decreasing bond order. Indeed, this is evident in Table 2, where the 2a-S (i.e. Sn/Sb–S) bond length increases from x = 0.0 to 0.7, while the Cu–S bond length shortens over this compositional range. The situation at x = 1.0 is complicated by the randomisation of Sn/Cu site occupation between all three cation sites on transition to the kuramite structure, making direct comparison of bond lengths with lower x-value compositions less clear.
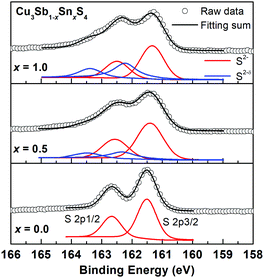 | ||
| Fig. 8 High resolution S 2p XPS spectra of for Cu3Sb1−xSnxS4 with x = 0.0, 0.5 and 1.0. For x = 0.5 and 1.0 samples, S 2p peaks were fitted into two different S species of S2− and S2−δ. | ||
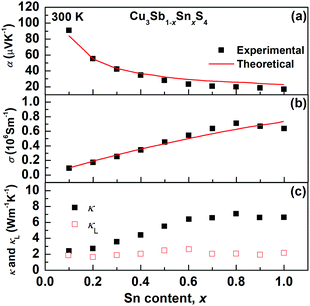
3.4 Effect of alloying and cation disorder on the transport properties
The transport properties of the Cu3Sb1−xSnxS4 solid solution as a function of x at room temperature are presented in Fig. 9. The decrease in the Seebeck coefficient and the increase in electrical conductivity with increasing Sn content clearly show an evolution from a semiconducting phase (famatinite) to a metallic one (kuramite). As shown in Fig. 9, these two electrical transport coefficients are reproduced fairly well over the entire solid solution using the Boltzmann transport theory in the relaxation time approximation (we used a relaxation time of 4.3 fs), and using only the electronic band structure of pristine famatinite, where the increase in carrier concentration is simulated via a shift of the chemical potential to account for the extra holes introduced by the substitution of Sb5+ ions by Sn4+ ions. The good agreement between theory and experiment suggests that the band edge electronic states relevant for transport are not altered significantly by Sn substitution.It is interesting to note, that for x-values larger than 0.7, there are clear changes in the trends of experimental data for the electrical conductivity (σ) and the thermal conductivity (κ), which deviate from the behaviour predicted by the transport model based on the famatinite structure. This correlates well with the trend in the compositional variation in unit cell volume (Fig. 3) and can be attributed to the disorder on the cation sublattice that accompanies the transition to the kuramite structure. This disorder introduces an extra electronic scattering mechanism that affects electronic transport. The contribution of lattice thermal conductivity, κL, to total thermal conductivity, κ, can be estimated by subtracting the electronic thermal conductivity, κe, from κL, where the electronic contribution was estimated on the basis of the Wiedemann–Franz law and a Lorenz number calculated by using the equation proposed by Kim et al.40 As can be seen in Fig. 9c, the lattice thermal conductivity is fairly independent of Sn content and very close to 1.9 W m−1 K−1 at room temperature found for pristine Cu3SbS4. The results suggest that Umklapp phonon–phonon scattering is the dominant scattering effect. Since this is proportional to the average mass of the sample there is little change is seen in the lattice thermal conductivity as all the samples have similar average mass.41 Hence, as the x-value increases the main contribution to κ arises from κe.
4. Conclusions
A full solid solution can be obtained between famatinite (Cu3SbS4) and kuramite (Cu3SnS4). Cu3Sb1−xSnxS4 compositions share the same underlying zinc blende derived lattice, with low x-value compositions exhibiting the cation ordered famatinite structure and compositions with x-values greater than 0.7 exhibiting a propensity towards cation disorder, leaving a clear fingerprint in the XPS spectra and in the compositional trends of both the unit cell volume and the transport properties. Interestingly, there is no evidence in the neutron diffraction data for sulfur vacancies or in XPS data of copper oxidation throughout the solid solution. Magnetic susceptibility measurements show weak paramagnetism in Cu3SbS4, which might be attributed to paramagnetic centres introduced into the system through a small degree of sulfur oxidation. With increasing level of Sn in Cu3Sb1−xSnxS4, the system shows a gradual evolution from semiconducting to metallic behaviour and becomes increasingly more paramagnetic. In the absence of sulfur vacancies or copper oxidation, it must be concluded that the holes created by substitution of pentavalent antimony by tetravalent tin are effectively delocalized in the metallic band structure of the system. The electronic behaviour of the Cu3Sb1−xSnxS4 system, together with the structural compatibility of different compositions, suggests that this system could be an interesting playground to engineer heterostructures where semiconducting and metallic structures coexist, with potential applications in tunable electronics and earth abundant thermoelectrics and photovoltaics.Conflicts of interest
There are no conflicts of interest to declare.Acknowledgements
This work was supported by the Engineering and Physical Sciences Research Council (EPSRC) (Grant No. EP/N0227261/1 and EP/N02396X/1). N. B. and C. W. acknowledge the ARCHER UK National Supercomputing Service and the UK Materials and Molecular Modelling Hub for computational resources, which are partially funded by EPSRC (EP/P020194/1). N. B. also acknowledges the Cirrus UK National Tier-2 HPC Service at EPCC. N. B. and S. L. thank Mark van Schilfgaarde for helping with the QS-GW calculations. C. W and N. B. acknowledge Dr Glenn Jones (Johnson & Matthey, Sonning) for support and helpful discussions. C. W. gratefully acknowledges the support of NVIDIA Corporation with the donation of the Tesla K40 GPUs used in this research. The Science and Technology Facilities Council (STFC) ISIS Facility, Rutherford Appleton Laboratory, UK is thanked for neutron beam time awards (RB1790181, RB1790182 and RB1810152). The authors wish to thank Dr Ron Smith for his help in neutron data collection. This article was developed based upon funding from the National Renewable Energy Laboratory, managed and operated by the Alliance for Sustainable Energy, LLC for the U.S. Department of Energy (DOE) under contract no. DE-AC36-08GO28308. The views expressed in the article do not necessarily represent the views of the DOE or the U.S. Government. The U.S. Government retains and the publisher, by accepting the article for publication, acknowledges that the U.S. Government retains a nonexclusive, paid-up, irrevocable, worldwide license to publish or reproduce the published form of this work, or allow others to do so, for U.S. Government purposes.Notes and references
- Y. Yang, P. Ying, J. Wang, X. Liu, Z. Du, Y. Chao and J. Cui, J. Mater. Chem. A, 2017, 5, 18808–18815 RSC.
- J. Paier, R. Asahi, A. Nagoya and G. Kresse, Phys. Rev. B: Condens. Matter Mater. Phys., 2009, 79, 115126 CrossRef.
- Y. Goto, F. Naito, R. Sato, K. Yoshiyasu, T. Itoh, Y. Kamihara and M. Matoba, Inorg. Chem., 2013, 52, 9861–9866 CrossRef CAS PubMed.
- C. J. Bosson, M. T. Birch, D. P. Halliday, K. S. Knight, A. S. Gibbs and P. D. Hatton, J. Mater. Chem. A, 2017, 5, 16672–16680 RSC.
- B. Du, R. Zhang, K. Chen, A. Mahajan and M. J. Reece, J. Mater. Chem. A, 2017, 5, 3249–3259 RSC.
- K. Chen, B. Du, N. Bonini, C. Weber, H. Yan and M. J. Reece, J. Phys. Chem. C, 2016, 120, 27135–27140 CrossRef CAS.
- B. Du, R. Zhang, M. Liu, K. Chen, H. Zhang and M. J. Reece, J. Mater. Chem. C, 2019, 7, 394–404 RSC.
- X. Lu, D. T. Morelli, Y. Xia, F. Zhou, V. Ozolins, H. Chi, X. Y. Zhou and C. Uher, Adv. Energy Mater., 2013, 3, 342–348 CrossRef CAS.
- K. Chen, C. Di Paola, B. L. Du, R. Z. Zhang, S. Laricchia, N. Bonini, C. Weber, I. Abrahams, H. X. Yan and M. Reece, J. Mater. Chem. C, 2018, 6, 8546–8552 RSC.
- T. Gokmen, O. Gunawan, T. K. Todorov and D. B. Mitzi, Appl. Phys. Lett., 2013, 103, 103506 CrossRef.
- B. R. Ortiz, W. Y. Peng, L. C. Gomes, P. Gorai, T. S. Zhu, D. M. Smiadak, G. J. Snyder, V. Stevanovic, E. Ertekin, A. Zevalkink and E. S. Toberer, Chem. Mater., 2018, 30, 3395–3409 CrossRef CAS.
- A. Pfitzner and S. Reiser, Z. Kristallogr., 2002, 217, 51–54 CAS.
- V. A. Kovalenker, Int. Geol. Rev., 1981, 23, 365–370 CrossRef.
- F. D. Benedetto, D. Borrini, A. Caneschi, G. Fornaciai, M. Innocenti, A. Lavacchi, C. A. Massa, G. Montegrossi, W. Oberhauser, L. A. Pardi and M. Romanelli, Phys. Chem. Miner., 2011, 38, 483–490 CrossRef.
- Y. Xiong, Y. Xie, G. Du and H. Su, Inorg. Chem., 2002, 41, 2953–2959 CrossRef CAS PubMed.
- H. Hu, Z. Liu, B. Yang, X. Chen and Y. Qian, J. Cryst. Growth, 2005, 284, 226–234 CrossRef CAS.
- G. Yosuke, S. Yuki, K. Yoichi and M. Masanori, Jpn. J. Appl. Phys., 2015, 54, 021801 CrossRef.
- S.-L. Chen, J. Tao, H.-B. Shu, H.-J. Tao, Y.-X. Tang, Y.-Z. Shen, T. Wang and L. Pan, J. Power Sources, 2017, 341, 60–67 CrossRef CAS.
- A. Larson and R. Von Dreele, Report No. LAUR 86-748. Program GSAS for Windows, Version 15-04-04. Los Alamos National Laboratory, New Mexico, USA, 1987 Search PubMed.
- G. Kresse and D. Joubert, Phys. Rev. B: Condens. Matter Mater. Phys., 1999, 59, 1758–1775 CrossRef CAS.
- G. Kresse and J. Hafner, Phys. Rev. B: Condens. Matter Mater. Phys., 1993, 47, 558–561 CrossRef CAS PubMed.
- G. Kresse and J. Hafner, Phys. Rev. B: Condens. Matter Mater. Phys., 1994, 49, 14251–14269 CrossRef CAS PubMed.
- K. Okhotnikov, T. Charpentier and S. Cadars, J. Cheminf., 2016, 8, 17 Search PubMed.
- M. van Schilfgaarde, T. Kotani and S. V. Faleev, Phys. Rev. B: Condens. Matter Mater. Phys., 2006, 74, 245125 CrossRef.
- D. Pashov, S. Acharya, W. R. L. Lambrecht, J. Jackson, K. D. Belashchenko, A. Chantis, F. Jamet and M. van Schilfgaarde, Comput. Phys. Commun., 2020, 249, 107065 CrossRef CAS.
- G. Pizzi, D. Volja, B. Kozinsky, M. Fornari and N. Marzari, Comput. Phys. Commun., 2014, 185, 422–429 CrossRef CAS.
- R. Shannon, Acta Crystallogr., Sect. A: Cryst. Phys., Diffr., Theor. Gen. Crystallogr., 1976, 32, 751–767 CrossRef.
- W. H. Baur, Acta Crystallogr., Sect. B: Struct. Crystallogr. Cryst. Chem., 1974, 30, 1195–1215 CrossRef CAS.
- D. Han, Y. Y. Sun, J. Bang, Y. Y. Zhang, H.-B. Sun, X.-B. Li and S. B. Zhang, Phys. Rev. B: Condens. Matter Mater. Phys., 2013, 87, 155206 CrossRef.
- D. L. Perry and J. A. Taylor, J. Mater. Sci. Lett., 1986, 5, 384–386 CrossRef CAS.
- U. Chalapathi, B. Poornaprakash and S.-H. Park, Ceram. Int., 2017, 43, 5229–5235 CrossRef CAS.
- Q. Liu, Z. Zhao, Y. Lin, P. Guo, S. Li, D. Pan and X. Ji, Chem. Commun., 2011, 47, 964–966 RSC.
- L. D. Partain, R. A. Schneider, L. F. Donaghey and P. S. McLeod, J. Appl. Phys., 1985, 57, 5056–5065 CrossRef CAS.
- W. Fu, L. Liu, G. Yang, L. Deng, B. Zou, W. Ruan and H. Zhong, Part. Part. Syst. Charact., 2015, 32, 907–914 CrossRef CAS.
- G. Chen, W. Wang, J. Zhao, W. Yang, S. Chen, Z. Huang, R. Jian and H. Ruan, J. Alloys Compd., 2016, 679, 218–224 CrossRef CAS.
- R. Shiratsuchi, K. Hongo, G. Nogami and S. Ishimaru, J. Electrochem. Soc., 1992, 139, 2544–2549 CrossRef CAS.
- W. E. Morgan, W. J. Stec and J. R. Van Wazer, Inorg. Chem., 1973, 12, 953–955 CrossRef CAS.
- K. Xiao, Q. Z. Xu, K. H. Ye, Z. Q. Liu, L. M. Fu, N. Li, Y. B. Chen and Y. Z. Su, ECS Solid State Lett., 2013, 2, P51–P54 CrossRef CAS.
- L. Wang, B. Yang, Z. Xia, M. Leng, Y. Zhou, D.-J. Xue, J. Zhong, L. Gao, H. Song and J. Tang, Sol. Energy Mater. Sol. Cells, 2016, 144, 33–39 CrossRef CAS.
- H. S. Kim, Z. M. Gibbs, Y. L. Tang, H. Wang and G. J. Snyder, APL Mater., 2015, 3, 041506 CrossRef.
- E. S. Toberer, A. Zevalkink and G. J. Snyder, J. Mater. Chem., 2011, 21, 15843 RSC.
Footnotes |
| † Electronic supplementary information (ESI) available. See DOI: 10.1039/d0tc01804j |
| ‡ The QUESTAAL code is freely available at http://www.questaal.org. |
| This journal is © The Royal Society of Chemistry 2020 |

