 Open Access Article
Creative Commons Attribution 3.0 Unported Licence
Solution processed CZTS solar cells using amine–thiol systems: understanding the dissolution process and device fabrication†
Jamie C.
Lowe
ab,
Lewis D.
Wright
b,
Dmitry B.
Eremin
 cd,
Julia V.
Burykina
 c,
Jonathan
Martens
e,
Felix
Plasser
 a,
Valentine P.
Ananikov
 c,
Jake W.
Bowers
 *b and
Andrei V.
Malkov
 *a
*a
aDepartment of Chemistry, School of Science, Loughborough University, Loughborough, Leicestershire LE11 3TU, UK. E-mail: a.malkov@lboro.ac.uk
bCREST, Wolfson School of Mechanical, Electrical and Manufacturing Engineering, Loughborough University, Loughborough, Leicestershire LE11 3TU, UK. E-mail: j.w.bowers@lboro.ac.uk
cN. D. Zelinsky Institute of Organic Chemistry, Russian Academy of Sciences, Leninsky Prospect 47, Moscow 119991, Russia
dThe Bridge@USC, University of Southern California, 1002 Childs Way, Los Angeles, California 90089-3502, USA
eInstitute for Molecules and Materials, FELIX Laboratory, Radboud University, Toernooiveld 7c, 6525 ED, Nijmegen, The Netherlands
First published on 1st July 2020
Abstract
Solar energy is one of the main renewable energy sources currently being researched, with commercial thin film solar cells currently made of CdTe or CuIn(1−x)GaxSe2 (CIGS) absorbers. However, whilst these materials make up the majority of the thin film commercial market, these solar cells have various problems relating to materials cost, and toxicity of constituent elements. Kesterite (Cu2ZnSn(S,Se)4) solar cells are becoming increasingly popular due to their tuneable band gap, relative affordability of the constituent elements, and the ability to produce high efficiency devices from solution processes. However, often expensive and toxic materials are used in production. In this paper we report on a newly developed amine–thiol solvent system based on 10% cysteamine in ethanolamine, which has low toxicity, is user-friendly and is able to readily dissolve all kesterite constituent elements, including metals and their oxides. The dissolution process and the structures of the prevalent metal complexes formed were investigated with the aid of spectroscopic methods, such as electrospray ionization mass spectrometry (ESI-MS) and infrared multiple photon dissociation (IRMPD). In most cases, two molecules of cysteamine were bound to the metals as bidentate ligands. By employing spin coating of the resulting inks, devices of up to 8.1% power conversion efficiency were fabricated.
1. Introduction
As the world continues to demand more energy from cleaner sources, the scientific community endeavours to meet these demands through investigation of various renewable energies, with one of the most promising and most studied of these being solar energy. Commercial solar panels are currently available using materials such as silicon,1,2 CIGS,3,4 and CdTe.5,6 Silicon has been very successful and has revolutionized the solar industry, however the promise of lower cost energy using thin film photovoltaic (PV) materials has led to the rise of CIGS and CdTe. Whilst these alternatives are promising with high power conversion efficiencies over 20%, they still have problems, e.g. the scarcity of constituent elements such as indium and tellurium. Kesterite (CZTS – Cu2ZnSn(S,Se)4) solar cells have been identified as a potential material system to overcome these problems because the constituent elements are relatively abundant and non-toxic. Kesterites were first identified as a suitable material for PV applications in 1997 by Katagiri et al., producing an efficiency of 0.66%.7 By 2009, the same group had achieved efficiencies of 6.7%.8 This efficiency prompted intense research into CZTS solar cells, but so far researchers have had difficulty reaching higher efficiency figures enjoyed by other thin film materials. Various techniques have been used to deposit kesterites, including vacuum processes such as co-sputtering,9,10 and co-evaporation,11,12 and non-vacuum processes such as electrodeposition,13,14 spray pyrolysis,15,16 and spin coating.17,18 The best CZTS solar cells produced to date have efficiencies of 12.6%19 and 12.62%.20 Currently, its competitor and forerunner, CIGS, has efficiencies of up to 23.35%.21 Another issue with the current best performing kesterite solar cells is the toxicity of chemicals used to produce it.22–24 In the case of the 12.6% CZTS device, hydrazine was used as the solvent.22 The use of hydrazine would be extremely difficult for a safe and cost-effective commercial process, therefore this work attempts to resolve this problem by producing CZTS solar cells using a non-toxic solution processed alternative.Amine–thiol solvent systems have been shown to dissolve the constituent elements of kesterite solar cells, as well as other thin film PV materials such as CIGS, CdTe, and Sb2Se3.25–28 Solvents used in these systems such as hexylamine,26,27 ethylenediamine29 or 1,2-ethanedithiol27,29 possess significant toxicity issues, notwithstanding the malodourous properties of thiols. Therefore, it is desirable to find alternative, less hazardous amine–thiol solvents. In previous work within our laboratories, copper, zinc, tin and selenium were dissolved in a mixture of ethanolamine and cysteamine (a relatively low toxicity amine–thiol solvent system),30 whereas the respective metal oxides/sulfates were employed to prepare aqueous solutions.31 Several attempts have been made to obtain a deeper insight into the dissolution process of metals and their compounds in binary solvent amine/thiol mixtures.29,32,33 However, composition of the inks for depositing CZTS thin films has not been elucidated in detail. At the same time, a good understanding of the molecular structures of the solutes would benefit further development of precursor inks for photovoltaic applications. Thermogravimetric analysis (TGA) of inks containing ethanolamine complexes of various metals carried out by Vila34 revealed that the majority of the ethanolamine evaporated by ∼200 °C. In our previous reports,30,31 spray deposition of inks based on ethanolamine or water onto a hotplate had been attempted, but this technique had proven difficult due to the high viscosity of the solutions.
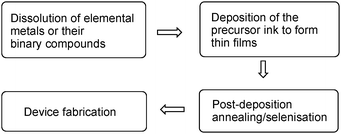
In this work, the main aim was to gain insight into the dissolution chemistry of the metal precursors in a mixture of chelating organic solvents employing various spectroscopic methods such as ESI-MS, IRMPD, and Raman spectroscopy. As a follow up, the optimized inks were employed for fabrication of kesterite solar cells. A schematic diagram of the process is shown in Fig. 1.
Initially, the investigation focused on the chemical processes underlying dissolution of metals, as well as their oxides and chalcogenides, in a 10![[thin space (1/6-em)]](https://www.rsc.org/images/entities/char_2009.gif) :
:![[thin space (1/6-em)]](https://www.rsc.org/images/entities/char_2009.gif) 1 ethanolamine/cysteamine mixture and analysis of the structures of the complexes thus formed.
1 ethanolamine/cysteamine mixture and analysis of the structures of the complexes thus formed.
For deposition of inks, spin coating was chosen as it allows production of more uniform films,35–37 and can be combined with an annealing step to produce the kesterite layer. Ethanolamine is conducive for this technique and slot die coating rather than for spray pyrolysis, due to the high viscosity associated with ethanolamine resulting in it being difficult to spray. This enabled us to fabricate kesterite solar cells with higher efficiencies than previously had been achieved using an ethanolamine/cysteamine solvent system.
2. Experimental section
2.1. Mass spectrometry study; general considerations
Mass spectra were acquired on a Q-TOF MS instrument (Bruker, maXis) using electrospray ionization in positive ion mode with m/z 100–1500 range. Capillary Voltage was −4.5 kV, and Spray Shield Offset was set to −0.5 kV. A low-concentration tuning mix solution by Agilent Technologies was utilized for calibration. Nitrogen was applied as a nebulizer gas at 1 bar and as a dry gas at 4.0 L × min−1, 200 °C. Spectra were processed using Data Analysis 4.0 software package (Bruker). Online reaction monitoring technique was performed for the reaction mixtures in ethanolamine (argon or air filled double-layered balloon pressurized injection).2.2. ESI-MS online monitoring of the reaction of individual metals dissolution
Cysteamine (2) (0.5 g, 6.5 mmol) was dissolved in ethanolamine (1) (5 g, 81.9 mmol) and added to the Cu (5.7 mg, 0.09 mmol), or Sn (7 mg, 0.059 mmol), or Zn (4.6 mg, 0.071 mmol) under air into a Schlenk tube equipped with a magnetic stir bar. One neck was closed with a silicon septum and the side tap was connected to a double layered argon balloon.38 PEEK capillary connected to the ESI-MS instrument was passed into the flask through the septum and immersed into the reaction mixture. After stirring (500 rpm) for ca. 30 min the first signals were observed in the spectrum (due to slow flow rate of a highly viscous solution through the PEEK capillary). The mixture was stirred at room temperature. For Cu and Zn, data acquisition continued for 4 h without interruptions at 1 Hz frequency; for Sn, the mixture was left stirring for 11 h before commencing data acquisition, which continued for 2.5 h.2.3. ESI-MS online monitoring of dissolution of Cu/Sn/Zn and Cu/Sn/Zn/S mixtures
Cysteamine (2) (0.5 g, 6.5 mmol) was dissolved in ethanolamine (5 g, 81.9 mmol) and added to a mixture of Cu (11.4 mg, 0.18 mmol), Sn (7 mg, 0.059 mmol) and Zn (4.6 mg, 0.071 mmol) or Cu, Sn, Zn and S (25.5 mg, 0.8 mmol) under air into a Schlenk tube equipped with magnetic stir bar. For the reaction with sulfur, it was added at the same moment with metals. One neck was closed with a silicon septum and the side tap was connected to a double layered argon balloon.38 PEEK capillary connected to the ESI-MS instrument was passed into the flask through the septum and immersed into the reaction mixture. After stirring (500 rpm) for ca. 30 min the first signals were observed in the spectrum (due to slow solution rate in the PEEK capillary). The mixture was stirred at room temperature for 8 hours with continuous data acquisition at 1 Hz frequency.2.4. Infrared ion spectroscopy (IRIS) study
IRIS experiments were carried out at the FELIX laboratory using a modified 3D quadrupole ion trap MS (Bruker, AmaZon) and tunable infrared light from the FELIX IR-free electron laser. Ions were generated via electrospray ionization, transferred and stored in the quadrupole ion trap. Ions of a single m/z value were isolated, irradiated with a variable number of IR laser pulses and a photofragmentation mass spectrum was recorded in order to determine the IR yield at each frequency point. FELIX was operated at a 10 Hz repetition rate, providing IR pulse energies of approximately 100 mJ. The IR frequency was scanned in steps of 3 cm−1 over the entire fingerprint spectral region (700–2200 cm−1). The wavelength of the IR-FEL was calibrated online during measurements using a grating spectrometer and the IR yield was linearly calibrated for frequency dependent pulse energy variations.2.5. Dissolution of precursor materials in ethanolamine and cysteamine solvent system
First, a solution was produced which would be used to deposit CZTS films via spin coating. The solution used consisted of ethanolamine (5 g, 81.9 mmol), cysteamine (0.5 g, 6.5 mmol), copper (56 mg, 0.88 mmol), zinc (39 mg, 0.6 mmol), tin (59 mg, 0.5 mmol), and sulfur (63 mg, 1.98 mmol) or selenium (156 mg, 1.98 mmol).The ratio of metals used targeted a Cu poor, Zn rich composition with ratio values of  and
and  . These ratios were selected due to literature data stating that these are the ideal metal ratios to use and any deviation from them usually leads to a greater portion of unwanted secondary and tertiary phases, and therefore a lower efficiency.39 The corresponding metal oxides and selenium could also be dissolved in this solution.
2.6. Deposition of molybdenum back contact and MoNx barrier layer via sputtering
DC sputtering was used to deposit Mo onto Schott BF-33 glass at a base pressure of below 1 × 10⁻⁶ Torr using a constant power density of 11.6 W cm−2. Firstly, a layer of Mo was deposited at a sputtering pressure of 5 mTorr for 10 minutes, which was then followed by a layer of Mo deposited at 1 mTorr for 30 minutes. This was followed by a thin layer of MoNx, which was produced using a mixture of Ar/N2 gases (33% N2) at a sputtering pressure of 1 mTorr for 10 minutes. The MoNx layer acts as a barrier layer to prevent excess MoSe2 formation during selenization.40 Finally a very thin layer of molybdenum (∼50 nm) was deposited to act as a sacrificial layer to form the small amount of MoSe2 that is beneficial to cell performance. The total Mo/MoNx/Mo stack was approximately 1 μm thick.2.7. Spin deposition of precursor solution
Each solution was deposited separately via spin coating onto the substrates previously made, using a spin speed of 1500 rpm. For each sample produced, 200 μl of solution was deposited onto the substrate, which was then spun (60 s) at 1500 rpm, and then placed on a hot plate (350 °C, 60 s) to allow the solvent to evaporate. This process was repeated several times to build up the required thickness.2.8. Selenization of spin coated samples
Following spin coating, the deposited samples were annealed in the presence of selenium (330 °C for 20 min, then 575 °C for 30 min) under a nitrogen ambient in a tube furnace at 230 Torr.2.9. Cadmium sulfide chemical bath deposition
Once the samples were cooled to below 100 °C in the selenization furnace, the samples were immediately placed into a chemical bath along with CdSO4 solution (0.015 mol dm−3) and ammonium hydroxide solution (28–30%) and stirred (5 min). After 5 minutes, thiourea (1.5 mol dm−3) was added and the solution was continuously stirred (10 min). After ten minutes of deposition, the samples were removed from the solution and dried with compressed air.2.10. Completion of device, sputtering of intrinsic zinc oxide (iZnO) and aluminium doped zinc oxide (AZO) followed by evaporation of silver top contacts
RF sputtering of iZnO and AZO layers was carried out in an ATC Orion 8 magnetron sputtering system (AJA International, USA). Firstly, iZnO was sputtered for 15 minutes at 1 mTorr in a 0.5% oxygen in argon gas mixture, using a power density of 4.8 W cm−2. AZO was then sputtered using argon for 60 minutes at 1 mTorr using a power density of 4.8 W cm−2. The iZnO and AZO films were 80 and 500 nm thick respectively. Finally, 500 nm thick silver contacts were deposited via evaporation, and individual cells were scribed to give an active area of 0.25 cm2.2.11. Analysis
Several forms of analysis were carried out on these samples. On the solutions, electrospray ionization mass spectrometry (ESI-MS), thermogravimetric analysis (TGA) (using TA instruments, Discovery series), RAMAN spectroscopy (using Jobin-Yvon LabRam HR Raman microscope), and infrared multiple photon dissociation were performed. On the deposited samples, XPS (X-ray photoelectron spectroscopy) was performed using Thermo Scientific K-Alpha X-ray Photoelectron Spectrometer system, SEM (scanning electron microscopy) and EDX (Energy-dispersive X-ray spectroscopy) analysis were performed using JSM-7800F Schottky Field Emission Scanning Electron Microscope. JV measurements and EQE measurements were carried out on final devices.2.12. Computational details
Density functional theory (DFT) computations were performed to simulate IR spectra in the harmonic approximation. These computations employed the B3LYP41,42 functional along with the def2-SVP basis set and its associated effective core potential.43 The D3 dispersion correction was employed.44 All computations were carried out using Q-Chem 5.1.453. Results and discussion
3.1. Dissolution of elemental metals or their binary compounds in ethanolamine/cysteamine solvent system
We aimed to produce a precursor solution that is relatively cheap, non-toxic and stable. Ethanolamine is known to form stable chelate complexes with metals through hydroxyl and amino groups46,47 but alone it is unable to dissolve Cu, Sn, and Zn. Cysteamine having amino and thiol groups is also capable of chelation to metals48,49 and looked an ideal candidate for our amine–thiol solvent system; it is also a relatively non-toxic and easy-to-handle solid. Cysteamine dissolves in ethanolamine, and together this solvent system could be used to dissolve Cu, Sn, Zn, and their oxides. A 10![[thin space (1/6-em)]](https://www.rsc.org/images/entities/char_2009.gif) :
:![[thin space (1/6-em)]](https://www.rsc.org/images/entities/char_2009.gif) 1 mixture of ethanolamine (1) and cysteamine (2) – ETA/CA, satisfies all these aspects. This solvent system readily dissolves metallic Cu, Sn, Zn, their oxides CuO, SnO and ZnO, as well as elemental S and Se in under 48 h at room temperature. In contrast, the respective chalcogenides proved less soluble, CuS, Cu2Se, SnS, and SnSe dissolved, but very slowly, whereas ZnS and ZnSe failed to dissolve even after 1 week of stirring.
1 mixture of ethanolamine (1) and cysteamine (2) – ETA/CA, satisfies all these aspects. This solvent system readily dissolves metallic Cu, Sn, Zn, their oxides CuO, SnO and ZnO, as well as elemental S and Se in under 48 h at room temperature. In contrast, the respective chalcogenides proved less soluble, CuS, Cu2Se, SnS, and SnSe dissolved, but very slowly, whereas ZnS and ZnSe failed to dissolve even after 1 week of stirring.
While dissolution of metal oxides or chalcogenides is a redox-neutral process, dissolution of elemental metals must involve their oxidation. Molecular oxygen from air was identified as the most likely oxidant. Indeed, when a solution of ETA/CA was flushed with nitrogen to remove traces of oxygen and the process was carried out under nitrogen atmosphere, it took more than a week for some metals to show signs of dissolution, while in other cases no signs of dissolution were observed. Under aerobic conditions, solutions can be formed in as little as 8 hours. For comparison, dissolution of metal oxides was not affected by changing from air to nitrogen atmosphere.
Cystamine represents an oxidised form of cysteamine and contains a sulfur–sulfur bond. To prove whether it may serve as an internal oxidising agent under anaerobic conditions, a 10![[thin space (1/6-em)]](https://www.rsc.org/images/entities/char_2009.gif) :
:![[thin space (1/6-em)]](https://www.rsc.org/images/entities/char_2009.gif) 1 mixture of ethanolamine and cystamine dihydrochloride was used as a solvent. This system successfully dissolved CuO, Sn, Zn and S under nitrogen atmosphere. The ink thus obtained could be used in the fabrication of CZTS solar cells.
1 mixture of ethanolamine and cystamine dihydrochloride was used as a solvent. This system successfully dissolved CuO, Sn, Zn and S under nitrogen atmosphere. The ink thus obtained could be used in the fabrication of CZTS solar cells.
However, the ETA/cystamine mixture proved inferior to the ETA/CA solvent system in terms of dissolving power and also contains chloride ions, which could affect performance of the final absorber by forming unwanted defects.
For practical reasons, including the time needed for complete dissolution, homogeneity, etc., the solutions used for this work were based on elemental Cu, Zn, Sn, S (yellow solution) and/or Se (brown solution) (Fig. 2).
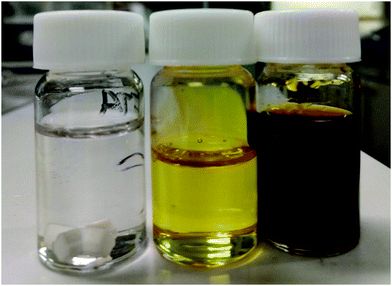 | ||
Fig. 2 Solution of CZTS precursors in ETA/CA. Left to right: 10![[thin space (1/6-em)]](https://www.rsc.org/images/entities/char_2009.gif) : :![[thin space (1/6-em)]](https://www.rsc.org/images/entities/char_2009.gif) 1 ETA/CA; solution of Cu, Zn, Sn, S; solution of Cu, Zn, Sn, Se. 1 ETA/CA; solution of Cu, Zn, Sn, S; solution of Cu, Zn, Sn, Se. | ||
3.2. Analysis of solutes by mass spectrometry
To gain a deeper insight into the solution formation chemistry, mass spectrometry analysis of 10![[thin space (1/6-em)]](https://www.rsc.org/images/entities/char_2009.gif) :
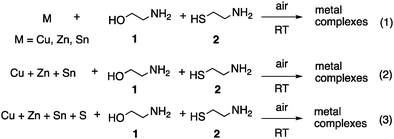
:![[thin space (1/6-em)]](https://www.rsc.org/images/entities/char_2009.gif) 1 ETA/CA solutions of precursors was carried out. ESI-MS study in positive ion mode within m/z 100–1500 range was performed by real-time reaction monitoring. The online ESI-MS monitoring of the dissolution process was divided into three different groups (Scheme 1): (1) solutions of individual metals Cu, Zn and Sn; (2) a solution containing all three metals Cu/Zn/Sn together; and (3) a solution containing all the CZTS components Cu/Zn/Sn/S. The results are collected in Tables 1–3. It is worth noting that mass spectra of reaction (2) were also recorded in negative ion mode. A similar set of ions was observed, though number of ions and their abundances were lower compared to the positive mode and therefore these spectra are not discussed here in detail.
1 ETA/CA solutions of precursors was carried out. ESI-MS study in positive ion mode within m/z 100–1500 range was performed by real-time reaction monitoring. The online ESI-MS monitoring of the dissolution process was divided into three different groups (Scheme 1): (1) solutions of individual metals Cu, Zn and Sn; (2) a solution containing all three metals Cu/Zn/Sn together; and (3) a solution containing all the CZTS components Cu/Zn/Sn/S. The results are collected in Tables 1–3. It is worth noting that mass spectra of reaction (2) were also recorded in negative ion mode. A similar set of ions was observed, though number of ions and their abundances were lower compared to the positive mode and therefore these spectra are not discussed here in detail.
| Calcd m/z [M]+ | Structure | Composition | Presence in reaction mixture | ||
|---|---|---|---|---|---|
| (1)a | (2)b | (3)c | |||
| a Dissolution of Cu. b Dissolution of Cu/Zn/Sn mixture. c Dissolution of Cu/Zn/Sn/S mixture. | |||||
| 214.9732 | Cu(2)2 | CuC4H12N2S2 | + | + | + |
| 342.8305 | Cu3(2)2 | Cu3C4H12N2S2 | + | − | − |
| 418.8525 | Cu3(2)3 | Cu3C6H18N3S3 | + | − | + |
| 481.7822 | Cu4(2)3 | Cu4C6H18N3S3 | + | + | + |
| 622.7321 | Cu5(2)4 | Cu5C8H24N4S4 | + | − | + |
| 246.9453 | Cu(2)2S | CuC4H12N2S3 | − | − | + |
| 278.9174 | Cu(2)2S2 | CuC4H12N2S4 | − | − | + |
| 310.8895 | Cu(2)2S3 | CuC4H12N2S5 | − | − | + |
| 513.7542 | Cu4(2)3S | Cu4C6H18N3S4 | − | − | + |
| 761.6835 | Cu6(2)5 | Cu6C10H30N5S5 | + | − | − |
| 900.6352 | Cu7(2)6 | Cu7C12H36N6S6 | + | − | − |
| 1041.5854 | Cu8(2)7 | Cu8C14H42N7S7 | + | − | − |
| 1180.5366 | Cu9(2)8 | Cu9C16H48N8S8 | + | − | − |
| Calcd m/z [M]+ | Structure | Composition | Presence in reaction mixture | ||
|---|---|---|---|---|---|
| (1)a | (2)b | (3)c | |||
| a Dissolution of Sn. b Dissolution of Cu/Zn/Sn mixture. c Dissolution of Cu/Zn/Sn/S mixture. | |||||
| 270.9378 | Sn(2)2 | SnC4H11N2S2 | + | + | + |
| 347.9676 | Sn(2)3 | SnC6H18N3S3 | + | + | + |
| 379.9395 | Sn(2)3S | SnC6H18N3S4 | − | − | + |
| 411.9114 | Sn(2)3S2 | SnC6H18N3S5 | − | − | + |
| 443.8833 | Sn(2)3S3 | Sn1C6H18N3S6 | − | − | + |
| 475.8553 | Sn(2)3S4 | SnC6H18N3S7 | − | − | + |
| 507.8272 | Sn(2)3S5 | SnC6H18N3S8 | − | − | + |
| Calcd m/z [M]+ | Structure | Composition | Presence in reaction mixture | ||
|---|---|---|---|---|---|
| (1)a | (2)b | (3)c | |||
| a Dissolution of Zn. b Dissolution of Cu/Zn/Sn mixture. c Dissolution of Cu/Zn/Sn/S mixture. | |||||
| 214.9650 | Zn(2)2 | ZnC4H11N2S2 | + | + | − |
| 225.0035 | Zn(HOC2H4NH-C2H2NHC2H4S) | ZnC6H13N2SO | + | + | + |
| 291.9949 | Zn(2)3 | ZnC6H18N3S3 | + | + | + |
| 323.9847 | Zn(2)3O2 | ZnC6H18N3S3O2 | + | + | − |
| 357.9208 | Zn2(2)3 | Zn2C6H18N3S3 | + | + | + |
| 389.9107 | Zn2(2)3O2 | Zn2C6H18N3O2S3 | − | + | − |
| 421.8480 | Zn2(2)3S2 | Zn2C6H16N3S5 | + | − | + |
| 603.8987 | Zn3(2)5N2 | Zn3C10H30N7S5 | + | + | − |
Dissolution of metallic Cu in a 10![[thin space (1/6-em)]](https://www.rsc.org/images/entities/char_2009.gif) :
:![[thin space (1/6-em)]](https://www.rsc.org/images/entities/char_2009.gif) 1 ETA/CA at room temperature was monitored by ESI-MS over 4 h. The ion with m/z 214, a complex of copper(II) with two cysteamine molecules, Cu(2)2, was by far the most intense peak (Table 1). Ions with m/z 481 and 622 were slowly rising in concentration as time passed. This indicated a slow formation of polymeric species of the general formula Cux(2)x−1 with Cu(2) as the repeating unit. After continuous stirring for 14 h, a direct MS injection of the resulting solution showed some additional ions in this polymeric series with the chain increasing up to Cu9(2)8. The complexes Cu(2)2 and a Cu3(2)2 observed in the ESI-MS are consistent with previous reports30,50–52 where structures of complexes containing copper and cysteamine were analyzed by X-ray and IR spectroscopy.
1 ETA/CA at room temperature was monitored by ESI-MS over 4 h. The ion with m/z 214, a complex of copper(II) with two cysteamine molecules, Cu(2)2, was by far the most intense peak (Table 1). Ions with m/z 481 and 622 were slowly rising in concentration as time passed. This indicated a slow formation of polymeric species of the general formula Cux(2)x−1 with Cu(2) as the repeating unit. After continuous stirring for 14 h, a direct MS injection of the resulting solution showed some additional ions in this polymeric series with the chain increasing up to Cu9(2)8. The complexes Cu(2)2 and a Cu3(2)2 observed in the ESI-MS are consistent with previous reports30,50–52 where structures of complexes containing copper and cysteamine were analyzed by X-ray and IR spectroscopy.
Online monitoring of reactions (2) and (3) (Scheme 1) exhibited the same Cu-containing ions with m/z 214 and 481. At the same time, different compositions of the reaction mixtures have an effect on the conductivity of the medium and the solubility of different species, therefore abundance of some ions may vary. For example, ions with m/z 418 and 622 are clearly visible in reactions (1) and (3) but not in solution (2). The presence of sulfur (reaction 3) slightly increased the rate of dissolution but resulted in a partial ion suppression leading to lower ions intensities. Additionally, new signals were observed corresponding to species with one or more sulfur atoms (m/z 246, 278, 310 and 513).
Dissolution of metallic Sn in ETA/CA mixture was completed in under 11 h. During the online monitoring, several Sn-containing complexes were detected, the most abundant being ions with m/z 270 and 347. ESI-MS monitoring of reaction (3) revealed formation of tin complexes containing sulfur atom(s), mirroring the trend observed for Cu. Such signals were not detected when sulfur was absent from the system.
Zinc was the fastest to dissolve in the ETA/CA mixture under the same conditions, giving a clear solution in 3.5 h. Furthermore, dissolution of Zn exhibited a slightly different picture from the two other metals. An ion with m/z 225 was the most abundant, which was almost double the intensity of other Zn-containing ions. Its composition looked intriguing as it appears to contain both cysteamine and ethanolamine units in addition to C2H. Good match of isotopic pattern and a low mass determination error confirm the elemental composition of the species. Other easily detectable signals included ions with m/z 214, 291 and 357, corresponding to complexes Zn(2)2 [M − H]+, Zn(2)3 and Zn2(2)3, respectively, which contained only the cysteamine ligand. There were also a series of ions containing what appears to be O2 and N2 components as confirmed by the accurate mass figures. However, due to a low abundance of these species, it would be difficult to speculate on the structure of these ions. Formation of the ion with m/z 225 peaked at the early stages of dissolution and then gradually declined, while concentration of ions with m/z 214 and 357 representing homoleptic cysteamine complexes was steadily rising (see ESI† for details). This seems to suggest that cysteamine was slowly replacing the less favourable ethanolamine.
After screening through plausible chemical formulae for the ion with m/z 225.0035, a complex Zn(HOC2H4NHC2H2NHC2H4S) was tentatively assigned, where the metal is chelated by a polydentate ligand. It has to be noted that care has been taken for the analysis of this ion during the real-time ESI-MS monitoring. Thus, it can be assumed that chemical processes during the activation of the metal surface in the initial stages of dissolution are responsible for the formation of the chelating fragment after the condensation of two ethanolamine and one cysteamine molecules.
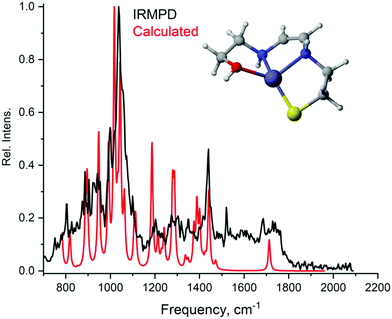
To determine the structure of the ions, infrared multiphoton dissociation (IRMPD) spectroscopy was employed for measuring mass selected ions in the gas phase. In the field of ion chemistry, infrared ion spectroscopy (IRIS) has become recognized as a valuable tool for structural elucidation especially in fields focusing on the fundamentals of ion structure in mass spectrometry. Many examples of the application of IRIS for structural questions in ion chemistry are now in the literature, involving for example the determination of metal-ion coordination structures, cluster geometries, protonation/deprotonation sites, reaction intermediate structures, and the structural elucidation of products from MS/MS reactions.53,54 A general agreement between the experimental and predicted spectra in the major fingerprint region is usually sufficient to allow assignment of the overall chemical structure to the m/z detected in the MS. For the Zn-complex detected at m/z 225.0035, the experimental IR spectrum was compared with the theoretical spectra of three possible structures optimized by DFT calculations. Through matching the experimental and calculated spectra for different candidate structures, we are able to assign the structure to an enamine isomer (Fig. 3). Agreement with two other complexes (see Fig. S20 and S21, ESI†) was found less satisfactory. In particular, the presence of an alkyne or an imine group can be excluded based on the absence of their characteristic stretching modes.
Using the aforementioned IRIS technique combined with DFT computational analysis, the structures of the most abundant Sn-containing ions with m/z 270 and 347 were determined (Fig. 4 and 5). The tin complex with m/z 270 might be represented by two possible conformers (Fig. 4). However, it would be difficult to tell with confidence which one provides a better match with the IRIS data.
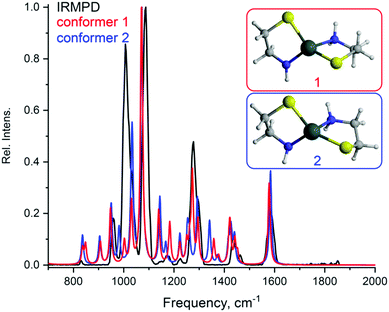 | ||
| Fig. 4 Tin complexes Sn(2)2 with m/z 270.9378 observed in ESI-MS: Structures of the complexes optimized by DFT calculations; experimental IRMPD and calculated spectra (both normalized) of the ions. | ||
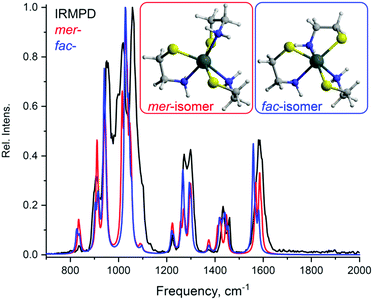 | ||
| Fig. 5 Tin complexes Sn(2)3 with m/z 347.9676 observed in ESI-MS: Structures of the complexes optimized by DFT calculations; experimental IRMPD and calculated spectra (both normalized) of the ions. | ||
A similar picture could be observed for the complex with m/z 348. Mer- and fac-isomers of the complex could be formed and both can contribute to the ion structure.
A unifying feature among all the spectra is a highly intense peak in the area above 1000 cm−1. Computational analysis shows that this peak derives from the NH wagging mode, which, owing to the complex formation, is significantly blue-shifted when compared to the free amine.
Summing up, a detailed real-time ESI-MS monitoring enabled to detect the main species formed during a direct dissolution of metals (Cu, Zn, Sn) in ETA/CA solution under ambient conditions (see ESI,† Fig. S19). Complexes that have formed in solutions of individual metals correlated well with those forming in the mixture of all three metal components. Mainly, metal complexes with cysteamine are formed, however, sulfur, ethanolamine, oxygen and nitrogen could coordinate to the metal center. This technique allowed to track ions at the moment of their appearance and then observe the change in their abundances. The different nature of Zn, Sn and Cu metals is reflected in their ESI-MS spectra. Importantly, the metals do not affect each other during the dissolution process. The reactions proceed via oxidative process as the overpressure of argon slows down the reaction, whereas air overpressure tends to accelerate the formation of soluble species. Addition of sulfur promotes the dissolution of copper, as it was the only metal that was not completely dissolved in the absence of sulfur. Among the ions studied, Sn exhibited the highest ionization efficiency, followed by Cu, while Zn showed the lowest ionization efficiency. Elemental composition of all the detected ions was confirmed by isotopic distribution pattern match including low error in accurate mass determination.
Raman and IR spectroscopy (spectra available in the ESI,† Fig. S1 and S22) were performed but it was difficult to gain additional insight from this analysis as all the peaks observed could be due to either ethanolamine or cysteamine, no bonds involving the metals could be observed.
3.3. TGA analysis of the solutions
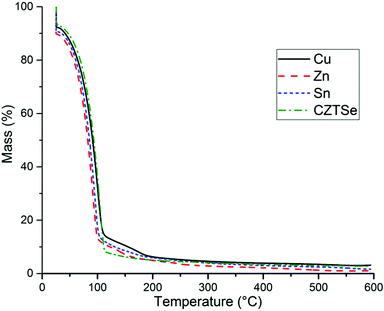
To further understand the properties of each solution thermogravimetric analysis was performed. Solutions containing Cu (0.11 g), Zn (0.077 g), Sn (0.116 g), and Se (0.31 g) in ethanolamine/cysteamine (10 g/1 g) (detailed in Fig. 2 and Section 2.5) were analyzed by TGA (Fig. 6). The bulk of solvent had evaporated by 100 °C, with only 10–15% by mass remaining, which decreased to around 4% by 300 °C, in all cases. The ∼4% mass remaining is accounted for by metal chalcogenides (the dissolved elements make up ∼5% of the solution). These results show that ethanolamine solutions are ideal for deposition of CZTS by spin coating as the solvent readily evaporates at temperatures below 300 °C, allowing the use of lower temperatures which could prevent oxidation of the thin film. This temperature is also favourable in comparison to TGA of the water solutions used in our previous work,31 where the mass (%) remaining was still ∼15% at 250 °C (graph available in ESI,† Fig. S23).Furthermore, the viscosity of ethanolamine had proved detrimental to spray pyrolysis in our previous work,30,31 therefore deposition of CZTS by spin coating was selected as a preferred technique.
3.4. Device fabrication
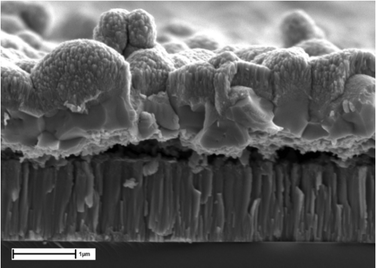
In this work a versatile, non-toxic, and relatively inexpensive solvent mixture comprising of ethanolamine and cysteamine allowed the dissolution of each metal or its oxide, along with selenium and/or sulfur. Spin coating was deemed to be a suitable deposition technique due to the increased viscosity of ethanolamine, leading to homogenous films after deposition. Spin coating using the solution detailed in Section 2.5 was performed to fabricate thin film CZTS absorber layers with a thickness of ∼1 μm (Fig. 7). There is a clear difference before and after selenization, with the as deposited non crystallized film formed with some voids present. After selenization, there is significant recrystallisation with distinct through thickness polycrystalline grains forming. The high temperature selenization process is required because the spin coating is performed in air, and the precursor film is annealed at 350 °C. This leads to significant oxide formation of the precursor, which requires an aggressive selenization step to form the desired kesterite absorber.55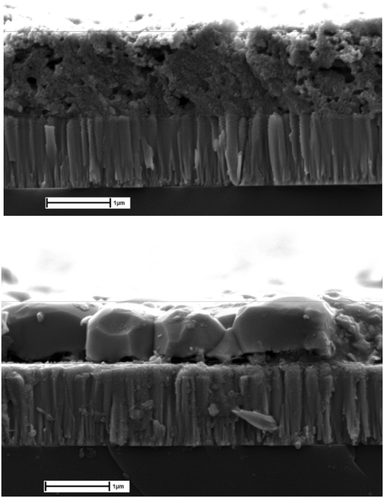 | ||
| Fig. 7 Top: SEM cross section of thin film after spin deposition. Bottom: SEM cross section of thin film selenization. | ||
The solution used, contained sulfur and no selenium, however after selenization EDX analysis (see ESI,† Fig. S2) revealed that sulfur had been mostly replaced by selenium due to the harsh annealing conditions, resulting in CZTSe crystal formation. XPS analysis performed (see ESI,† Fig. S24) displayed that in the bulk of the absorber layer the ratios of metals were  and
and  , which is close to the ideal ratios mentioned previously (Section 2.5). The XPS data provided further evidence of S removal (ESI,† Fig. S24b). It also showed that the quantities of Cu, Zn, Sn, and Se do not vary greatly throughout the film.
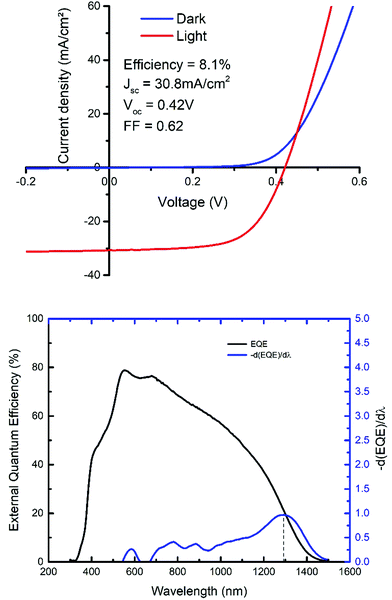
SEM cross section image of a completed device, completed with a CdS buffer layer and a top iZnO/AZO contact, reveals significant recrystallisation through the thickness of the absorber (Fig. 8), though there are still some voids present at the back contact, which could affect charge collection. Despite this, the highest efficiency device produced using this method was 8.1%. The champion device has a Voc of 0.42 V, a Jsc of 30.8 mA cm−2 and a fill factor of 62%.
The EQE reaches a peak response at ∼80% from 500–600 nm (Fig. 9), which then drops towards longer wavelengths, likely due to poor carrier collection towards the back of the device. The Jsc value obtained from the EQE data was 30.8 mA cm−2, matching the value obtained from the JV curve. The band gap extracted using EQE gives a value of 0.97 eV, this was determined by calculating the −d(EQE)/dλ of the EQE curve, and determining the peak (dashed line indicates peak in Fig. 9).56 This band gap value further supports the fact that despite sulfur being incorporated into the original solution, the harsh selenization appears to have forced most of the sulfur out of the thin film. Depending on the sulfur/selenium ratio the band gap can vary from ∼1.0 eV (CZTSe) to 1.5 eV (CZTS), showing significant sulfur substitution with selenium in these films.57,58
4. Conclusions
It has been shown that a 10![[thin space (1/6-em)]](https://www.rsc.org/images/entities/char_2009.gif) :
:![[thin space (1/6-em)]](https://www.rsc.org/images/entities/char_2009.gif) 1 ethanolamine/cysteamine solution can be used to dissolve Cu, Zn, and Sn in their elemental and oxide forms, as well as their chalcogenide compounds in some cases. The dynamics of dissolution and the nature of metal complexes in CZT(S/Se) solutions have also been identified with the aid of spectroscopic techniques such as electrospray ionization mass spectrometry and infrared multiple photon dissociation. It was discovered that cysteamine, acting as a bidentate ligand, was the sole ligand in most cases, which may prove useful in extending the solution methodology to other potential constituents of solar cells. Once dissolved, the inks can be used to prepare CZT(S/Se) thin films. The inks are ideal for spin coating due to their high viscosity and the fact that the solvent readily evaporated at temperatures below 200 °C, as confirmed by TGA. The solutions developed in this paper could be used to revitalize research into kesterite solar cells as they can be used to produce promising efficiency (8.1%) CZT(S/Se) solar cells from cheap and environmentally friendly materials.
1 ethanolamine/cysteamine solution can be used to dissolve Cu, Zn, and Sn in their elemental and oxide forms, as well as their chalcogenide compounds in some cases. The dynamics of dissolution and the nature of metal complexes in CZT(S/Se) solutions have also been identified with the aid of spectroscopic techniques such as electrospray ionization mass spectrometry and infrared multiple photon dissociation. It was discovered that cysteamine, acting as a bidentate ligand, was the sole ligand in most cases, which may prove useful in extending the solution methodology to other potential constituents of solar cells. Once dissolved, the inks can be used to prepare CZT(S/Se) thin films. The inks are ideal for spin coating due to their high viscosity and the fact that the solvent readily evaporated at temperatures below 200 °C, as confirmed by TGA. The solutions developed in this paper could be used to revitalize research into kesterite solar cells as they can be used to produce promising efficiency (8.1%) CZT(S/Se) solar cells from cheap and environmentally friendly materials.
Conflicts of interest
There are no conflicts to declare.Acknowledgements
The authors thank the Loughborough University for the studentship to JCL and also acknowledge use of facilities within the Loughborough Materials Characterisation Centre. JWB would like to acknowledge funding support from the EPSRC (EP/N026438/1 and EP/L017792/1) for carrying out this work. The authors are grateful to Dr Giel Berden and Prof. Jos Oomens for their support in IRIS experiments and helpful discussions. IRIS study at FELIX laboratory has been supported by the project CALIPSOplus under the Grant Agreement 730872 from the EU Framework Programme for Research and Innovation HORIZON 2020. We gratefully acknowledge the Nederlandse Organisatie voor Wetenschappelijk Onderzoek (NWO) for the support of the FELIX Laboratory.Notes and references
- D. E. Carlson and C. R. Wronski, Appl. Phys. Lett., 1976, 28, 671–673 CrossRef CAS
.
- K. Masuko, M. Shigematsu, T. Hashiguchi, D. Fujishima, M. Kai, N. Yoshimura, T. Yamaguchi, Y. Ichihashi, T. Mishima, N. Matsubara, T. Yamanishi, T. Takahama, M. Taguchi, E. Maruyama and S. Okamoto, IEEE J. Photovolt., 2014, 4, 1433–1435 Search PubMed
.
- R. Repins, I. Contreras, M. A. Egaas, B. DeHart, C. Scharf, J. Perkins, C. L. Perkins, B. To and R. Noufi, Prog. Photovoltaics Res. Appl., 2008, 16, 235–239 CrossRef
.
- P. Jackson, D. Hariskos, E. Lotter, S. Paetel, R. Wuerz, R. Menner, W. Wischmann and M. Powalla, Prog. Photovoltaics Res. Appl., 2011, 19, 894–897 CrossRef CAS
.
- J. Britt and C. Ferekides, Appl. Phys. Lett., 1993, 62, 2851–2852 CrossRef CAS
.
- X. Wu, Sol. Energy, 2004, 77, 803–814 CrossRef CAS
.
- H. Katagiri, N. Sasaguchi, S. Hando, S. Hoshino, J. Ohashi and T. Yokota, Sol. Energy Mater. Sol. Cells, 1997, 49, 407–414 CrossRef CAS
.
- H. Katagiri, K. Jimbo, W. S. Maw, K. Oishi, M. Yamazaki, H. Araki and A. Takeuchi, Thin Solid Films, 2009, 517, 2455–2460 CrossRef CAS
.
- V. Chawla and B. Clemens, in 2012 38th IEEE Photovoltaic Specialists Conference, IEEE, 2012, pp. 002990–002992.
- K.-J. Yang, D.-H. Son, S.-J. Sung, J.-H. Sim, Y.-I. Kim, S.-N. Park, D.-H. Jeon, J. Kim, D.-K. Hwang, C.-W. Jeon, D. Nam, H. Cheong, J.-K. Kang and D.-H. Kim, J. Mater. Chem. A, 2016, 4, 10151–10158 RSC
.
- H. D. T. M. Friedlmeier, N. Wieser and T. Walter, Proc. 14th Eur. Conf. Pho-tovoltaic Sci. Eng. Exhib.
- Y. S. Lee, T. Gershon, O. Gunawan, T. K. Todorov, T. Gokmen, Y. Virgus and S. Guha, Adv. Energy Mater., 2015, 5, 1401372 CrossRef
.
- J. J. Scragg, P. J. Dale and L. M. Peter, Electrochem. Commun., 2008, 10, 639–642 CrossRef CAS
.
- L. Vauche, L. Risch, Y. Sánchez, M. Dimitrievska, M. Pasquinelli, T. Goislard de Monsabert, P.-P. Grand, S. Jaime-Ferrer and E. Saucedo, Prog. Photovoltaics Res. Appl., 2016, 24, 38–51 CrossRef CAS
.
- N. Nakayama and K. Ito, Appl. Surf. Sci., 1996, 92, 171–175 CrossRef CAS
.
- G. Larramona, S. Bourdais, A. Jacob, C. Choné, T. Muto, Y. Cuccaro, B. Delatouche, C. Moisan, D. Péré and G. Dennler, J. Phys. Chem. Lett., 2014, 5, 3763–3767 CrossRef CAS PubMed
.
- K. Tanaka, N. Moritake and H. Uchiki, Sol. Energy Mater. Sol. Cells, 2007, 91, 1199–1201 CrossRef CAS
.
- K. Liu, B. Yao, Y. Li, Z. Ding, H. Sun, Y. Jiang, G. Wang and D. Pan, J. Mater. Chem. C, 2017, 5, 3035–3041 RSC
.
- W. Wang, M. T. Winkler, O. Gunawan, T. Gokmen, T. K. Todorov, Y. Zhu and D. B. Mitzi, Adv. Energy Mater., 2014, 4, 1301465 CrossRef
.
- D. H. Son, S. H. Kim, S. Y. Kim, Y. I. Kim, J. H. Sim, S. N. Park, D. H. Jeon, D. K. Hwang, S. J. Sung, J. K. Kang, K. J. Yang and D. H. Kim, J. Mater. Chem. A, 2019, 7, 25279–25289 RSC
.
- Solar Frontier Achieves World Record Thin-Film Solar Cell Efficiency of 23.35%, http://www.solar-frontier.com/eng/news/2019/<?pdb_no 0117?>0117<?pdb END?>_press.html, (accessed 15 April 2020).
- D. B. Mitzi, O. Gunawan, T. K. Todorov, K. Wang and S. Guha, Sol. Energy Mater. Sol. Cells, 2011, 95, 1421–1436 CrossRef CAS
.
- S. G. Haass, M. Diethelm, M. Werner, B. Bissig, Y. E. Romanyuk and A. N. Tiwari, Adv. Energy Mater., 2015, 5, 1500712 CrossRef
.
- Z. Su, J. M. R. Tan, X. Li, X. Zeng, S. K. Batabyal and L. H. Wong, Adv. Energy Mater., 2015, 5, 1500682 CrossRef
.
- D. H. Webber and R. L. Brutchey, J. Am. Chem. Soc., 2013, 135, 15722–15725 CrossRef CAS PubMed
.
- R. Zhang, S. M. Szczepaniak, N. J. Carter, C. A. Handwerker and R. Agrawal, Chem. Mater., 2015, 27, 2114–2120 CrossRef CAS
.
- X. Zhao, R. Zhang, C. Handwerker and R. Agrawal, in 2016 IEEE 43rd Photovoltaic Specialists Conference (PVSC), IEEE, 2016, pp. 0542–0544.
- C. K. Miskin, A. Dubois-Camacho, M. O. Reese and R. Agrawal, J. Mater. Chem. C, 2016, 4, 9167 RSC
.
- J. J. Buckley, C. L. McCarthy, J. Del Pilar-Albaladejo, G. Rasul and R. L. Brutchey, Inorg. Chem., 2016, 55, 3175–3180 CrossRef CAS PubMed
.
- C. S. Cooper, P. Arnou, L. D. Wright, S. Uličná, J. M. Walls, A. V. Malkov and J. W. Bowers, Thin Solid Films, 2017, 633, 151–155 CrossRef CAS
.
- L. D. Wright, J. C. Lowe, M. Bliss, V. Tsai, M. Togay, T. R. Betts, J. M. Walls, A. V. Malkov and J. W. Bowers, Thin Solid Films, 2019, 669, 588–594 CrossRef CAS
.
- P. Murria, C. K. Miskin, R. Boyne, L. T. Cain, R. Yerabolu, R. Zhang, E. C. Wegener, J. T. Miller, H. I. Kenttämaa and R. Agrawal, Inorg. Chem., 2017, 56, 14396–14407 CrossRef CAS PubMed
.
- J. Fu, J. Fu, Q. Tian, H. Wang, F. Zhao, J. Kong, X. Zhao and S. Wu, ACS Appl. Energy Mater., 2018, 1, 594–601 CrossRef CAS
.
- A. Gómez-Núñez, P. Roura, C. López and A. Vilà, Appl. Surf. Sci., 2016, 381, 48–53 CrossRef
.
- M. Werner, C. M. Sutter-Fella, Y. E. Romanyuk and A. N. Tiwari, Thin Solid Films, 2015, 582, 308–312 CrossRef CAS
.
-
S. K. Swami, A. Kumar and V. Dutta, Energy Procedia, Elsevier Ltd, 2013, vol. 33, pp. 198–202 Search PubMed
.
- Q. Tian, Y. Cui, G. Wang and D. Pan, RSC Adv., 2015, 5, 4184–4190 RSC
.
- A. V. Hesketh, S. Nowicki, K. Baxter, R. L. Stoddard and J. S. McIndoe, Organometallics, 2015, 34, 3816–3819 CrossRef CAS
.
- S. Chen, A. Walsh, X.-G. Gong and S.-H. Wei, Adv. Mater., 2013, 25, 1522–1539 CrossRef CAS PubMed
.
- S. Uličná, P. Arnou, A. Abbas, M. Togay, L. M. Welch, M. Bliss, A. V. Malkov, J. M. Walls and J. W. Bowers, J. Mater. Chem. A, 2019, 7, 7042 RSC
.
- A. D. Becke, J. Chem. Phys., 1993, 98, 5648–5652 CrossRef CAS
.
- C. Lee, W. Yang and R. G. Parr, Phys. Rev. B: Condens. Matter Mater. Phys., 1988, 37, 785–789 CrossRef CAS PubMed
.
- F. Weigend and R. Ahlrichs, Phys. Chem. Chem. Phys., 2005, 7, 3297–3305 RSC
.
- S. Grimme, S. Ehrlich and L. Goerigk, J. Comput. Chem., 2011, 32, 1456–1465 CrossRef CAS PubMed
.
- Y. Shao,
et al.
, Mol. Phys., 2015, 113, 184–215 CrossRef CAS
.
- E. Y. Muslih, A. Ismail and K. H. Kim, Indones. J. Sci. Technol., 2017, 2, 191–196 CrossRef
.
- N. Z. Shaban, A. E. Ali and M. S. Masoud, J. Inorg. Biochem., 2003, 95, 141–148 CrossRef CAS PubMed
.
- L. Ma, W. Chen, G. Schatte, W. Wang, A. G. Joly, Y. Huang, R. Sammynaiken and M. Hossu, J. Mater. Chem. C, 2014, 2, 4239–4246 RSC
.
- M. Akhtar, M. N. Tahir, M. Saleem, M. Mazhar, A. Rauf, A. A. Isab, S. Ahmad and S. Nadeem, Russ. J. Inorg. Chem., 2015, 60, 1568–1572 CrossRef CAS
.
- A. Baysal, A. D. Saatci, M. Kahraman and S. Akman, Microchim. Acta, 2011, 173, 495–502 CrossRef CAS
.
- S. Bloxham, O. Eicher-Lorka, R. Jakubėnas and G. Niaura, Spectrosc. Lett., 2003, 36, 211–226 CrossRef CAS
.
- H. L. Nigam, B. D. Srivastava and J. Prasad, Solid State Commun., 1978, 28, 1001–1004 CrossRef CAS
.
- J. Martens, G. Berden, C. R. Gebhardt and J. Oomens, Rev. Sci. Instrum., 2016, 87, 103108 CrossRef PubMed
.
- D. B. Eremin, E. A. Denisova, A. Yu. Kostyukovich, J. Martens, G. Berden, J. Oomens, V. N. Khrustalev, V. M. Chernyshev and V. P. Ananikov, Chem. – Eur. J., 2019, 25, 16564–16572 CrossRef CAS PubMed
.
- X. Yin, C. Tang, L. Sun, Z. Shen and H. Gong, Chem. Mater., 2014, 26, 2005–2014 CrossRef CAS
.
- R. Carron, C. Andres, E. Avancini, T. Feurer, S. Nishiwaki, S. Pisoni, F. Fu, M. Lingg, Y. E. Romanyuk, S. Buecheler and A. N. Tiwari, Thin Solid Films, 2019, 669, 482–486 CrossRef CAS
.
- A. Redinger, D. M. Berg, P. J. Dale, N. Valle and S. Siebentritt, in 2011 37th IEEE Photovoltaic Specialists Conference, IEEE, 2011, pp. 000025–000025.
- M. Courel, E. Valencia-Resendiz, J. A. Andrade-Arvizu, E. Saucedo and O. Vigil-Galán, Sol. Energy Mater. Sol. Cells, 2017, 159, 151–158 CrossRef CAS
.
Footnote |
| † Electronic supplementary information (ESI) available: IR and Raman spectra, ESI MS monitoring traces and spectra of the most abundant complexes, TGA analysis and EDX data of deposited thin film and optimized geometries of the complexes studied. See DOI: 10.1039/d0tc00955e |
| This journal is © The Royal Society of Chemistry 2020 |

