
 Open Access Article
 This Open Access Article is licensed under a Creative Commons Attribution-Non Commercial 3.0 Unported Licence
The effect of alkyl side chain length on the formation of two semi-crystalline phases in low band gap conjugated polymers†
Mengmeng
Li‡
 *abcd,
Pieter J.
Leenaers‡
b,
Martijn M.
Wienk
b and
René A. J.
Janssen
*bc
*abcd,
Pieter J.
Leenaers‡
b,
Martijn M.
Wienk
b and
René A. J.
Janssen
*bc
aKey Laboratory of Microelectronic Devices and Integrated Technology, Institute of Microelectronics, Chinese Academy of Sciences, Beijing 100029, China. E-mail: limengmeng@ime.ac.cn
bMolecular Materials and Nanosystems and Institute for Complex Molecular Systems, Eindhoven University of Technology, P. O. Box 513, 5600 MB Eindhoven, The Netherlands. E-mail: r.a.j.janssen@tue.nl
cDutch Institute For Fundamental Energy Research, De Zaale 20, 5612 AJ Eindhoven, The Netherlands
dUniversity of Chinese Academy of Sciences, Beijing 100049, China
First published on 26th March 2020
Abstract
The effect of the length of solubilizing alkyl side chains, ranging from hexyl to pentadecyl, on the formation and structure of two distinct semi-crystalline semiconductor phases, β1 and β2, of a single conjugated polymer is investigated for a low band gap poly(diketopyrrolopyrrole-alt-quaterthiophene). Compared to β1, the β2 phase exhibits a distinct redshifted absorption and an associated near infrared photoluminescence. The length of the alkyl side chains controls the formation of the β1 and β2 phases. Intermediate length alkyl side chains (nonyl and dodecyl) can selectively provide the β1 or β2 phase in solution and in semi-crystalline thin films, depending on the nature of the solvent used. For short side chains (hexyl) the β2 phase forms more readily while for long side chains (pentadecyl) the β1 phase is predominant. The kinetics of β2 phase formation is investigated and reveals a reduced growth rate when long alkyl side chains are present. X-ray diffraction reveals a closer π–π stacking distance for β2 than for β1, consistent with its redshifted absorption and its higher mobility in field-effect transistors. The polymer with hexyl side chains adopts an edge-on orientation in thin films, while the longer alkyl chains induce a face-on orientation. Photovoltaic devices exhibit an additional near infrared spectral contribution to the photocurrent for the β2 phase. The study shows that the formation of the two polymorphs β1 and β2 is controlled by the alkyl side chains and the solubility that arises from them. Shorter side chains (lower solubility) favor β2 and longer side chains (higher solubility) β1, and at intermediate lengths both phases can be formed.
Introduction
Because of their easy synthesis, tunable optical band gap, and high hole and electron mobilities, π-conjugated polymers incorporating diketopyrrolopyrrole (DPP) units have emerged as a promising class of organic semiconductors.1–6 In these polymers the DPP units are alternating with conjugated segments consisting of (fused) heterocycles along the main chain. To ensure solubility, branched alkyl side chains are most commonly employed on the DPP units. Similar to many conjugated polymers,7–11 the position of the branching point and the length of these side chains control the three-dimensional structure and the performance of DPP polymers in field-effect transistors and solar cells.12,13 Experimental and theoretical results indicate that replacing branched by linear alkyl side chains can reduce the steric hindrance between polymer chains, resulting in closer packing and enhanced charge transport.14–18To compensate for the reduced solubility for DPP polymers with linear alkyl chains on the DPP units, branched side chains can be placed on the neighboring conjugated segments.19 This resulted in a remarkable observation for D-PDPP4T-HD (Fig. 1), which forms two different semi-crystalline aggregated phases, β1 and β2, both in solution and in the solid state controlled via the nature of the solvent, in addition to an amorphous, molecular disordered, α phase at high temperature.20 The aggregated β1 and β2 phases of D-PDPP4T-HD exhibit markedly different optical absorption, photoluminescence, and field-effect mobility, which result from a difference in polymer packing.20 While polymorphism is well known for small molecules and occurs in one in three compounds in the Cambridge Structural Database,21,22 it has only been identified for a handful of π-conjugated polymers.23–38 Presently there is no clear insight into the structural factors that cause polymorphism in small molecules or different semi-crystalline phases for a polymer.22 In a recent study it has been shown that in small π-conjugated molecules short intermolecular contacts stabilize the three-dimensional packing arrangement and prevent structural rearrangement to the enthalpically favored stabilized polymorph.39 With D-PDPP4T-HD as a start,20 it is therefore of interest to explore the underlying structural characteristics that cause polymorphism in these polymers.
 | ||
| Fig. 1 Structures of PDPP4T-HD polymers with different linear alkyl chains. | ||
As a first step to find structure–property relations for this multiphase behavior, we study four homologous PDPP4T-HD polymers with linear hexyl (H), nonyl (N), dodecyl (D), and pentadecyl (P) side chains on the DPP unit (Fig. 1) and investigate the effect of the length of the linear alkyl side chains on the formation of the semi-crystalline β1 and β2 phases. Of these four, D-PDPP4T-HD has been described previously,20 but we include its experimental data also in this study to enable a direct comparison. UV-vis-NIR absorption measurements show that the β2 phase can be formed for each of the four polymers. The formation of this additional phase is investigated by monitoring the growth kinetics in thin films from solution. A reduced growth rate of the β2 phase is found when the alkyl side chain length increases. Two-dimensional grazing-incidence wide-angle X-ray scattering (2D GIWAXS) indicates that there is a transition from an edge-on arrangement to a face-on orientation of polymer chains with increasing alkyl chain length. In agreement with our previous report,20 the π–π stacking distance (dπ) of the β2 phase is always smaller than for β1. The tighter packing results in an enhanced field-effect hole mobility and a distinct redshifted absorption and near infrared (NIR) emission. Bulk-heterojunction solar cells of the PDPP4T-HD polymers in which the polymer is present in the β1 or the β2 phase, exhibit different spectral contributions. The results indicate that the formation of both β1 and β2 is fairly straightforward for alkyl side chains of intermediate length (i.e. nonyl and dodecyl) but that for the hexyl or pentadecyl side chains it is more difficult to generate the β1 or β2 phase, respectively, because of too low or too high solubility.
Results and discussion
Polymer synthesis and physical properties
The synthesis and characterization of the polymers via Stille polymerization of 5,5′-bis(trimethylstannyl)-2,2′-bithiophene with the different 3,6-bis(5-bromo-4-(2-hexyldecyl)thiophen-2-yl)-2,5-dialkyl-2,5-dihydropyrrolo[3,4-c]pyrrole-1,4-diones is described in detail in the ESI.†![[thin space (1/6-em)]](https://www.rsc.org/images/entities/char_2009.gif) 19 The polymerization procedure affords virtually defect-free alternating DPP polymers.40,41 H-PDPP4T-HD with the short hexyl side chains is poorly soluble in chloroform (CF) and could only be isolated by extracting with hot 1,1,2,2-tetrachloroethane (TCE). Gel permeation chromatography (GPC) in o-dichlorobenzene (o-DCB) at 140 °C was used to estimate the molecular weights (Fig. S1, ESI†). The polymers possess an essentially unimodal molecular weight distribution, except for H-PDPP4T-HD which has a bi-modal distribution due to a small low-molecular weight fraction. Table 1 lists the number average molecular weights (Mn) and polydispersity index (Đ). The lower solubility of H-PDPP4T-HD limits its Mn to 20.2 kg mol−1 due to precipitation during the polymerization, affording the material as a fine dust after work-up. Nonyl and dodecyl side chains improve the solubility and Mn. For pentadecyl side chains the solubility increases but the Mn is reduced, which is an effect seen more often for long side chain DPP polymers.13
19 The polymerization procedure affords virtually defect-free alternating DPP polymers.40,41 H-PDPP4T-HD with the short hexyl side chains is poorly soluble in chloroform (CF) and could only be isolated by extracting with hot 1,1,2,2-tetrachloroethane (TCE). Gel permeation chromatography (GPC) in o-dichlorobenzene (o-DCB) at 140 °C was used to estimate the molecular weights (Fig. S1, ESI†). The polymers possess an essentially unimodal molecular weight distribution, except for H-PDPP4T-HD which has a bi-modal distribution due to a small low-molecular weight fraction. Table 1 lists the number average molecular weights (Mn) and polydispersity index (Đ). The lower solubility of H-PDPP4T-HD limits its Mn to 20.2 kg mol−1 due to precipitation during the polymerization, affording the material as a fine dust after work-up. Nonyl and dodecyl side chains improve the solubility and Mn. For pentadecyl side chains the solubility increases but the Mn is reduced, which is an effect seen more often for long side chain DPP polymers.13
The oxidation (Eox) and reduction (Ered) potentials of the PDPP4T-HD polymers were determined by square-wave voltammetry (SWV) on thin films on a Pt working electrode relative to ferrocene/ferrocenium (Fc/Fc+) (Table 1 and Fig. S2, ESI†).42 The redox potentials are virtually identical, except for H-PDPP4T-HD. The similarity is expected because the polymers share the same main chain. The small differences for H-PDPP4T-HD are possibly related to its stronger tendency to form the β2 phase, resulting in lower optical band gap (vide infra).
The thermal behavior was investigated by differential scanning calorimetry (DSC) on polymer samples obtained by precipitation from chloroform solution into methanol (Fig. S3, ESI†). The melting temperature extracted from the second scan decreases with increasing side chain length (Table 1).
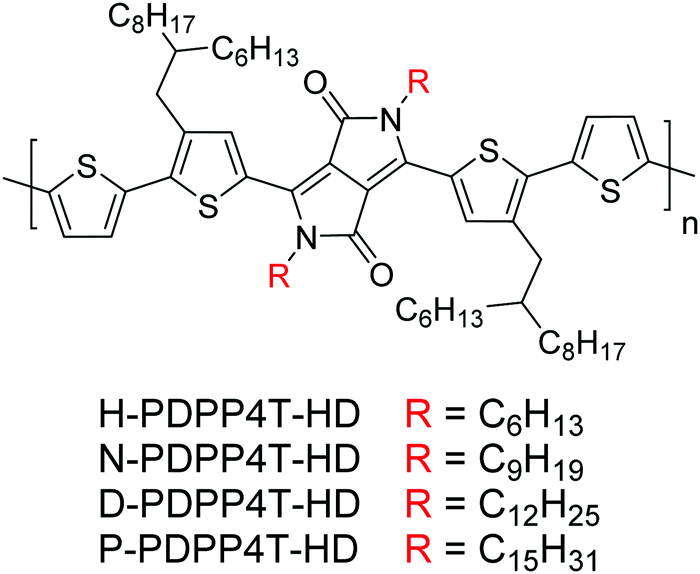
Effect of side chain on polymorphism in solution
Fig. 2 shows the UV-vis-NIR absorption spectra of the polymers in CF, in 1,2,4-trichlorobenzene (TCB), and in a 1:1 mixture of CF and TCB. Fig. S4 (ESI†) shows the UV-vis-NIR spectra for a range of CF/TCB solvent mixtures. For H-PDPP4T-HD, TCE was used instead of CF in which it is only sparingly soluble. In CF the longer alkyl side chain derivatives N-PDPP4T-HD, D-PDPP4T-HD, and P-PDPP4T-HD all show an absorption spectrum that maximizes at ∼760 nm accompanied by a less intense (0–1) vibronic band at ∼705 nm (black lines in Fig. 2). These are the spectral features commonly observed for aggregated DPP polymers.43 The higher intensity of the long-wavelength (0–0) peak compared to the (0–1) vibronic band suggests that the polymers form J-aggregates.44,45 A similar spectrum with a peak at 792 nm and shoulder at 729 nm, was recorded in CF for aggregated DT-PDPP4T, having branched 2′-decyltetradecyl (DT) side chains on DPP and an unsubstituted 4T moiety.46 We denote these aggregates as the β1 phase.
 | ||
| Fig. 2 UV-vis-NIR absorption spectra of PDPP4T-HD polymers in CF (or TCE) and TCB. (a) H-PDPP4T-HD. (b) N-PDPP4T-HD. (c) D-PDPP4T-HD. (d) P-PDPP4T-HD. | ||
When dissolved in TCB, the three longer alkyl side chain derivatives N-PDPP4T-HD, D-PDPP4T-HD, and P-PDPP4T-HD all show a new long-wavelength absorption that maximizes at ∼865 nm (Fig. 2, orange lines indicated with an arrow). This peak is not observed in the CF spectra. The intensity is stronger for N-PDPP4T-HD and D-PDPP4T-HD than for P-PDPP4T-HD. The spectra for CF/TCB (1:1) confirm that by gradually replacing CF by TCB the intensity of the peak at ∼760 nm steadily decreases, but without significantly affecting the peak at ∼705 nm. Fig. S4 (ESI†) shows that up to a CF/TCB ratio of 1:2, there is no signature of the additional ∼865 nm peak. This behavior is consistent with dissolution of the aggregated β1 phase upon addition of TCB leading to a more molecularly dissolved amorphous state,20 denoted as the α phase. The peak at ∼705 nm represents both the signal of the amorphous α phase and the (0–1) vibronic of the aggregated β1 phase.47 Only at high TCB content (CF/TCB ratios of 1:9 and 0:1) the extra absorption peak at ∼865 nm appears. We assign the peak at ∼865 nm to a second aggregated phase that we denote as β2.20 The fact that the characteristic peak positions of the β1 at ∼760 nm and of β2 at ∼865 nm do not shift gradually with changing the CF/TCB ratio and are virtually identical for the three longer alkyl side chain derivatives (N-PDPP4T-HD, D-PDPP4T-HD, and P-PDPP4T-HD) gives strong support to their assignment to different semi-crystalline aggregated phases, rather than being the result of a gradually changing chain conformation.
While the three longer alkyl side chain derivatives can be dissolved in CF, H-PDPP4T-HD with its shorter hexyl side chains has limited solubility in CF. TCE at 140 °C is necessary to dissolve H-PDPP4T-HD. In pure TCE, H-PDPP4T-HD shows a peak at 842 nm, indicating the presence of β2 phase (Fig. 2a), but also signals at 772 and 683 nm that can likely be associated with β1 and possibly α. In pure TCB the intensity of the aggregate peaks is significantly decreased (Fig. 2a), which indicates a transition towards the amorphous α phase. Nevertheless, in pure TCB, a small shoulder of β2 at ∼860 nm is visible.
Previously we have shown that it is possible to quantify the amount of α, β1 and β2 phase for D-PDPP4T-HD in CF/TCB solutions.20 For D-PDPP4T-HD there is always a mixture of the three phases except when the polymer is in pure CF (β1) or in pure TCB (β2). The β2 phase is the majority phase using CF/TCB ratios of 1:9 and 0:1.20 The UV-vis-NIR spectra in Fig. S4 for N-PDPP4T-HD are similar to those of D-PDPP4T-HD, while for P-PDPP4T-HD the fraction of β2 phase is less. H-PDPP4T-HD gives mainly β2 phase in TCE and α phase in TCB. Hence, despite its lower Mn, H-PDPP4T-HD is still capable of forming the aggregated β2 phase. At a higher Mn, similar to those of the other polymers, the solubility of H-PDPP4T-HD will be even less which would increase the tendency to aggregate. In brief, for the three longer alkyl chain polymers clear spectral signatures of two different aggregated phases, β1 and β2, can be identified that are formed in CF and TCB respectively. The β1 aggregates can be gradually transformed into β2 by adding TCB to CF. The transition seems to occur via an intermediate α phase in which the polymers are more molecularly dissolved.20 For P-PDPP4T-HD only a small fraction of β2 is formed in TCB, likely because the long pentadecyl chains provide higher solubility. For H-PDPP4T-HD, with the short hexyl chains, β2 is always formed and we have not been able to identify conditions in solution where only β1 is formed. Also for H-PDPP4T-HD addition of TCB partially dissolves the aggregated phase.
The photoluminescence (PL) spectra of the four PDPP4T-HD polymers in TCB (Fig. S5, ESI†) show that the β2 phase gives a distinct emission at ∼895 nm when nonyl or dodecyl side chains are present. For the hexyl and pentadecyl derivatives it is more difficult to identify the β2 emission in TCB, likely because of the small β2 concentration. In addition, depending on the solvent composition and length of the side chains, the PL spectra also show spectral features of the α phase at ∼730–750 nm and of the β1 phase at 815–830 nm (Fig. S5, ESI†).
Effect of side chain on polymorphism in solid state
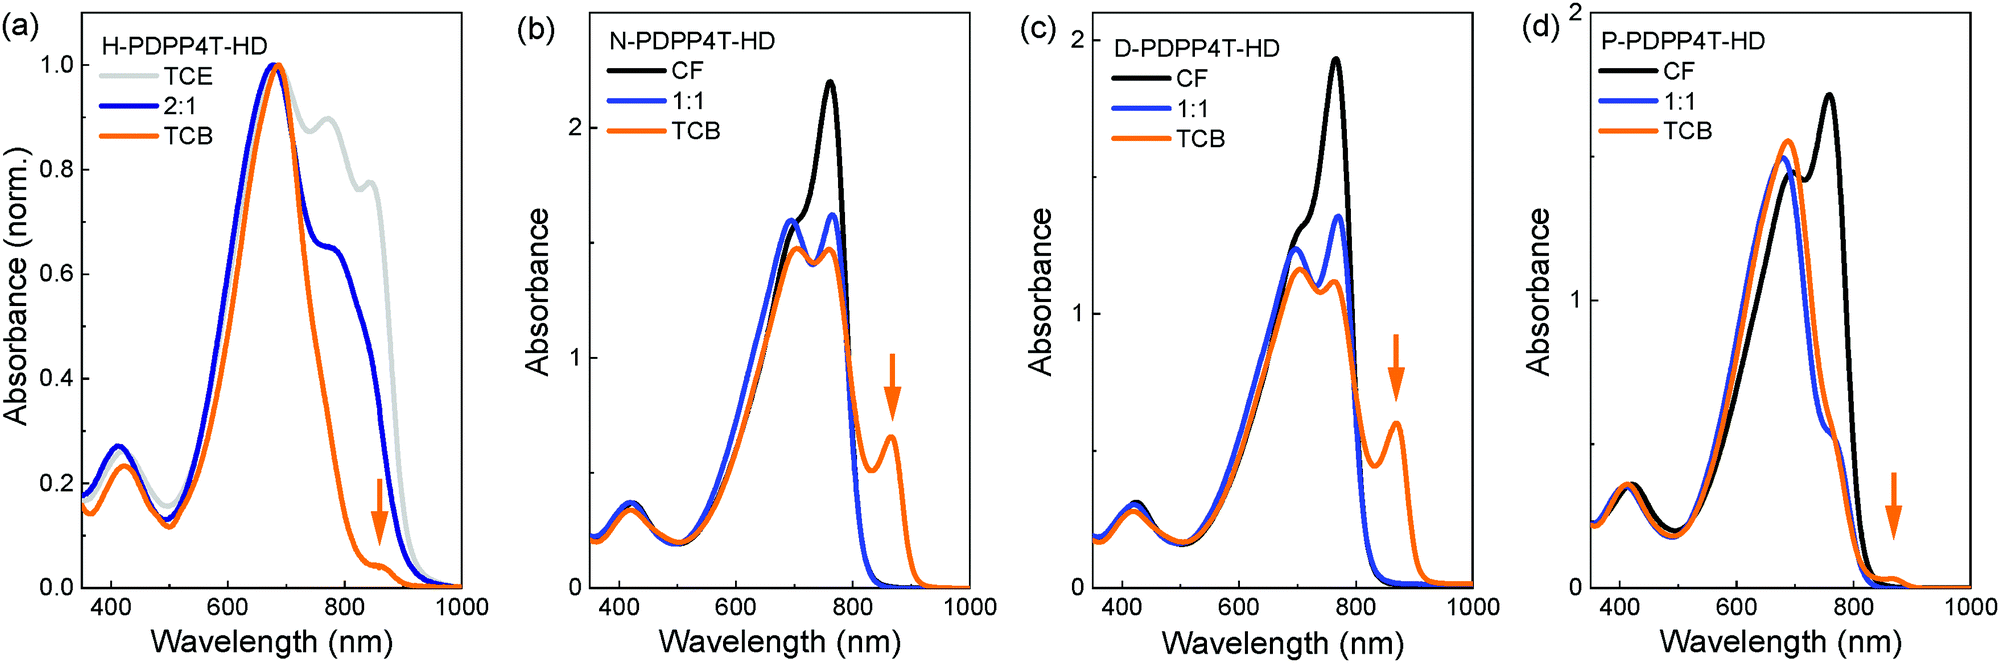
The optical properties in thin solid films of the four polymers were characterized by UV-vis-NIR and PL spectroscopy (Fig. 3). Uniform films were obtained for the three long chain derivatives by casting room-temperature solutions, but for H-PDPP4T-HD solutions at 140 °C were required. Irrespective of the solvent used, thin films of H-PDPP4T-HD always show a peak at ∼860 nm, characteristic of the β2 phase, independent of the presence of TCB. H-PDPP4T-HD films from TCE have a higher fraction of β2 phase than films from TCB. This is attributed to the fact that the TCB solution has the tendency to bring H-PDPP4T-HD to the amorphous α phase (Fig. 2a). In both cases the PL spectrum shows a (0–0) peak at 887 nm and a (1–0) vibronic at 995 nm that we attribute to emission from the β2 phase. | ||
| Fig. 3 (a–d) UV-vis-NIR absorption and (e–h) steady-state PL spectra of polymer thin films processed from CF (or TCE) and TCB. (a and e) H-PDPP4T-HD. (b and f) N-PDPP4T-HD. (c and g) D-PDPP4T-HD. (d and h) P-PDPP4T-HD. All thin films were spin coated onto glass substrates from 3 mg mL−1 solutions. Excitation wavelengths for PL are given in the legends. | ||
For N-PDPP4T-HD, D-PDPP4T-HD, and P-PDPP4T-HD the behavior is different. Films cast from CF show a (0–0) absorption peak at ∼765 nm accompanied by a (0–1) vibronic shoulder at ∼725 nm. These signals are assigned to the β1 phase. Compared to the β1 phase in CF solutions (Fig. 2), the peak maxima in films are at virtually the same wavelengths. This is expected when casting semi-crystalline aggregates from solutions into thin solid films.48 Layers cast from CF show no signals attributable to the β2 phase, but films cast from TCB show the characteristic β2 peak at ∼860 nm. Fig. S6 (ESI†) shows that small amounts of TCB in CF already result in a significant β2 formation. Likewise, for P-PDPP4T-HD, where only a minor amount of β2 is formed in solution, the β2 peak is dramatically enhanced in solid films. This effect is due to the large difference in the evaporation rates of CF (b.p. 61.2 °C, vapor pressure 2.1 × 10⁴ Pa at 25 °C) and TCB (b.p. 214.4 °C, vapor pressure 6.1 × 10³ Pa at 25 °C), which causes an enrichment in TCB during drying, such that in the last stages of drying only TCB is present. Importantly, there is no difference in the wavelengths of the β2 peaks recorded in TCB solutions and in films cast from TCB. This emphasizes that in solution and films the same semi-crystalline phases are present.
Summarizing, in solid state the three polymers with the longer alkyl side chains form predominantly β2 when TCB is present in the casting solvent for 10% or more. The hexyl derivative forms predominantly β2 when cast from TCE. Adding TCB induces more α phase for the H-PDPP4T-HD.
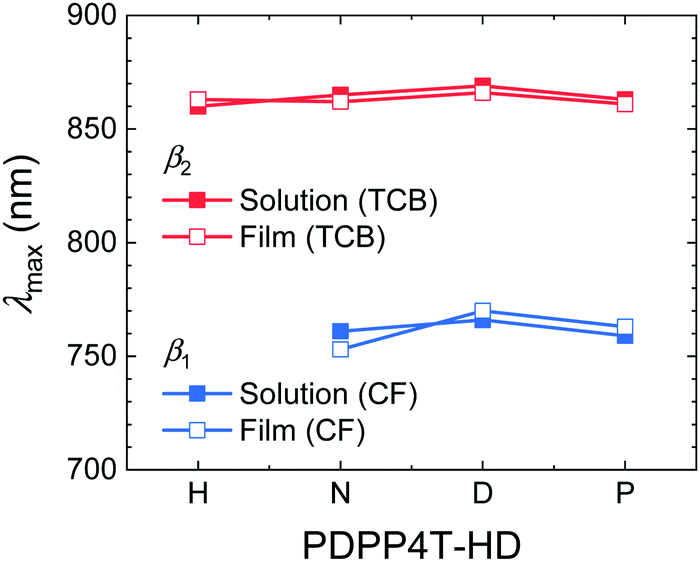
The wavelengths of maximum absorption (λmax) for the β1 and β2 phases of the PDPP4T-HD polymers (Fig. 4) confirm that they are virtually identical in solution and film and also largely independent of alkyl side chain length. Hence, the polymer main chains have a three-dimensional ordering in aggregated solutions and films that results in similar optical spectra. This evidences that the length of the linear alkyl chain on the DPP unit does not affect the main chain conformation or π–π stacking in either the β1 or β2 phases, because these are known to influence λmax. The redshifted absorption of β2 compared to β1 phase must find its origin in a closer π–π stacking (vide infra), a more planar main chain conformation, a different relative displacement of polymer main chains, or a combination of these effects. Single crystal studies have shown that for small DPP molecules, both linear and branched side chains on DPP give near coplanar arrangements with the neighboring thiophene rings.49–51 Because DT-PDPP4T with branched side chains also gives β1 aggregates (vide supra),46 it is probable that the main chain is essentially coplanar in both the β1 and β2 phases. For diketopyrrolopyrrole-co-thiophene and diketopyrrolopyrrole-co-thieno[3,2-b]thiophene molecules, linear hexyl (H) chains on DPP allow for a displacement of the molecules in the solid state along their molecular axis causing a partial overlap of electron-rich thiophene/thienothiophene with electron-poor DPP units in the solid state and a shorter π–π stacking distance, increasing the intermolecular electronic coupling and causing a redshifted absorption compared to derivatives with branched 2′-ethylhexyl (EH) side chains.52,53 While the occurrence of two aggregated phases, β1 and β2, can possibly be related to two metastable configurations for the displacement of polymer chains along their long axis, GIWAXS does not give evidence for it (vide infra).
 | ||
| Fig. 4 Plot of the signature peaks (λmax) of the β1 and β2 phase in solutions and thin films of the PDPP4T-HD polymers vs. the length of the side chain. | ||
Growth kinetics of the second semi-crystalline phase
To elucidate the kinetics of the development of the β2 phase during film formation, absorption spectra of wet films cast from pure TCB were recorded at different times after casting (Fig. 5). The low solubility prevented such study for H-PDPP4T-HD. For N-PDPP4T-HD, the relative absorbance of the β2 peak at t = 0 min is much more pronounced in the wet film (Fig. 5a) than in the solution spectrum (Fig. 2b) and reaches 83% of that of the dry film (dashed line), i.e., Asol/Afilm = 83%. The enhanced β2 fraction at higher polymer concentration (0.02 vs. 3 mg mL−1) supports its assignment to an aggregate phase. As TCB evaporates, the β2 fraction grows, reaching Asol/Afilm = 99% at t = 30 min. D-PDPP4T-HD exhibits a similar behavior (Fig. 5b). For P-PDPP4T-HD, on the contrary, Asol/Afilm is only ∼15% (Fig. 5c) at t = 0 min. The growth rate of the β2 phase is much slower for P-PDPP4T-HD than for the other two polymers. Only at t = 180 min, Asol/Afilm reaches 74%. Fig. 5d summarizes growth kinetics. The data indicate that the longer side chains of P-PDPP4T-HD reduce the rate of β2 phase formation in solution.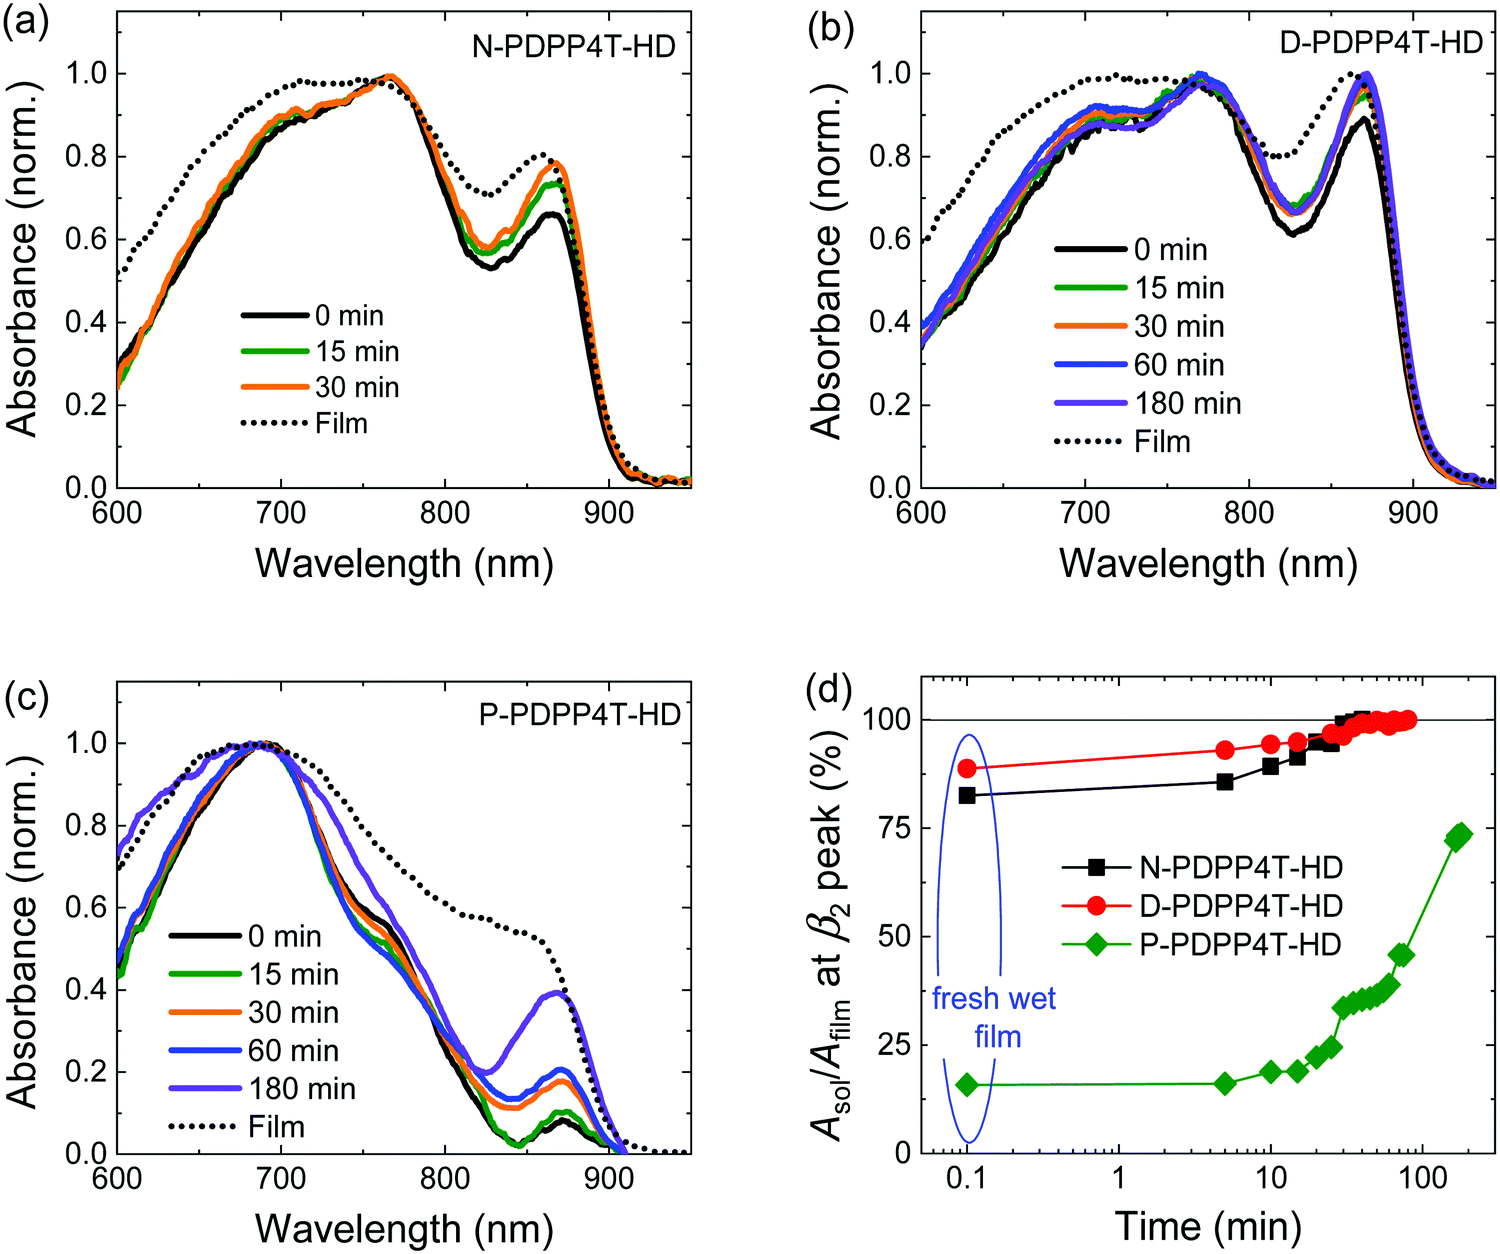 | ||
| Fig. 5 Evolution of the β2 phase in wet films during solvent evaporation for (a) N-PDPP4T-HD, (b) D-PDPP4T-HD, and (c) P-PDPP4T-HD. Wet films are processed from pure TCB solution with the polymer concentration of 3 mg mL−1, and corresponding dry films (dotted lines) are obtained after solvent evaporation for overnight. (d) Asol/Afilm at the β2 peak as a function of time. | ||
Thermal properties of polymorphs in solid state
The effect of temperature on the optical properties of thin polymer films was monitored through in situ UV-vis-NIR spectroscopy, with heating (5 °C min−1) and subsequent cooling (2 °C min−1) under a protective nitrogen atmosphere (Fig. S7 and S8, ESI†). For the films with the β1 phase the absorption spectra blue shift with a continuous decrease in peak intensity upon annealing. At 270 °C a single broad and structure-less absorption band centered around 645 nm remains (Fig. S7, ESI†), indicative of the amorphous α phase. Subsequent cooling to 25 °C gives a redshift, but the final room-temperature spectra remain blue-shifted compared to those of the initial solution-cast films. For polymer films prepared in the β2 phase, heating also forms the amorphous α phase. After cooling to room temperature there is no signature of the β2 phase in either of the four films (Fig. S8, ESI†). This strongly suggests that the β2 phase cannot be formed from the melt and that formation of the β2 phase requires aggregation in solution in the presence of TCB (Fig. 2 and 3).Structural characterization
To obtain information on crystal lattice parameters and preferential orientation of the β1 and β2 phases, 2D GIWAXS measurements were performed for spin-coated polymer films (Fig. 6 and Fig. S9, S10, ESI†). H-PDPP4T-HD films were spin coated from different TCE/TCB mixtures, while the three longer chain derivatives were deposited from CF/TCB mixtures.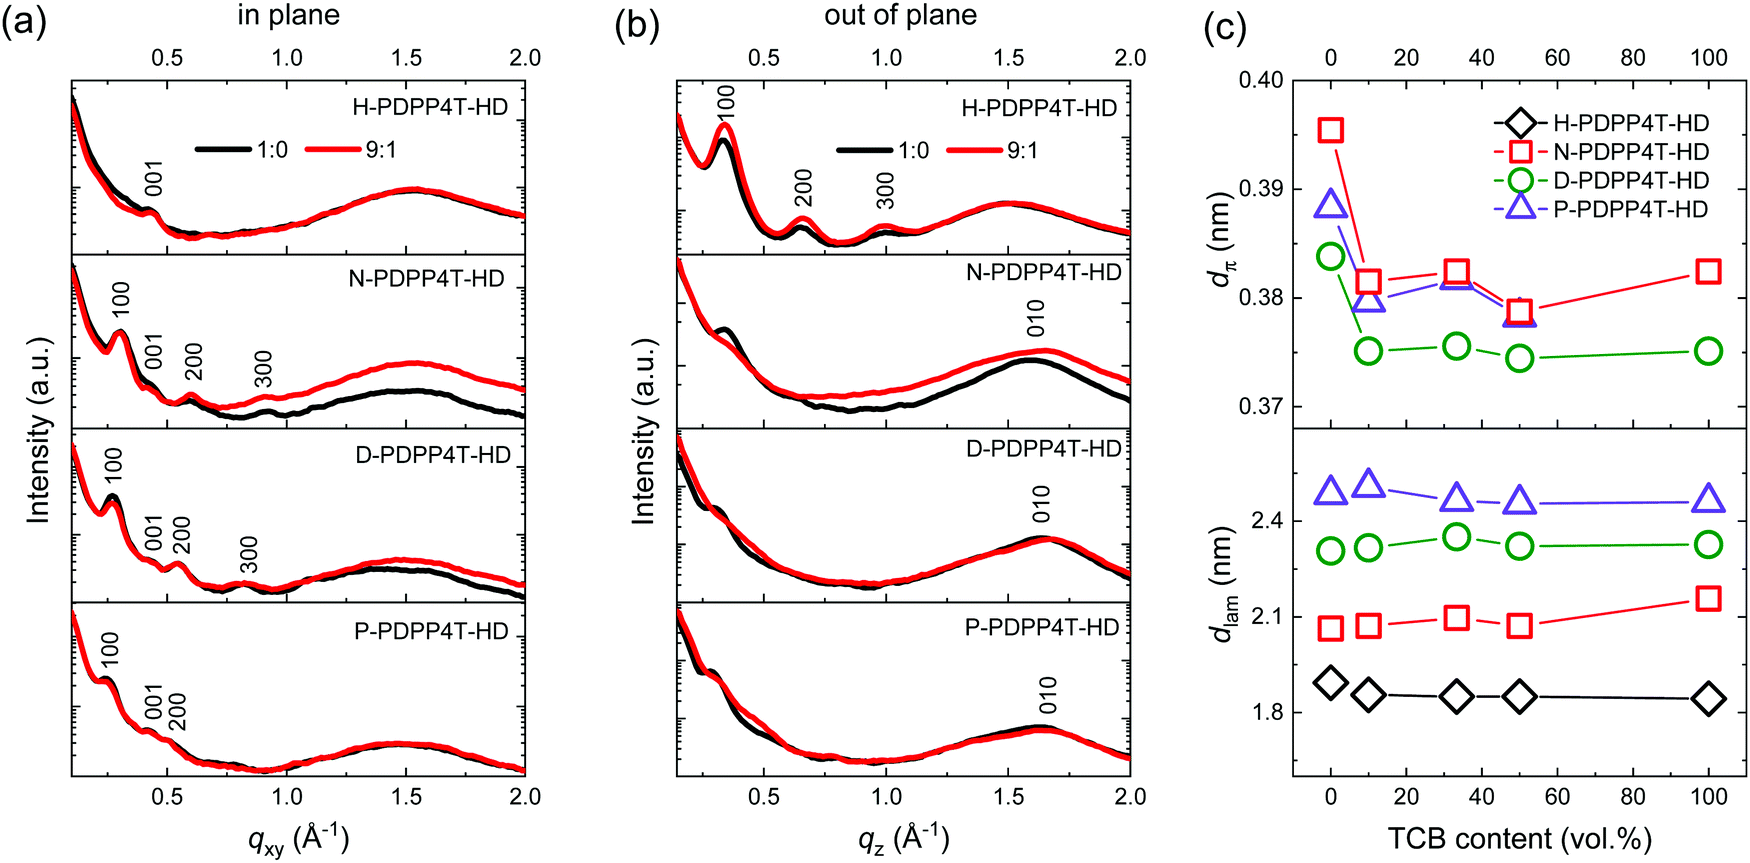 | ||
| Fig. 6 (a) In-plane and (b) out-of-plane GIWAXS profiles of PDPP4T-HD thin films spin coated from TCE/TCB mixtures for H-PDPP4T-HD and CF/TCB mixtures for N-PDPP4T-HD, D-PDPP4T-HD, and P-PDPP4T-HD. (c) Lamellar spacing (dlam) and π-stacking (dπ) distances as a function of TCB content. | ||
For H-PDPP4T-HD films intense (h00) peaks corresponding to lamellar stacking of polymer chains are present in the out-of-plane profiles, while these are virtually absent in the in-plane profiles (Fig. 6). This suggests an edge-on orientation for H-PDPP4T-HD polymer chains in which horizontal planes of conjugated chains are separated by alkyl side chains. For H-PDPP4T-HD a preferential π–π stacking orientation seems absent. The structure and orientation of H-PDPP4T-HD are independent of the TCB content in the spin-coating solution, consistent with the conclusion inferred from UV-vis-NIR (Fig. S5, ESI†) that the β2 phase is always formed, independent of the TCE/TCB ratio. It has been reported that weakly aggregated conjugated polymer chains prefer to lie flat (face-on) on the substrate to maximize the polymer–substrate interaction, while strong aggregation via π–π stacking results in a standing-up (edge-on) orientation.27,28 The preference of H-PDPP4T-HD chains for an edge-on orientation is in agreement with this observation, because its short hexyl chains result in diminished solubility and strong aggregation.
For the three longer alkyl chain PDPP4T-HD polymers, β1 phase films were generated from pure CF and β2 phase films from different CF/TCB mixtures. In the in-plane scattering profiles the β1 (CF/TCB 1:0) and β2 (CF/TCB 9:1) phases of N-PDPP4T-HD exhibit strong (100), (200), and (300) peaks (Fig. 6a). In the out-of-plane profiles, the (010) π–π stacking peak is present for the β1 and β2 phase, indicating that N-PDPP4T-HD chains are oriented in a face-on fashion (Fig. 6b). The face-on orientation, where the side chains are essentially in the plane of the film, is supported by the low intensity of the (h00) lamellar stacking peaks in the out-of-plane direction, especially for the β2 phase while for the β1 phase only weak (100) peaks are detected. Quantitative analysis reveals that the (010) peak is slightly shifted between the β1 and β2 phases. This indicates a different π–π stacking distance (dπ) for β1 (0.395 nm) and β2 (0.381 nm). There is no difference in dlam between the two phases (Fig. 6c). Using more than 10% TCB in the CF/TCB mixture used for spin coating leaves dπ and dlam virtually unchanged. This is consistent with the UV-vis-NIR absorption spectra (Fig. S6, ESI†) that show that only small amounts of TCB in CF already cause β2 phase formation.
Similar to N-PDPP4T-HD, also films of D-PDPP4T-HD and P-PDPP4T-HD have a face-on orientation, featuring pronounced (h00) peaks in the in-plane direction and considerable (010) peaks in the out-of-plane direction (Fig. 6a and b). Also for these two polymers the π–π stacking distance in the β2 phase is smaller than in the β1 phase (Fig. 6c). Note that in pure TCB the (010) reflection of P-PDPP4T-HD is absent, consistent with the weaker absorbance of the β2 peak in the thin films for pure TCB than for CF/TCB mixtures (Fig. S6d, ESI†). This observation implies that CF still plays a certain role in the self-assembly of P-PDPP4T-HD.54–57
As expected, the length of linear alkyl chains is reflected in dlam, which increases from 1.9 to 2.5 nm with side chain length from hexyl to pentadecyl (Fig. 6c). In all cases also (001) reflections are visible at around qxy = 0.43 Å−1 for both the β1 and β2 phase, that we tentatively associate with a periodicity of 1.4–1.5 nm along the backbone direction. We note, however, that this distance is shorter than the ∼2.0 nm expected for a linear DPP-4T repeat unit.
In conclusion, the only structural difference between the β1 and β2 phases that can be clearly identified is a small, but distinct difference in the π–π stacking distance. The lamellar spacing and periodicity along the main chain are similar in the two phases. The different optical band gap of the two phases is therefore most likely the consequence of the different π–π stacking distance.
Impact of polymorphism in transistors
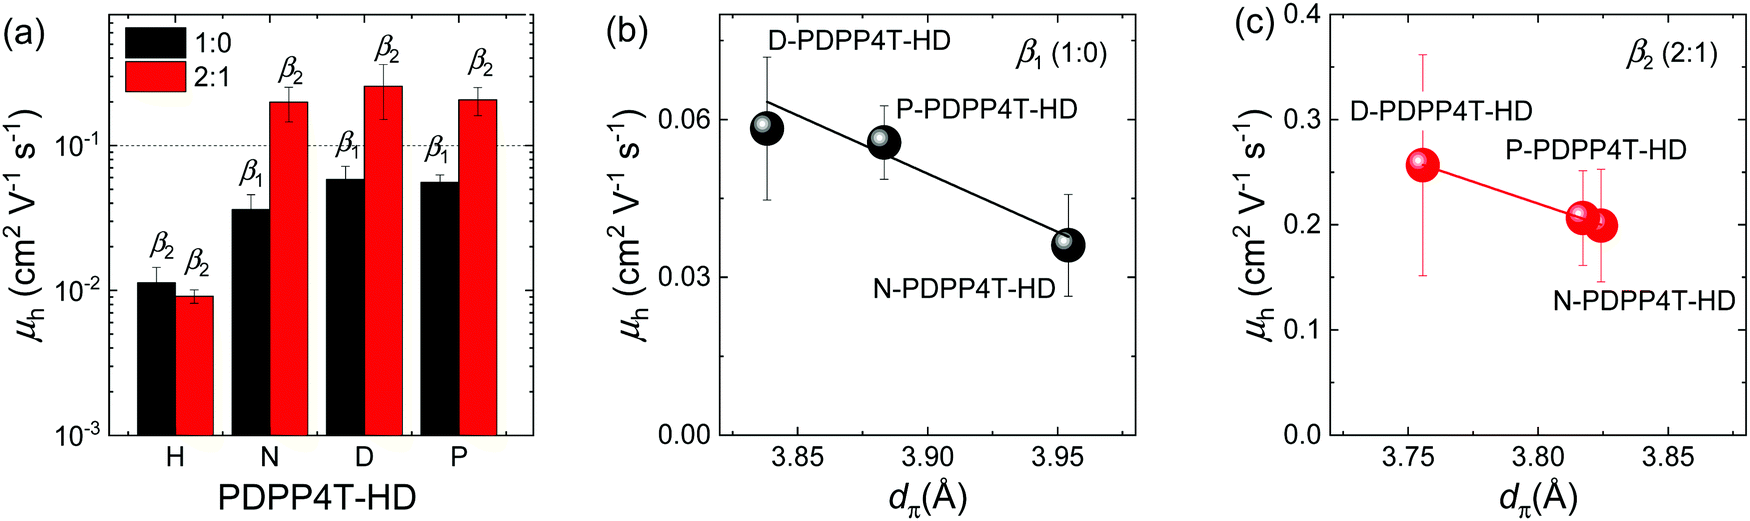
To study the effect of the presence of β1 or β2 phase on charge transport, field-effect transistors with a bottom-contact top-gate architecture were fabricated. The corresponding transfer characteristics are shown in Fig. S11 (ESI†). Because of its limited solubility, H-PDPP4T-HD was spin coated from TCE/TCB solutions at 140 °C in ratios of 1:0 and 2:1 onto room-temperature substrates. In both cases the β2 phase is formed and the resultant saturated field-effect hole mobility (μh) is on the order of 0.01 cm2 V−1 s−1 (Fig. 7a and Table 2). The other three PDPP4T-HD polymers were spin coated from CF/TCB mixtures in 1:0 and 2:1 ratios at room temperature to create β1 and β2 phases, respectively. Fig. 7a and Table 2 show that for these three polymers the hole mobility is on the order of 0.2 cm2 V−1 s−1 in the β2 phase and consistently a factor of about 4 less in the β1 phase. Also the on/off ratio of transistors with β2 phase is almost one order of magnitude higher than that of β1. The increased hole mobility of β2 is attributed to the closer π–π stacking of the β2 phase, which improves interchain hopping of charge carriers.58 Because the π–π stacking distance is virtually independent of the CF/TCB ratio in the range between 9:1 and 0:1 (Fig. 6c), we expect that the mobility only weakly depends on the CF:TCB ratio in this range. This is confirmed by experiments on D-PDPP4T-HD for three different CF/TCB ratios.20 Mobilities higher than 0.1 cm2 V−1 s−1 for the three longer alkyl chain polymers are in the higher range compared to many DPP materials,2 but less than record values of >1 cm2 V−1 s−1 reported in carefully optimized devices of DPP polymers.6,59 The one-order of magnitude lower μh for the β2 phase of H-PDPP4T-HD is attributed to grain boundaries caused by its reduced solubility. The influence of dπ on average field-effect mobility measured for the three long alkyl chain PDPP4T-HD polymers is shown in Fig. 7b and c. The results suggest that in the β1 and β2 phases μh is correlated with dπ.
 | ||
| Fig. 7 (a) Field-effect mobility (μh) as a function of the length of the linear alkyl chain. The average value and standard deviations are obtained from 6 devices. (b and c) Dependence of μh on dπ. The solid lines are the corresponding linear fits. | ||
| Polymer | Solvent mixture | Solvent ratio | |
|---|---|---|---|
| 1:0a |
2:1a |
||
| a The average value and standard deviations are obtained from 6 devices. | |||
| H-PDPP4T-HD | TCE/TCB | 0.011 ± 0.003 | 0.009 ± 0.001 |
| N-PDPP4T-HD | CF/TCB | 0.036 ± 0.009 | 0.20 ± 0.05 |
| D-PDPP4T-HD | CF/TCB | 0.058 ± 0.014 | 0.26 ± 0.11 |
| P-PDPP4T-HD | CF/TCB | 0.056 ± 0.007 | 0.21 ± 0.05 |
Impact of polymorphism in photovoltaics
The polymers were used as the donor in bulk-heterojunction organic photovoltaic (OPV) cells with [6,6]-phenyl-C71-butyric acid methyl ester ([70]PCBM) as acceptor employing an ITO/PEDOT:PSS/PDPP4T-HD:[70]PCBM/LiF/Al device configuration. The presence of [70]PCBM necessities the use of different processing conditions to create blends in which the polymers are intimately mixed with [70]PCBM and have either the β1 or β2 phase. The reason is that fast evaporation (from e.g. CF, or hot TCE) gives spinodal decomposition during drying, resulting in a very coarse phase separation and poor performance.60 This can be alleviated by ensuring that the polymer aggregates before spinodal decomposition occurs. The common way is to use a high-boiling co-solvent in which the polymer is less soluble.60 For DPP polymers diphenyl ether (DPE) has been found to be very effective for this purpose.61,62 The most relevant photovoltaic parameters are summarized in Table 3. The current–density (J–V) characteristics recorded under simulated AM1.5G (100 mW cm−2) illumination and the external quantum efficiency (EQE) spectra for blends in which either the β1 or the β2 phase dominates are shown in Fig. 8.| Side chain | Co-solvent | V oc (V) | FF | J sc (mA cm−2) | PCEd (%) | EQE of β2e |
|---|---|---|---|---|---|---|
| a TCE as main solvent. b CF as main solvent. c Determined by integrating the EQE spectrum with AM 1.5G spectrum. d Maximum PCE between parenthesis. e EQE at 860 nm. | ||||||
| H a | 2% DPE hot | 0.70 ± 0.00 | 0.61 ± 0.01 | 9.96 ± 0.24 | 4.26 ± 0.11 (4.38) | 0.04 |
| 8% TCB cold | 0.63 ± 0.00 | 0.58 ± 0.01 | 9.63 ± 1.21 | 3.51 ± 0.40 (4.08) | 0.28 | |
| N b | 2% DPE | 0.63 ± 0.00 | 0.61 ± 0.01 | 16.12 ± 0.08 | 6.19 ± 0.08 (6.25) | 0.20 |
| 8% TCB | 0.62 ± 0.00 | 0.60 ± 0.01 | 16.20 ± 0.11 | 6.01 ± 0.16 (6.15) | 0.40 | |
| D b | 2% DPE | 0.62 ± 0.00 | 0.66 ± 0.00 | 14.49 ± 0.35 | 5.98 ± 0.20 (6.27) | 0.25 |
| 8% TCB | 0.62 ± 0.00 | 0.66 ± 0.02 | 15.05 ± 0.46 | 6.18 ± 0.10 (6.35) | 0.41 | |
| P b | 2% DPE | 0.61 ± 0.00 | 0.63 ± 0.01 | 12.43 ± 0.22 | 4.77 ± 0.21 (5.01) | 0.16 |
| 6% TCB | 0.63 ± 0.00 | 0.66 ± 0.02 | 10.68 ± 0.22 | 4.44 ± 0.07 (4.48) | 0.22 | |
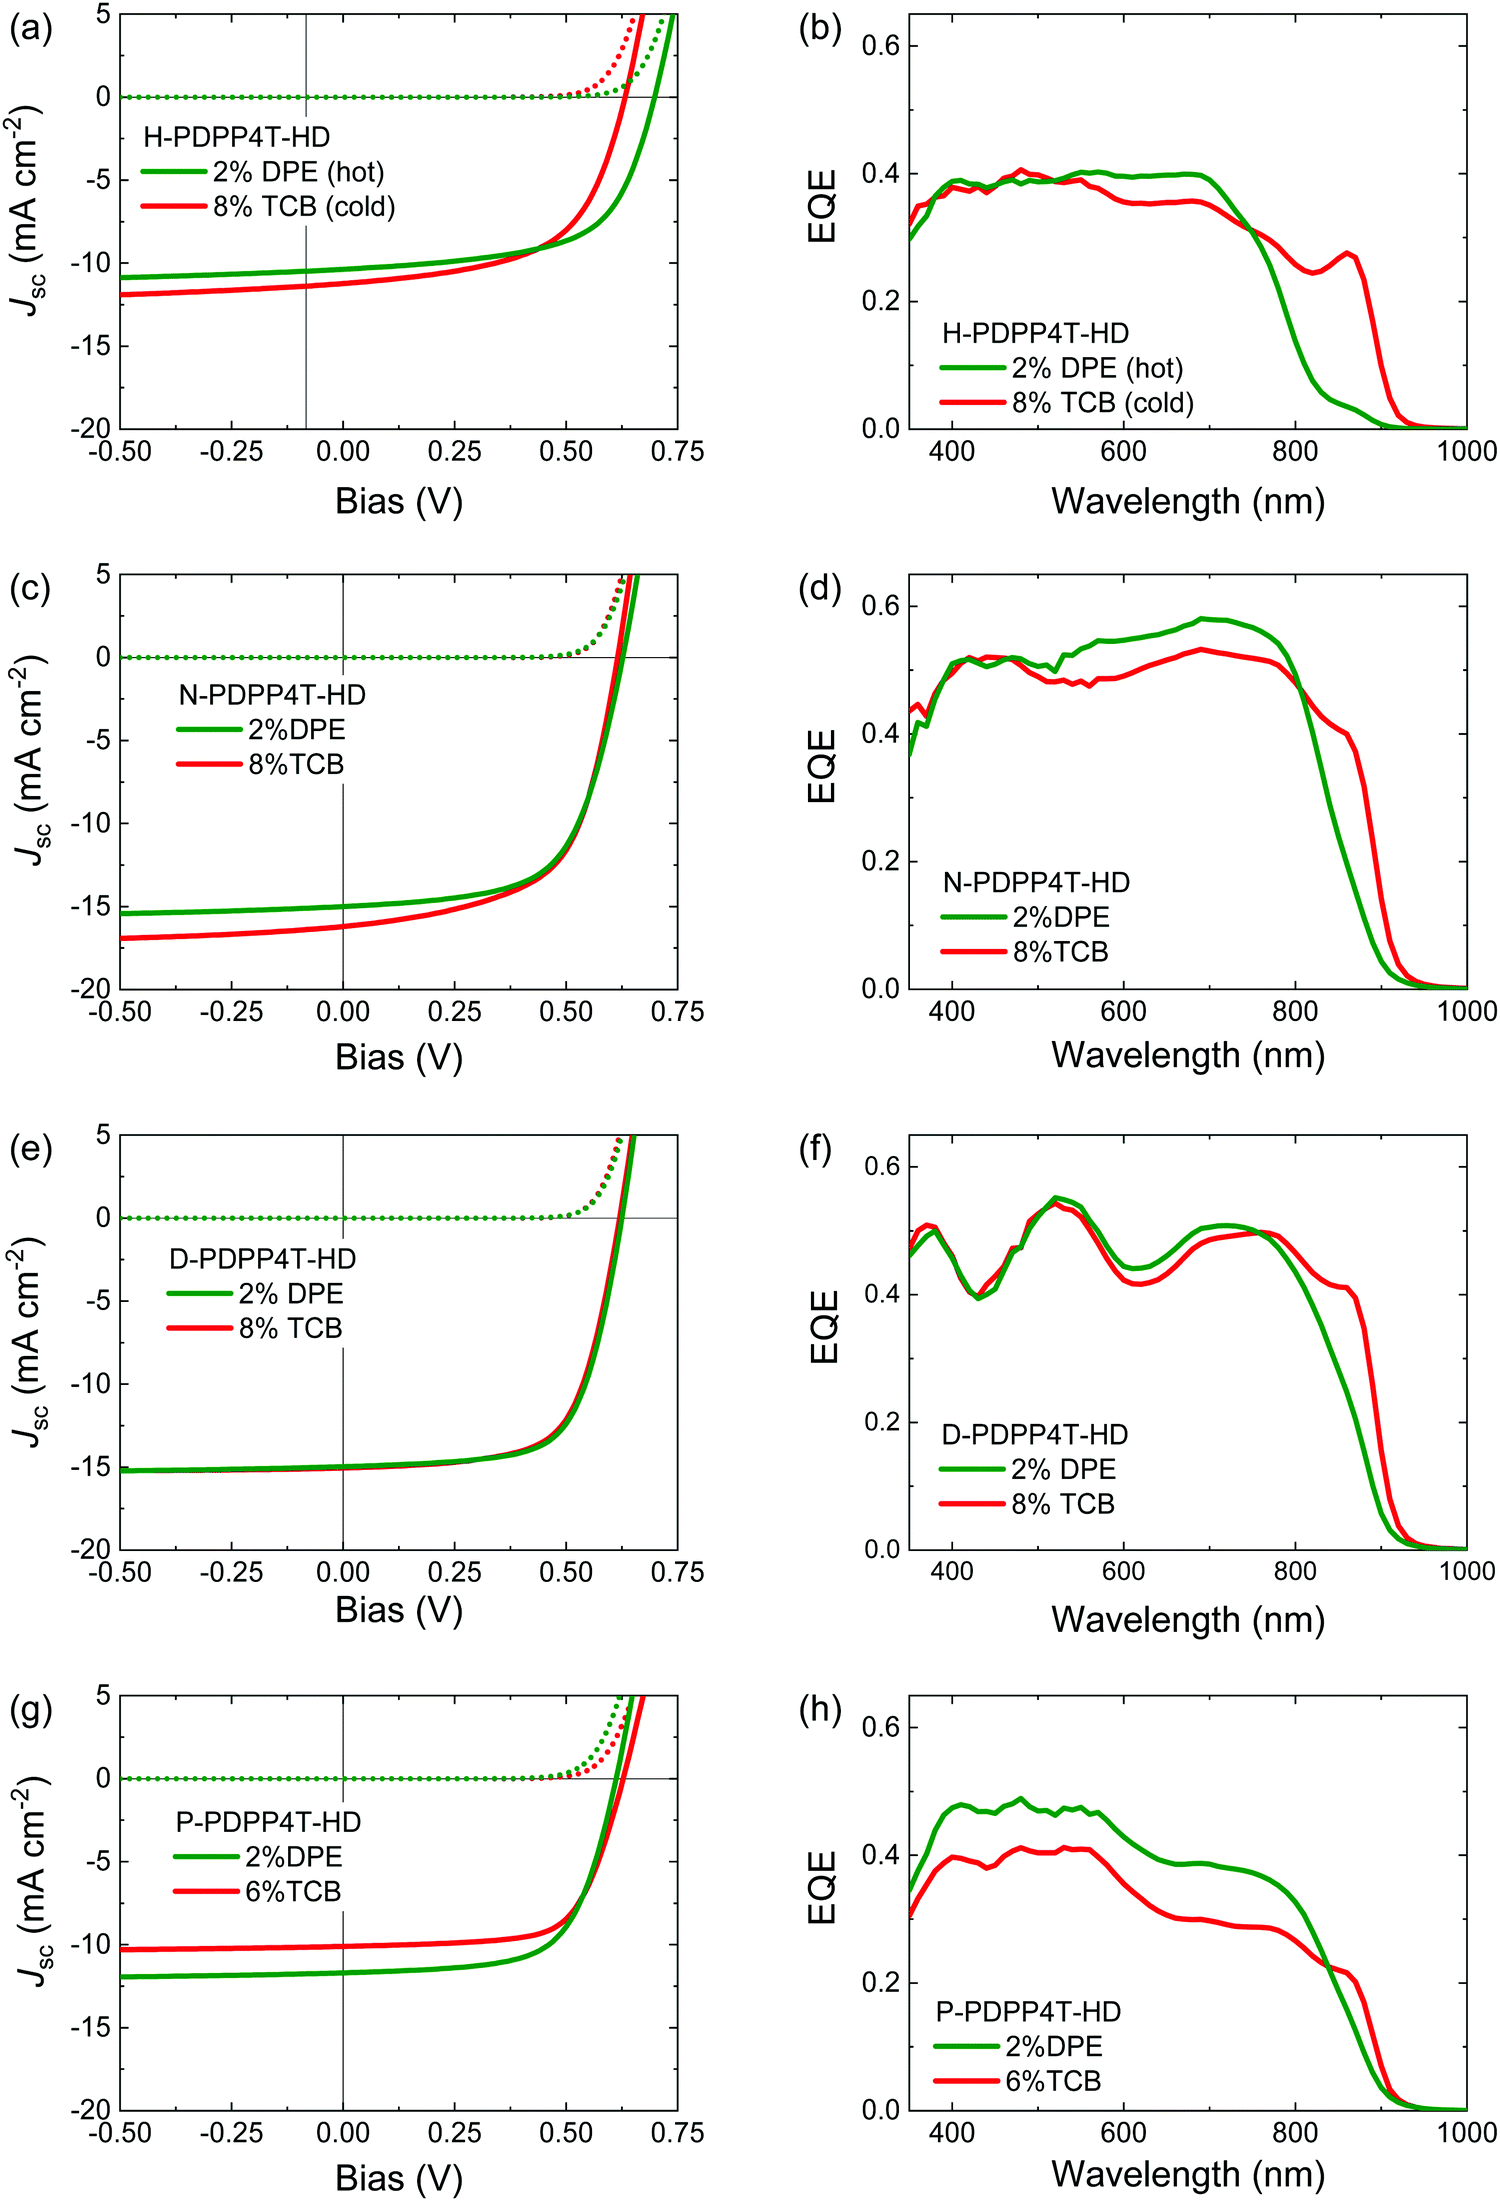 | ||
| Fig. 8 PDPP4T-HD:[70]PCBM solar cells. (a, c, e and g) Current–density (J–V) characteristics recorded under simulated AM1.5G (100 mW cm−2) illumination (solid lines) and in the dark (dashed lines). (b, d, f and h) EQE spectra. H-PDPP4T-HD was processed from TCE, the other three polymers from CF. The co-solvents used are indicated in the legends. (a and b) H-PDPP4T-HD. (c and d) N-PDPP4T-HD. (e and f) D-PDPP4T-HD. (g and h) P-PDPP4T-HD. | ||
Blend films of H-PDPP4T-HD with [70]PCBM were cast from TCE as the main solvent. Spin coating 140 °C TCE solutions with 2% DPE onto substrates preheated at 140 °C, afforded a blend with mainly β1 phase. In contrast, processing from 140 °C TCE containing 8% TCB onto room-temperature substrates significantly enhanced the fraction of β2 phase in the films as evidenced from the increased EQE at 860 nm (Fig. 8b). Blends of the longer linear alkyl chain polymers with [70]PCBM were processed with CF as main solvent at room temperature. For these three polymers the use of 2% DPE as co-solvent afforded blends that have a relatively small contribution of the β2 phase to the EQE. When 8% TCB is used as co-solvent, the contribution of the β2 phase to the EQE is clearly higher (Fig. 8d, f and h).
The EQE spectra show that 2% DPE as co-solvent seems to generate some β2 phase in the PDPP4T-HD:[70]PCBM blends for all four polymers as evidenced from an EQE contribution at ∼860 nm. For the three long alkyl side chain PDPP4T-HD derivatives, the falling edge of the absorption spectrum at the long wavelength in thin films cast from CF/DPE is slightly redshifted compared to films cast from pure CF (Fig. S12, ESI†), but the spectra do not show a clear peak of the β2 phase. This suggests that [70]PCBM has a role in the formation of the β2 phase in blend films.
Fig. 8 and Table 3 show that by using appropriate processing conditions, it is possible to generate a distinct contribution of the β2 phase to the photocurrent at ∼860 nm for each of the four polymers. The power conversion efficiency (PCE) of the blends, however, is not very different for films containing the β2 phase compared to films where the β1 phase dominates. Moreover, outside the region of β2 absorption the absolute value of the EQE seems more dependent on the specific polymer than on the presence or absence of β2 phase. It is well known that EQE and Jsc strongly depend on the morphology of the photoactive layers. Fig. 9 shows transmission electron microcopy (TEM) images of the blends. The TEM images show lighter fibrillar structures that are associated with aggregated PDPP4T-HD polymer chains, while darker regions are rich in [70]PCBM. We have previously established that the width of the polymer fibrils is very important for the photovoltaic performance, with narrower fibers giving rise to an increased EQE as a consequence of improved charge generation.13,46,61 Some crucial observations can be made in Fig. 9. First, the fibrillar structure is very similar for each individual polymer for a blend containing the β1 phase (processed with DPE as co-solvent) and blend where the β2 phase is predominant (processed with TCB as co-solvent). If anything, the fibril width seems smaller for CF/DPE films than for the CF/TCB films. On the other hand, differences are much larger between the different polymers. The fibrils are clearly wider for P-PDPP4T-HD than for N-PDPP4T-HD or D-PDPP4T-HD and the EQE of P-PDPP4T-HD is concomitantly reduced. This wider fibrils are in agreement with a previous study in which longer alkyl chain DPP polymers provided wider fibrils.13 This width of the semi-crystalline polymer fibers has been explained using a nucleation-and-growth model in which it is determined by the nucleation induced by the polymer solubility where stable nuclei of more soluble polymers have a larger critical size.61Fig. 9 shows that this trend is fully met by N-PDPP4T-HD, D-PDPP4T-HD, and P-PDPP4T-HD where longer side chains and a better co-solvent (TCB instead of DPE) cause wider fibrils. The fact that also for the least soluble polymer, H-PDPP4T-HD, the fibrils are wider (Fig. 9) and the EQE is lower (Fig. 8) than for N-PDPP4T-HD or D-PDPP4T-HD seems at first glance at variance with the solubility-related morphology, but we note that the H-PDPP4T-HD:[70]PCBM are cast from 140 °C TCE solutions and not from room-temperature CF. The high temperature, increases the solubility which enhances the critical nucleus size.
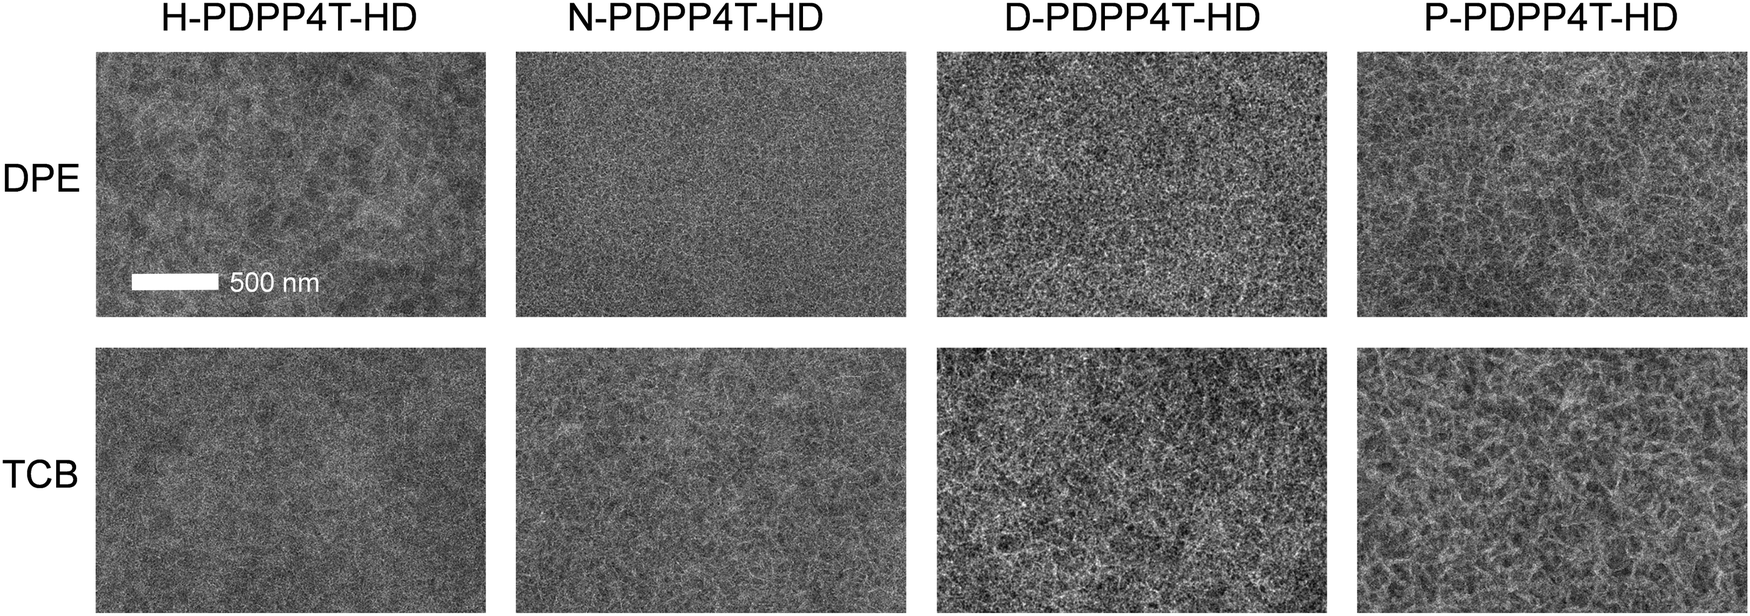 | ||
| Fig. 9 TEM images of PDPP4T-HD:[70]PCBM blends in which mainly the β1 phase is present (processed with DPE as co-solvent) and blends where the β2 phase is predominant (processed with TCB as co-solvent). The blends of H-PDPP4T-HD are processed from 140 °C TCE as main solvent, while the N-PDPP4T-HD, D-PDPP4T-HD, and P-PDPP4T-HD blends were cast from room-temperature CF. | ||
Structural characteristics that give rise to polymorphism in conjugated polymers
An important question to address is which structural characteristics give rise to polymorphism and what are the actual structural differences. Polymorphism has so far been identified in a handful of conjugated polymers, but there is little structural similarity among these materials. E.g. in P3HT,25 the two polymorphs differ in the packing of the side chains, end-to-end vs. interdigitated. In P(NDI2OD-T2) segregated and mixed interchain stacking result in two distinct polymorphs.28 In the present PDPP4T-HD polymers, the difference is in the π–π stacking distance.To our knowledge polymorphism has not been identified for DPP polymers with 2′-branched side chains on the DPP unit. Preliminary work in our lab has only identified one other material (D-PDPP3T-EH) that exhibits similar polymorphism to the PDPP4T-HD polymers described here, but at the same time established that it does not occur for D-PDPP4T-EH or H-PDPP3T-HD that are structurally similar. This demonstrates that neither the 4T unit, nor the HD side chains on the adjacent thiophenes, nor a linear side chain on the DPP unit itself are able to induce the β2 phase, but that it is a subtle combination of these structural characteristics. Tentatively, we propose that polymorphism can occur for DPP-nT polymers, irrespective of n being even or odd, when a linear alkyl side chain is present on the DPP unit, and a 2′-branched side chain is on the adjacent thiophenes, provided that the solubility is neither too high (as in H-PDPP3T-HD) nor too low (as in D-PDPP4T-EH). The role of a balanced solubility as a prerequisite for polymorphism is in accordance with the results presented in this paper on N-PDPP4T-HD and D-PDPP4T-HD that can give both β1 and β2 phases, while H-PDPP4T-HD and P-PDPP4T-HD prefer β2 and β1, respectively. It might be that this balance can be changed when studying different molecular weight samples of one and the same polymer.
Conclusion
We have obtained insight in the effect of the linear alkyl chain length on the preferred formation of semi-crystalline β1 and β2 phases of PDPP4T-HD polymers. These β1 and β2 phases differ by an additional long wavelength optical absorption and a smaller π–π stacking distance for the β2 phase compared to β1.20 For four PDPP4T-HD polymers with hexyl, nonyl, dodecyl or pentadecyl side chains, TCB as spin-coating solvent is capable of forming the β2 phase in the solid state, as inferred from absorption, photoluminescence, and GIWAXS. Exclusive β1 phase formation has only been achieved for the three longer alkyl (nonyl, dodecyl and pentadecyl) PDPP4T-HD derivatives by casting films from CF. In contrast, for short (hexyl) side chains some β2 is always present in thin films. The short hexyl side chains clearly favor β2, while kinetic studies showed that long pentadecyl side chains reduce the growth of β2. As a result, formation of both β1 and β2 is readily achieved for nonyl and dodecyl side chains, but for hexyl or pentadecyl side chains β2 and β1 phases prevail respectively. A too low solubility thus favors β2 and too high solubility β1. As expected, increasing the length of the linear alkyl chains increases the lamellar stacking distance of the polymers in thin films, but also causes an orientational transition from edge-on to face-on. By controlling the β1 and β2 phase formation via processing condition, they also affect the performance of opto-electronic devices. Thin film transistors with β2 phase show a factor of four enhanced hole mobility and in solar cells a significant contribution of the β2 phase to the EQE has been identified.The study has provided first steps towards developing structure–property guidelines for controllable polymorphism in conjugated polymers. We find that polymorphism requires a subtle balance of different structural characteristics and is not determined by a single structural feature. For PDPP4T-HD polymers forming both β1 and β2 is fairly straightforward using alkyl side chains of intermediate length (i.e. nonyl and dodecyl) but hexyl or pentadecyl side chains generate the β2 or β1 phase predominantly, because of a reduced or increased solubility respectively.
Conflicts of interest
There are no conflicts to declare.Acknowledgements
Authors acknowledge Dr Junyu Li at DSM DMSC R&D Solutions for the GIWAXS measurements and discussion. The research has received funding from the Netherlands Organisation for Scientific Research (016.Veni.192.106) and the NWO Spinoza prize awarded to R. A. J. Janssen. We further acknowledge funding from the Ministry of Education, Culture and Science (Gravity program 024.001.035).References
- S. Qu and H. Tian, Chem. Commun., 2012, 48, 3039–3051 RSC.
- C. B. Nielsen, M. Turbiez and I. McCulloch, Adv. Mater., 2013, 25, 1859–1880 CrossRef CAS PubMed.
- Y. Li, P. Sonar, L. Murphy and W. Hong, Energy Environ. Sci., 2013, 6, 1684–1710 RSC.
- Z. Yi, S. Wang and Y. Liu, Adv. Mater., 2015, 27, 3589–3606 CrossRef CAS PubMed.
- W. Li, K. H. Hendriks, M. M. Wienk and R. A. J. Janssen, Acc. Chem. Res., 2016, 49, 78–85 CrossRef CAS PubMed.
- Q. Liu, S. E. Bottle and P. Sonar, Adv. Mater., 2019, 1903882 Search PubMed.
- T. Lei, J.-H. Dou and J. Pei, Adv. Mater., 2012, 24, 6457–6461 CrossRef CAS PubMed.
- T. Lei, J.-Y. Wang and J. Pei, Chem. Mater., 2014, 26, 594–603 CrossRef CAS.
- O. Ostroverkhova, Chem. Rev., 2016, 116, 13279–13412 CrossRef CAS PubMed.
- Z.-G. Zhang and Y. Li, Sci. China: Chem., 2015, 58, 192–209 CrossRef CAS.
- M. Li, C. An, W. Pisula and K. Müllen, Acc. Chem. Res., 2018, 51, 1196–1205 Search PubMed.
- J. Y. Back, H. Yu, I. Song, I. Kang, H. Ahn, T. J. Shin, S.-K. Kwon, J. H. Oh and Y.-H. Kim, Chem. Mater., 2015, 27, 1732–1739 CrossRef CAS.
- W. Li, K. H. Hendriks, A. Furlan, W. S. C. Roelofs, M. M. Wienk and R. A. J. Janssen, Adv. Mater., 2014, 26, 1565–1570 CrossRef CAS PubMed.
- Z. Wang, Z. Liu, L. Ning, M. Xiao, Y. Yi, Z. Cai, A. Sadhanala, G. Zhang, W. Chen, H. Sirringhaus and D. Zhang, Chem. Mater., 2018, 30, 3090–3100 CrossRef CAS.
- M. S. Chen, O. P. Lee, J. R. Niskala, A. T. Yiu, C. J. Tassone, K. Schmidt, P. M. Beaujuge, S. S. Onishi, M. F. Toney, A. Zettl and J. M. J. Fréchet, J. Am. Chem. Soc., 2013, 135, 19229–19236 CrossRef CAS PubMed.
- J. Ma, Z. Liu, Z. Wang, Y. Yang, G. Zhang, X. Zhang and D. Zhang, Mater. Chem. Front., 2017, 1, 2547–2553 RSC.
- T. Lei, Y.-C. Lai, G. Hong, H. Wang, P. Hayoz, R. T. Weitz, C. Chen, H. Dai and Z. Bao, Small, 2015, 11, 2946–2954 CrossRef CAS PubMed.
- A. T. Yiu, P. M. Beaujuge, O. P. Lee, C. H. Woo, M. F. Toney and J. M. J. Fréchet, J. Am. Chem. Soc., 2012, 134, 2180–2185 CrossRef CAS PubMed.
- G. H. L. Heintges, P. J. Leenaers and R. A. J. Janssen, J. Mater. Chem. A, 2017, 5, 13748–13756 RSC.
- M. Li, A. H. Balawi, P. J. Leenaers, L. Ning, G. H. L. Heintges, T. Marszalek, W. Pisula, M. M. Wienk, S. C. J. Meskers, Y. Yi, F. Laquai and R. A. J. Janssen, Nat. Commun., 2019, 10, 2867 CrossRef PubMed.
- T. L. Threlfall, Analyst, 1995, 120, 2435–2460 RSC.
- A. J. Cruz-Cabeza, S. M. Reutzel-Edens and J. Bernstein, Chem. Soc. Rev., 2015, 44, 8619–8635 RSC.
- T. J. Prosa, M. J. Winokur and R. D. McCullough, Macromolecules, 1996, 29, 3654–3656 CrossRef CAS.
- S. V. Meille, V. Romita, T. Caronna, A. J. Lovinger, M. Catellani and L. Belobrzeckaja, Macromolecules, 1997, 30, 7898–7905 CrossRef CAS.
- G. H. Lu, L. G. Li and X. N. Yang, Adv. Mater., 2007, 19, 3594–3598 CrossRef CAS.
- G. Lu, L. Li and X. Yang, Macromolecules, 2008, 41, 2062–2070 CrossRef CAS.
- Y. Yuan, J. Zhang, J. Sun, J. Hu, T. Zhang and Y. Duan, Macromolecules, 2011, 44, 9341–9350 CrossRef CAS.
- M. Brinkmann, E. Gonthier, S. Bogen, K. Tremel, S. Ludwigs, M. Hufnagel and M. Sommer, ACS Nano, 2012, 6, 10319–10326 CrossRef CAS PubMed.
- R. Steyrleuthner, M. Schubert, I. Howard, B. Klaumünzer, K. Schilling, Z. Chen, P. Saalfrank, F. Laquai, A. Facchetti and D. Neher, J. Am. Chem. Soc., 2012, 134, 18303–18317 CrossRef CAS PubMed.
- C. Poelking and D. Andrienko, Macromolecules, 2013, 46, 8941–8956 CrossRef CAS.
- K. Tremel, F. S. U. Fischer, N. Kayunkid, R. Di Pietro, R. Tkachov, A. Kiriy, D. Neher, S. Ludwigs and M. Brinkmann, Adv. Energy Mater., 2014, 4, 1301659 CrossRef.
- F. S. U. Fischer, D. Trefz, J. Back, N. Kayunkid, B. Tornow, S. Albrecht, K. G. Yager, G. Singh, A. Karim, D. Neher, M. Brinkmann and S. Ludwigs, Adv. Mater., 2014, 27, 1223–1228 CrossRef PubMed.
- Y. Guo, L. Wang, Y. Han, Y. Geng and Z. Su, Polym. Chem., 2014, 5, 1938–1944 RSC.
- C.-F. Huang, J.-Y. Chang, S.-H. Huang, K.-Y. Wu, J.-F. Jheng, W.-T. Chuang, C.-S. Hsu and C.-L. Wang, J. Mater. Chem. A, 2015, 3, 3968–3974 RSC.
- F. Panzer, M. Sommer, H. Bässler, M. Thelakkat and A. Köhler, Macromolecules, 2015, 48, 1543–1553 CrossRef CAS.
- F. S. U. Fischer, N. Kayunkid, D. Trefz, S. Ludwigs and M. Brinkmann, Macromolecules, 2015, 48, 3974–3982 CrossRef CAS.
- G. L. Schulz, F. S. U. Fischer, D. Trefz, A. Melnyk, A. Hamidi-Sakr, M. Brinkmann, D. Andrienko and S. Ludwigs, Macromolecules, 2017, 50, 1402–1414 CrossRef CAS.
- Y. Zhong, L. Biniek, N. Leclerc, S. Ferry and M. Brinkmann, Macromolecules, 2018, 51, 4238–4249 CrossRef CAS.
- G. E. Purdum, N. G. Telesz, K. Jarolimek, S. M. Ryno, T. Gessner, N. C. Davy, A. J. Petty, Y. Zhen, Y. Shu, A. Facchetti, G. E. Collis, W. Hu, C. Wu, J. E. Anthony, R. T. Weitz, C. Risko and Y.-L. Loo, J. Am. Chem. Soc., 2018, 140, 7519–7525 CrossRef CAS PubMed.
- K. H. Hendriks, W. Li, G. H. L. Heintges, G. W. P. van Pruissen, M. M. Wienk and R. A. J. Janssen, J. Am. Chem. Soc., 2014, 136, 11128–11133 CrossRef CAS PubMed.
- G. H. L. Heintges and R. A. J. Janssen, RSC Adv., 2019, 9, 15703–15714 RSC.
- R. E. M. Willems, C. H. L. Weijtens, X. de Vries, R. Coehoorn and R. A. J. Janssen, Adv. Energy Mater., 2019, 9, 1803677 CrossRef.
- L. Chen, H. Wang, J. Liu, R. Xing, X. Yu and Y. Han, J. Polym. Sci., Part B: Polym. Lett., 2016, 54, 838–847 CrossRef CAS.
- F. C. Spano, Acc. Chem. Res., 2010, 43, 429–439 CrossRef CAS PubMed.
- M. Kirkus, L. Wang, S. Mothy, D. Beljonne, J. Cornil, R. A. J. Janssen and S. C. J. Meskers, J. Phys. Chem. A, 2012, 116, 7927–7936 CrossRef CAS PubMed.
- W. Li, K. H. Hendriks, A. Furlan, W. S. C. Roelofs, M. M. Wienk and R. A. J. Janssen, J. Am. Chem. Soc., 2013, 135, 18942–18948 CrossRef CAS PubMed.
- Y. Zhou, C. X. Guzman, L. C. Helguero-Kelley, C. Liu, S. R. Peurifoy, B. Captain and A. B. Braunschweig, J. Phys. Org. Chem., 2016, 29, 689–699 CrossRef CAS.
- M. Böckmann, T. Schemme, D. H. de Jong, C. Denz, A. Heuer and N. L. Doltsinis, Phys. Chem. Chem. Phys., 2015, 17, 28616–28625 RSC.
- J. Liu, B. Walker, A. Tamayo, Y. Zhang and T.-Q. Nguyen, Adv. Funct. Mater., 2013, 23, 47–56 CrossRef CAS.
- J. Dhar, N. Venkatramaiah, A. Anitha and S. Patil, J. Mater. Chem. C, 2014, 2, 3457–3466 RSC.
- P. E. Hartnett, E. A. Margulies, C. M. Mauck, S. A. Miller, Y. Wu, Y.-L. Wu, T. J. Marks and M. R. Wasielewski, J. Phys. Chem. B, 2016, 120, 1357–1366 CrossRef CAS PubMed.
- C. M. Mauck, P. E. Hartnett, E. A. Margulies, L. Ma, C. E. Miller, G. C. Schatz, T. J. Marks and M. R. Wasielewski, J. Am. Chem. Soc., 2016, 138, 11749–11761 CrossRef CAS PubMed.
- N. Genevaz, P. Chávez, V. Untilova, A. Boeglin, C. Bailly, L. Karmazin and L. Biniek, J. Mater. Chem. C, 2018, 6, 9140–9151 RSC.
- Y. Lu, Z.-D. Yu, R.-Z. Zhang, Z.-F. Yao, H.-Y. You, L. Jiang, H.-I. Un, B.-W. Dong, M. Xiong, J.-Y. Wang and J. Pei, Angew. Chem., Int. Ed., 2019, 58, 11390–11394 CrossRef CAS PubMed.
- Y. Lu, J.-Y. Wang and J. Pei, Chem. Mater., 2019, 31, 6412–6423 CrossRef CAS.
- Y.-Q. Zheng, Z.-F. Yao, T. Lei, J.-H. Dou, C.-Y. Yang, L. Zou, X. Meng, W. Ma, J.-Y. Wang and J. Pei, Adv. Mater., 2017, 29, 1701072 CrossRef PubMed.
- Z.-F. Yao, Y.-Q. Zheng, Q.-Y. Li, T. Lei, S. Zhang, L. Zou, H.-Y. Liu, J.-H. Dou, Y. Lu, J.-Y. Wang, X. Gu and J. Pei, Adv. Mater., 2019, 31, 1806747 Search PubMed.
- V. Coropceanu, J. Cornil, D. A. da Silva Filho, Y. Olivier, R. Silbey and J.-L. Brédas, Chem. Rev., 2007, 107, 926–952 CrossRef CAS PubMed.
- M. Gruber, S.-H. Jung, S. Schott, D. Venkateshvaran, A. J. Kronemeijer, J. W. Andreasen, C. R. McNeill, W. W. H. Wong, M. Shahid, M. Heeney, J.-K. Lee and H. Sirringhaus, Chem. Sci., 2015, 6, 6949–6960 RSC.
- J. J. van Franeker, M. Turbiez, W. Li, M. M. Wienk and R. A. J. Janssen, Nat. Commun., 2015, 6, 6229 CrossRef CAS PubMed.
- J. J. van Franeker, G. H. L. Heintges, C. Schaefer, G. Portale, W. Li, M. M. Wienk, P. van der Schoot and R. A. J. Janssen, J. Am. Chem. Soc., 2015, 137, 11783–11794 CrossRef CAS PubMed.
- M. Li, D. Di Carlo Rasi, F. J. M. Colberts, J. Wang, G. H. L. Heintges, B. Lin, W. Li, W. Ma, M. M. Wienk and R. A. J. Janssen, Adv. Energy Mater., 2018, 8, 1800550 CrossRef.
Footnotes |
| † Electronic supplementary information (ESI) available. See DOI: 10.1039/d0tc00172d |
| ‡ M. Li and P. J. Leenaers contributed equally to the work. |
| This journal is © The Royal Society of Chemistry 2020 |