
Band gap of reduced graphene oxide tuned by controlling functional groups
Yiqian
Jin
,
Yiteng
Zheng
,
Simon G.
Podkolzin
 * and
Woo
Lee
*
* and
Woo
Lee
*
Department of Chemical Engineering and Materials Science, Stevens Institute of Technology, Hoboken, New Jersey 07030, USA. E-mail: Simon.Podkolzin@Stevens.edu; wlee@stevens.edu
First published on 3rd March 2020
Abstract
Reduced graphene oxide (rGO) is a material with a unique set of electrical and physical properties. The potential of rGO for numerous semiconductor applications, however, has not been fully realized because the dependence of its band gap on the chemical structure and, specifically, on the presence of terminal functional groups has not been systematically studied and, as a result, there are no efficient methods for tuning the band gap. Here we report that the band gap of rGO can be increased and, importantly, tuned from 0.264 to 0.786 eV by controlling the surface concentration of epoxide groups using a developed mild oxidation treatment with nitric acid, HNO3. Increasing the concentration of an HNO3 treatment solution gradually increases the surface concentration of epoxides without introducing microscopic defects or d-spacing changes and, thus, produces functionalized rGO materials with desirable properties for semiconductor applications. A combination of experimental measurements using infrared spectroscopy, ultraviolet-visible spectroscopy, X-ray diffraction, X-ray photoelectron spectroscopy, scanning electron microscopy and density functional theory calculations demonstrates that epoxides are unique among oxygen-containing functional groups for allowing to tune the band gap. Unlike epoxides, other oxygen-containing functional groups are not effective: hydroxyls do not change the band gap, while carbonyls and carboxyls break the hexagonal carbon-ring structure of rGO.
1. Introduction
Graphene is a monolayer of carbon atoms tightly packed into a two-dimensional lattice of hexagonal rings. Graphene has received significant attention for its unique electronic and mechanical properties since its first fabrication from graphite by mechanical exfoliation.1–4 In addition, the special chemical and physical properties of graphene make it useful for a variety of applications, including energy storage devices,5–7 memory devices,8–10 biosensors11–13 and transparent conducting electrodes.14–17 However, since pristine graphene has no band gap, its applications in electronic and optoelectronic devices, such as field effect transistors and solar cells, necessitate both opening and controlling its band gap.18,19 Therefore, significant efforts have been made to develop facile methods for achieving this goal.20,21 For example, Zhang et al. experimentally demonstrated a band gap of up to 0.25 eV using a bilayer graphene.22 Chang et al. reported a band gap increase from 0 to 0.60 eV by doping graphene with B and N atoms.23 Huang et al. theoretically predicted a band gap increase from 0.11 to 3.0 eV by gradually and partially converting graphene into graphene oxide (GO) due to oxygen incorporation into graphene from 6.25 to 50%.24GO is a chemically oxidized form of graphene, containing both aromatic rings (sp2 carbon) and C atoms with single bonds (sp3 carbon).25,26 It also contains multiple oxygen-containing functional groups in its basal planes and edges. Possible functional groups include hydroxyls, epoxides, carbonyls and carboxyls. Due to their high concentration, these functional groups break the symmetry of the material and, thus, make GO electrically insulating, with a band gap of up to 3.6 eV.27–29 By thermal, chemical or photothermal reduction, GO can be converted to reduced graphene oxide (rGO).30–33 Although some of the functional groups can be retained, rGO becomes semiconductive due to its restored planar structure.34 The carrier (electron and hole) mobility in rGO can be higher than 100 cm2 V−1 s−1 due to 2D delocalization of electrons.35–37 This mobility is two orders of magnitude higher than that of typical organic semiconductors (<1 cm2 V−1 s−1). Despite the low cost and flexibility of organic semiconductors, their use is limited because of their low electrical carrier mobility and high band gap, from 2.5 to 4.0 eV.38,39
The electrical conductivity of rGO is likely to be simultaneously controlled by two mechanisms: (1) variable-range-hopping (VRH) of charge carriers between rGO layers and (2) Arrhenius conduction within an rGO layer. Based on the VRH model, the thermally activated interlayer hopping of carriers depends on the average distance between rGO layers, i.e., d-spacing.40–43 An increased d-spacing is expected to result in a lower carrier mobility. As an example, our previous study demonstrates that after absorbing moisture from air, the conductivity of rGO significantly decreased due to the swelling effect of water on the d-spacing.44 Based on the Arrhenius conduction model, carriers require thermal activation to move across an rGO layer.45–47 As an example, we previously found that the conduction behavior of rGO was strongly dependent on temperature.48–50
Previous studies provided some information on dependencies between the structure of rGO and its band gap and, significantly, established the potential of rGO as a semiconducting material.30,31,51 For example, Velasco-Soto et al. reported a decrease of the optical band gap from 2.7 to 1.15 eV after chemically reducing GO to rGO using NH4OH.52 However, effects of functional groups on the band gap structure of rGO have not been systematically studied, thus hindering the development of methods for tuning the band gap of rGO for numerous electronic applications.
In this work, this challenge was addressed by systematically studying effects of oxygen-containing functional groups. Dependencies of the rGO molecular structure and its band gap on the concentration of hydroxyl, epoxide, carbonyl and carboxyl groups were determined. The results demonstrate that the band gap can be controlled by changing the concentration of epoxide groups on the rGO surface. A simple and efficient method with a mild HNO3 oxidation treatment was developed that allows the concentration of epoxides to be adjusted and, thus, the rGO band gap to be tuned.
2. Materials and methods
2a. Materials
A high-purity aqueous solution of GO (2 mg mL−1, purity >99%, Cheap Tubes) was used. The thickness of individual GO layers was from 0.7 to 1.2 nm with a diameter of 300 to 800 nm. Glass slides (25 × 75 mm, Thomas Scientific) were used as substrates to prepare rGO in the form of a thin film for electrical resistance measurements. The Si wafers (0.005 Ω cm−1) used for scanning electron microscopy (SEM) and X-ray photoelectron spectroscopy (XPS) were purchased from Fisher Scientific. The quartz slides (Chemglass – CGQ-0640-03 – 25 × 25 mm) used for ultraviolet-visible (UV-vis) spectroscopy were purchased from Neobits. HNO3 (68–70%, ACS reagent) was purchased from Sigma-Aldrich. The silver ink (Metalon JS-B40G) used for electrical resistance measurements was provided by NovaCentrix.2b. Preparation of inkjet-printed and HNO3-treated rGO films
As illustrated in Fig. 1a, rGO films were fabricated by inkjet-printing the GO solution onto substrates, and were subsequently thermally reduced using the previously established procedures.53 Briefly, substrates were rinsed prior to printing with deionized water and isopropyl alcohol and treated with oxygen plasma for 10 min using a plasma cleaner (Harrick Plasma) to make the substrate surface hydrophilic. The GO solution was printed using a Dimatrix FujiFilm inkjet printer (DMP-2831). This printer was equipped with a printhead configuration consisting of 16 microfabricated piezoelectric nozzles, with each nozzle being programmable and addressable with 20 μm positioning resolution. Printhead height and substrate temperature were maintained at 0.5 mm and 25 °C, respectively. After inkjet printing, the GO samples were reduced at 220 °C for 6 h to convert them into rGO.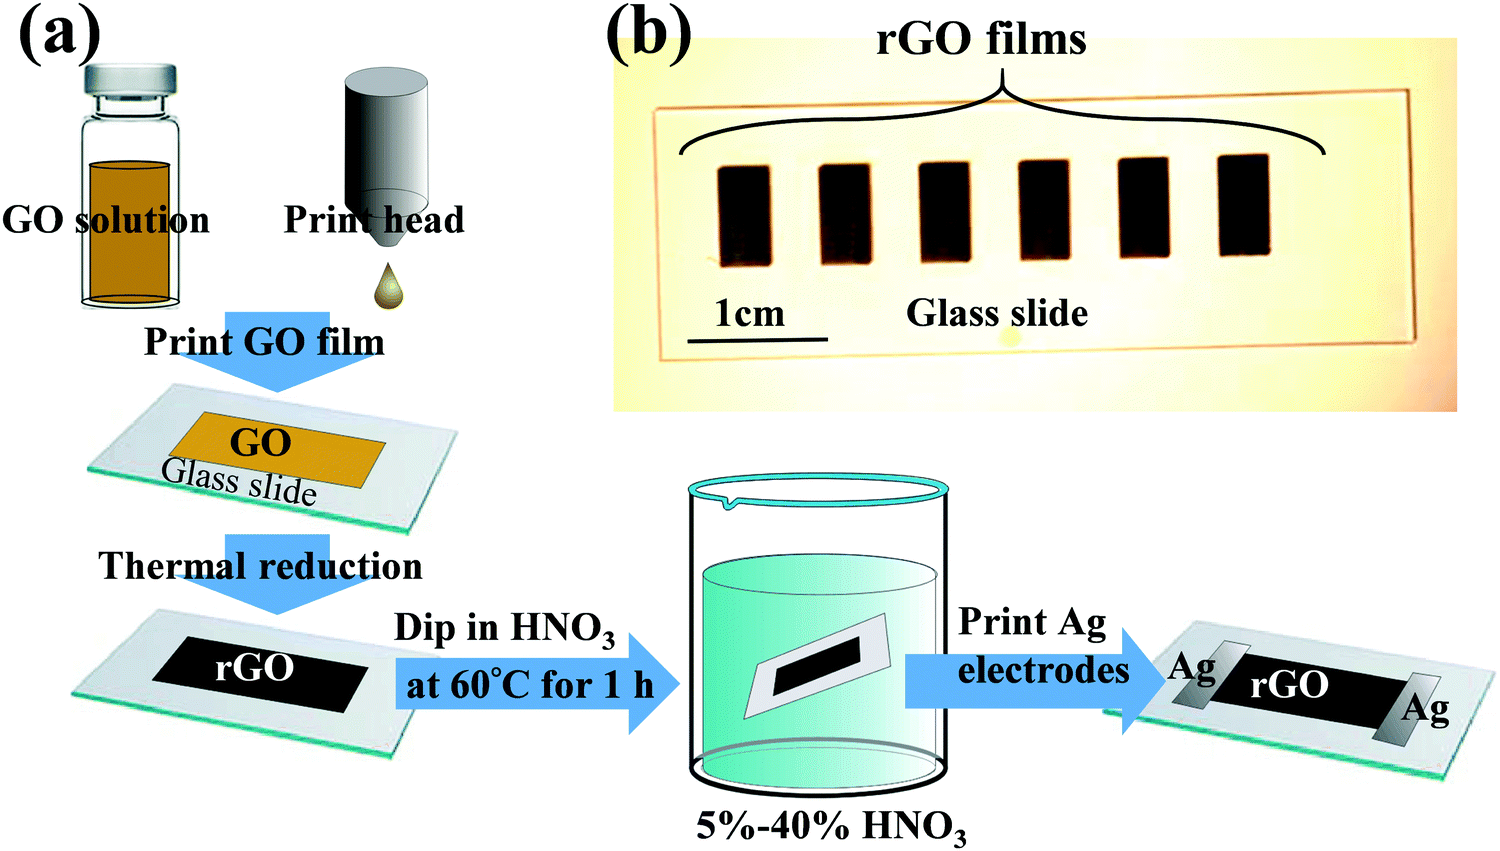 | ||
| Fig. 1 (a) Illustration of experimental procedures to fabricate inkjet-printed and HNO3-treated rGO films and (b) optical image of rGO films. | ||
The rGO films were treated by dipping them into an HNO3 bath at 60 °C for 1 h. The HNO3 concentration was varied from 5 to 40% HNO3. The obtained HNO3-treated rGO (“HNO3rGO”) materials were denoted based on the acid solution concentration as HNO35%rGO, HNO310%rGO, HNO320%rGO, HNO330%rGO and HNO340%rGO. Subsequently, the rGO samples were rinsed with deionized water and dried in air at ambient conditions for 24 h and then thermally annealed at 70 °C for 4 h. A schematic of rGO films on a glass slide is shown in Fig. 1b, and SEM images are shown in Fig. 2. The silver electrodes were directly inkjet-printed on the rGO films for electrical measurements and thermally annealed at 70 °C for 6 h.
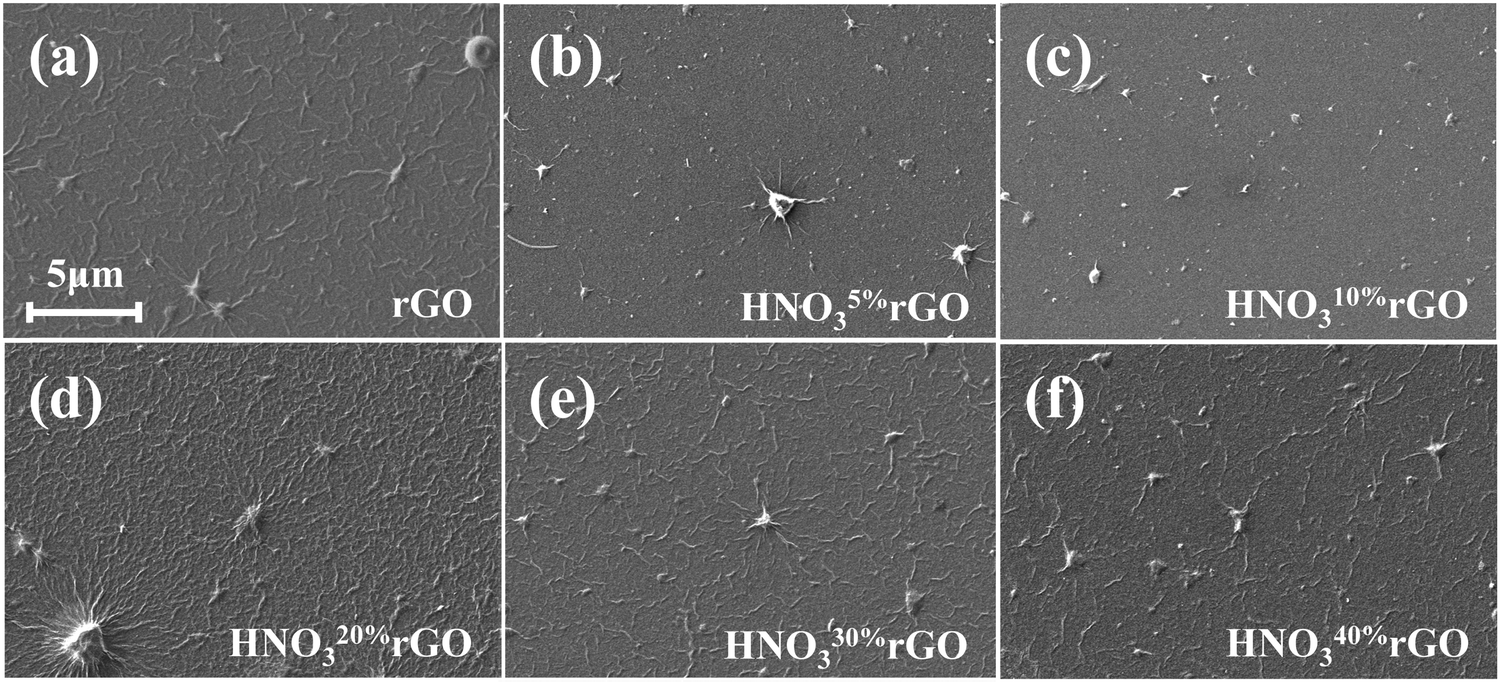 | ||
| Fig. 2 SEM images of (a) rGO and (b–f) HNO3-treated rGO films on Si wafers. | ||
2c. Electrical resistance measurements
For evaluating the temperature dependence, HNO3rGO samples were placed on a Sawatec HP-150 hot plate. Each group contained 5 samples, and their resistance was measured using a standard 2-probe method with a Keithley 2000 multimeter at 30, 41, 53 and 64 °C.2d. Fourier transform infrared (FTIR) spectroscopy
HNO3rGO films were peeled off from the glass slides using a razor blade, mixed in a mortar with the KBr powder, which was pre-dried at 120 °C, and then compressed into self-supporting disks. A Bruker-Tensor FTIR spectrometer was used with a resolution of 4 cm−1 and 128 scans per sample. The data were analyzed with OPUS spectroscopy software to correct the baseline and minimize the influence of H2O and CO2 in the ambient environment.2e. X-ray photoelectron spectroscopy (XPS)
HNO3rGO films were prepared on Si wafers, dried at room temperature and then thermally reduced at 220 °C for 6 h. The HNO3rGO samples were then dipped into an HNO3 solution at 60 °C for 1 h, rinsed with water and dried in air. The samples were analyzed using a Thermo Scientific K-Alpha XPS spectrometer with an Al Kα X-ray radiation source (photon energy 1486.6 eV). O1s and C1s peaks were analyzed using the Avantage peak deconvolution software.2f. X-ray diffraction (XRD)
The sample preparation procedure for XRD was identical to that described above for the XPS measurements. A Bruker AXS SMART APEXII single-crystal diffractometer with the X-ray beam generated from a sealed Cu tube at the wavelength of Cu-Kα at 0.154178 nm was used. The sample-detector distance was 150 mm, and the exposure time was 600 s per run. The data were analyzed using the XRD2EVAL program in Bruker PILOT software. The average d-spacing of the HNO3rGO sample was calculated by using the Bragg equation:λ = 2d![[thin space (1/6-em)]](https://www.rsc.org/images/entities/char_2009.gif) sinθ, sinθ, | (1) |
2g. Ultraviolet-visible (UV-vis) spectroscopy
GO films were printed on quartz slides, thermally reduced at 220 °C for 6 h and treated with HNO3 solutions at 60 °C for 1 h. After rinsing with DI-water and drying at room temperature, the samples were characterized with an Evolution 300 Spectrometer using a Xenon flash lamp light source. The scan range was set from 280 to 900 nm with a scanning accuracy of 1 nm and a scan rate of 240 nm min−1.2h. Dispersion-corrected density functional theory (DFT-D) calculations
The calculations were performed with the DMol3 code in Materials Studio 2017 software by Dassault Systèmes BIOVIA Corporation. The calculations used the DNP basis set (version 3.5) and the GGA PBE functional. Reciprocal-space integration over the Brillouin zone was performed at the Γ point. The density mixing fraction of 0.2 with direct inversion in the iterative subspace (DIIS size 6) and orbital occupancy with smearing of 0.005 Ha were used. The orbital cutoff distance was set at 0.37 nm for all atoms. The Grimme method for the DFT-D correction was applied with a s6 factor of 0.75 and a damping factor d of 20.0. The positions of all atoms were optimized during geometry optimization to obtain electronic band structures, density of states and band gap energies. The band structure was calculated with a separation distance of 0.15 1 nm−1. The density of states was calculated with 1 empty band and a k-point grid of 2 × 2 × 1.The computational settings were similar to those that were previously used successfully to describe molecular properties of surface functional groups, including hydroxyls.54–58The rGO structure was modeled as an infinite slab constructed using a periodic unit cell. Edge sites were not considered in the model because they represented less than 0.2% of all carbon atoms due to the large size of our rGO sheets (300–800 nm). The optimized structures for graphene and rGO materials with different O/C ratios were obtained with the following procedure. First, the lattice parameter for a graphite unit cell with 4 C atoms without any functional groups was optimized at a value of 0.25 nm. A single layer with 72 C atoms, with a 5 nm vacuum spacing in the c direction, was generated based on the optimized graphene unit cell and used as the periodic supercell. The size of the supercell was selected to allow varying the concentration of functional groups, and the vacuum spacing was selected to avoid interactions between neighboring graphene layers. Energies are reported at 0 K without zero-point vibrational energy corrections.
3. Results
The optical transparency results for the HNO3rGO samples evaluated by UV-vis spectroscopy in Fig. 3a show that the absorbance of the HNO3rGO materials decreased with increasing HNO3 concentration, especially in the visible and infrared light regions. For example, at the wavelength of 650 nm, the normalized absorbance of the untreated rGO was 80.4%. The absorbance decreased to 65.8% for the HNO310%rGO and further to 35.6% for the HNO340%rGO.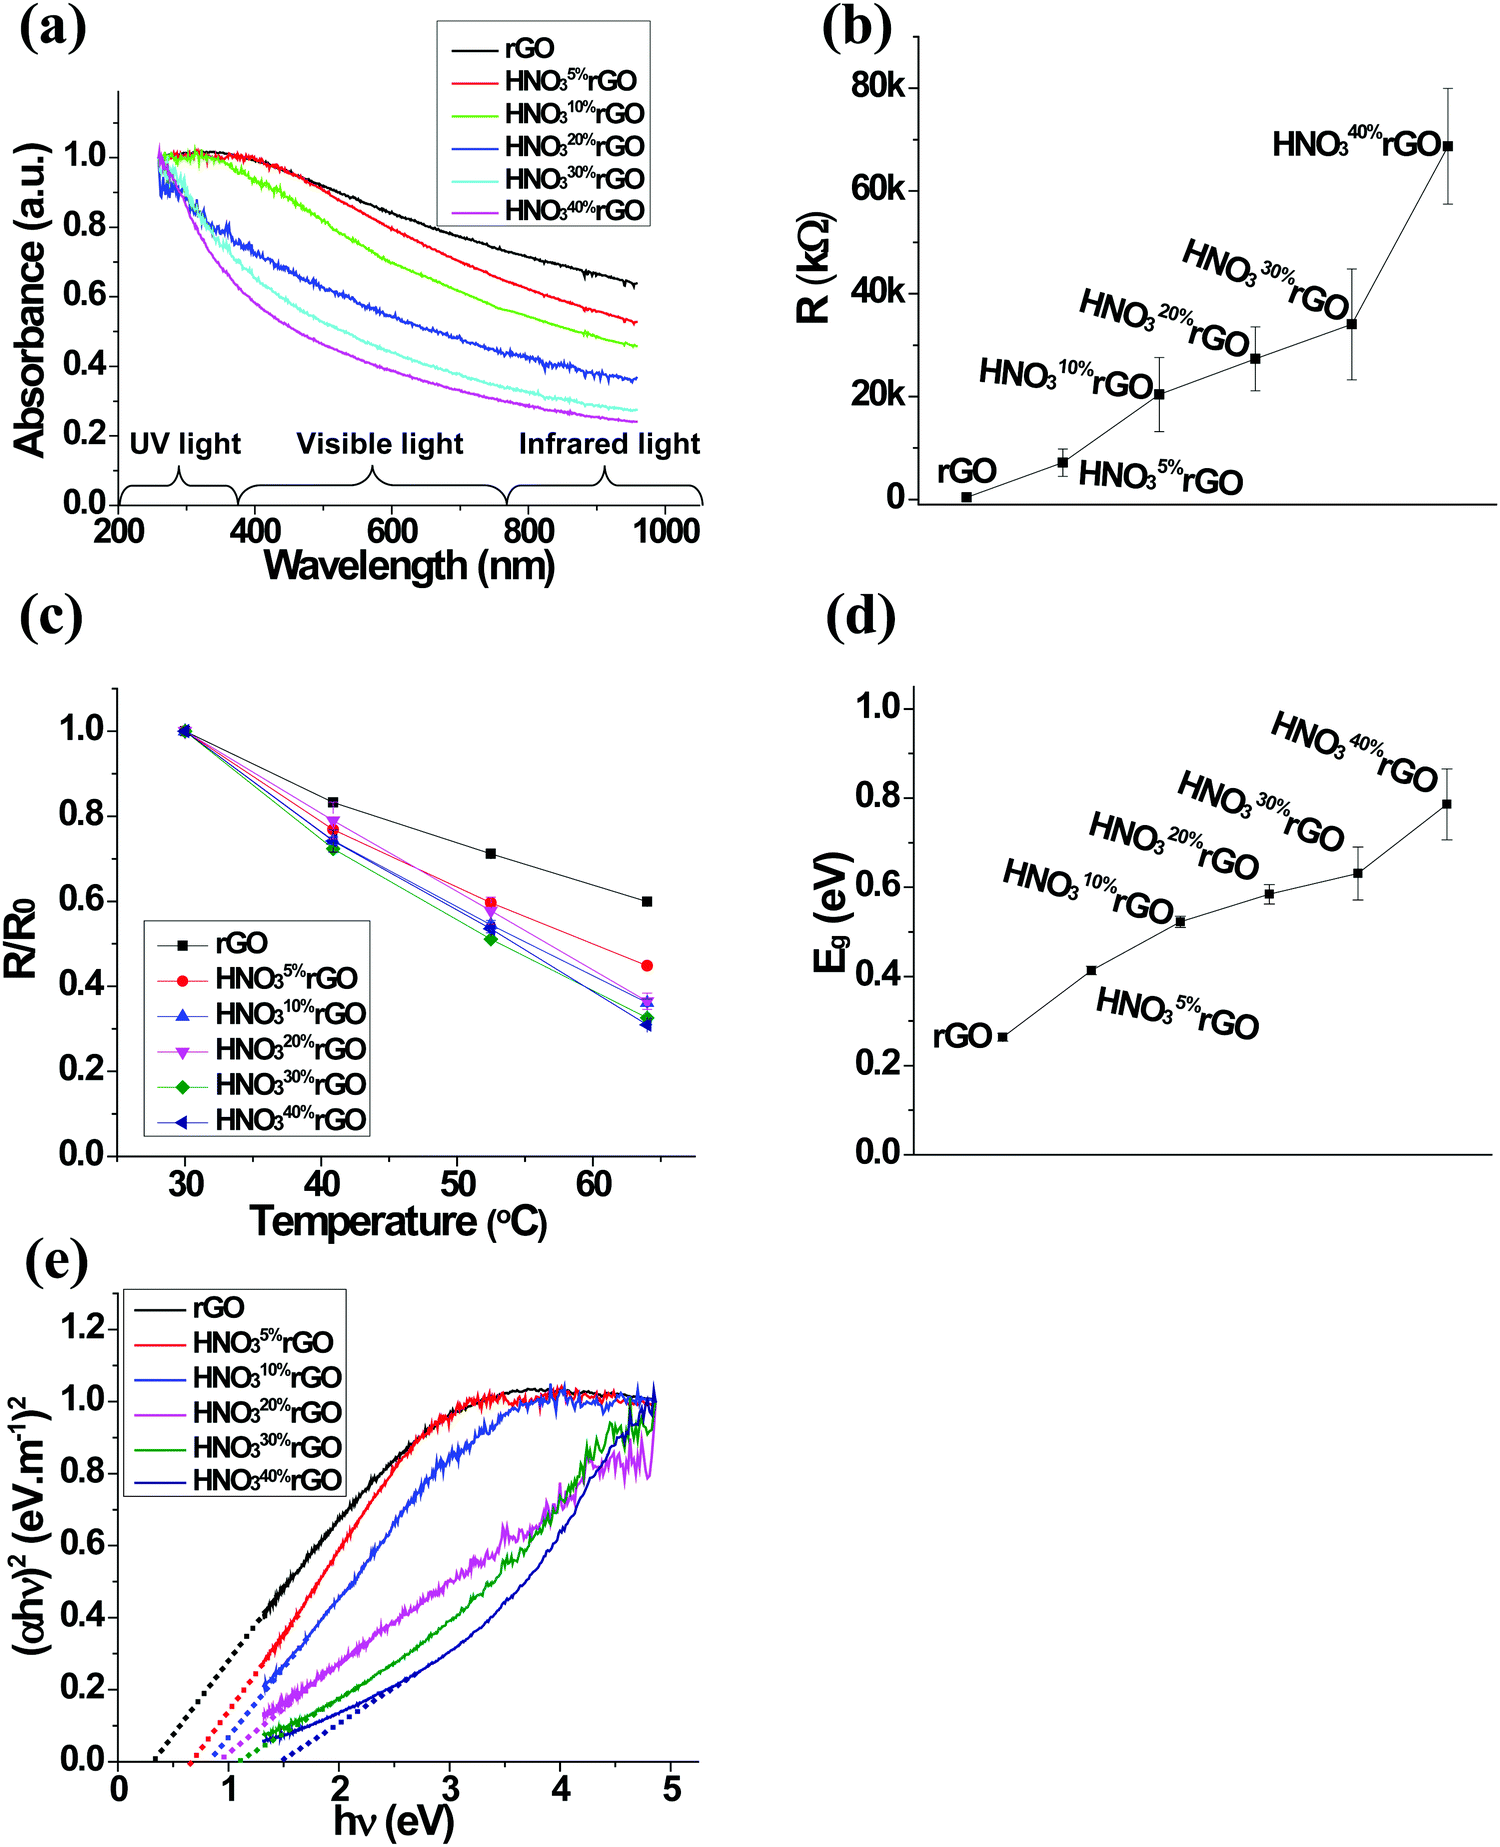 | ||
| Fig. 3 (a) UV-vis spectra, (b) average resistance at 64 °C, (c) normalized resistance as a function of temperature from 30 to 64 °C, and (d) band gap energy for the initial and HNO3-treated rGO materials, and (e) Tauc plot for optical band gap determination. | ||
The resistance of the untreated rGO was 403.3 kΩ at 64 °C. The dependence of the electrical resistance on the HNO3 concentration in Fig. 3b shows that the resistance rapidly increased to 7.14 MΩ for the HNO35%rGO and eventually to 68.7 MΩ for the HNO340%rGO. The dependence of the normalized resistance on the HNO3 concentration as a function of temperature in Fig. 3c demonstrates that the value for the untreated rGO decreased by 40% when the temperature increased from 30 to 64 °C. After the HNO3 treatments, the temperature dependence became even more significant, reducing the normalized resistance by 69% for the HNO340%rGO material in the same temperature range.
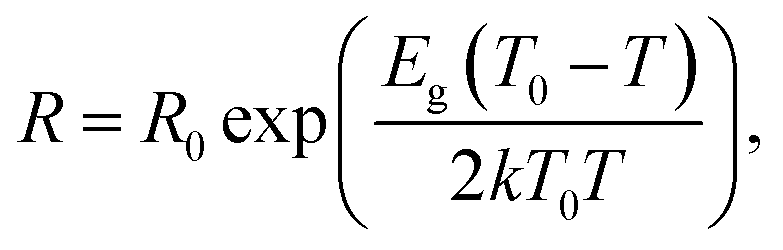
The following equation was used to calculate the band gap energy (Eg) from the resistance of the HNO3rGO samples (R) obtained as a function of temperature (T):
 | (2) |
Optical band gap energies were estimated using the Tauc plot of the UV-vis results in Fig. 3e by extrapolating the linear part of the curves to the intercept with the hv axis based on the relationship:59
| αhν = B(hν − Eg)m, | (3) |
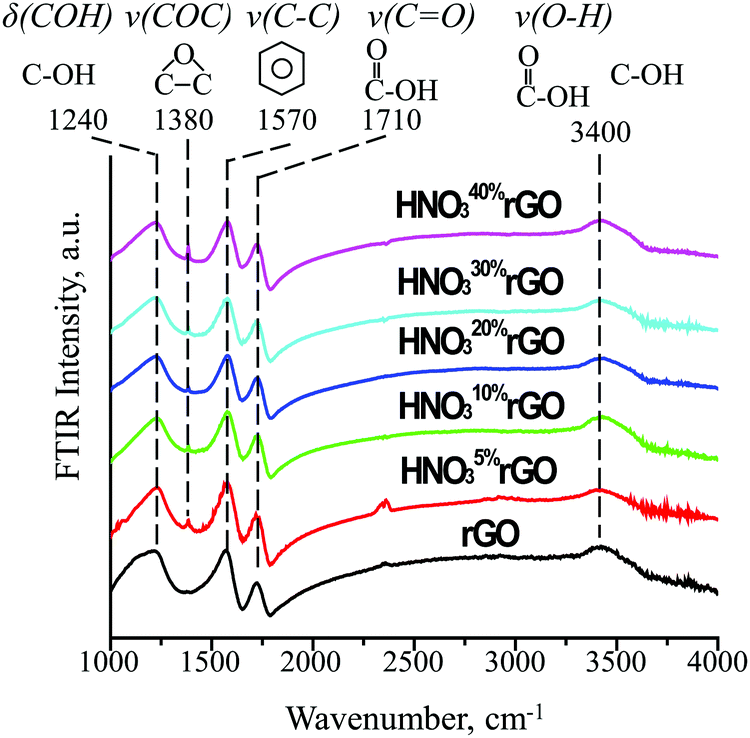
The FTIR results in Fig. 4 provide information on how the HNO3 treatments affected the type and concentration of surface functional groups. For the untreated rGO, the following four characteristic peaks were detected. The first peak at 1240 cm−1 is assigned to δ(COH), the deformation mode of carbon-bonded hydroxyl groups, based on a similarity with the same vibration at 1257 cm−1 in phenol. The second peak at 1570 cm−1 is consistent with ν(C–C), stretching of the C–C bonds in the benzene ring at 1596 cm−1. The third peak at 1710 cm−1 is due to ν(C![[double bond, length as m-dash]](https://www.rsc.org/images/entities/char_e001.gif) O), stretching of the CO bond in a carboxyl group (similar to 1788 cm−1 for acetic acid). Finally, the fourth broad peak at 3400 cm−1 is due to ν(O–H), stretching of the O–H bond in isolated hydroxyl groups (similar to 3681 cm−1 for methanol) and hydroxyls associated with carboxyl groups (similar to 3583 cm−1 for acetic acid). Therefore, only two functional groups were present in the untreated rGO: (1) isolated hydroxyls (OH) and (2) carboxyls (COOH).
O), stretching of the CO bond in a carboxyl group (similar to 1788 cm−1 for acetic acid). Finally, the fourth broad peak at 3400 cm−1 is due to ν(O–H), stretching of the O–H bond in isolated hydroxyl groups (similar to 3681 cm−1 for methanol) and hydroxyls associated with carboxyl groups (similar to 3583 cm−1 for acetic acid). Therefore, only two functional groups were present in the untreated rGO: (1) isolated hydroxyls (OH) and (2) carboxyls (COOH).
 | ||
| Fig. 4 FTIR spectra of the initial and HNO3-treated rGO materials. | ||
After the acid treatment, a new peak was observed at 1380 cm−1, which is consistent with ν(COC), the stretching mode of an epoxide ring (similar to 1271 cm−1 in ethylene oxide). The intensity of the new epoxide peak gradually increased with increasing HNO3 concentration while the intensity of the peak at 1570 cm−1 for aromatic rings slightly decreased. The intensities of the peaks at 1240, 1710 and 3400 cm−1 for the initial hydroxyl and carboxyl groups remained practically constant. These results demonstrate that the acid treatments generated an increasing number of epoxide groups on initially non-functionalized aromatic rings while having little effect on the initial hydroxyl and carboxyl groups.
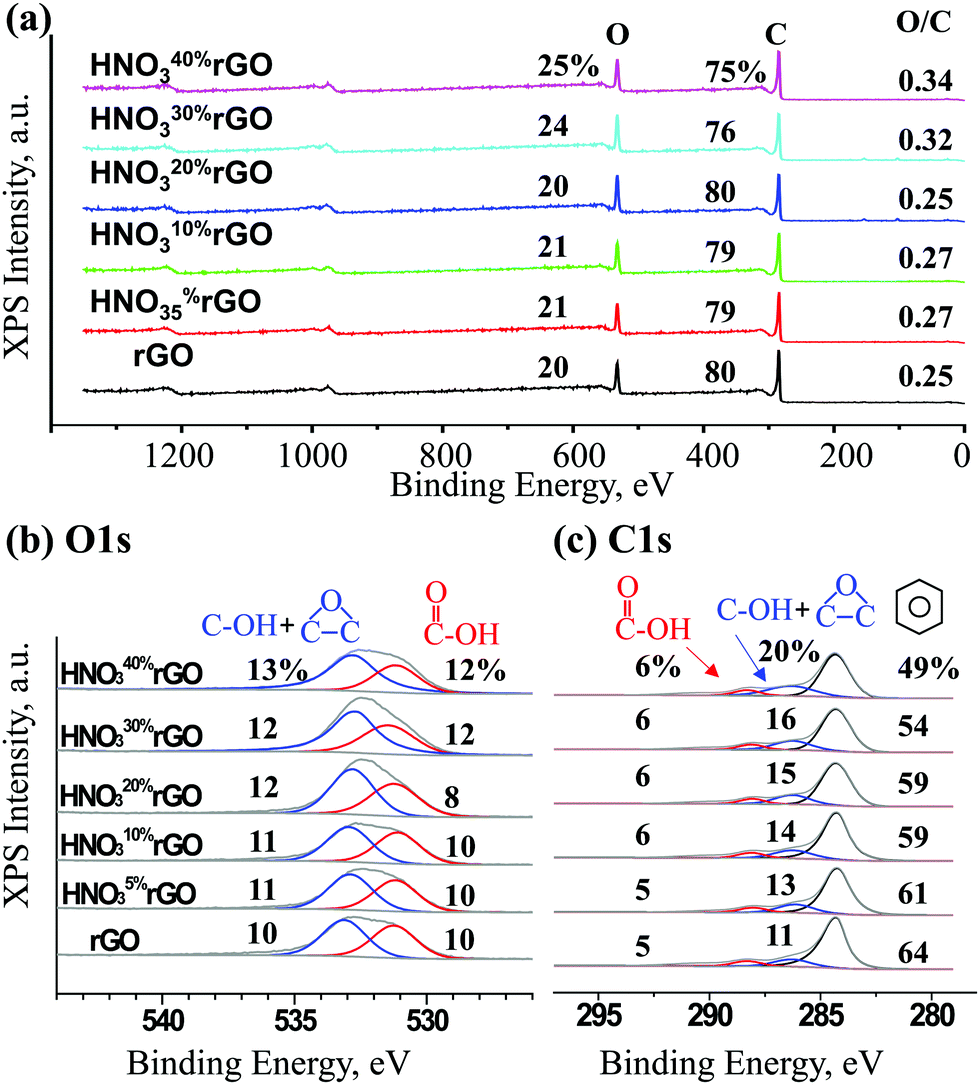
The XPS results in Fig. 5 were used to quantify the formation of epoxide groups and determine the overall extent of oxidation. Based on the overall spectra in Fig. 5a, the concentration of oxygen gradually increased from 20% for the untreated rGO to 25% for the HNO340%rGO sample, corresponding to an increase in the O/C atomic ratio from 0.25 to 0.34. The O1s peak in Fig. 5b was deconvoluted into two peaks. The first peak at 533.0 eV for O atoms in the C–O bonds of both epoxide and hydroxyl groups increased from 11 to 16%. The second peak at 531.3 eV for O atoms in the CO bond of carboxylic groups remained mostly unaffected at 9–10%. The C1s peak in Fig. 5c was deconvoluted into three peaks at 288.3, 286.4 and 284.6 eV and assigned to carbon atoms in CO (carboxyls), C–O (epoxides and hydroxyls) and C–C bonds (non-functionalized aromatic rings), respectively. The concentration of C atoms in carboxylic groups remained practically constant at 5–6%, in agreement with the O1s results. In contrast, the combined concentration of C atoms in epoxide and hydroxyl groups increased from 10 to 18%, also in agreement with the O1s results, while the C balance in non-functionalized aromatic rings correspondingly decreased from 65 to 51%.
 | ||
| Fig. 5 XPS spectra of the initial and HNO3-treated rGO materials. | ||
The SEM results in Fig. 2 provide information on the surface morphology. Fig. 2 shows the presence of wrinkles and lumps of ∼1–3 μm on the surface of rGO after inkjet printing and thermal reduction. Our previous study determined that these surface features were formed due to uneven dehydration during thermal reduction.44 The rGO samples retained these surface features without any significant changes after the HNO3 treatments.
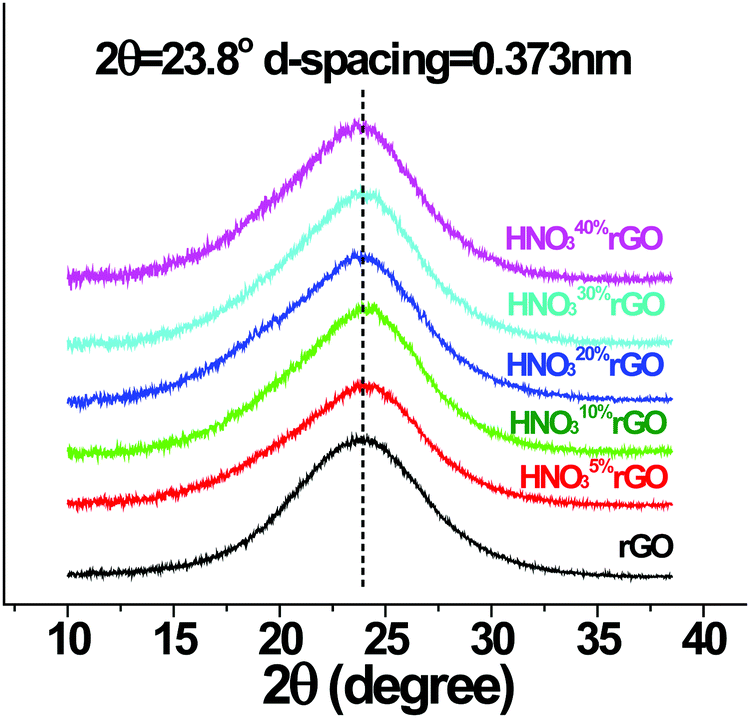
The XRD results at ambient temperature in Fig. 6 show that the d-spacing for all the acid-treated materials remained unchanged at 0.373 nm. The interlayer structure of the GO, therefore, was not affected by the HNO3 treatments in the employed concentration range up to 40%.
 | ||
| Fig. 6 XRD patterns of the initial and HNO3-treated rGO materials. | ||
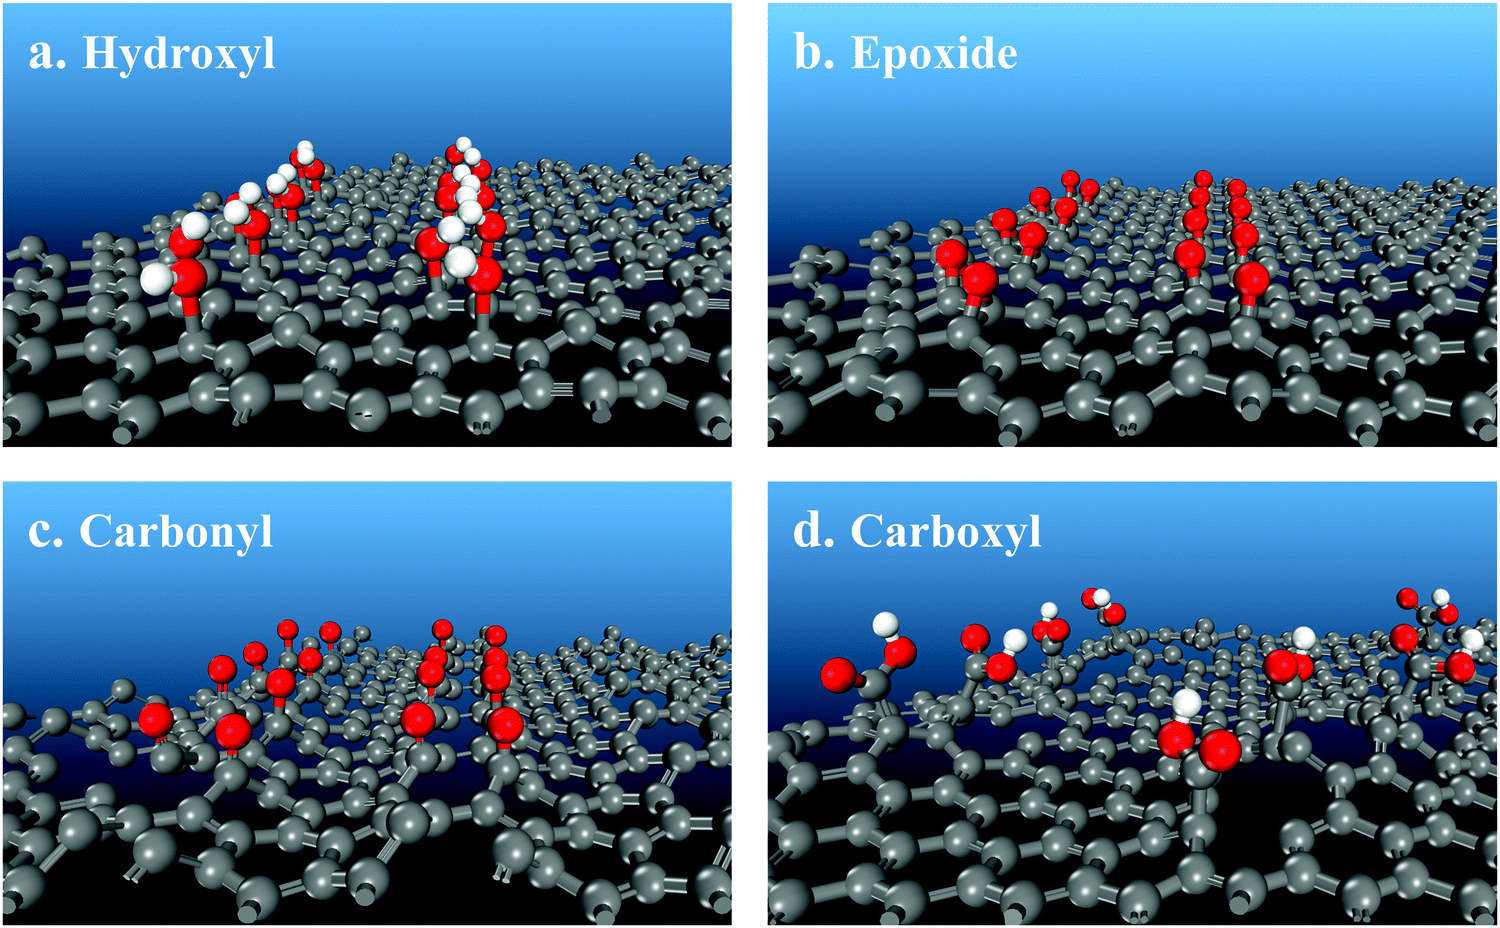
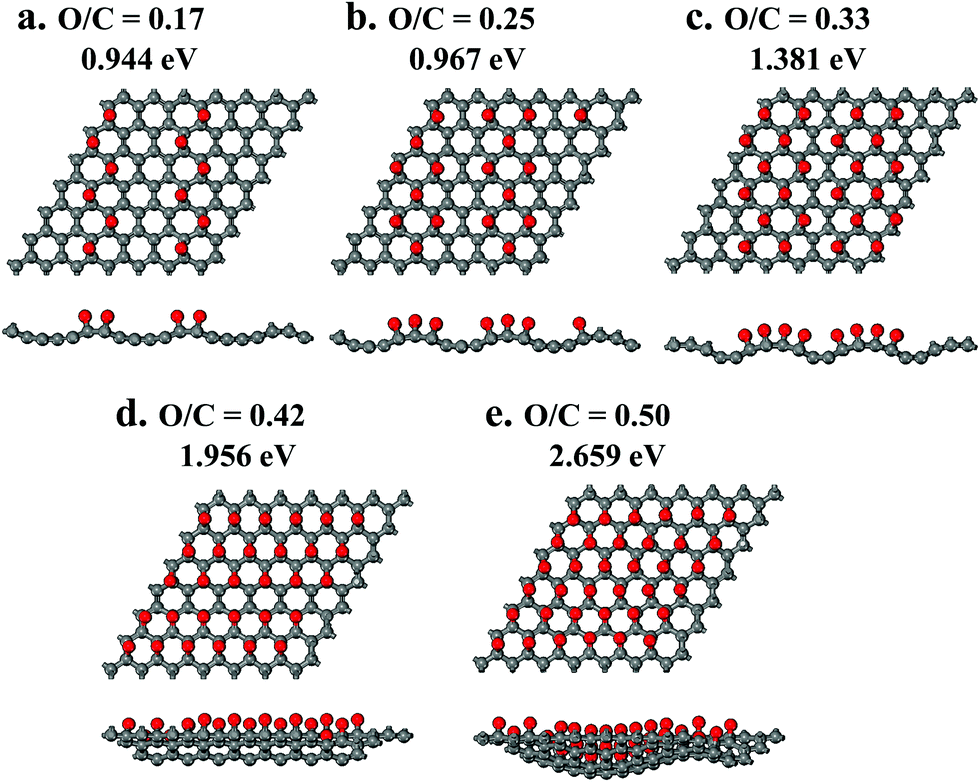
To provide interpretation of the experimental results at the molecular level and, furthermore, to determine which functional group is preferable for tuning the rGO band gap, quantum chemical calculations evaluated four O-containing functional groups separately. Hydroxyl, epoxide, carbonyl and carboxyl groups (Table 1, Fig. 7 and 8) were compared based on their effects on the rGO molecular structure and the band gap energy as a function of their surface concentration. Hydroxyl groups do not appreciably change the molecular geometry, introducing only a small amount of bending of graphene layers (Fig. 7a) due to some elevation of bonding C atoms. With increasing surface concentration from 0.17 to 0.25 to 0.33 O/C ratio, the effect on the band gap energy is also small and almost constant at 0.016–0.050 eV (Table 1 and Fig. 9). At higher concentrations, neighboring hydroxyl groups are not stable. They convert into epoxides and gas-phase water: 2C–OH = C–O–C + H2O. Isolated hydroxyl groups are stable, but still thermodynamically less preferable. For example, even at a low 1/6 O/C ratio (rounded to 0.17 in Table 1), it is energetically preferable by 58 kJ mol−1 for all hydroxyls to convert into epoxides, producing gas-phase water and a material with epoxides with an O/C ratio of 1/12. Hydroxyls, therefore, are predicted to be thermodynamically less stable than epoxides on a non-defect graphene surface and, even if stabilized at low concentrations, to be ineffective for adjusting the band gap.
| Functional group | Band gap energy, eV | Stability |
|---|---|---|
| Hydroxyl C–OH | 0.050 | Stable only as isolated hydroxyls at low concentrations. It is thermodynamically preferable for pairs of hydroxyls to convert into an epoxide and gas-phase water. |
| Epoxide C–O–C | 0.944 | Highly stable. |
| Carbonyl CO |
0.010 | Not stable, converts to epoxide. |
| Carboxyl COOH | 0.083 | Stable only on defect sites. |
 | ||
| Fig. 7 Molecular structures of oxygen-containing functional groups on a graphene surface obtained with quantum chemical calculations. | ||
 | ||
| Fig. 8 Molecular structures with an increasing concentration of epoxide function groups on a graphene surface and their band gap energies obtained with quantum chemical calculations: top view (image above) and side view (image below). | ||
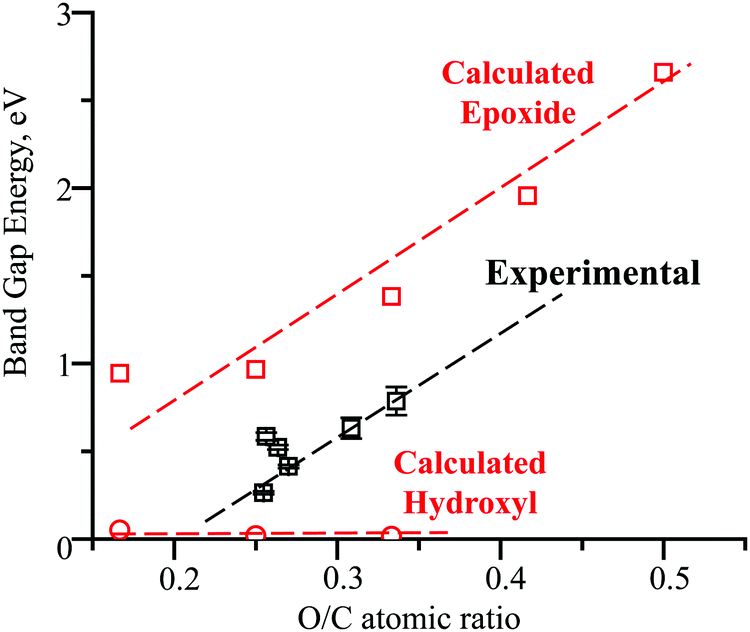 | ||
| Fig. 9 Experimental and computational dependencies of the rGO band gap energy on the extent of oxidation. | ||
Unlike hydroxyls, epoxide groups produce more pronounced bending of graphene layers, which increases with increasing epoxide concentration (Fig. 7b and 8). It is energetically preferable for epoxides to occupy neighboring sites and form zigzag surface rows (Fig. 8). Importantly, however, epoxides do not cause breaking of the hexagonal carbon-ring structure or formation of any other defects up to a complete saturation coverage of O/C = 0.50 (Fig. 8). Unlike hydroxyls, epoxide groups are highly effective in tuning the band gap energy, changing it gradually from 0.944 to 2.659 eV as the O/C ratio increases from 0.17 to 0.50 (Table 1 and Fig. 9). The energy values exhibit a nearly linear dependence on the O/C ratio, with the slope being similar to that for the experimental results (Fig. 9).
In contrast with hydroxyls and epoxides, carbonyl groups do not form on a graphene surface without defects. Their formation requires breaking of the hexagonal carbon-ring structure that produces holes in the rGO layers (Fig. 7c). In addition, carbonyl structures are only metastable. For example, it is energetically preferable by 836 kJ mol−1 for all carbonyls to convert into epoxides at O/C = 0.17. Furthermore, even if carbonyls are stabilized, their effect on the band gap energy is very small, comparable to that for hydroxyls. At O/C = 0.17, the band gap energy is predicted to be only 0.010 eV (Table 1).
The computational results show that carbonyls break the hexagonal carbon-ring structure and can be stabilized only on defect sites. Moreover, carbonyls are predicted to be thermodynamically metastable and spontaneously convert into epoxides. Therefore, the experimental results were interpreted based on an absence of carbonyls in both the initial rGO and the acid-treated materials. The FTIR peak at 1710 cm−1, which is consistent with ν(CO) in both carboxyl and carbonyl groups, is assigned only to carboxyls. Similarly, the O1s XPS peak at 531.3 eV is assigned to O atoms in the CO bonds of only carboxyls.
Similar to carbonyls, formation of carboxyl groups requires breaking of aromatics rings. The carboxyl C atom is lifted above the surface, producing a defect and bending the surface (Fig. 7d). Due to this molecular geometry, the electron-withdrawing effect on the remaining C atoms is small. At O/C = 0.17, the band gap energy is predicted to be only 0.083 eV, much lower than 0.944 eV for epoxides (Table 1). When the concentration of carboxyls is doubled to match the absolute number of epoxides (since carboxyl has two O atoms while epoxide has one), the band gap energy almost doubles to 0.175 eV but still remains significantly lower than 0.944 eV for epoxides. Therefore, carboxyls generate surface defects, and they are much less effective in adjusting the band gap energy when compared with epoxides at both the same O/C ratio and at the same number of functional groups.
4. Discussion
The appearance and growth of a new FTIR peak at 1380 cm−1 with increasing HNO3 concentration in Fig. 4 demonstrates that the acid treatments generate epoxide groups, which are not present in the initial rGO, and that the number of these epoxide groups steadily increases with higher HNO3 concentrations. These conclusions are confirmed with the XPS results in Fig. 5b and c that show increases in the intensities of the O1s peak at 533.0 eV and C1s peak at 286.4 eV for combined epoxide and hydroxyl groups. The intensities of the FTIR peaks for carboxyls and hydroxyls fluctuate but remain mostly constant. Therefore, the observed band gap energy changes in Fig. 3d and 9 must be due exclusively to the formation and increasing concentration of epoxide groups because the concentrations of all other functional groups remain constant.The computational results in Fig. 9 demonstrate that hydroxyl groups have a negligible effect on the band gap. Carboxyl groups are expected to form by breaking the graphene structure (Fig. 7d) and to have a small effect on the band gap (Table 1). These computational results provide an explanation for the low band gap energy of 0.264 eV of the initial untreated rGO that has 10% hydroxyls and 5% carboxyls with O/C = 0.25, based on the XPS results in Fig. 5. Since the computational models for epoxides in Fig. 8 do not have defect sites with ineffective hydroxyls and carboxyls, the calculated trend line for the dependence on the band gap energy on the O/C ratio in Fig. 9 is shifted by the initial O/C = 0.25. Importantly, the similarity of the slopes for the computational and experimental trend lines provides further evidence that the experimental band gap adjustment is due exclusively to the formation of epoxide groups.
The computational results in Fig. 9 also provide guidance on how the molecular structure and the band gap tuning can be further optimized. The number of initial hydroxyl and carboxyl groups should be minimized because they are ineffective and prevent the formation of additional epoxide groups. Without hydroxyl and carboxyl groups, the computational results suggest that by varying the epoxide concentration from zero to full coverage, up to O/C = 0.5, the band gap energy can be gradually and accurately tuned in a wide range, from zero to 2.659 eV (Fig. 9).
This is the first study that provides experimental evidence of tuning the band gap of rGO by adjusting the surface concentration of epoxide groups and reports that this effect can be achieved with a mild acid oxidation treatment. In contrast with previously proposed methods for band gap adjustments of graphene materials, the developed methodology is more efficient and avoids structural deformations or introduction of any other elements, except oxygen.
Notably, our developed methodology is significantly different than the alloying approach commonly used for adjusting the band gap of inorganic semiconductors.60 For example, the band gap of a Si/GaAs alloy can be tuned between Si (1.1 eV) and GaAs (1.4 eV) based on the ratio of the two materials. Since their lattice parameters are not identical – 0.543 nm for Si and 0.565 nm for GaAs – the mismatch makes an alloy semi-stable. Such an alloy is thermodynamically stable only below its critical size, usually below 1 μm. At larger sizes, a semi-stable alloy will phase separate.61,62 In contrast, rGO materials with a variable number of epoxide functional groups are not limited by their size. Thus, our developed methodology for tuning the band gap is simpler and more flexible.
Unlike inorganic semiconductors, the band gap energies of organic semiconductors developed for low-cost applications63–66 are typically larger, in the range of 2.5 to 4.0 eV, impeding efficient generation of charge carriers.38,39 Due to a low dielectric constant (e.g., 3 to 4), organic semiconductors exhibit very low carrier mobility (<1 cm2 V−1 s−1), which limits their use. In comparison, the carrier mobility in rGO can be higher than 100 cm2 V−1 s−1 due to 2D delocalization of electrons.35–37 Consequently, our developed methodology for tuning the band gap of rGO is particularly well suited for a wide range of semiconductor applications and can serve as a preferable alternative to known inorganic and organic semiconductor materials.
5. Conclusions
The band gap energy of rGO can be effectively tuned by an HNO3 treatment with a variable acid concentration without introducing structural defects or d-spacing changes. The increased band gap is due to the formation and increased concentration of epoxide functional groups. Both experimental measurements and quantum chemical calculations demonstrate that the band gap energy increases nearly linearly with the surface concentration of epoxides. The developed methodology can be used to produce rGO materials with precisely tuned band gaps for a wide range of semiconductor applications.In contrast with the known techniques of adjusting the band gap of inorganic semiconductors with alloying, the developed methodology is simpler because it does not require incorporation of any other elements, except oxygen. In addition, it is more flexible because it is not limited by elemental ratios required for alloy stability. Furthermore, in contrast with known tunable organic semiconductors, the developed methodology produces rGO materials with significantly higher carrier mobility. Therefore, tuning the band gap of rGO with epoxide functional groups is a highly promising alternative to known inorganic and organic semiconductor materials. Furthermore, the obtained information on the molecular structure and properties of oxygen-containing functional groups will be useful beyond semiconductor applications since functionalized graphene-based materials are currently actively studied in numerous and diverse areas: from polymer nanocomposites, memory devices, super-capacitor devices, biosensors to pharmaceutical drug delivery systems.
Author contributions
The manuscript was written with contributions from all authors. Y. J. designed and performed all the experiments. Y. J. and Y. Z. conceived the computational study. Y. Z. performed the computational study. S. G. P. supervised the computational study and analyzed its results. W. L. conceived the overall study, supervised the experiments and interpreted the overall results.Conflicts of interest
There are no conflicts to declare.Acknowledgements
Y. J. acknowledges the Innovation and Entrepreneurship Doctoral Fellowship at Stevens Institute of Technology. We thank Dr Chunhua Hu at the X-ray Diffraction Facility in the College of Arts and Science, New York University for his help with data collection and the support by the National Science Foundation under Award Number CRIF/CHE-0840277 and by the NSF MRSEC Program under Award Number DMR-0820341. We are grateful for the SEM characterization support from Dr Alex Chou at the Multiscale Imaging Laboratory, Stevens Institute of Technology. We thank Dr Ryan Thorpe and Dr Robert Horvath at the Materials Science and Engineering Department, Rutgers University, for XPS and UV-vis spectroscopy characterization. Quantum chemical calculations were performed with Materials Studio software under a collaborative research license with Dassault Systèmes BIOVIA Corporation. We thank Dr Felix Hanke and Dr Victor Milman at Dassault Systèmes BIOVIA Corporation for discussions on computational parameters.References
- A. K. Geim and K. S. Novoselov, Nat. Mater., 2007, 6, 183 CrossRef CAS PubMed.
- A. K. Geim, Science, 2009, 324, 1530–1534 CrossRef CAS PubMed.
- K. S. Novoselov, D. Jiang, F. Schedin, T. J. Booth, V. V. Khotkevich, S. V. Morozov and A. K. Geim, Proc. Natl. Acad. Sci. U. S. A., 2005, 102, 10451–10453 CrossRef CAS PubMed.
- A. H. Castro Neto, F. Guinea, N. M. R. Peres, K. S. Novoselov and A. K. Geim, Rev. Mod. Phys., 2009, 81, 109–162 CrossRef CAS.
- C.-T. Chien, P. Hiralal, D.-Y. Wang, I.-S. Huang, C.-C. Chen, C.-W. Chen and G. A. J. Amaratunga, Small, 2015, 11, 2929–2937 CrossRef CAS PubMed.
- L. Grande, V. T. Chundi, D. Wei, C. Bower, P. Andrew and T. Ryhänen, Particuology, 2012, 10, 1–8 CrossRef CAS.
- F. Zhang, T. Zhang, X. Yang, L. Zhang, K. Leng, Y. Huang and Y. Chen, Energy Environ. Sci., 2013, 6, 1623–1632 RSC.
- S. K. Hong, J. E. Kim, S. O. Kim, S. Choi and B. J. Cho, IEEE Electron Device Lett., 2010, 31, 1005–1007 CAS.
- S. K. Hong, J. E. Kim, S. O. Kim and B. J. Cho, J. Appl. Phys., 2011, 110, 044506 CrossRef.
- A. J. Hong, E. B. Song, H. S. Yu, M. J. Allen, J. Kim, J. D. Fowler, J. K. Wassei, Y. Park, Y. Wang, J. Zou, R. B. Kaner, B. H. Weiller and K. L. Wang, ACS Nano, 2011, 5, 7812–7817 CrossRef CAS PubMed.
- M. Pumera, Mater. Today, 2011, 14, 308–315 CrossRef CAS.
- M. Pumera, A. Ambrosi, A. Bonanni, E. L. K. Chng and H. L. Poh, TrAC, Trends Anal. Chem., 2010, 29, 954–965 CrossRef CAS.
- Y. Shao, J. Wang, H. Wu, J. Liu, I. A. Aksay and Y. Lin, Electroanalysis, 2010, 22, 1027–1036 CrossRef CAS.
- H. A. Becerril, J. Mao, Z. Liu, R. M. Stoltenberg, Z. Bao and Y. Chen, ACS Nano, 2008, 2, 463–470 CrossRef CAS PubMed.
- I. Khrapach, F. Withers, T. H. Bointon, D. K. Polyushkin, W. L. Barnes, S. Russo and M. F. Craciun, Adv. Mater., 2012, 24, 2844–2849 CrossRef CAS PubMed.
- G. Eda, G. Fanchini and M. Chhowalla, Nat. Nanotechnol., 2008, 3, 270 CrossRef CAS PubMed.
- X. Wang, L. Zhi and K. Müllen, Nano Lett., 2008, 8, 323–327 CrossRef CAS PubMed.
- B. Partoens and F. M. Peeters, Phys. Rev. B: Condens. Matter Mater. Phys., 2006, 74, 075404 CrossRef.
- L. Liu and Z. Shen, Appl. Phys. Lett., 2009, 95, 252104 CrossRef.
- Y. Shen, S. Yang, P. Zhou, Q. Sun, P. Wang, L. Wan, J. Li, L. Chen, X. Wang, S. Ding and D. W. Zhang, Carbon, 2013, 62, 157–164 CrossRef CAS.
- A. Mathkar, D. Tozier, P. Cox, P. Ong, C. Galande, K. Balakrishnan, A. Leela Mohana Reddy and P. M. Ajayan, J. Phys. Chem. Lett., 2012, 3, 986–991 CrossRef CAS PubMed.
- Y. Zhang, T.-T. Tang, C. Girit, Z. Hao, M. C. Martin, A. Zettl, M. F. Crommie, Y. R. Shen and F. Wang, Nature, 2009, 459, 820–823 CrossRef CAS PubMed.
- C.-K. Chang, S. Kataria, C.-C. Kuo, A. Ganguly, B.-Y. Wang, J.-Y. Hwang, K.-J. Huang, W.-H. Yang, S.-B. Wang, C.-H. Chuang, M. Chen, C.-I. Huang, W.-F. Pong, K.-J. Song, S.-J. Chang, J.-H. Guo, Y. Tai, M. Tsujimoto, S. Isoda, C.-W. Chen, L.-C. Chen and K.-H. Chen, ACS Nano, 2013, 7, 1333–1341 CrossRef CAS PubMed.
- H. Huang, Z. Li, J. She and W. Wang, J. Appl. Phys., 2012, 111, 054317 CrossRef.
- A. M. Dimiev and J. M. Tour, ACS Nano, 2014, 8, 3060–3068 CrossRef CAS PubMed.
- D. R. Dreyer, S. Park, C. W. Bielawski and R. S. Ruoff, Chem. Soc. Rev., 2010, 39, 228–240 RSC.
- A. Nourbakhsh, M. Cantoro, T. Vosch, G. Pourtois, F. Clemente, M. H. van der Veen, J. Hofkens, M. M. Heyns, S. De Gendt and B. F. Sels, Nanotechnology, 2010, 21, 435203 CrossRef PubMed.
- K. A. Mkhoyan, A. W. Contryman, J. Silcox, D. A. Stewart, G. Eda, C. Mattevi, S. Miller and M. Chhowalla, Nano Lett., 2009, 9, 1058–1063 CrossRef CAS PubMed.
- L. Wang, H.-Y. Wang, Y. Wang, S.-J. Zhu, Y.-L. Zhang, J.-H. Zhang, Q.-D. Chen, W. Han, H.-L. Xu, B. Yang and H.-B. Sun, Adv. Mater., 2013, 25, 6539–6545 CrossRef CAS PubMed.
- S. Pei and H.-M. Cheng, Carbon, 2012, 50, 3210–3228 CrossRef CAS.
- C. Gómez-Navarro, J. C. Meyer, R. S. Sundaram, A. Chuvilin, S. Kurasch, M. Burghard, K. Kern and U. Kaiser, Nano Lett., 2010, 10, 1144–1148 CrossRef PubMed.
- R. Kazemzadeh, K. Andersen, L. Motha and W. S. Kim, IEEE Electron Device Lett., 2015, 36, 180–182 CAS.
- S.-Y. Xie, X.-B. Li, Y. Y. Sun, Y.-L. Zhang, D. Han, W. Q. Tian, W.-Q. Wang, Y.-S. Zheng, S. B. Zhang and H.-B. Sun, Carbon, 2013, 52, 122–127 CrossRef CAS.
- Y. Wang, L. Wang, H.-Y. Wang, Q.-D. Chen and H.-B. Sun, J. Phys. Chem. C, 2019, 123, 22550–22555 CrossRef CAS.
- A. Bhaumik, A. Haque, M. Taufique, P. Karnati, R. Patel, M. Nath and K. Ghosh, J. Mater. Sci. Eng., 2017, 6, 1–11 Search PubMed.
- H. Feng, R. Cheng, X. Zhao, X. Duan and J. Li, Nat. Commun., 2013, 4, 1539 CrossRef PubMed.
- Y. Wang, Y. Chen, S. D. Lacey, L. Xu, H. Xie, T. Li, V. A. Danner and L. Hu, Mater. Today, 2018, 21, 186–192 CrossRef CAS.
- V. Coropceanu, J. Cornil, D. A. da Silva Filho, Y. Olivier, R. Silbey and J.-L. Brédas, Chem. Rev., 2007, 107, 926–952 CrossRef CAS PubMed.
- V. Podzorov, E. Menard, A. Borissov, V. Kiryukhin, J. A. Rogers and M. E. Gershenson, Phys. Rev. Lett., 2004, 93, 086602 CrossRef CAS PubMed.
- D. Joung, L. Zhai and S. I. Khondaker, Phys. Rev. B: Condens. Matter Mater. Phys., 2011, 83, 115323 CrossRef.
- D. Joung and S. I. Khondaker, Phys. Rev. B: Condens. Matter Mater. Phys., 2012, 86, 235423 CrossRef.
- C. Chuang, R. K. Puddy, H.-D. Lin, S.-T. Lo, T. M. Chen, C. G. Smith and C. T. Liang, Solid State Commun., 2012, 152, 905–908 CrossRef CAS.
- P. B. Allen and V. Heine, J. Phys. C: Solid State Phys., 1976, 9, 2305–2312 CrossRef CAS.
- Y. Jin and W. Lee, Langmuir, 2019, 35, 5427–5434 CrossRef CAS PubMed.
- A. Manoogian and J. C. Woolley, Can. J. Phys., 1984, 62, 285–287 CrossRef CAS.
- H. Y. Fan, Phys. Rev., 1951, 82, 900–905 CrossRef CAS.
- A. Pillonnet, M. Garoum and R. Ongaro, J. Phys. D: Appl. Phys., 1995, 28, 149–159 CrossRef CAS.
- D. Kong, L. T. Le, Y. Li, J. L. Zunino and W. Lee, Langmuir, 2012, 28, 13467–13472 CrossRef CAS PubMed.
- E. P. Boon, L. T. Le and W. Y. Lee, Carbon, 2016, 102, 81–85 CrossRef CAS.
- Y. Jin, E. P. Boon, L. T. Le and W. Lee, Sens. Actuators, A, 2018, 280, 92–98 CrossRef CAS.
- I. K. Moon, J. Lee, R. S. Ruoff and H. Lee, Nat. Commun., 2010, 1, 73 CrossRef PubMed.
- M. A. Velasco-Soto, S. A. Pérez-García, J. Alvarez-Quintana, Y. Cao, L. Nyborg and L. Licea-Jiménez, Carbon, 2015, 93, 967–973 CrossRef CAS.
- L. T. Le, M. H. Ervin, H. Qiu, B. E. Fuchs, J. Zunino and W. Y. Lee, IEEE Conf. Nanotechnol., 2011, 8, 67–71 Search PubMed.
- T. Chen, E. Kertalli, T. A. Nijhuis and S. G. Podkolzin, J. Catal., 2016, 341, 72–81 CrossRef CAS.
- T. Chen, A. Pal, J. Gao, Y. Han, H. Chen, S. Sukhishvili, H. Du and S. G. Podkolzin, J. Phys. Chem. C, 2015, 119, 24475–24488 CrossRef CAS.
- K. Liu, T. Chen, S. He, J. P. Robbins, S. G. Podkolzin and F. Tian, Angew. Chem., Int. Ed., 2017, 56, 12952–12957 CrossRef CAS PubMed.
- E. V. Scoullos, M. S. Hofman, Y. Zheng, D. V. Potapenko, Z. Tang, S. G. Podkolzin and B. E. Koel, J. Phys. Chem. C, 2018, 122, 29180–29189 CrossRef CAS.
- Y. Zheng, Y. Tang, J. R. Gallagher, J. Gao, J. T. Miller, I. E. Wachs and S. G. Podkolzin, J. Phys. Chem. C, 2019, 123, 22281–22292 CrossRef CAS.
- J. Tauc, Mater. Res. Bull., 1968, 3, 37–46 CrossRef CAS.
- C.-Z. Ning, L. Dou and P. Yang, Nat. Rev. Mater., 2017, 2, 17070 CrossRef CAS.
- A. M. Smith and S. Nie, Acc. Chem. Res., 2010, 43, 190–200 CrossRef CAS PubMed.
- C.-H. Ge, H.-L. Li, X.-L. Zhu and A.-L. Pan, Chin. Phys. B, 2017, 26, 034208 CrossRef.
- X. Zhang, H. Dong and W. Hu, Adv. Mater., 2018, 30, 1801048 CrossRef PubMed.
- T. Ameri, P. Khoram, J. Min and C. J. Brabec, Adv. Mater., 2013, 25, 4245–4266 CrossRef CAS PubMed.
- F. T. Kong, S. Y. Dai and K. J. Wang, Adv. OptoElectron., 2007, 75384 Search PubMed.
- A. W. Hains, Z. Liang, M. A. Woodhouse and B. A. Gregg, Chem. Rev., 2010, 110, 6689–6735 CrossRef CAS PubMed.
| This journal is © The Royal Society of Chemistry 2020 |