
 Open Access Article
 This Open Access Article is licensed under a
 Creative Commons Attribution 3.0 Unported Licence
Nanostructure stabilization by low-temperature dopant pinning in multiferroic BiFeO3-based thin films produced by aqueous chemical solution deposition†
Carlos
Gumiel
 a,
Teresa
Jardiel
*b,
David G.
Calatayud
b,
Thomas
Vranken
c,
Marlies K.
Van Bael
c,
An
Hardy
c,
María Lourdes
Calzada
d,
Ricardo
Jiménez
d,
Mar
García-Hernández
e,
Federico J.
Mompeán
e,
Amador C.
Caballero
b and
Marco
Peiteado
ab
a,
Teresa
Jardiel
*b,
David G.
Calatayud
b,
Thomas
Vranken
c,
Marlies K.
Van Bael
c,
An
Hardy
c,
María Lourdes
Calzada
d,
Ricardo
Jiménez
d,
Mar
García-Hernández
e,
Federico J.
Mompeán
e,
Amador C.
Caballero
b and
Marco
Peiteado
ab
aPOEMMA-CEMDATIC, ETSI Telecomunicación (UPM), Madrid, 28040, Spain
bDepartment of Electroceramics, Instituto de Cerámica y Vidrio (CSIC), Madrid, 28049, Spain. E-mail: jardiel@icv.csic.es
cInstitute for Materials Research (IMO-IMOMEC), Hasselt University and imec vzw, Diepenbeek, 3590, Belgium
dInstituto de Ciencia de Materiales de Madrid (CSIC), Madrid, E-24089, Spain
eDepartamento de Materiales Para Tecnologías de la Información, Instituto de Ciencia de Materiales de Madrid (CSIC), Madrid, 28049, Spain
First published on 24th February 2020
Abstract
The metastability impediment which usually prevents the obtaining of a phase-pure BiFeO3 material can be dramatically stressed when taking the system to the thin film configuration. In order to preserve the stoichiometry, the films need to be processed at low temperatures and hence the solid-state diffusion processes which usually govern the microstructural evolution in bulk cannot be expected to also rule the development of the functional films. All these circumstances were presumed when exploring the possibilities of an aqueous solution–gel process plus spin-coating deposition method to reproduce, in thin film dimensions, the excellent multiferroic properties that have been previously observed with an optimized rare-earth and Ti4+-codoped BiFeO3 bulk composition. The experiments indicate high reliability for the tested methodology, allowing for the obtaining of homogeneous dense films at temperatures as low as 600 °C and with a tunable multiferroic response depending on the formulated rare-earth (Sm or Nd). Thorough structural characterization of the films reveals that despite the low temperature processing restrictions, effective microstructural control is achieved at the nanoscale, which is attributed to effective retention (pinning) of the dopants inside the perovskite structure of BiFeO3.
Introduction
The metastability of single-phase BiFeO3 is one of the most investigated issues within this promising material since it represents a serious obstacle to exploit its multiferroic possibilities.1–3 The different diffusion processes involved in the obtaining of an (almost) pure material with a practical response are ruled by a temperature-dependent kinetic mechanism. Eventually this leads to a very narrow stability window in terms of sintering temperature and time. In bulk, solid-state processed BiFeO3 ceramics, it has been proposed that the BiFeO3 perovskite phase is metastable with regards to the co-existent Bi2Fe4O9 and Bi25FeO39 secondary compounds in a confined range between 447 °C and 767 °C.2 In recent years, research has been conducted around this window, and recently our team came to satisfactory (functional) results upon doping the parent BiFeO3 structure with RE3+ (rare-earth) and Ti4+.3–5 Specifically, we were able to obtain bulk samples through a sequential two-step process comprising a calcination stage of synthesis and a subsequent sintering treatment, in a strict range of heating conditions which do not allow synthesis temperatures lower than 800 °C and sintering temperatures higher than 900 °C. Within these temperature limits, several solid-state diffusion processes are successively activated, which provoke first the incorporation of titanium into the perovskite lattice during the synthesis episode, and then its posterior segregation to the grain boundaries during the subsequent recrystallization stage of sintering. In this way titanium delineates the microstructure of the bulk specimen, generating an interconnected skeleton of highly-resistive Ti-rich grain boundaries that controls the macroscopic conductivity of the material and allows for improved exploitation of its ferroelectric characteristics.4 This, combined with the structure-related effect that the rare-earth produces on both the electric and the magnetic properties of the parent compound,5–9 eventually leads to a promising multiferroic behaviour with potential application in practical devices. Now the question is, is this also accessible in a thin film configuration? Certainly, from the point of view of applications, the utilization of film-based arrangements can be more realistic when it comes to miniaturization and integration into microelectronic circuits for data storage, sensors, spintronics, or visible-light photovoltaic devices.10–12 This interest has triggered stimulating research during the past decade, involving several ranges of BiFeO3 doped compositions and the assessment of new methodologies of diverse complexity,13–18 but the attained results are yet quite heterogeneous. This illustrates the magnitude of the challenge involved: the change in processing, from the fabrication of bulk specimens to the production of thin films, can dramatically modify the microstructure development and the physical properties derived from that. Specifically, interdiffusion processes within the substrate, interfacial reactions and a sizeable volatilization of components (much more critical in the film geometry) can be expected,19–22 meaning that the films are to be produced at much lower temperatures than the mentioned threshold of 800–900 °C optimized for the bulk ceramics. Thus, the issue of the stability window rises again. These low temperature restrictions imply that the thermodynamic and kinetic mechanism found in the bulk, solid-state processed material may not proceed the same in the film samples; i.e., the described diffusion mechanisms may be considerably slowed down or, even, they may not be activated at all. In this context, different low-temperature processing strategies are being investigated and, among them, those based on chemical solution deposition approaches (CSD) are especially appealing because of their intrinsic simplicity. Another advantage of CSD methods over the gas phase processes currently used in microelectronics is their lower energy consumption, which can make this approach a sustainable alternative with a view to drive climate change solutions. Dong et al. for example applied a conventional sol–gel routine to produce BiFeO3 films with a composition similar to the one investigated here, reaching remnant polarization (Pr) values of about 8.5 μC cm−2.23 Changing the dopant formulation, Liu et al. increased this polarization to 55 μC cm−2, also reporting a remnant magnetization (Mr) of about 15 emu mol−1.24 Actually, the range of multiferroic properties reported using the CSD methodology is very wide (Pr fluctuating between 3 and 77 μC cm−2, Mr between 9 and 80 emu mol−1),25–27 which in a way indicates that the mechanism by which it is possible to stabilize the perovskite phase at low temperature is not yet properly described. Accordingly, the aim of the present contribution is to address the possibility of designing microstructural development capable of controlling the multicomponent BiFeO3 system but facing the low temperature restrictions imposed by thin film processing. To achieve this, thin films with the same optimal formulation already tested in bulk RE3+ and Ti4+ co-doped BiFeO3 have been prepared by an aqueous solution–gel plus spin-coating deposition methodology.28–30 This synthesis approach allows for high control of the stoichiometry, which turns out to be critical to avoid the appearance of chemical gradients31 and even the formation of the secondary phases mentioned above. Besides, it requires no vacuum conditions nor sophisticated machinery, which, added to the fact that it proceeds in aqueous medium (conventional sol–gel processing and CSD methods alike are routinely based on metalorganic precursors in organic solvents of proven toxicity),32 further observes environmentally-benign conditions.Experimental
Materials and methods
Thin films samples with nominal composition BiFeO3 (termed hereafter as BFO), BiFe0.95Ti0.05FeO3.025 (BFTO), Bi0.88Sm0.12FeO3 (BSFO), Bi0.85Nd0.15FeO3 (BNFO), Bi0.88Sm0.12Fe0.95Ti0.05O3.025 (BSFTO) and Bi0.85Nd0.15Fe0.95Ti0.05O3.025 (BNFTO) were prepared by performing an aqueous solution–gel plus spin-coating procedure as described elsewhere.30 These specific compositions were selected on the basis of different reports in the specialized literature which catalogue them as ideal from the point of view of the multiferroic properties.5,33 The starting products used for the synthesis were bismuth(III) citrate (BiC6H5O7, 99.99%), iron(III) citrate hydrate (FeC6H5O7·H2O, 98%, 18–20% Fe), samarium(III) oxide (Sm2O3, 99.9%), neodymium(III) oxide (Nd2O3, 99.9%) and titanium(IV) isopropoxide (Ti(iOPr)4, 98+%). Extra pure ammonia (NH3, 32% in H2O), redistilled ethanolamine (C2H7NO, 99.5+%), citric acid (C6H8O7, 99%) and hydrogen peroxide (H2O2, 35 wt% in H2O, p.a., stabilized) were occasionally employed to facilitate the dissolution of each metal precursor.Synthesis of precursor solutions
The solution process consists of two steps: the preparation of each monometal solution and their subsequent combination to obtain the corresponding multimetal precursor solutions that will be spinned on the substrate. The Fe(III) and Bi(III) aqueous solutions were prepared by dissolving the required amount of the corresponding metal citrates in water. The first solution demands 80 °C to assist with the dissolving process, and the pH has to be kept below 1.5 to avoid the precipitation of unwanted species (e.g. Fe(OH)3). The Bi(III) solution instead requires the addition of ammonia and ethanolamine (the last in a 1.5![[thin space (1/6-em)]](https://www.rsc.org/images/entities/char_2009.gif) :1 molar ratio to Bi3+), in order to increase the citrate solubility and the solution stability, respectively.34 For the RE(III) aqueous solutions, the starting RE2O3 powders are mixed with citric acid (3:1 molar ratio to RE3+) and water, and refluxed overnight at 120 °C until the solid citrate is obtained. The subsequent addition of NH3 while refluxing at 110 °C/2 h eventually dissolves the citrate and results in a stable precipitate-free RE(III) solution. Finally, the Ti(IV) aqueous solution is indeed a solution of the peroxocitrato–Ti(IV) complex.28,35 This one is obtained by first hydrolyzing Ti(IV)-isopropoxide to precipitate the Ti(IV) hydroxide; the addition of a mixture of citric acid (2:1 molar ratio to Ti4+) and hydrogen peroxide (in a 1.1:1 molar ratio to Ti4+) while heating at 60 °C dissolves the precipitated hydroxide. The accurate concentration of each monometal solution was determined by ICP-AES. The multimetal solutions were then prepared with a 0.2 M concentration (25 ml) by mixing the corresponding amounts of the monometal counterparts and using ammonia to control the pH variations.
:1 molar ratio to Bi3+), in order to increase the citrate solubility and the solution stability, respectively.34 For the RE(III) aqueous solutions, the starting RE2O3 powders are mixed with citric acid (3:1 molar ratio to RE3+) and water, and refluxed overnight at 120 °C until the solid citrate is obtained. The subsequent addition of NH3 while refluxing at 110 °C/2 h eventually dissolves the citrate and results in a stable precipitate-free RE(III) solution. Finally, the Ti(IV) aqueous solution is indeed a solution of the peroxocitrato–Ti(IV) complex.28,35 This one is obtained by first hydrolyzing Ti(IV)-isopropoxide to precipitate the Ti(IV) hydroxide; the addition of a mixture of citric acid (2:1 molar ratio to Ti4+) and hydrogen peroxide (in a 1.1:1 molar ratio to Ti4+) while heating at 60 °C dissolves the precipitated hydroxide. The accurate concentration of each monometal solution was determined by ICP-AES. The multimetal solutions were then prepared with a 0.2 M concentration (25 ml) by mixing the corresponding amounts of the monometal counterparts and using ammonia to control the pH variations.
Spin-coating deposition and consolidation of the films
The multimetal precursor solutions were spin-coated at 3000 rpm for 30 s onto 1 cm2 square-shaped portions of a Pt(111)Ti/SiO2/Si substrate.22 The substrate is pretreated by cleaning the surface with a mixture of sulfuric acid and hydrogen peroxide (SPM, 4:1, H2SO4, 95–97%: H2O2, 35%), followed by a second cleaning with an ammonia–hydrogen peroxide mixture (APM, 5:1:1, H2O:H2O2:NH3).29 Aiming for the deposition of uniform films with an optimum thickness, up to eight deposition steps were conducted (8-layered films); fewer depositions have been seen to strongly affect the stabilization of the perovskite phase, eventually producing a large quantity of secondary phases,22 whereas a higher number of depositions can ultimately lead to micro-cracks due to residual stress between layers.36 After each individual deposition, the layers are heated on hot plates to remove the residues of ethanolamine, ammonia and citric acid, as well as other as-formed organics and water remnants that may be trapped in the deposited films. According to thermo-gravimetric analyses this drying + pyrolysis treatment should be done in three different steps: 95 °C/1 min, 260 °C/1 min and 460 °C/1 min.30 At the end of the eighth deposition–heating sequence, a last hot-plate thermal annealing at 600 °C/1 h is applied to the whole array to crystalize and consolidate the films. Up to 5 films were prepared for each of the six compositions under study and in all cases homogeneous films with uniform morphology and thickness over the entire substrate were obtained. The routine XRD and SEM analyses revealed no appreciable differences between films of the same composition.
Characterization techniques
ICP-AES was used to disclose the precise concentration of each monometal solution. Measurements were carried out on Optima 3000 equipment, PerkinElmer. X-ray diffraction (XRD) was used to study the phase composition in the consolidated film samples. Patterns were collected between 2θ = 15° and 2θ = 65°, in steps of 0.015° and with a counting time of 0.5 s per step, on a Bruker D8 Advance diffractometer using CuKα radiation. Further structural differences within the films were investigated by grazing-incidence diffraction analyses (GID) collected from selected areas of the XRD patterns; the GID data were taken for incidence angles of 0.3°, 0.5°, 0.7° and 1°. These measurements were used to also estimate the crystallite size by specifically applying the Scherrer equation to the 012 reflections. Raman studies were conducted on a spectrometer (In Via Renishaw plc.) with an excitation wavelength of 514 nm. The samples were focused with a 50× magnification objective and the 100–700 cm−1 spectral range was evaluated acquiring 10 scans for each sample. UV-vis diffuse reflectance spectroscopy (DRS UV-vis) was carried out on an Analytik-Jena Specord 200 plus spectrometer equipped with an integrating sphere. Field emission scanning electron microscopy (FESEM) was employed to characterize the main microstructural features of the films on the as prepared and chemically etched samples (aq. diluted HCl); a cold FESEM Hitachi S-4700 microscope was used for that purpose. For the electrical characterization, capacitive contacts with a diameter size around 100 μm were fabricated by sputtering gold electrodes on the film surfaces. Hysteresis loops were measured at −133 °C (140 K) with a home-built system. A HP-8116A pulse generator was used to apply sinusoidal voltage waves at 1 kHz. The loops were traced with a Tektronix TDS520 oscilloscope. Non-switching contributions were calculated by a fitting procedure that simulates the linear contributions with the capacitance and resistance of the films, and the nonlinear leakage contribution.27 In the case of the ferromagnetic measurements, magnetic field (M–H) hysteresis loops at 4 and 300 K were measured in the films, using a superconducting quantum interface device magnetometer from Quantum Design, with a 5-Tesla coil. The magnetic field was applied parallel to the film surface and the diamagnetic contributions from the substrate were eliminated by fitting the high field data to a straight line with a negative slope. The thermal dependence of the magnetization upon zero field cooling (ZFC) and field cooling (FC) conditions was measured using the same equipment. For all the tested compositions, the measurement uncertainties were below 15% for the remnant polarization and below 5% for the magnetization values. Both the electrical and the magnetic measurements were repeated with a three-month interval without leading to any change in the observed multiferroic performance.Results
Microstructural and structural characterization of the films
Systematic characterization using the FESEM microscope was first performed to reveal the morphology and the main microstructural features of the films. This is summarized in Fig. 1, where representative micrographs corresponding to several of the consolidated films are displayed. In all cases, homogeneous thin films are obtained which have a uniform morphology over the entire substrate. Some of the micrographs have been taken with a certain degree of tilting and further show that no clusters of agglomerated material, nor discontinuities or any type of sizeable macroscopic defects, are ever produced at the surface of the films (Fig. 1a). This happens independently of the specific film composition, which evidences the robustness and high reproducibly of the solution + deposition process. An average thickness of ca. 250 nm is measured for all the consolidated films, Fig. 1a, d and e; this value is directly estimated from the FESEM micrographs using an Image Analyzer (Leica), after collecting up to twenty measurements per sample on different areas of the film. The individual layers constituting the films (the 8 depositions) cannot be differentiated in the cross-section images, and neither are any of the above mentioned secondary phases observed. For example, Pavlovic et al.,22 working with this same aqueous methodology to deposit a pristine BiFeO3 composition, reported the formation of big square-like shape grains crossing the whole thickness of the film, from the substrate to the surface; these grains were ascribed to the Bi2Fe4O9 mullite phase, and their occurrence was observed when applying annealing treatments above 600 °C. The top-view images of the sintered etched surfaces (Fig. 1b and c) further give an indication of the absence of secondary phases in the samples: all the prepared films exhibit a uniform, crack-free surface texture comprising just one type of grains, with no trace of the mentioned big square grains of mullite, nor of those characteristic of the Bi25FeO39 sillenite compound (these other grains typically display a brighter white coloration in secondary-electron SEM images,3,22 which is also not seen here). The imaging analyses of these pictures evidence an average grain size below 100 nm, this again being measured for all the compositions under investigation. | ||
| Fig. 1 Selected FESEM images of the thin films obtained via aqueous chemical solution deposition: (a) cross-sectional view of the BSFO film; (b and c) micrographs taken from the top surface of the BSFTO etched film; and (d and e) cross-sectional view of the BNFTO etched film. | ||
The XRD patterns of the films right after the consolidation step at 600 °C/1 h initially exposed the same phase distribution for all the tested compositions. Fig. 2 shows two of these representative patterns, the one corresponding to the co-doped BNFTO film and that of the undoped BFO sample. As observed, the reflections of BiFeO3 are obtained and all belong to its R3c rhombohedral structure, ICDD file no. 071-2494. These peaks are accompanied by a strong reflection corresponding to the (111) oriented platinum of the substrate, which eventually results in a poor peak intensity to background ratio collected in the patterns. All the doped compositions evidence a significant displacement of the BiFeO3 diffraction maxima to higher angles (lower d values), pointing towards a distinctive incorporation of the dopants into the perovskite lattice (see Fig. S1 in the ESI†). Additional structural information was extracted from the GID analyses that were performed focusing on the R3c peak detected within the 2θ range between 45 and 48°. The angle of incidence was varied from 0.3 to 1°. Fig. 3 shows the results corresponding to the two co-doped systems, the BSFTO and the BNFTO compositions. In both cases the intensity of the BiFeO3 peak gradually decreases as the incidence angle is decreased, agreeing with lower penetration in the film. In the BSFTO film, this eventually leads to a complete disappearance of any diffraction peak (Fig. 3a), but in the BNFTO sample it goes together with the entrance of a new maximum around 2θ = 47.5° which must be ascribed to the orthorhombic Pbam phase of BiFeO3.5 This different scenario is nevertheless not surprising and relates to the specific formulation used for the two co-doped compositions. On one hand, the BSFTO sample was formulated with 12 mol% of samarium, which places this composition right on the edge of a theoretical morphotropic phase boundary (MPB);33 this is found to render an enhancement of the electromechanical (piezoelectric) properties of the material and, actually, in the particular case of Sm-modified BiFeO3 ceramics it has been observed that such enhancement could be quite significant in the vicinity of the MPB (i.e., with no need to be inside the MPB itself).37,38 The absence of any diffraction maximum other than the rhombohedral R3c peak in the pattern of Fig. 3a, certainly denotes that we have not reached the MPB in the BSFTO formulated material.
 | ||
| Fig. 2 XRD patterns of the BNFTO and the BFO thin film samples after the crystallization treatment at 600 °C/1 h. Squares are assigned to the R3c BiFeO3 phase while the triangle corresponds to the substrate signal. The d values of the R3c BiFeO3 phase are shown in both patterns. | ||
 | ||
| Fig. 3 GID-XRD measurements of the BSFTO and the BNFTO co-doped compositions as taken for different incidence angles in the 2θ region between 45 and 48° (films consolidated at 600 °C/1 h). The red arrow in the pattern of the BNFTO sample indicates the detection of the Pbam phase of BiFeO3 for an incidence angle of 0.3°. | ||
On the other hand, the BNFTO sample was formulated with 15 mol% of neodymium; this now falls within the postulated MPB for the isovalent substitution of bismuth for neodymium,39,40 and hence the presence of both R3c and Pbam peaks in the pattern of Fig. 3b is consistent. It should be noticed however that the Pbam phase is only detected at the film surface (an incidence angle of 0.3°); this circumstance should be attributed to a substrate clamping effect, i.e. clamping due to a mismatch in the thermal expansion coefficient with the substrate, which is suppressing the R3c-Pbam phase transition at the interface.41 Finally, X-ray measurements were also used to estimate the crystallite size. In all cases values around 50–60 nm were obtained in spite of the different formulations under investigation.
The structural analysis of the films was completed by Raman spectroscopy. The theoretical Raman active modes of the rhombohedral phase of BiFeO3, R3c space group, can be summarized as the irreducible representation Γ = 4A1 + 9E,42 which, within the frequency range under analysis here, shall give rise to a maximum of 12 peaks in the spectrum. Our measurements are depicted in Fig. 4; the peak position of each mode being revealed by fitting the measured spectra and decomposing the fitted curves into individual Gaussian components. This peak positions are all displayed in Table 1.
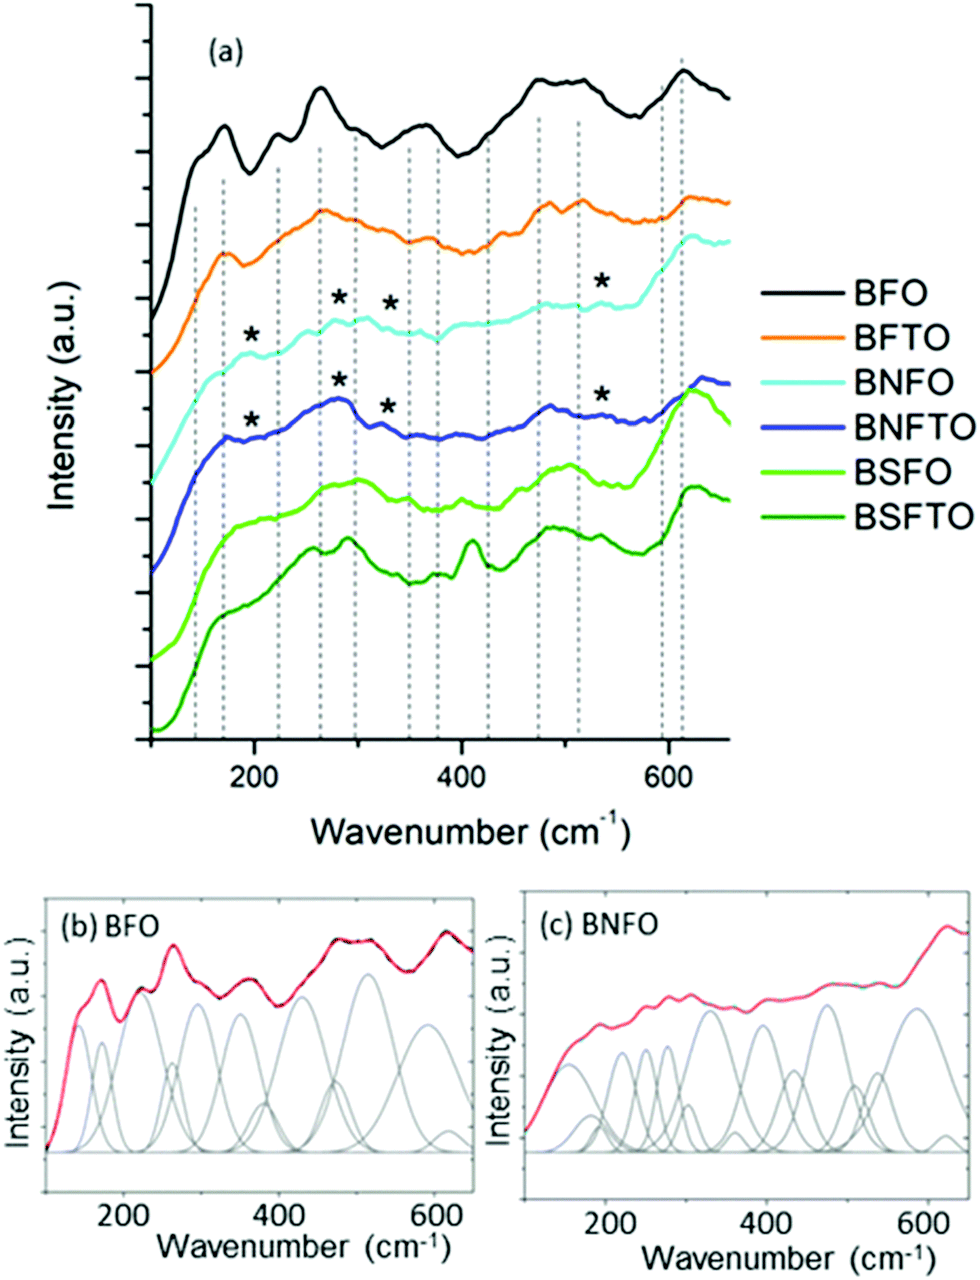 | ||
| Fig. 4 Raman spectra as collected from the consolidated films. All compositions crystallize within the R3c rhombohedral structure of BiFeO3, but some extra peaks corresponding to the Pbam orthorhombic phase are also detected for the Nd-containing compositions (marked with an asterisk). The peak position of each Raman active mode is revealed by conducting an accurate deconvolution of the measured spectra, as shown in the two representative patterns below (the R2 values being 0.9984 and 0.9995 for the BFO and the BNFO sample, respectively). | ||
| Symmetry assignmenta | BFO (wavenumber) | BFTO (wavenumber) | BNFO (wavenumber) | BSFO (wavenumber) | BNFTO (wavenumber) | BSFTO (wavenumber) |
|---|---|---|---|---|---|---|
| a The A1 and E modes all corresponding to the R3c space group. | ||||||
| A1(1) | 142 | 134 | 157 | 150 | 136 | 155 |
| A1(2) | 172 | 170 | 182 | 180 | 178 | 179 |
| Pbam | — | — | 192 | — | 206 | — |
| A1(3) | 221 | 218 | 221 | 223 | 234 | 240 |
| E | 263 | 265 | 250 | 273 | 253 | 257 |
| Pbam | — | — | 276 | — | 272 | — |
| E | 295 | 298 | 303 | 308 | 291 | 289 |
| E | 350 | 324 | 329 | 341 | 320 | 336 |
| Pbam | — | — | 360 | — | 360 | — |
| E | 380 | 368 | 397 | 372 | 395 | 378 |
| E | 430 | 438 | 434 | 400 | 440 | 408 |
| A1(4) | 472 | 478 | 475 | 451 | 483 | 448 |
| E | 514 | 513 | 509 | 498 | 506 | 492 |
| Pbam | — | — | 537 | — | 527 | — |
| E | 591 | 578 | 585 | 570 | 572 | 535 |
| E | 618 | 620 | 623 | 622 | 621 | 620 |
| R 2 fitting | 0.9984 | 0.9985 | 0.9995 | 0.9992 | 0.9990 | 0.9990 |
The results initially indicate that all compositions crystallize with a rhombohedrally distorted perovskite structure with the mentioned R3c space group. The specific bands of the Bi2Fe4O9 and Bi25FeO39 phases (as, for example, identified by Bernardo et al.)43 cannot be detected, again validating the competence of the processing approach to prevent the formation of secondary phases in the crystallized films. The BNFO and the BNFTO films besides show the presence of some extra peaks at approximately 192, 276, 360 and 537 cm−1 (marked with an asterisk in Fig. 4a). The specialized literature ascribes these peaks to the orthorhombically distorted Pbam phase of BiFeO3,41,44 which is in consonance with the mentioned existence of an MPB in the Nd-containing compositions. But, moreover, a number of subtle changes can be observed between the collected spectra which can also provide some valuable information on the specific incorporation of the formulated dopants. For example, focusing again on the structural parameters of the R3c phase, the first-order phonons are typically confined below 600 cm−1, with the most characteristic features being four sharp peaks at approximately 142, 172, 221 and 263 cm−1 (BFO undoped sample, Table 1). Among them, the low-frequency Raman modes below 170 cm−1 are associated with the Bi atoms, while the median frequency modes between 170 and 260 cm−1 relate to the Fe atoms;44 the Raman modes above 260 cm−1 mainly correlate to oxygen motions.44 Upon doping with Sm or Nd all these features however appear broadened and with a decreasing relative intensity, in a process which might be caused by the structural disorder resulting from the random substitution of the rare-earth at the A-sites of the perovskite lattice, and the concurrent lattice distortion induced by the ionic size mismatch. Moreover, as the amount of dopant is increased, the A-site substitution dilutes the stereochemical activity of the Bi lone electronic pair and eventually induces a change of the Bi–O covalent bonds and the Bi–O bond distance;45 this leads to a decrease in the Raman scattering intensity and a broadening in the width of the Raman modes and it can also produce a shift in wavenumber of the Raman modes, particularly in the low frequency ones.46 This is exactly what we observe in our film samples, where the A1(2) mode shifts to higher frequencies upon doping with the rare-earths: 172 cm−1 for BFO, 180 cm−1 for BFSO and 182 cm−1 for BFNO, see Table 1; it should be noticed that the increase in frequency is in agreement with the lower mass of the Sm3+ and Nd3+ ions.45 On the other hand, the effect of the Ti-doping can be better inferred when looking at the relative intensity of the vibrational mode near 220 cm−1, which is assigned to the A1(3) tilt mode of the FeO6 octahedra.44,47 Although the local FeO6 octahedral environment can be affected by both the doping in A- or B-sites, a direct modification of the Fe–O interactions by a B-site substitution would certainly have a more pronounced effect on this vibrational mode. In our films, the decrease in the relative intensity for this A1(3) tilt mode is more pronounced for the Ti-containing compositions, pointing to a sizeable incorporation of titanium into the B-sites of the perovskite lattice.
Finally, a series of UV-vis spectroscopy measurements were conducted to further provide information on how the electronic structure of BiFeO3 is modified upon doping, this being essential for elucidating the specific mechanisms governing the microstructural development of the low-temperature processed films. Fig. 5 shows the UV-visible absorption spectra of all the tested samples. BFO has a rhombohedral structure (C3v), so considering a C3v local symmetry of Fe3+ ions (3d5 – high spin configuration; t32ge2g) and using the correlation group and subgroup analyses for the symmetry breaking from Oh to C3v, up to six d–d transitions can be expected over 410 eV.48,49 In our measurements, the BFO undoped film exhibits a couple of bands centered at 440 nm and 923 nm. Both can be ascribed to 6A1g → 4T2g excitations which arise from the d–d crystal field excitations of Fe3+ ions, and although formally these are forbidden excitations (since they change the total spin of Fe3+), spin orbit coupling eventually relaxes the spin selection rule and allows for them to be produced.50 Below 400 nm, the spectrum also displays a shoulder around 360 nm which is assigned to the charge transfer (CT) excitation between O 2p and Fe 3d.51 According to Fig. 5, these same absorption bands are initially detected for the BFTO, the BNFO and the BSFO monodoped compositions, although they are distinctly shifted from those of the undoped material; moreover, the shifting is observed to occur in an opposite way and whereas the bands of the BFTO sample shift towards the blue, in the RE-monodoped films a red-shift is instead produced, which is more pronounced for the composition containing neodymium. In the BNFTO and the BSFTO co-doped samples an intermediate displacement is eventually observed, which is likely to result from the combined effect of both dopants. As mentioned, all these band shifts are essentially due to changes in the electronic structure of the parent BiFeO3. The position of the d–d transitions strongly depends on the Fe–O bond length, the site symmetry and the Fe–O–Fe exchange interaction, and, for example, by means of a pressure-induced spectroscopy study Gómez-Salces et al. have also reported a redshift in the 6A1g → 4T2g transition for pure BiFeO3.52 In our films, the isovalent Bi3+-substitution which is provoked upon RE3+ doping would produce a similar effect: the smaller RE ions, causing a contraction of the unit cell (XRD confirmed), would increase the internal chemical pressure of the lattice, this leading to the observed red-shift;52 the FeO6 local environment is even more affected in the particular case of the Nd-containing compositions, due to the octahedral symmetry breaking from C3v to D2h (MPB formulation), which leads to the coexistence of an orthorhombic phase, so the band displacements are even more pronounced. On the other hand, the blue-shift observed upon Ti-doping is far more difficult to explain since several factors can be exerting an influence (non isovalent B-site substitution). This goes beyond the scope of this work, but yet we can collect relevant information here: the existence of significant band shifting in the Ti-containing samples is itself indicative of a wide-ranging incorporation of the dopant (Ti-ion substitution) into the perovskite lattice.
 | ||
| Fig. 5 UV-visible absorption spectra of the thin film compositions after the crystallization stage at 600 °C/1 h. | ||
Multiferroic properties
The measurement of the electrical capacitance and the dielectric loss was carried out on each of the capacitors fabricated on the films by the sputtering of small top electrodes on the film surface. Only in those capacitors where low dielectric losses are observed is the measurement of the ferroelectric hysteresis behavior possible, and, for example, the high leakage currents exhibited by the undoped BFO films impede any electrical characterization of this particular composition. In the doped films, a non-switching contribution was found for the compositions without titanium in the starting formulation, so eventually the obtaining of representative P–E and J–E hysteresis loops was only possible in the Ti-doped compositions, even though at room-temperature the conductivity of the films is still too high and so the ferroelectric characterization has to be done at low temperature, under liquid nitrogen. Specifically, we found that at ∼140 K the non-switching leakage contributions are minimized, allowing the application of an increasing electric field to the film before the electric breakdown. Fig. 6 thus shows the P–E and J–E loops measured for the BFTO, the BNFTO and the BSFTO films. The pure ferroelectric switching of each loop (depicted in blue), which is obtained after subtracting the non-switching contribution from the experimental loop (depicted in black), shows the corresponding values of the remnant polarization (Pr) and the coercive field (Ec). These have been listed in Table 2. Interestingly, while both the BFTO and the BNFTO compositions display quite similar polarization (15 and 12 μC cm−2, respectively), this value is doubled for the Sm,Ti co-doped thin film, ∼27 μC cm−2. Fig. 7 compares the P–E hysteresis loops for the three materials as measured at 140 K.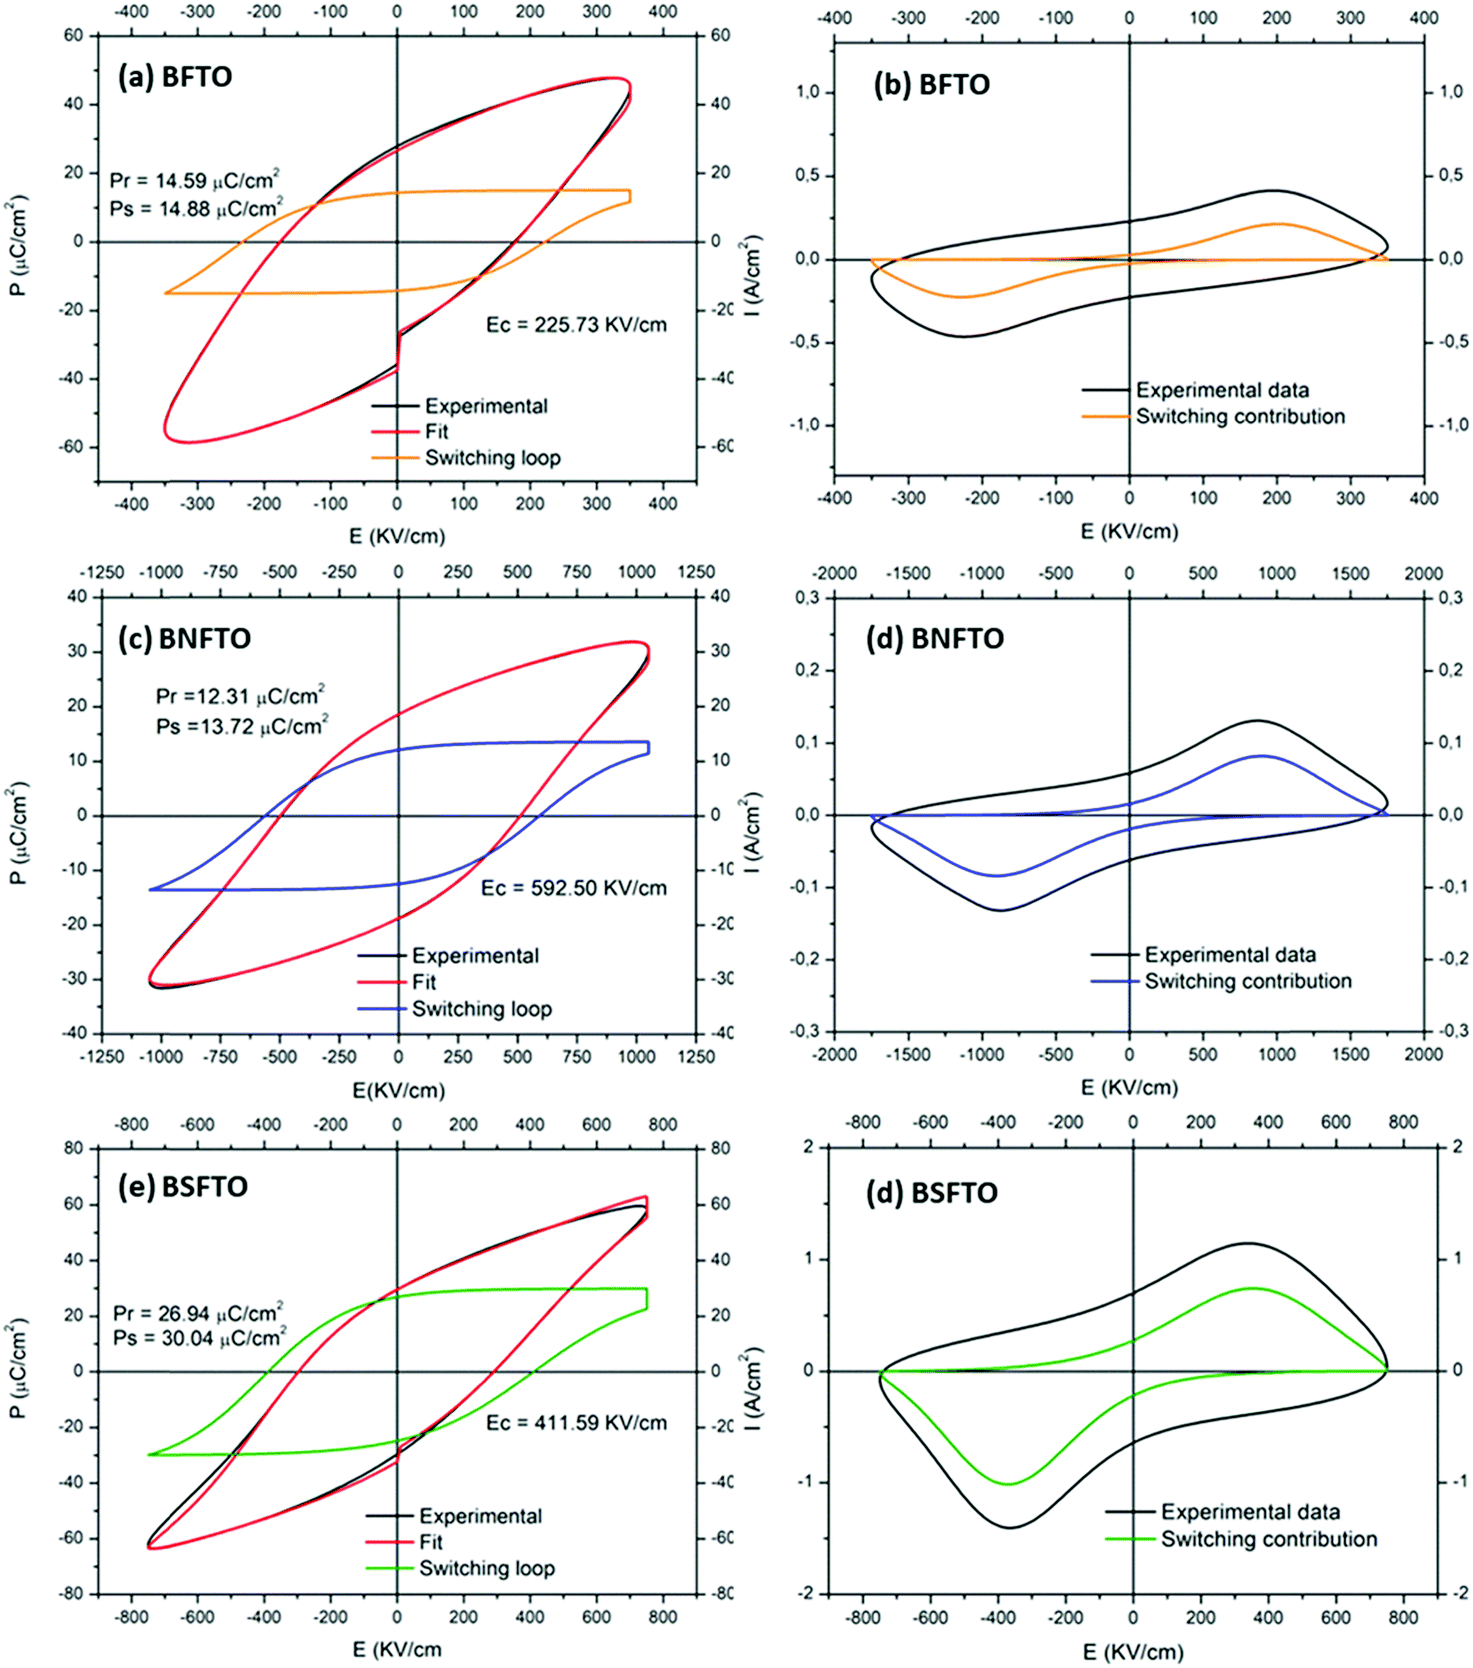 | ||
| Fig. 6 (a, c, and e) P–E and (b, d, and f) J–E hysteresis loops of the Ti-containing films rendering an effective switching contribution. Measurements were conducted at 140 K. | ||
| Nominal composition | P r+ (μC cm−2) | P r− (μC cm−2) | P s (μC cm−2) | M r+ (emu mol−1) | M r− (emu mol−1) |
|---|---|---|---|---|---|
| BFTO | 15 | −14 | 15 | — | — |
| BSFTO | 27 | −25 | 30 | 47 | −50 |
| BNFTO | 12 | −12 | 14 | 77 | −79 |
 | ||
| Fig. 7 P–E hysteresis loops of the three films including titanium in the starting formulation (as measured at 140 K). | ||
Regarding the ferromagnetic response, Fig. 8 shows the M–H hysteresis loops taken at 4 K for the co-doped compositions (the BNFTO and the BSFTO films), both exhibiting magnetic ordering. The same measurements at room temperature revealed a similar ferromagnetic tendency, although the hysteresis loops show a considerably smaller coercive field (not shown here). At low temperature, the materials, as expected, have all evolved to a more robust ferromagnetic ordering, since the system is less thermally disordered. Nevertheless, no saturation magnetization was ever achieved for any of the tested samples (not even at 5 Tesla), which indicates the existence of an intrinsic magnetic disorder in the films. The values of the remnant magnetization are listed in Table 2. As observed, the composition containing neodymium exhibits a better ferromagnetic response (higher magnetization) than the one doped with samarium, in a tendency which just opposes what was observed for the ferroelectric properties. Finally, the thermal dependence of the magnetization upon ZFC and FC conditions was analyzed for the two co-doped materials. As shown in Fig. 9, both samples evidence a certain degree of irreversibility that increases at low temperatures, which confirms the existence of the intrinsic magnetic disorder revealed by the unsaturated hysteresis loops.
 | ||
| Fig. 8 M–H hysteresis loops of the BNFTO and the BSFTO co-doped thin films. Measurements done at 4 K. | ||
 | ||
| Fig. 9 Thermal dependence of magnetization upon ZFC and FC for the two co-doped films: (a) BSFTO and (b) BNFTO. The structural transition observed at 60–70 K for the BNFTO sample is related to the MPB formulation of this particular formulation (see Fig. S2 in the ESI†). | ||
Interestingly, the BNFTO co-doped sample exhibits a structural transition around 60 K which is not produced in the Sm-containing composition. As described, the BNFTO material was formulated with 15 mol% of neodymium to fall within the corresponding MPB range, and so the synthesized film contains a mixture of the R3c and Pbam phases of BiFeO3 (confirmed by the XRD-GID and the Raman analyses, Fig. 2b and 4a). In this frame, the observed transition in the FC–ZFC curves of the BNFTO sample could be related to the elimination of one of these two phases.
We have confirmed this issue by preparing a BNFTO film formulated out of the MPB, specifically containing 12 mol% of neodymium; the GID analyses of this film confirmed the absence of the Pbam phase (no MPB) and no structural transition was observed in the corresponding FC–ZFC curves (see Fig. S2 in the ESI†).
Discussion
The structural characterization performed on the consolidated films indicates that the metastability burden which usually prevents the obtaining of single-phase BiFeO3 in bulk materials can be also eluded in the film configuration.As in the case of the analogous bulk ceramic samples, this is largely linked to the ability of controlling the thermally-activated diffusion processes that trace the microstructural development of the system; however, the low temperature restrictions imposed by thin film processing necessarily make the underlying mechanisms quite different in the film specimens. The difference is particularly significant for the compositions doped with titanium, whose presence is anyhow essential to harvest the multiferroic response of single-phase BiFeO3. Both the Raman and the UV-vis structural analyses indicate that the formulated titanium ions stay largely incorporated inside the perovskite crystal lattice of the consolidated films. This can be attributed to the aqueous solution–gel + deposition methodology here practiced, which somehow quenches this titanium inside the BiFeO3 perovskite structure from the very beginning of the ferrite formation. The process may progress as follows: during the first drying treatment of the film at 95 °C most of the water evaporates, leading to the formation of a homogeneous citrate precursor gel that consists of a tridimensional network of citrate ligands coordinated to the metal ions.34 Like the other cations, the added Ti4+ ions are trapped within this network. During the subsequent pyrolysis/decomposition heat treatments at 260 and 460 °C, the decomposition of the citrate ligands gives rise to the formation of metal oxide bonds,30 but the temperature is yet too low and the time on the hot plate too short (1 minute steps) that no titanium is susceptible to diffuse out from the BiFeO3 structure under formation. The last treatment of crystallization consolidates the material, but it does not change the situation meaningfully: Ti4+ ions are known to have poor inertia to diffuse53 and the 600 °C/1 h of the consolidation stage still provide not enough energy for them to leave the perovskite lattice. Now this scenario makes a big difference with the solid-state processed ceramic counterparts and it mainly affects the conductivity of the sintered specimens. As described, in the bulk samples the formulated titanium ions segregate to the grain boundaries as the temperature rises, until they form a highly resistive Ti-rich interconnected skeleton that neatly reduces the conductivity of the material.4,5 In the films, on the contrary, this titanium stays confined in the perovskite structure, no such skeleton of Ti-enriched boundaries is ever formed, and as a direct consequence the conductivity is not sufficiently restrained: at room temperature, some leakages are still present in the films, which initially hinders the exploitation of their ferroelectric potential. This impediment however disappears when the ferroelectric response of the films is measured at liquid nitrogen temperatures. At such low temperatures, an increase is produced in the barrier height for detrapping charges (i.e., charge pinned at the grain boundaries, domain walls, or the metal–ferroelectric interfaces)20,27,54 and as a consequence a significant decrease in the leakages is observed.
Multiferroic performance of the BiFeO3 doped films
Once the issue with the leakages is restrained at low temperatures, the ferroelectric characterization of the films evidences strong polarization for the Ti-containing compositions, which reaches the highest value for the Sm,Ti co-doped BiFeO3 film (BSFTO, Fig. 7). As indicated, the two RE,Ti co-doped materials were initially formulated to make the most (functionally speaking) of the structure-related benefits provided by a composition on a morphotropic phase boundary, the BNFTO system, or in its vicinity, BSFTO. The biggest benefits would actually be expected for RE mono-doped BiFeO3 and, indeed, our work with bulk samples already showed that co-doping with titanium can significantly disturb the regular formation of the MPB postulated relations. In the films this is further stemmed by the mechanical constraints induced by the substrate in the film structure,41 particularly for the Nd co-doped film, which, as shown by the XRD analyses, displays a different bottom-to-top distribution of the MPB phases (Fig. 2b). This asymmetrical evolution of the MPB solid solution may probably explain why the ferroelectric performance of the Ti-doped composition is not improved upon co-doping with neodymium (Fig. 7 and Table 2), but some other factors should be causing the observed differences between compositions. For example, as a single-phase Type I multiferroic material, the ferroelectric properties of doped-BiFeO3 are directly proportional to the degree of distortion of its rhombohedral structure.55,56 Actually, it is well documented that rare-earth doping produces a gradual decrease of the rhombohedral distortion of the BiFeO3 parent compound, in a process which is associated with the decrease in the stereochemical activity of the A-site cation with a lone pair (the 6s electrons in Bi).57 This evolution can be followed by X-ray diffraction, provided that the characteristic double hkl reflection profile of the R3c phase in the undoped compound converges into a single hkl reflection in the doped material. In our previous experiments with bulk ceramics5 we have easily identified this convergence in the 2θ range between 31° and 34°. Accordingly, we conducted a new set of GID analyses of the films focusing on this specific region and the results initially showed the presence of a single reflection for all the tested compositions. That includes the BFO undoped material, and should be attributed to the film growth process itself (crystal structure, preferred orientation, stress state, etc.). However, when running a standard deconvolution of those solitary peaks, the patterns of the BNFTO and the BSFTO co-doped films do effectively show the mentioned double reflection, see Fig. 10. The distance Δ2θ between the two disclosed peaks is nevertheless different. It is bigger for the BSFTO composition, so indicating that this material exhibits the lower decrease of the rhombohedral distortion, i.e., it keeps a higher distortion of the rhombohedral structure and, consequently, its ferroelectric polarization reaches a higher value (Fig. 7 and Table 2). | ||
| Fig. 10 Deconvolution of the BiFeO3R3c peak in the 2Θ region between 31 and 33° for the two co-doped materials (films crystallized at 600 °C/1 h). The XRD patterns were registered with a grazing angle of 1°. | ||
But, moreover, such a relation between the rhombohedral distortion of the R3c phase and the functional properties of BiFeO3 also extends to its ferromagnetic performance, although in the very opposite way. Recently, it has been shown that the magnetic properties are inversely proportional to the degree of rhombohedral distortion,58 implying that magnetization curves of samples with a low-distorted rhombohedral structure show higher magnetic saturation and remanent magnetization. The incorporation of dopants in the A- and the B-sites of the perovskite structure induces a change in the Fe–O–Fe bond and the angle which may be advantageous for the magnetic properties: due to the spin canted structure of BiFeO3,59 an expansion of the Fe–O–Fe angle can eventually suppress the spin spiral modulation and a net magnetic moment can therefore be obtained.60,61 In this frame, working with a Ba-doped BiFeO3 system, Rojas-George and co-workers have performed comprehensive Rietveld analyses which further evidence how the Fe–O–Fe angle increases as the distortion of the R3c rhombohedral structure is decreased, this leading to an increased magnetic moment.58 In our film samples, that is the case of the BFNTO sample (Fig. 8 and Table 1), i.e. the same one that rendered the lowest polarization of the two co-doped compositions. Indeed, driven by a structure-related condition, these results essentially confirm what is characteristically expected for a single-phase multiferroic system like BiFeO3: physical constraints associated with the simultaneous existence of ferroelectricity and ferromagnetism in a sole single-phase material make a compromise necessary between the magnitude of both ferroic orders, meaning that the output of one of them can seriously affect that of the other (even provoking its cancellation in the worst-case scenario).
Conclusions
The intrinsic metastability of the BiFeO3 perovskite largely hinders it being obtained as a single-phase material and yet prevents its practical exploitation in multiferroic-based applications. The situation is further stressed when jumping to the thin film configuration, provided that both the processing conditions and the presence of a substrate critically assist the crystallization of the – thermodynamically stable – mullite secondary phase. Here, we have overcome these two impediments by combining a suitable formulation of dopants with a straightforward solution deposition methodology that not only allows the low-temperature stabilization of the perovskite phase, but also provides a genuine route to pertinently tune its multiferroic characteristics. On one hand, the incorporation of a donor dopant such as titanium first leads to a significant reduction of the material's leakage current, which thus permits an effective release of its ferroelectric response. No interaction is ever observed with this dopant and the rare-earth ions formulated to amplify the multiferroic properties of the perovskite phase, which shall be attributed to the exceptionally soft conditions of the processing protocol. The whole process is conducted in water, no vacuum settings nor sophisticated equipment is required, and a maximum temperature of 600 °C is applied for one hour to nevertheless achieve effective control of the microstructure at the nanoscale. Comprehensive characterization of the main structural and microstructural features of the obtained films reveals that the underlying mechanism behind this improved microstructural control at low temperature is related to the ability to retain (pin) the dopants inside the BiFeO3 perovskite structure since the very beginning of the ferrite formation in the film. This avoids extensive diffusion or segregation of the dopants, titanium in particular, to the grain boundaries and/or the film interfaces, and further facilitates the stabilization of the parent perovskite compound against the formation of unwanted secondary phases. As a consequence, single-phase BiFeO3-based thin films are feasibly obtained in aqueous media, under mild processing conditions, and showing a relevant multiferroic response for practical applications.Conflicts of interest
There are no conflicts to declare.Acknowledgements
This work was supported by the Spanish Ministry of Science, Innovation and Universities (MICINN) under projects MAT2016-80182-R, MAT2017-87134-c2-2-R and partially by the project MAT2016-76851-R. It was also supported by the Research Foundation Flanders (FWO-Vlaanderen), project number G039414N. Dr T. Jardiel acknowledges the European Science Foundation (ESF) and the Ramon y Cajal Program of MICINN for the financial support. Work by Dr Calatayud was also supported by Fundación General CSIC (COMFUTURO Program). We acknowledge support of the publication fee by the CSIC Open Access Publication Support Initiative through its Unit of Information Resources for Research (URICI).Notes and references
- M. Valant, A. K. Axelsson and N. Alford, Chem. Mater., 2007, 19, 5431 CrossRef CAS.
- S. M. Selbach, M. A. Einarsrud and T. Grande, Chem. Mater., 2009, 21, 169 CrossRef CAS.
- M. S. Bernardo, T. Jardiel, M. Peiteado, A. C. Caballero and M. Villegas, J. Eur. Ceram. Soc., 2011, 31, 3047 CrossRef CAS.
- M. S. Bernardo, T. Jardiel, M. Peiteado, F. J. Mompeán, M. García-Hernández, M. A. García, M. Villegas and A. C. Caballero, Chem. Mater., 2013, 25, 1533 CrossRef CAS.
- C. Gumiel, T. Jardiel, M. S. Bernardo, P. Villanueva, U. Urdiroz, F. Cebollada, C. Aragó, A. C. Caballero and M. Peiteado, Ceram. Int., 2019, 45, 5276 CrossRef CAS.
- V. A. Khomchenko, L. C. J. Pereira and J. A. Paixão, J. Appl. Phys., 2014, 115, 164101 CrossRef.
- D. Arnold, IEEE Trans. Ultrason. Eng., 2015, 62, 62 Search PubMed.
- B. Xu, D. Wang, J. Íñiguez and L. Bellaiche, Adv. Funct. Mater., 2015, 25, 552 CrossRef CAS.
- J. Walker, H. Ursic, A. Bencan, B. Malic, H. Simons, I. Reaney, G. Viola, V. Nagarajan and T. Rojac, J. Mater. Chem. C, 2016, 4, 7859 RSC.
- R. Ramesh and N. A. Spaldin, Nat. Mater., 2007, 6, 21 CrossRef CAS PubMed.
- S. Y. Yang, J. Seidel, S. J. Byrnes, P. Shafer, C. H. Yang, M. D. Rossell, P. Yu, Y. H. Chu, J. F. Scott, J. W. Ager, L. W. Martin and R. Ramesh, Nat. Nanotechnol., 2010, 5, 143 CrossRef CAS PubMed.
- J. C. Yang, Q. He, P. Yu and Y. H. Chu, Annu. Rev. Mater. Res., 2015, 45, 249 CrossRef CAS.
- W. H. Kim, J. Y. Son and H. M. Jang, ACS Appl. Mater. Interfaces, 2014, 6, 6346 CrossRef CAS PubMed.
- W. Sun, J. F. Li, Q. Yu and L. Q. Cheng, J. Mater. Chem. C, 2015, 3, 2115 RSC.
- I. Bretos, R. Jimenez, D. Perez-Mezcua, N. Salazar, J. Ricote and M. L. Calzada, Adv. Mater., 2015, 27, 2608 CrossRef CAS PubMed.
- M. Tomczyk, I. Bretos, R. Jiménez, A. Mahajan, E. V. Ramana, M. L. Calzada and P. M. Vilarinho, J. Mater. Chem. C, 2017, 5, 12529 RSC.
- I. S. Golovina, M. Falmbigl, A. V. Plokhikh, T. C. Parker, C. Johnson and J. E. Spanier, J. Mater. Chem. C, 2018, 6, 5462 RSC.
- Q. Zhang, H. H. Huang, D. Sando, M. Summers, P. Munroe, O. Standard and N. Valanoor, J. Mater. Chem. C, 2018, 6, 2882 RSC.
- S. Yakovlev, J. Zekonyte, C. H. Solterbeck and M. Es-Souni, Thin Solid Films, 2005, 493, 24 CrossRef CAS.
- M. L. Calzada, R. Jiménez, A. González, J. García-López, D. Leinen and E. Rodríguez-Castellón, Chem. Mater., 2005, 17, 1441 CrossRef CAS.
- M. Popa, S. Preda, V. Fruth, K. Sedlácková, C. Balázsi, D. Crespo and J. M. Calderón-Moreno, Thin Solid Films, 2009, 517, 2581 CrossRef CAS.
- N. Pavlovic, J. D’Haen, H. Modarresi, A. Riskin, C. De Dobbelaere, M. J. Van Bael, K. Temst, A. Hardy and M. K. Van Bael, J. Mater. Sci., 2015, 50, 4463 CrossRef CAS.
- D. Hong, S. Yu and J. Cheng, Curr. Appl. Phys., 2011, 11, S255 CrossRef.
- W. Liu, G. Tan, X. Xue, G. Dong, H. Ren and A. Xia, Ceram. Int., 2014, 40, 12179 CrossRef CAS.
- Y. Sun, W. Cai, R. Gao, X. Cao., F. Wang, T. Lei, X. Deng, G. Chen, H. He and C. Fu, J. Mater. Sci., 2017, 28, 12039 CAS.
- X. Xue, G. Tan, W. Liu and H. Hao, J. Alloys Compd., 2014, 604, 57 CrossRef CAS.
- C. Gutiérrez-Lázaro, I. Bretos, R. Jiménez, J. Ricote, H. El Hosiny, D. Pérez-Mezcua, R. J. Jiménez-Rioboó, M. García-Hernández and M. L. Calzada, J. Am. Ceram. Soc., 2013, 96, 3061 Search PubMed.
- A. Hardy, J. D’Haen, L. Goux, D. Wouters, M. K. Van Bael, H. Van den Rul and J. Mullens, Chem. Mater., 2007, 19, 2994 CrossRef CAS.
- M. K. Van Bael, D. Nelis, A. Hardy, D. Mondelaers, K. Van Werde, J. D’Haen, G. Vanhoyland, H. Van Den Rul, J. Mullens, L. C. Van Poucke, F. Frederix and D. J. Wouters, Integr. Ferroelectr., 2010, 45, 113 CrossRef.
- C. Gumiel, T. Vranken, M. S. Bernardo, T. Jardiel, A. Hardy, M. K. Van Bael and M. Peiteado, Bol. Soc. Esp. Ceram. Vidrio, 2018, 57, 19 CrossRef.
- L. R. Dedon, S. Saremi, Z. Chen, A. R. Damodaran, B. A. Apgar, R. Gao and L. W. Martin, Chem. Mater., 2016, 28, 5952 CrossRef CAS.
- C. D. Pham, J. Chang, M. A. Zurbuchen and J. P. Chang, Chem. Mater., 2015, 27, 7282 CrossRef CAS.
- J. Walker, P. Bryant, V. Kurusingal, C. Sorrell, D. Kuscer, G. Drazic, A. Bencan, V. Nagarajan and T. Rojac, Acta Mater., 2015, 83, 149 CrossRef CAS.
- A. Hardy, S. Gielis, H. Van den Rul, J. D’Haen, M. K. Van Bael and J. Mullens, J. Eur. Ceram. Soc., 2009, 29, 3007 CrossRef CAS.
- A. Hardy, D. Mondelaers, G. Vanhoylan, M. K. Van Bael, J. Mullens and L. C. Van Poucke, J. Sol-Gel Sci. Technol., 2003, 26, 1103 CrossRef CAS.
- X. Tang, J. Dai, X. Zhu, J. Lin, Q. Chang, D. Wu, W. Song and Y. Sun, J. Am. Ceram. Soc., 2012, 95, 538 CrossRef CAS.
- S. Fujino, M. Murakami, V. Anbusathaiah, S. H. Lim, V. Nagarajan, C. J. Fennie, M. Wuttig, L. Salamanca-Riba and I. Takeuchi, Appl. Phys. Lett., 2008, 92, 202904 CrossRef.
- D. Kan, C. J. Long, C. Steinmetz, S. E. Lofland and I. Takeuchi, J. Mater. Res., 2012, 27, 2691 CrossRef CAS.
- S. Karimi, I. M. Reaney, I. Levin and I. Sterianou, Appl. Phys. Lett., 2009, 94, 112903 CrossRef.
- A. Kumar and D. Varshney, Ceram. Int., 2012, 38, 3935 CrossRef CAS.
- H. R. Zhang, K. Kalantari, D. M. Marincel, S. Trolier-McKinstry, I. MacLaren, Q. M. Ramasse, W. M. Rainforth and I. M. Reaney, Thin Solid Films, 2016, 616, 767 CrossRef CAS.
- Y. Yang, J. Y. Sun, K. Zhu, Y. L. Liu and L. Wan, J. Appl. Phys., 2008, 103, 093532 CrossRef.
- M. S. Bernardo, D. G. Calatayud, T. Jardiel, D. Makovec, M. Peiteado and A. C. Caballero, J. Raman Spectrosc., 2017, 48, 884 CrossRef CAS.
- J. Bielecki, P. Svedlindh, D. T. Tibebu, S. Cai, S. G. Eriksson, L. Börjesson and C. S. Knee, Phys. Rev. B: Condens. Matter Mater. Phys., 2012, 86, 184422 CrossRef.
- G. L. Yuan, S. W. Or and H. L. W. Chan, J. Appl. Phys., 2007, 101, 064101 CrossRef.
- A. Ahlawat, S. Satapathy, V. G. Sathe, R. J. Choudhary, M. K. Singh, R. Kumar, T. K. Sharma and P. K. Gupta, J. Raman Spectrosc., 2015, 46, 636 CrossRef CAS.
- P. Hermet, M. Goffinet, J. Kreisel and Ph. Ghosez, Phys. Rev. B: Condens. Matter Mater. Phys., 2007, 75, 220102 CrossRef.
- M. O. Ramirez, A. Kumar, S. A. Denav, N. J. Podraza, X. S. Xu, R. C. Rai, Y. H. Chu, J. Seidel, L. W. Martin, S. Y. Yang, E. Saiz, J. F. Ihlefeld, S. Lee, J. Klug, S. W. Cheong, M. J. Bedzyk, O. Auciello, D. G. Schlom, R. Ramesh, J. Orenstein, J. L. Musfeldt and V. Gopalan, Phys. Rev. B: Condens. Matter Mater. Phys., 2009, 79, 224106 CrossRef.
- S. Hussain and S. K. Hasanain, J. Alloys Compd., 2016, 688, 1151 CrossRef CAS.
- X. S. Xu, T. V. Brinzari, S. Lee, Y. H. Chu, L. W. Martin, A. Kumar, S. McGill, R. C. Rai, R. Ramesh, V. Gopalan, S. W. Cheong and J. L. Musfeldt, Phys. Rev. B: Condens. Matter Mater. Phys., 2009, 79, 134425 CrossRef.
- R. V. Pisarev, A. S. Moskvin, A. M. Kalashnikova and Th. Rasing, Phys. Rev. B: Condens. Matter Mater. Phys., 2009, 79, 235128 CrossRef.
- S. Gómez-Salces, F. Aguado, F. Rodríguez, R. Valiente, J. González, R. Haumont and J. Kreisel, Phys. Rev. B: Condens. Matter Mater. Phys., 2012, 85, 144109 CrossRef.
- C. Gumiel, M. S. Bernardo, P. G. Villanueva, T. Jardiel, J. De Frutos, A. C. Caballero and M. Peiteado, J. Mater. Sci., 2017, 52, 4042 CrossRef CAS.
- S. K. Singh, R. Ueno, H. Funakubo, H. Uchida, S. Koda and H. Ishiwara, Jpn. J. Appl. Phys., 2005, 44, 8525 CrossRef CAS.
- D. H. Kim, H. N. Lee, M. Varela and H. M. Christen, Appl. Phys. Lett., 2006, 89, 162904 CrossRef.
- J. Van Den Brink and D. I. Khomskii, J. Phys.: Condens. Matter, 2008, 20, 434217 CrossRef.
- J. W. Martin, Y. H. Chu and R. Ramesh, Mater. Sci. Eng., R, 2010, 68, 89 CrossRef.
- G. Rojas-George, J. Silva, R. Castañeda, D. Lardizábal, O. A. Graeve, L. Fuentes and A. Reyes-Rojas, Mater. Chem. Phys., 2014, 146, 73 CrossRef CAS.
- D. Lebeugle, D. Colson, A. Forget, M. Viret, A. M. Bataille and A. Gukasov, Phys. Rev. Lett., 2008, 100, 227602 CrossRef CAS.
- P. Chandra Sati, M. Arora, S. Chauhan, M. Kumar and S. Choker, J. Phys. Chem. Solids, 2014, 75, 105 CrossRef CAS.
- Z. Chen, Y. Wu, X. Wang, W. Jin and C. Zhu, J. Mater. Sci.: Mater. Electron., 2015, 26, 9929 CrossRef CAS.
Footnote |
| † Electronic supplementary information (ESI) available: Fig. S1 and S2. See DOI: 10.1039/c9tc05912a |
| This journal is © The Royal Society of Chemistry 2020 |