
Broadband near-infrared (NIR) emission realized by the crystal-field engineering of Y3−xCaxAl5−xSixO12:Cr3+ (x = 0–2.0) garnet phosphors†
Minqian
Mao
 a,
Tianliang
Zhou
*a,
Huatao
Zeng
a,
Le
Wang
*b,
Fan
Huang
c,
Xueyuan
Tang
a and
Rong-Jun
Xie
*a
a,
Tianliang
Zhou
*a,
Huatao
Zeng
a,
Le
Wang
*b,
Fan
Huang
c,
Xueyuan
Tang
a and
Rong-Jun
Xie
*a
aCollege of Materials, Xiamen University, Xiamen 361005, China. E-mail: bible2@163.com; rjxie@xmu.edu.cn
bCollege of Optical and Electronic Technology, China Jiliang University, Hangzhou, Zhejiang 310018, China. E-mail: calla@cjlu.edu.cn
cMathematics Application Joint Laboratory of Soochow University and Suzhou Jiaoshi Intelligence Technology Co. Ltd, Soochow University, Suzhou 215006, P. R. China
First published on 12th December 2019
Abstract
The rapid development of portable spectrometers has evoked a large demand for minimized light sources; meanwhile, NIR phosphor-converted light-emitting diodes (NIR pc-LEDs) are an optimal choice due to their compactness and low cost. The phosphors used in NIR spectroscopy (NIRS) are required to have broadband emission and high quantum efficiency (QE) for a wider detection range and efficient photo-to-electricity conversion. Inspired by the structural tunability of Y3Al5O12 (YAG), we proposed to achieve broadband emission by crystal field engineering, i.e., indirectly regulating the crystal field strength of Cr3+via the co-substitution of Y3+–Al3+ by Ca2+–Si4+ in YAG. The crystal field strength experienced on Cr3+ decreased as the octahedron was distorted and enlarged by the co-substitution. A broadband NIR emission with a large full width at half maximum (FWHM) of 160 nm and a high internal quantum efficiency (IQE) of ∼75.9% was realized in Y3−xCaxAl5−xSixO12:0.6% Cr (x = 1). The suitability of the investigated NIR phosphor was demonstrated by fabricating an NIR pc-LED prototype, and the detection resolution was improved by 30% compared to that of a traditional white pc-LED. These results indicate the great potential of the Y2CaAl4SiO12:Cr phosphors for use in highly precise and sensitive NIR pc-LEDs.
Introduction
Owing to its unmatched merits in analysis, such as rapid, on-site and non-invasive processes, NIR spectroscopy (NIRS) has been widely applied in agriculture,1 food,2,3 pharmaceuticals,4,5 medicine,6 environmental protection sectors,7,8etc. The NIRS technique is sensitive to chemical compounds containing O–H, C–H, and N–H groups; thus, it is perfectly suited for quality supervision.9 With the increasing public concerns of food safety and quality, nutritional balance and healthy diet, portable spectrometers capable of daily food analysis are highly required.10 To meet this need, the infrared sources must be as small as possible, and their emission bands should be broad enough to enable wide detection ranges. Although several infrared light sources are currently available on the market, some shortcomings, such as large sizes (incandescent bulbs and halogen lamps),11,12 narrow emission bands (GaAs LEDs)13 and high cost (semiconductor lasers),14 have hindered their broad applications, typically in portable devices. Alternatively, a most promising solution is to develop NIR pc-LEDs that combine InGaN blue LEDs with broadband NIR phosphors.15,16 Due to the robustness of inorganic phosphors, the NIR pc-LEDs thus promise compactness, longevity, high efficiency and low cost. To achieve this goal, there is a great need to develop highly efficient broadband NIR phosphors that match well with blue LED chips.17Cr3+ is usually considered to be an interesting dopant for NIR emissions, and its emission can be easily tuned by altering its local surroundings. In a strong crystal field, the sharp emission line stemming from the spin-forbidden 2E → 4A2 transition dominates. As the strength of the crystal field decreases, the broadband emission attributed to the spin-allowed 4T2 → 4A2 transition appears.18 Several kinds of broadband phosphors with weak crystal fields have been reported recently, such as SrSc2O4:Cr,19 Ca2MgWO6:Cr,20 ScBO3:Cr,21 and Sr8MgLa(PO4)7:Cr.22 In addition, broadband emissions can be achieved by decreasing the crystal field strength of a strong crystal field material by a substitution strategy. A notable example is garnet, which has a structure form of A3B2C3O12. Single- or double-substitution of cations in the garnet structure would cause structural distortion and decrease the crystal symmetry, which changes the crystal field strength and finally regulates the luminescence of Cr3+.23,24 Accordingly, many efforts have been made to search for NIR phosphors in the garnet system. For example, Ca2LuZr2Al3O12:Cr exhibits a broad emission band with FWHM of 117 nm (from 650 to 870 nm) and has an internal quantum efficiency (IQE) of 69.1%.25 X3Sc2Ga3O12:Cr (X = Lu, Y, Gd, La) shows a broadband NIR emission in the range of 600–1000 nm and FWHM of 73–145 nm.26 Y3Al5−xGaxO12:Cr has a broadband emission covering the spectral range of 620–800 nm.24 These investigations demonstrate the feasibility of the substitution strategy to realize broadband NIR emissions of Cr3+ in garnets. On the other hand, in this work, direct regulation is performed only in the dodecahedron and/or octahedron sites (i.e., the B sites in A3B2C3O12 that Cr3+ prefers to occupy);27 the resulting structural distortion thus has a very limited effect on the broadening of the emission band. In the present work, we propose to induce distortion of the octahedron by changing the size of the neighboring tetrahedron and dodecahedron in the garnet structure, aiming to regulate the Cr3+ emission in a different way. By co-substituting Ca2+–Si4+ for Y3+–Al3+ (i.e., the tetrahedron site) in Y3Al5O12 (YAG), broadband Y3−xCaxAl5−xSixO12:yCr3+ NIR phosphors can be anticipated. In addition, decreasing the ionic size in the B site is beneficial for maintaining the cubic structure with minimum lattice stress.28 This would increase the structural rigidity and hence decrease the thermal quenching of the phosphor, enabling the phosphor to be used in highly reliable pc-LEDs.29 We found that Y2CaAl4SiO12:Cr (x = 1, y = 0.6%) shows a broadband NIR emission (FWHM ∼ 160 nm) and a high IQE of 75.9%. In this paper, the composition, crystal structure, photoluminescence properties, and thermal quenching properties of the co-substituted garnets will be investigated and discussed. Finally, NIR pc-LEDs were fabricated by combining the Y2CaAl4SiO12:0.6% Cr3+ phosphor with a blue or red LED chip; these were then compared to commercial infrared LEDs.
Experimental
Synthetic
Y3−xCaxAl5−xSixO12:yCr3+ (x = 0 to 3, y = 0.4%) samples were synthesized via conventional high-temperature solid-state reactions using high-purity chemical reagents of Y2O3 (5N, Zhong Nuo Advanced Material Technology), CaCO3 (3N, Shanghai Rui Yu photoelectric material), SiO2 (AR, Xi Long Scientific), Al2O3 (4N, α type, Taimicron) and Cr2O3 (4N, Xi Long Scientific) as starting materials. A batch of about 3 g of the powders was weighed, mixed and then ground in an agate mortar for 20 min using ethanol. Then, the mixtures were uniaxially pressed into pellets with diameters of 10 mm under 20 MPa. The pellets were then sintered in an electric tube furnace at temperatures of 1270 °C to 1550 °C for 4 h in 90% N2 + 10% H2 atmosphere. Similarly, samples of Y2CaSiAl4−yO12:yCr3+ (x = 1, y = 0% to 1.0%) were prepared at 1550 °C for 4 h in the same atmosphere.Characterizations
X-ray diffraction patterns of the phosphor samples were measured on a Bruker AXS Avance diffractometer (Cu Kα1λ = 1.5406 Å; tube voltage = 40 kV; tube current = 40 mA). For the phase purity investigation, the samples were examined in the 2θ range of 10 to 80° with a scanning rate of 10° per min. For the Rietveld refinement analysis, the samples were scanned in the range of 5 to 120° at intervals of 0.02 with a count time of 5 s per step. The Rietveld refinement was performed using the FullProf program.30 All the density functional theory (DFT) calculations of the geometry optimization and electronic properties were performed using the Vienna Ab initio Simulation Package31,32 (VASP) under the Projected Augmented Wave33 (PAW) method. For all the geometry optimizations and scf (DOS) calculations, 400 eV was chosen as the cutoff energy of the plane-wave basis to ensure precision of the calculations. A 1 × 1 × 1 Monkhorst–Pack grid34 was used to carry out the surface calculations on all the models. The convergence threshold for structural optimization was set at 0.05 eV Å−1 in force. The convergence criterion for energy was 10−3 eV. A 2 × 1 × 1 supercell of YAG was built for the calculations. Photoluminescence (PL), photoluminescence excitation (PLE), QE and decay time curves were recorded by a fluorescence spectrophotometer (Edinburgh Instruments, FLS980) equipped with a 450 W Xe lamp, Xe-μs-flash lamp, BaSO4-based and integrating sphere; visible and NIR PMT detectors (Hamamatsu, R928P and R5509) were both applied. The diffuse reflectance spectra in the range of 200 to 1600 nm were measured at room temperature using a spectrophotometer (Shimadzu Ltd, Japan, UV-3600 PLUS). Temperature-dependent PL spectra were obtained via a temperature controlling appurtenance (Lake Shore Cryotronics, Model 336 with ARS-4HW Compressor) which was loaded into the FLS980 and operated from 10 to 350 K. The thermal quenching was measured via home-built equipment which was composed of a sample cooling/heating stage, temperature controller, 460 nm blue light and a spectrometer (Ocean Optics, USB 2000+).NIR LED preparation
NIR pc-LEDs were fabricated by combining Y2CaSiAl4O12:0.6% Cr3+ with LED chips. For comparison, the commercial yellow YAG:Ce and red CaAlSiN3:Eu phosphors were coupled with a blue LED to create white light. The phosphors were thoroughly mixed with epoxy resin, and the mixture was mounted on the LED chip, followed by curing at 200 °C. The optical properties of the pc-LEDs were measured using a spectrometer (Ocean Optics, USB2000+) under a forward bias current of 150 mA at room temperature.Results and discussion
Crystal structure of Y3−xCaxSixAl5−xO12
Y3Al5O12 and Ca3Al2Si3O12 are isostructural with the cubic space group Ia![[3 with combining macron]](https://www.rsc.org/images/entities/char_0033_0304.gif) d, and a full solid solution with the composition of Y3−xCaxSixAl5−xO12 is available.35 The structure of garnet consists of different but close-knit ligands, where the [(Al/Cr)O6] octahedra are edge-shared with [(Y/Ca)O8] dodecahedra and connected with [(Al/Si)O4] tetrahedra by O2− points.27 Therefore, the different ratios of Y/Ca and Al/Si can influence the surrounding coordination environment of the octahedral sites Cr3+ occupies, which in turn imposes on the luminescence of Cr3+.
d, and a full solid solution with the composition of Y3−xCaxSixAl5−xO12 is available.35 The structure of garnet consists of different but close-knit ligands, where the [(Al/Cr)O6] octahedra are edge-shared with [(Y/Ca)O8] dodecahedra and connected with [(Al/Si)O4] tetrahedra by O2− points.27 Therefore, the different ratios of Y/Ca and Al/Si can influence the surrounding coordination environment of the octahedral sites Cr3+ occupies, which in turn imposes on the luminescence of Cr3+.
As shown in Fig. 1a, the diffraction peaks of Y3−xCaxAl5−xSixO12:0.4% Cr3+ (x = 0 to 2) are basically consistent with the standard card of Y3Al5O12 (JCPDS 88-2048) when the content of x is smaller than 2. A marginal YAlO3 phase is identified in the samples of x = 0.05 and 0.1. When x is larger than 2, an unknown Ca–Si–Al–O amorphous phase is preferentially formed,36 which leads to deviations from the standard Y3Al5O12 and Ca3Al2Si3O12 (JCPDS 89-1491) diffraction patterns. The lattice constant (Fig. 1b), obtained from the X-ray diffraction data, decreases slightly from 12.027 to 11.967 Å with increasing degree of co-substitution (x). This is indicative of the shrinkage in the overall volume of the structure after co-substitution, which would result in a strong crystal field that yields sharp emission lines of Cr3+. However, in fact, this is not the case, as will be discussed later.
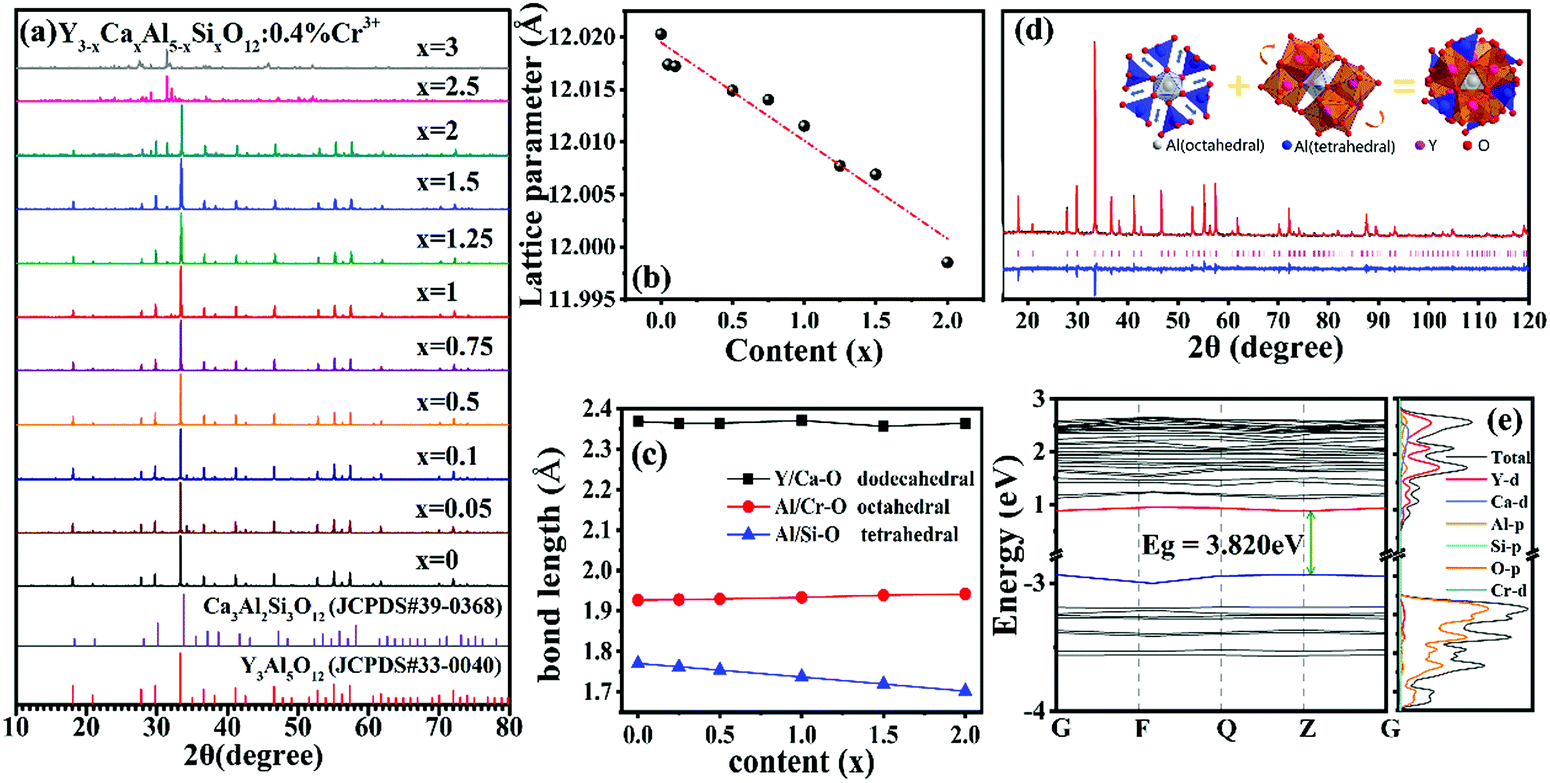 | ||
| Fig. 1 (a) Powder X-ray diffraction patterns of Y3−xCaxAl5−xSixO12:0.4% Cr3+ and JCPDS reference data of Y3Al5O12 and Ca3Al2Si3O12; (b) lattice constants and (c) ligand bond lengths of Y3−xCaxAl5−xSixO12:0.4% Cr3+ (x = 0 to 2) after co-substitution; (d) Rietveld refinement XRD pattern of Y2CaAl4SiO12:0.4% Cr3+. The inset is the structure model of the Ca2+–Si4+ co-substituted YAG:Cr; (e) band structure and DOS of Y2CaAl4SiO12. | ||
The calculated bond lengths of M–O (M = Y/Ca, Al/Cr and Al/Si) in three types of polyhedron are presented in Fig. 1c. As can be seen, the tetrahedral bond length of Al/Si–O decreases with increasing x because the ionic radius of Si4+ (0.260 Å) is 33.3% smaller than that of Al3+ (0.390 Å). Although the ionic radius of Ca2+ (1.120 Å) is 9.9% larger than that of Y3+ (1.019 Å), the dodecahedral bond length of Y/Ca–O remains nearly constant. It is worth noting that the octahedron where the luminescent center Cr3+ is accommodated is slightly enlarged, indicating a weak crystal field imposing on the Cr3+ ions. Therefore, broadband emissions rather than sharp line emissions are anticipated.
The Rietveld refinement of the XRD pattern of Y2CaAl4SiO12:0.4% Cr3+ is displayed in Fig. 1d. The refined residual factors, atom coordinates, and unit cell parameters are summarized in Tables S1 and S2 (ESI†). The refinement converges well with the low residual factors of Rp = 5.48%, Rwp = 7.16%, and Rexp = 5.15%. The decrease of the overall unit cell does not contradict the expansion of the octahedron because the substitution of Ca2+–Si4+ pairs for Y3+–Al3+ pairs in Y3Al5O12 will cause structural distortion, as illustrated in the inset of Fig. 1d. The larger Al3+ sites are occupied by the smaller Si4+ ions, leading to shrinkage of the tetrahedra and shortening of the Si/Al–O bonds. The oxygen atoms belonging to the common apex of the octahedra then move towards the outside. Additionally, the incorporation of larger Ca2+ ions into the smaller Y3+ sites will not only enlarge the dodecahedra but also change the geometrical configuration.37
As shown in Table S3 (ESI†), both the distortion index and the effective coordination number of the dodecahedra change with increasing Ca2+–Si4+ co-substitution. These changes in the dodecahedra will further distort the octahedra that are connected via the common edge.37,38 Therefore, the double effects of elongation and distortion result in deformation and enlargement of the octahedra.
The density of states (DOS) of Y3−xCaxAl5−xSixO12:0.4% Cr3+ (x = 0, 1) was investigated by first-principles calculations, as presented in Fig. 1e. The calculated results show a direct bandgap of 3.820 eV for Y2CaAl4SiO12 (x = 1), which is much smaller than that of 4.605 eV for Y3Al5O12 (x = 0) (see Fig. S3, ESI†). This shows that the top of the valence band mainly consists of the O 2p orbital for both x = 0 and x = 1. However, the bottom of the conduction band is mainly contributed by the 4d orbital of Y for Y3Al5O12 (x = 0), whereas it is a hybrid electronic state of Y 4d and Ca 3d for Y2CaAl4SiO12 (x = 1). The 3d level of Cr ions forms an impurity level in the bandgap of the host. The bandgap is correlated to the strength of the bond between the valence electron and its atom. As the ionicity of the compound increases, these electrons will move closer to their mother atom and their bonds will become tighter, implying that more energy or a larger bandgap is required to break the bond. Compared with Y3Al5O12, Y2CaAl4SiO12 shows weak ionic character because it has a smaller bandgap. This indicates that the covalence character of Y3−xCaxAl5−xSixO12:0.4% Cr3+ becomes stronger with increasing Ca2+–Si4+ co-substitution; the ensuing nephelauxetic effect will contribute to the energy level splitting to some extent.28
Optical properties at room temperature
The photoluminescence spectra (PL) of Y3−xCaxAl5−xSixO12:0.4% Cr3+ are given in Fig. 2a. As can be seen, all samples with x < 2.5 display a broad emission band in the NIR range (600 to 1100 nm) under 440 nm excitation; meanwhile, the samples with x > 2.5 have almost no luminescence, possibly due to the existence of impurities. The PL intensity reaches its maximum at x = 1. In addition, spectral broadening is clearly observed with increasing Ca2+–Si4+ co-substitution. The variation of the bandwidth (FWHM) is plotted as a function of x in Fig. 2b. As can be seen, the changes in FWHM can be divided into three stages. In the first stage (x = 0 to 0.25), the FWHM value basically remains unchanged. In the second stage (x = 0.25 to 0.5), the value of FWHM soars due to the appearance of the broadband emission corresponding to the spin-allowed 4T2 → 4A2 transition. The R line of the 2E level is still visible at this high solid solubility (Fig. 2a). In the last stage (x = 0.5 to 2), the FWHM value increases steadily. Again, Y2CaAl4SiO12:0.4% Cr3+ (x = 1) has the largest FWHM of 160 nm. The same case is seen when the Y3−xCaxAl5−xSixO12:0.4%Cr3+ samples are excited under 617 nm (Fig. S4, ESI†).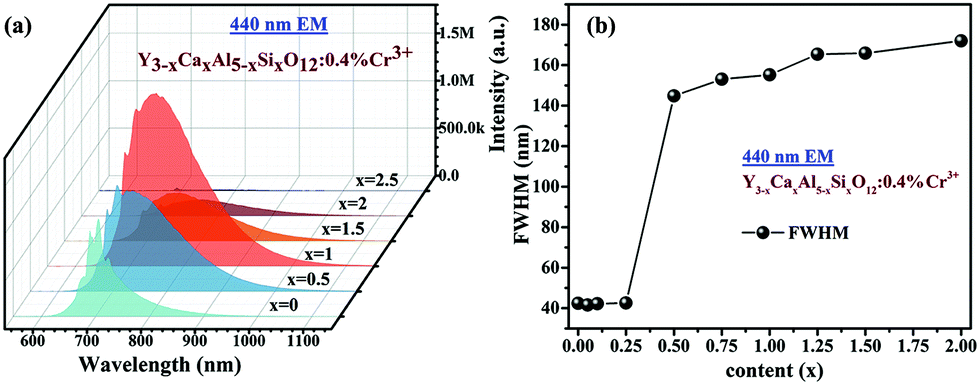 | ||
| Fig. 2 (a) Emission spectra and (b) FWHM values of Y3−xCaxAl5−xSixO12:0.4% Cr3+ measured at room temperature under 440 nm excitation. | ||
Some studies have emerged regarding broadband infrared phosphors.39–42 The mechanism of spectral broadening needs to be studied in more detail. To quantitatively describe the effects of the substituted Ca2+–Si4+ ions on the crystal field strength, spectroscopic parameters such as crystal field splitting (10Dq), the Racah parameters B and C, and β-covalency (B/B0) were calculated from the energy maxima of the 4A2 → 4T2 and 4A2 → 4T1 absorption bands (Fig. S5, ESI†), and the results are shown in Table 1.
| Dq (cm−1) | B (cm−1) | C (cm−1) | Dq/B | B = B/B0 | |
|---|---|---|---|---|---|
| x = 0 | 1689 | 648 | 3234 | 2.62 | 0.706 |
| x = 0.5 | 1653 | 669 | 3185 | 2.47 | 0.729 |
| x = 1 | 1647 | 678 | 3168 | 2.43 | 0.738 |
| x = 1.5 | 1639 | 690 | 3136 | 2.38 | 0.751 |
According to crystal field theory, the crystal field splitting Dq can be evaluated from the following equation:43
| 10Dq = E(4T2 − 4A2) | (1) |
Then, the Racah parameter B can be calculated by the following expression:44
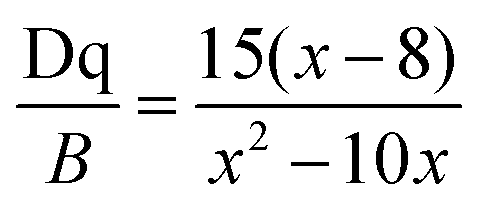 | (2) |
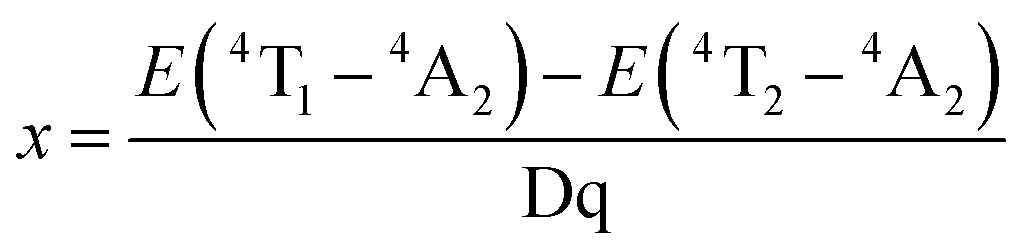 | (3) |
Finally, the Racah parameter C can be estimated by:
 | (4) |
It is observed that the value of Dq/B gradually decreases as the Ca2+–Si4+ co-substitution increases, indicating weakening of the crystal field. The Racah parameter B represents the repulsive force between electrons in the 3d orbital. The value for the free Cr3+ ion (918 cm−1) is much higher than that of Cr3+ ion in crystals.25 Compared with Y3Al5O12 (x = 0), the samples of x > 0 have a larger B value, which is indicative of the increase of the ionic character associated with the enlargement of the octahedron where Cr3+ is located. The increase of ionicity in the Cr3+ local environment does not contradict the enhanced covalency of the overall lattice.
To discuss the effects of the octahedra distortion on the spectral broadening, the energy levels of Cr3+ in octahedra with different symmetries are schematically illustrated in Fig. 3. According to the Tanabe–Sugano diagram, the relative energy position between the 4T2 excited state and the 4A2 ground state is strongly influenced by the crystal field strength (Dq/B). In a strong crystal field, the 4T2 energy level is far beyond the 2E energy level. Thus, the Cr3+ emission is dominated by the spin-forbidden 2E → 4A2 transition. A weak crystal field downshifts the 4T1 and 4T2 energy levels, and the possibility of the thermal population of the 2E level into the 4T2 energy level increases.45,46 The energy level in the Tanabe–Sugano diagram is based on Cr3+ in a nearly perfect octahedral site (Oh point group); however, the symmetry of this site is not as perfect as that in Y3Al5O12, and it has a decreased symmetry of C3i. The distortion causes splitting of the 4T1, 4T2 and 2E levels into two sub-levels. Meanwhile, in Y2CaAl4SiO12, the larger degree of distortion in the octahedron leads to a larger separation between these two sub-levels; thus, the lowest sub-level of the 4T2 level is close to the highest sub-level of the 2E level. This is more conducive for the thermal population to the 4T2 level and finally appears as the common emission of the 2E and 4T2 levels. This can also be proved by the decrease of the decay time of Y3−xCaxAl5−xSixO12:0.4% Cr3+ with increasing x (Fig. S6, ESI†). Although the octahedron has a large distortion, the whole crystal structure remains stable due to the similar ionic radius and the charge balance, which are thus advantageous for thermal stability. In summary, both the decrease of the crystal field strength and the increase of the energy level splitting promote the electrons to be thermally populated to the 4T2 level, finally resulting in a broadband emission of Cr3+.
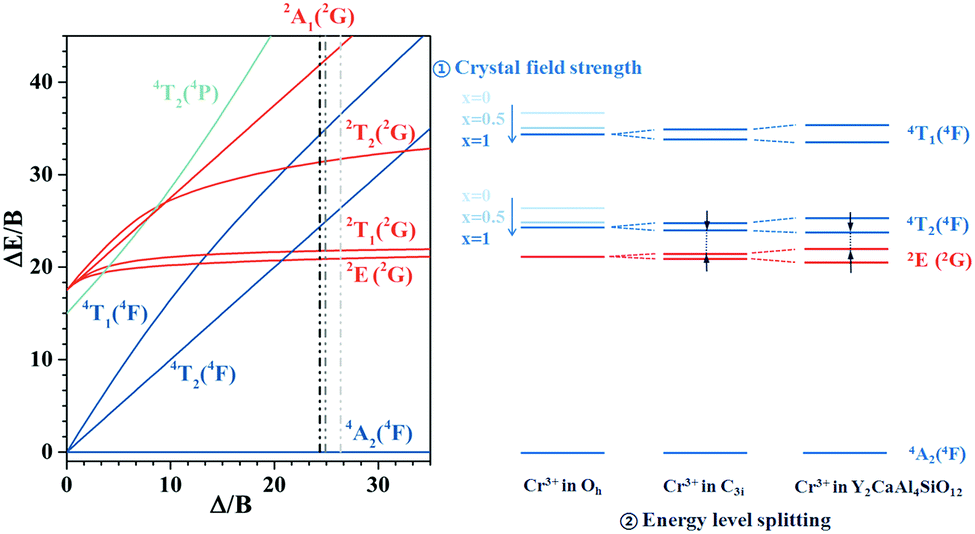 | ||
| Fig. 3 The Tanabe–Sugano diagram and energy levels of Cr3+ in a perfect octahedral site Oh (Y3−xCaxAl5−xSixO12, x = 0, 0.5, 1), in a slightly deformed octahedral site C3i and in the distorted octahedral site in Y2CaAl4SiO12. | ||
Influence of Cr3+ concentration
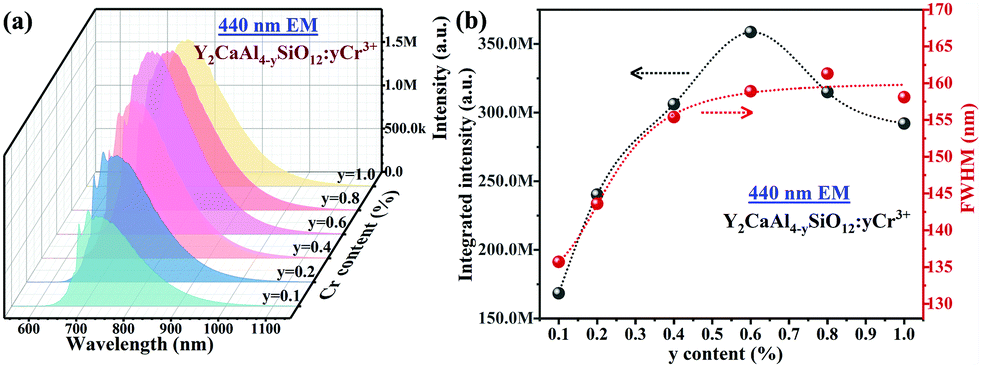
Y3−xCaxAl5−xSixO12:0.4% Cr3+ (x = 1) has the highest PL intensity, and the sample of Y2CaAl4SiO12:yCr3+ was thus selected for further investigations. The XRD patterns of Y2CaAl4SiO12:yCr3+ (y = 0.1% to 1.0%) show a pure garnet phase, and no other impurity phases are identified (Fig. S7, ESI†). This indicates that the doping of Cr3+ does not cause changes in the phase purity or crystal structure. As expected, the lattice constant of Y2CaAl4SiO12 increases with increasing Cr3+ content (Fig. S8, ESI†) because the larger Cr3+ (0.615 Å, CN = 6) replaces the smaller Al3+ (0.535 Å, CN = 6).As shown in Fig. 4a, all samples (y = 0.1% to 1.0%) display a similar broadband emission centred at 744 nm, and both the maximum PL intensity and FWHM were found in the sample with y = 0.6% (Fig. 4b). The concentration quenching occurring at y = 0.6% can be ascribed to energy transfer between the adjacent Cr3+ ions by multipole–multipole interactions, exchange interactions or re-absorption.20,47 In addition, the maximum emission of the broadband shifts from 738 to 768 nm when the Cr3+ concentration increases from y = 0.1% to 1.0%. The red-shift can be attributed to the re-absorption of Cr3+.
 | ||
| Fig. 4 (a) Emission spectra and (b) maximum PL intensity and FWHM of Y2CaAl4SiO12:yCr3+ phosphor powders with different Cr3+ concentrations (y) under 440 nm excitation. | ||
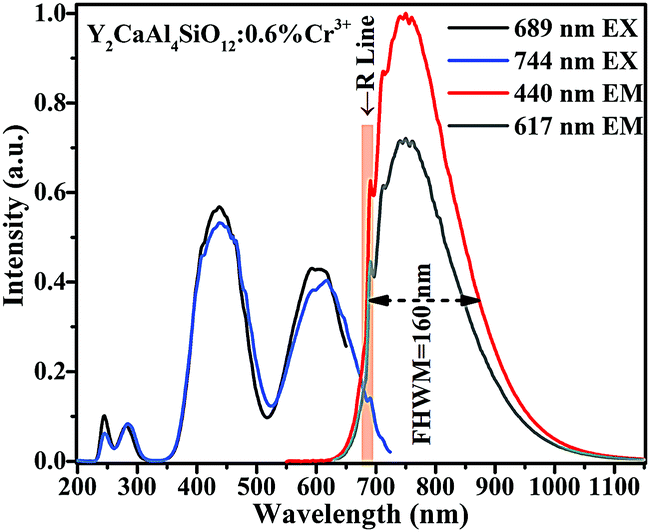
It can be seen in Fig. 5 that the excitation spectrum of Y2CaAl4SiO12:0.6% Cr3+ consists of four broad bands. The two intense bands peaking at ∼440 and 617 nm are assigned to the 4A2(4F) → 4T1(4F) and 4A2(4F) → 4T2(4P) transitions, respectively. Two other weak bands are located at 244 and 280 nm, which correspond to the O2−–Cr3+charge transfer (CT) and 4A2(4F) → 4T2(4F) transition, respectively.22 The emission spectrum assigned to the 4T2 → 4A2 transition is dominated by a broadband covering the spectral range of 600 to 1100 nm (centred at 744 nm). In addition, a narrow peak (i.e., R-line) at 689 nm, due to the 2E → 4A2 transition, is also observed. Because the energy gap between the 2E and 4T2 states is small, electrons can be easily promoted from the 2E level to the 4T2 level via thermal population. Consequently, both 2E and 4T2 emissions are seen in the emission spectrum.
 | ||
| Fig. 5 Emission and excitation spectra of Y2CaAl4SiO12:0.6% Cr3+ at room temperature. | ||
Comparison of different Cr-doped garnet phosphors
As discussed above, the spectral broadening of Cr3+-doped phosphors is strongly correlated with their crystal field strength. Fig. 6 presents the relationships between the crystal field parameters (Dq/B, B Racah parameter) and FWHM of some Cr3+-doped garnet NIR phosphors.19,23,29,48–53 The chemical formulas of these phosphors are listed in Table S3 (ESI†). It can be seen that these NIR phosphors can be divided into three groups. A vertical dotted line is taken from the intersection of the 2E and 4T2 energy levels in the Tanabe–Sugano diagram where Dq/B is ∼2.3, which is generally considered to be the boundary between the medium and weak crystal fields. In this graph, LaSGG:Cr located on the left side of the intersection has a weak correlation between FWHM and the Racah parameter B (Zone II). Meanwhile, the Cr-doped garnet phosphors on the right side show a strong correlation between B and FWHM depending on the Dq/B value. The phosphors in Zone III have a medium or strong crystal field. As the crystal field becomes weaker, the values of B and FWHM increase generally. Compared with those phosphors with a medium crystal field, only the Y2CaAl4SiO12:Cr phosphor is in Zone I; however, it has larger values of B and FWHM. The large Racah parameter B indicates a small spatial expansion of the d electron wave functions in the crystal (i.e., a weak nephelauxetic effect). It can be inferred that there is a greater probability to obtain broadband emissions in NIR phosphors with a higher Racah parameter B.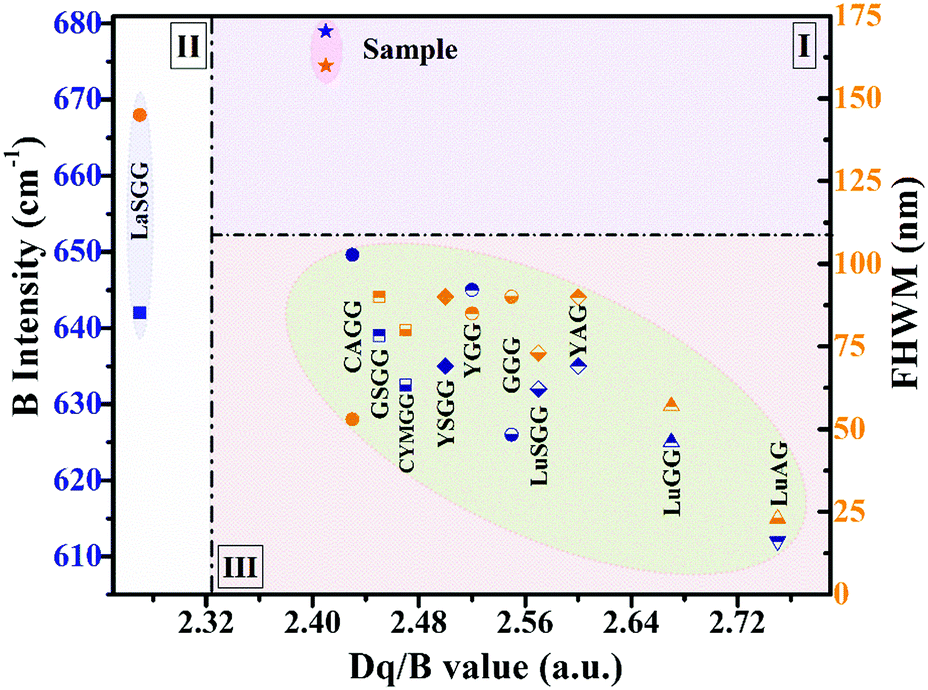 | ||
| Fig. 6 Coordinate relationships between the crystal field strength Dq/B, Racah parameter B and FWHM. | ||
For applications in near-infrared lighting sources, phosphors with a broadband emission will have a wide spread detection range, and a higher quantum efficiency indicates a better performance. As shown in Table 2, the broadband Y2CaAl4SiO12:0.6% Cr3+ (FWHM = 160 nm) has a largest internal quantum efficiency (IQE) of 75.9%. The absorption and the external quantum efficiency (QE) of Y2CaAl4SiO12:Cr are only 37.0% and 28.1%, respectively. The low absorption is ascribed to the parity-forbidden d–d transition of Cr3+. The absorption of phosphors can be improved by the surface treatment, tailoring of the particle size and morphology, and optimization of the synthesis process.55
Temperature-dependent luminescence
The working temperature of LED devices can be up to 100 °C, while that of the LED junction may even exceed 150 °C;56 therefore, evaluation of the thermal stability of LED phosphors is essential. As shown in Fig. 7a, the PL intensity of the phosphor declines as the temperature increases. At 200 °C, the PL intensity is about 78% of the initial intensity measured at room temperature. A similar result is seen for the temperature-dependent IQE (Fig. S9, ESI†). Moreover, the narrow peaks at ∼690 and 710 nm weaken and finally disappear with increasing temperature, which is attributed to the increasing probability of thermal population from the 2E to the 4T2 state. In addition, the descent in the right wing of the spectrum causes a slight blue-shift.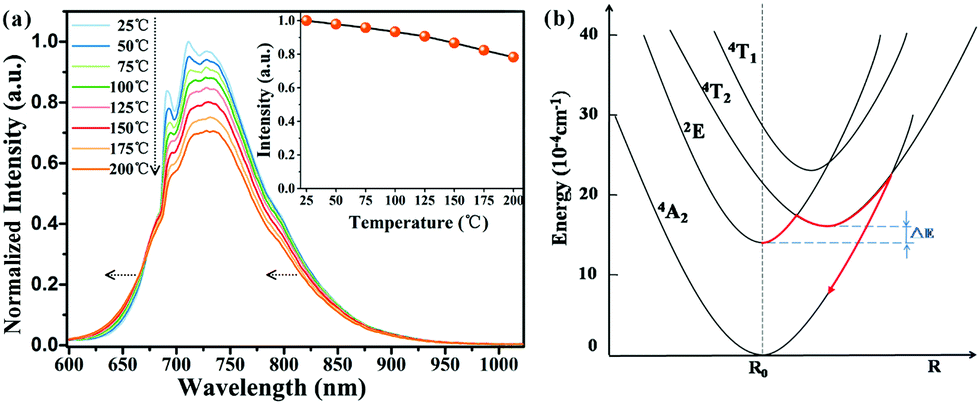 | ||
| Fig. 7 (a) Temperature-dependent emission spectra of Y2CaAl4SiO12:Cr upon excitation at 440 nm and the temperature-dependent Integrated intensities (inset); (b) schematic configurational coordinated diagram of Y2CaAl4SiO12:Cr at room temperature. | ||
Thermal quenching usually occurs by means of thermally activated crossover via the 4T2 excited state of Cr3+, as depicted in Fig. 7b. To better understand the thermal quenching, the temperature dependence of the emission intensity can be described by a modified Arrhenius equation:25
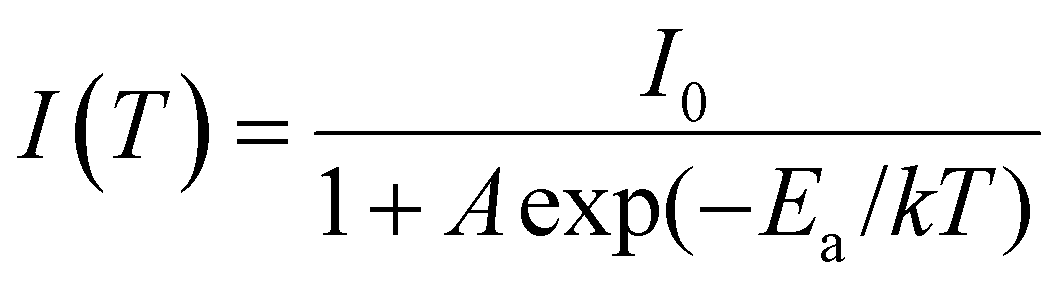 | (5) |
![[thin space (1/6-em)]](https://www.rsc.org/images/entities/char_2009.gif) ln(1/A) formula to be ∼317 °C for Y2CaAl4SiO12:Cr.
ln(1/A) formula to be ∼317 °C for Y2CaAl4SiO12:Cr.
Applications in NIR pc-LEDs
To demonstrate the applicability of Y2CaAl4SiO12:Cr phosphors, several types of NIR pc-LEDs (0.8 × 0.8 cm) were fabricated (Fig. 8a). It can be seen that the NIR phosphor can be efficiently excited by blue or red LED chips. The NIR light power density of the pc-LED (type I) is 2.35 mW cm−2 (1 cm away from the light source), and the output power is 0.81 W at a drive current of 150 mA (5.4 V). In the type IV pc-LED, where the NIR phosphor was supplemented with a commercial white pc-LED (type III), one can find that the addition of a NIR phosphor (type IV) greatly enhances the NIR spectral region (700 to 850 nm); thus, it can be used for food detection.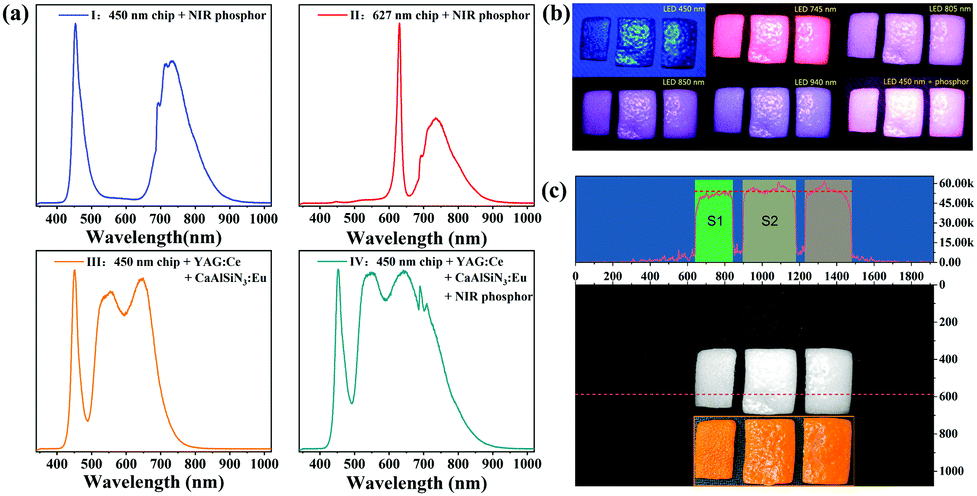 | ||
| Fig. 8 (a) Emission spectra of pc-LEDs with different combinations; (b) photographs of orange peels irradiated by different light sources; (c) brightness intensity of the grayscale after Fourier transform of orange peels under pc-LED (blue chip + phosphor) illumination; the inset is a physical image of the orange peel under fluorescent light. | ||
Objects with different water contents show different abilities to absorb infrared light, which can be distinguished by changes in brightness. Three orange peels were used as research objects: one is a peel that was placed indoors for 12 hours (dried), and the other two were peeled immediately prior to testing (fresh). All the orange peels were illuminated by different light sources and photographed with a camera (Fig. 8b) The camera is an ordinary home surveillance camera that has a sensitization range of 400 to 1100 nm. Fig. 8c shows the gray scale of the orange peel illuminated with a pc-LED (blue chip + phosphor) and the intensity obtained by Fourier transform. As can be seen, the Fourier transform intensity of the dried orange peel on the left is lower than that of the other two fresh peels on the right.
To quantitatively evaluate the resolution of the different LED sources, a formula is proposed as below:
| R = [(S2P − S2LED) − (S1P − S1LED)]/(S1P − S1LED) | (6) |
Conclusions
Broadband NIR phosphors Y3−xCaxAl5−xSixO12:yCr3+ (x = 0 to 2.0, y = 0.1% to 1%) were successfully obtained by engineering of the crystal field strength of the Cr3+ dopant. By direct regulation of the neighbouring dodecahedron and tetrahedron (A and C sites in the garnet), the octahedron where Cr3+ is accommodated was distorted by co-substituting the Y3+–Al3+ pair by the Ca2+–Si4+ pair in the YAG host, resulting in a weakened crystal field and thus a broadband NIR emission. The co-substituted phosphors showed a wide emission spectrum, covering the spectral range of 600 to 1100 nm, and had an emission maximum of 740 nm, a large FWHM of 160 nm and a highest IQE of 75.9% for the composition of x = 1 and y = 0.6% (Y2CaAl4SiO12:0.6% Cr) upon 440 nm blue light excitation. The Y2CaAl4SiO12:Cr phosphor exhibited a strong temperature dependence of luminescence and had a thermal quenching temperature of ∼ 317 °C. A broadband NIR pc-LED was prepared by combining the phosphor mixture of YAG:Ce (yellow-green), CaAlSiN3:Eu (red) and Y2CaAl4SiO12:Cr (NIR) with a blue LED chip, and its resolution for detecting the water content of orange peels was enhanced by 30%. These results indicate that Y2CaAl4SiO12:Cr is a promising NIR phosphor for use in NIR spectrometers. An added value of this work is that it provides a new idea for exploring interesting NIR phosphors in Cr-activated garnets.Conflicts of interest
There are no conflicts to declare.Acknowledgements
This work was partially supported by the National Key Research and Development Program of China (2017YFB0404300, 2017YFB0404301), the National Natural Science Foundation of China (No. 51832005), and the Fujian Province Education Foundation (JAT170021). We are also grateful to Prof. Quanlin Liu and Miss Nanye Shi from the University of Science and Technology who performed the XRD pattern Rietveld refinement.References
- S. Ghidini, M. O. Varra, C. Dall'Asta, A. Badiani, A. Ianieri and E. Zanardi, Food Chem., 2019, 280, 321–327 CrossRef CAS PubMed.
- Z. Genisheva, C. Quintelas, D. P. Mesquita, E. C. Ferreira, J. M. Oliveira and A. L. Amaral, Food Chem., 2018, 246, 172–178 CrossRef CAS PubMed.
- A. Guelpa, F. Marini, A. du Plessis, R. Slabbert and M. Manley, Food Control, 2017, 73, 1388–1396 CrossRef CAS.
- N. Zaborenko, Z. Shi, C. C. Corredor, B. M. Smith-Goettler, L. Zhang, A. Hermans, C. M. Neu, M. A. Alam, M. J. Cohen, X. Lu, L. Xiong and B. M. Zacour, AAPS J., 2019, 21, 32–52 CrossRef PubMed.
- P. Liu, J. Wang, Q. Li, J. Gao, X. Tan and X. Bian, Spectrochim. Acta, Part A, 2019, 206, 23–30 CrossRef CAS PubMed.
- A. Grometto, B. Pizzo, M. C. Strozzi, F. Gazzolo and D. Gazzolo, J. Matern.-Fetal Neonat. Med., 2019, 32, 1124–1129 CrossRef PubMed.
- F. Corradini, H. Bartholomeus, E. Huerta Lwanga, H. Gertsen and V. Geissen, Sci. Total Environ., 2019, 650, 922–932 CrossRef CAS PubMed.
- J. Huang, C. Cao, J. Liu, C. Yan and J. Xiao, Sci. Total Environ., 2019, 667, 522–531 CrossRef CAS PubMed.
- P. Butz, C. Hofmann and B. Tauscher, J. Food Sci., 2005, 70, 131–141 CrossRef.
- A. Kartakoullis, J. Comaposada, A. Cruz-Carrion, X. Serra and P. Gou, Food. Chem., 2019, 278, 314–321 CrossRef CAS PubMed.
- W. Wang and J. Paliwal, J. Sens. Instrumen. Food Qual., 2007, 1, 193–207 CrossRef.
- T. Pulli, T. Dönsberg, T. Poikonen, F. Manoocheri, P. Kärhä and E. Ikonen, Light: Sci. Appl., 2015, 4, 1–7 Search PubMed.
- R. Leon, C. Lobo, J. Zou, T. Romeo and D. J. H. Cockayne, Phys. Rev. Lett., 1998, 81, 2486–2489 CrossRef CAS.
- K. Sato, R. Watanabe, H. Hanaoka, T. Nakajima, P. L. Choyke and H. Kobayashi, OncoTargets Ther., 2016, 7, 14324–14335 Search PubMed.
- H. Zeng, T. Zhou, L. Wang and R.-J. Xie, Chem. Mater., 2019, 31, 5245–5253 CrossRef CAS.
- L. Zhang, D. Wang, Z. Hao, X. Zhang, G. h. Pan, H. Wu and J. Zhang, Adv. Opt. Mater., 2019, 1900185–1900193 CrossRef.
- D. Dai, Z. Wang, Z. Xing, X. Li, C. Liu, L. Zhang, Z. Yang and P. Li, J. Alloys Compd., 2019, 806, 926–938 CrossRef CAS.
- X. Meng, Z. Wang, K. Qiu, Y. Li, J. Liu, Z. Wang, S. Liu, X. Li, Z. Yang and P. Li, Cryst. Growth Des., 2018, 18, 4691–4700 CrossRef CAS.
- B. Malysa, A. Meijerink, W. Wu and T. Jüstel, Luminescence, 2017, 190, 234–241 CrossRef CAS.
- D. Xu, X. Wu, Q. Zhang, W. Li, T. Wang, L. Cao and J. Meng, J. Alloys Compd., 2018, 731, 156–161 CrossRef CAS.
- Q. Shao, H. Ding, L. Yao, J. Xu, C. Liang and J. Jiang, RSC Adv., 2018, 8, 12035–12042 RSC.
- B. Malysa, A. Meijerink and T. Jüstel, Opt. Mater., 2018, 85, 341–348 CrossRef CAS.
- J. Xu, J. Ueda and S. Tanabe, J. Am. Ceram. Soc., 2017, 100, 4033–4044 CrossRef CAS.
- S. P. Feofilov, A. B. Kulinkin, P. A. Rodnyi, V. M. Khanin and A. Meijerink, Luminescence, 2018, 200, 196–199 CrossRef CAS.
- Y. Zheng, W. Zhuang, X. Xing, J. Zhong, R. Liu, Y. Li, Y. Liu and Y. Hu, RSC Adv., 2016, 6, 68852–68859 RSC.
- B. Malysa, A. Meijerink and T. Jüstel, Luminescence, 2018, 202, 523–531 CrossRef CAS.
- Y.-N. Xu and W. Y. Ching, Phys. Rev. B: Condens. Matter Mater. Phys., 1999, 59, 10530–10535 CrossRef CAS.
- J. Y. Zhong, W. D. Zhuang, X. R. Xing, R. H. Liu, Y. F. Li, Y. H. Liu and Y. S. Hu, J. Phys. Chem. C, 2015, 119, 5562–5569 CrossRef CAS.
- P. J. Dereń, A. Watras, A. Gągor and R. Pązik, Cryst. Growth Des., 2012, 12, 4752–4757 CrossRef.
- J. R. Carvajal, Commission on Powder Diffraction (IUCr), Newsletter, 2001, 26, 12–19 Search PubMed.
- G. Kresse and J. Furthmüller, Phys. Rev. B: Condens. Matter Mater. Phys., 1996, 54, 11169–11186 CrossRef CAS PubMed.
- G. Kresse and J. Hafner, Phys. Rev. B: Condens. Matter Mater. Phys., 1994, 49, 14251–14269 CrossRef CAS PubMed.
- P. E. Blöchl, Phys. Rev. B: Condens. Matter Mater. Phys., 1994, 50, 17953–17979 CrossRef PubMed.
- H. J. Monkhorst and J. D. Pack, Phys. Rev. B: Solid State, 1976, 13, 5188 CrossRef.
- M. Czaja and Z. Mazurak, Opt. Mater., 1994, 3, 95–98 CrossRef CAS.
- Y. Kuru, E. Onur Savasir, S. Zeynep Nergiz, C. Oncel and M. Ali Gulgun, Phys. Status Solidi C, 2008, 5, 3383–3386 CrossRef CAS.
- Z. Song, Z. Xia and Q. Liu, J. Phys. Chem. C, 2018, 122, 3567–3574 CrossRef CAS.
- Z. Song, D. Zhou and Q. Liu, Acta Crystallogr., Sect. A: Found. Adv., 2019, 75, 1353–1358 CAS.
- K. Qiu, P. Li, X. Meng, J. Liu, Q. Bao, Y. Li, X. Li, Z. Wang, Z. Yang and Z. Wang, Dalton Trans., 2019, 48, 618–627 RSC.
- D. Dai, Z. Wang, C. Liu, X. Li, L. Zhang, Z. Xing, Z. Yang and P. Li, ACS Appl. Electron. Mater., 2019 DOI:10.1021/acsaelm.9b00563.
- J. Cheng, P. Li, Z. Wang, Z. Li, M. Tian, C. Wang and Z. Yang, Dalton Trans., 2018, 47, 4293–4300 RSC.
- J. Cheng, P. Li, Z. Wang, Y. Sun, Q. Bai, Z. Li, M. Tian, C. Wang and Z. Yang, J. Mater. Chem. C, 2017, 5, 127–133 RSC.
- H. Xia, J. Wang, H. Wang, J. Zhang, Y. Zhang and T. Xu, Rare Met., 2006, 25, 51–57 CrossRef CAS.
- L. Chen, A.-Q. Luo, Y. Zhang, X.-H. Chen, H. Liu, Y. Jiang, S.-F. Chen, K.-J. Chen, H.-C. Kuo, Y. Tao and G.-B. Zhang, J. Solid State Chem., 2013, 201, 229–236 CrossRef CAS.
- R. Martin-Rodriguez, R. Valiente, F. Rodriguez and M. Bettinelli, Nanotechnology, 2011, 22, 265707–265714 CrossRef CAS PubMed.
- C. J. Donnelly, T. J. Glynn, G. P. Morgan and G. F. Imbusch, Luminescence, 1991, 48–49, 283–287 CAS.
- Q. Bai, S. Zhao, L. Guan, Z. Wang, P. Li and Z. Xu, Cryst. Growth Des., 2018, 18, 3178–3186 CrossRef CAS.
- B. Struve and G. Huber, Appl. Phys. B: Photophys. Laser Chem., 1985, 36, 195–201 CrossRef.
- G. Özen, B. Belin, G. Yildirim and H. Güven, Opt. Commun., 2000, 173, 341–347 CrossRef.
- H. Örücü, J. Collins and B. Di Bartolo, J. Appl. Phys., 2010, 108, 103101–103107 CrossRef.
- M. O. H. J. P. Hehir, J. P. Larkin and G. F. Imbusch, J. Phys. C: Solid State Phys., 1974, 7, 2241–2248 CrossRef.
- J. H. Yuan, Y. M. Cheng and Z. H. Zhang, Acta Phys.-Chim. Sin., 2005, 21, 1059–1062 CAS.
- E. Raudonyte, H. Bettentrup, D. Uhlich, S. Sakirzanovas, O. Opuchovic, S. Tautkus and A. Katelnikovas, Opt. Mater., 2014, 37, 204–210 CrossRef CAS.
- L. Zhang, S. Zhang, Z. Hao, X. Zhang, G.-h. Pan, Y. Luo, H. Wu and J. Zhang, J. Mater. Chem. C, 2018, 6, 4967–4976 RSC.
- A. Katelnikovas, S. Sakirzanovas, D. Dutczak, J. Plewa, D. Enseling, H. Winkler, A. Kareiva and T. Jüstel, Luminescence, 2013, 136, 17–25 CrossRef CAS.
- G. B. Nair and S. J. Dhoble, Luminescence, 2015, 30, 1167–1175 CrossRef PubMed.
- S. P. Mudunuri, S. Venkataramanan and S. Biswas, IEEE Trans. Inf. Forensics and Secur., 2019, 14, 886–896 Search PubMed.
Footnote |
| † Electronic supplementary information (ESI) available: PDOS of Y3Al5O12:Cr3+; decay time curves of Y3−xCaxAl5−xSixO12:0.4% Cr3+ at room temperature under 440 nm excitation; IQE as a function of excitation wavelength and temperature. See DOI: 10.1039/c9tc05775g |
| This journal is © The Royal Society of Chemistry 2020 |