Revealing the relationship between the Au decoration method and the enhanced acetone sensing performance of a mesoporous In2O3-based gas sensor†
Yinglin
Wang
 a,
Pengfei
Cheng
*a,
Xu
Li
a,
Chen
Wang
a,
Changhao
Feng
b and
Geyu
Lu
a,
Pengfei
Cheng
*a,
Xu
Li
a,
Chen
Wang
a,
Changhao
Feng
b and
Geyu
Lu
 *c
*c
aSchool of Aerospace Science and Technology, Xidian University, Xi'an 710126, P. R. China. E-mail: pfcheng@xidian.edu.cn
bCollege of Electronic and Information Engineering, Southwest University, Chongqing 400715, P. R. China
cState Key Laboratory on Integrated Optoelectronics, College of Electronic Science and Engineering, Jilin University, Changchun 130012, P. R. China. E-mail: lugy@jlu.edu.cn; Tel: +86 431 85167808
First published on 31st October 2019
Abstract
In this study, long-term ordered mesoporous In2O3 was prepared by replicating the structure of SBA-15. Samples prepared with Au-doped and Au-loaded mesoporous In2O3 were aimed at studying the influence of the modification method (doping and loading) on acetone sensing properties, and the corresponding sensing mechanism was discussed in detail. The structural and chemical characterizations of the samples were carried out by XRD, BET, TEM and XPS. The best sensing performance was achieved in the In2O3 Au-doped (IO-Au-D) sample; the response reached 19.01 to 100 ppm of acetone at 250 °C. The effects of the polarity and bond dissociation energy of acetone benefited the improved selectivity among volatile organic compounds (VOCs). The excellent gas sensing performance not only depended on the ordered mesoporous structure of the In2O3 matrix, but could also be attributed to the “electronic sensitization” and “chemical sensitization” of Au. Furthermore, uniformly dispersed Au doping depressed the lattice growth and enlarged the depletion region, playing a great role in enhancing the sensing performance. However, the limited surface decorated region of the Au-loaded sample suppressed the enhancement of the acetone sensing performance. This work significantly reveals that the sensing performance can be controlled by different methods of introducing additives.
Introduction
The sensing performance of volatile organic compounds (VOCs) is always the research hotspot in the fields of hazardous gas detection1–4 not only for the toxicity impacts of VOCs with trace concentrations on human health, but also for their wide applications in health care, environment monitoring and industry processing.4,5 Acetone, a biomarker, acts as an important assessment indicator in type I diabetes diagnosis, and it is helpful in monitoring the diseases and disorders in human health.6 Therefore, the precise and rapid detection of acetone has become extremely essential and urgent.Among the various gas testing devices, metal oxide semiconductor (MOS)-based gas sensors present high sensitivity with a fast response and recovery rate, small volume with low cost, and high compatibility in various applications.7,8 In2O3, as one of the promising MOSs with a wide band gap of 3.55–3.75 eV, has received a lot of attention for its physical and chemical properties, especially in the detection of gases, such as NO2, NH3, CO, acetone and ethanol.9–13
Recently, an In2O3-based high-performance gas sensor has been extensively investigated. There are numerous experiments exhibiting that the appropriate morphology of In2O3 can help achieve an excellent sensing performance, such as a hierarchical structure, hollow structure and porous structure.14,15 Among these beneficial structures, the porous structure may improve the specific surface area and enhance the gas sensing properties effectively because the high surface area possesses more exposed active sites. J. Liu et al. prepared a porous In2O3 micro-/nanostructure by oxidizing In2S3 precursors for gas sensor applications; the special structure facilitated the enhancement of gas sensing properties.5 A porous In2O3 hollow sphere structure was fabricated by the template-assisted method using Cu2O as the sacrificial template;14 the obtained products presented a fast response and recovery to acetone gas. T. Waitz et al. synthesized ordered mesoporous In2O3; the methane gas sensor showed high sensitivity, which was related to the surface-to-volume ratio and the nanoscopic structure.15
The noble metal adopted in a sensing material is another effective route to gain a better gas sensing performance.16–19 For instance, Pd was adopted to enhance the sensitivity of In2O3 to ethanol.16 Au nanoparticle decoration on In2O3 could provide the response of 6.5 to 100 ppm ethanol.17 The introduction of a noble metal benefits the enhancement of the sensing performance, which is usually attributed to the electron sensitization effect and the chemical sensitization effect. The observed sensitivity and selectivity enhancement of Au-impregnated WO320 was attributed to the electronic sensitization effects of Au nanoparticles on WO3 nanorods. Pt acting as a chemical sensitizer was functionalized on PdO nanowire sensors to H2; Pt activated the dissociation of H2 and O2 molecules through the spillover effect.21
Additionally, the decoration method of additives has a great influence on the gas sensing performance. The doping method has gained widespread interest since it can significantly affect the sensitivity and selectivity by tuning the properties of the host, creating lattice defects, lattice disorder and so on.22 Several works related to Au-doped In2O3 have been reported, which present a greatly enhanced sensing performance toward CO, acetone and ethanol.17,23,24 Rare earth element-doped ordered macroporous In2O3 by the colloidal crystal templating method was used to investigate the sensing properties towards ethanol.25 Co-Doped In2O3 presented a three-fold higher response to acetone than pure In2O3.26 The loading method working as a surface modification method has been utilized extensively for its positive effect on the sensing performance, surface dispersed active sites, large effective contact area with oxygen species and so on. F. Gong utilized Pd decorated on the surface of porous In2O3 nanocuboids and obtained an enhanced performance in detecting acetone.27 The works associated with Au-loaded In2O3 have drawn great attention recently. In2O3 decorated with Au presented a much enhanced gas sensing performance towards acetone.6 Au-loaded In2O3 nanofibers were utilized to detect ethanol, which exhibited a much low optimum operation temperature.28 To the best of our knowledge, the decoration (doping or loading) of a noble metal can effectively enhance the gas sensing performance; however, the relationship between the decoration method and the sensing performance has been rarely reported.
In this study, materials based on pure mesoporous In2O3 and Au-modified samples (IO-Au-D, IO-Au-L) were fabricated to determine the influence of different decoration methods on the acetone sensing performance. In2O3 with an ordered mesoporous nanostructure was prepared by the hard template method to ensure the fluency of gas diffusion and the exposure of more active sites. The noble metal gold (Au) was chosen as the catalyst to enhance the gas sensing performance further. Additionally, the enhanced mechanism of acetone gas sensing greatly influenced by the decoration method was discussed exhaustively. This work will be helpful in providing an effective technique for noble metal decoration towards improving the sensing performance.
Results and discussion
Structure and morphology of materials
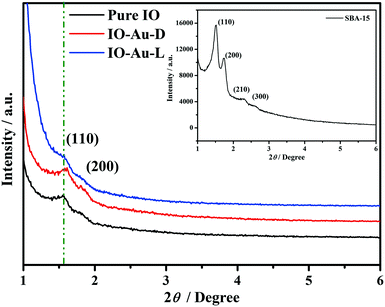
The phase identifications of mesoporous samples (SBA-15, pure IO, IO-Au-D and IO-Au-L) were characterized by XRD. As shown in the inset of Fig. 1, the two sharp diffraction peaks and the two barely visible peaks can be indexed as the (110), (200), (210) and (300) reflections of the ordered 2D hexagonal mesostructure of SBA-15. In Fig. 1, each low-angle XRD curve of the prepared sample exhibits two peaks corresponding to the (110) and (200) reflections, indicating the successful replication from the silica template SBA-15. In addition, the peaks corresponding to the (210) and (330) reflections can be barely observed, which indicates that the long-range order of the fabricated samples is lower than that of SBA-15. Apparently, unlike the observations for other two samples (pure IO, IO-Au-D), the pattern of IO-Au-L presents lower intensity diffraction peaks, which indicates that the long-range order is slightly lower for loading the Au element.16 However, in the case of IO-Au-D, the (110) peaks slightly move towards a higher angle, which can be related to the change in crystallinity on account of Au doping. It can be deduced that different modification methods have different influences on the structure and crystallinity of materials.As exhibited in Fig. 2a, the wide-angle XRD patterns of the prepared samples are in accordance with the cubic structure In2O3 (JCPDS Card No. 88-2160),29 with the lattice parameter a = 10.117 Å. The characteristic peaks at the 2θ values of 30.62°, 35.48° and 51.02° are indexed to diffractions of the (222), (400) and (440) planes of In2O3, respectively. In the magnified patterns depicted in Fig. 2b, there is one more diffraction peak at the 2θ value of 38.2° in the patterns of the Au-modified In2O3 samples, which corresponds to the characteristic (111) plane of Au (JCPDS Card No. 1-1172). The XRD peak corresponding to Au in IO-Au-D is attributed to the aggregation of Au, which is associated with the repeat process of filling the mesostructure and annealing the product (to replicate the structure of template SBA-15). In the process of fabricating IO-Au-D, the strong bonding energy of Au contributed to the aggregation of Au. It was observed that no other impure phase and no shifts in the XRD peaks were recorded in these wide-angle curves, which implied that the crystal lattice of In2O3 was not disturbed by adding the Au modifier. The magnified characteristic peak of the In2O3(222) curves reveals the details of each sample. In Fig. 2c, as depicted in the XRD pattern of IO-Au-D, there is a slight shift in the (222) peak towards a lower angle, which indicates that the Au dopant substitutes the host ions.30 This indicates that the Au element is doped into the lattice of In2O3. The difference in intensities revealed the different crystallite sizes of each sample. The crystallite sizes of the obtained samples are listed in Fig. 2c, which are calculated according to the Scherrer equation:31
D = 0.9λ/(β![[thin space (1/6-em)]](https://www.rsc.org/images/entities/char_2009.gif) cos cos![[thin space (1/6-em)]](https://www.rsc.org/images/entities/char_2009.gif) θ) θ) | (1) |
The mesoporous nature of each obtained sample was confirmed by nitrogen adsorption–desorption isotherms and the corresponding pore size distribution is demonstrated in Fig. 3. The type-IV isotherms with capillary condensation occurring above P/P0 = 0.4 and the H1 hysteresis loops confirm the existence of a mesoporous structure in the obtained samples.33 The insets of Fig. 3 are the curves describing the details of pore size distribution; the peaks mainly occur at about 3 nm and no other obvious peak can be seen. According to the information (including SBA-15) including the specific surface area (SSA), average pore size and pore volume summarized in Table 1, the SSA values of the In2O3-based replicas (60–80 m2 g−1) were substantially lower than that for the parent silica template (394.2 m2 g−1); this may be attributed to the lower structural regularity to some degree.16 In the case of IO-Au-D, SSA (78.29 m2 g−1) and average pore width (3.5 nm) were larger than those of the other two samples; this could be ascribed to the Au doping process that can inhibit the grain growth, which is consistent with XRD analysis. In the Au loading procedure, Au nanoparticles adhered to mesoporous In2O3, contributing to the decrease in the average pore width (2.6 nm).34 It can also be deduced that the two kinds of modifying processes have different influences on the integrity and mesostructure of the materials.
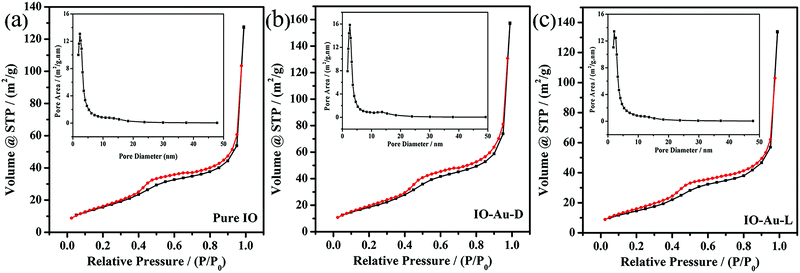 | ||
| Fig. 3 Nitrogen adsorption–desorption isotherms and the corresponding pore size distribution (insets) of (a) pure IO, (b) IO-Au-D, (c) IO-Au-L. | ||
| Sample | SSA (m2 g−1) | Average pore width (nm) | Pore volume (cm3 g−1) |
|---|---|---|---|
| SBA-15 | 394.2 | 7.2 | 0.59 |
| Pure IO | 64.55 | 2.9 | 0.19 |
| IO-Au-D | 78.29 | 3.5 | 0.23 |
| IO-Au-L | 63.30 | 2.6 | 0.18 |
TEM was employed to monitor the morphology of mesoporous pure IO, as shown in Fig. 4a, in which it can be observed that a typical highly ordered 2D hexagonal mesostructure matches with SBA-15. It could be concluded that the In2O3 precursors were fully impregnated in the mesopores of SBA-15 and In2O3 replicas, successfully converting the mesostructure of parent SBA-15. The morphological characteristics of SBA-15 can be obtained from many previous ref. 35 and 36. The pore size marked in Fig. 4a is 3.0 nm, which is similar to the result of the BET test. The magnified lattice image (Fig. 4a inset) reveals the crystal structure of In2O3 (JCPDS No. 88-2160) with the lattice distance of 0.25 nm, corresponding to the (400) crystallographic plane.
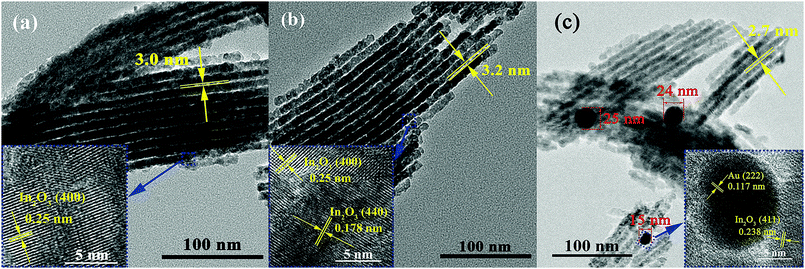 | ||
| Fig. 4 TEM images and HRTEM images (insets) of prepared samples: (a) pure IO, (b) IO-Au-D, (c) IO-Au-L. | ||
Au-Modified In2O3 replicas were also detected under TEM; the microstructures are depicted in Fig. 4b and c. The observed distinguishable period of the ordered mesoporous structure revealed the successful replication from the parent SBA-15 template. The pore sizes of IO-Au-D and IO-Au-L were 3.2 nm and 2.7 nm, respectively, coinciding with the results in Table 1. Compared with the observations shown in Fig. 4b and c, Au aggregated into nanoparticles in IO-Au-L (Fig. 4c) with the diameters of 15 nm, 24 nm and 25 nm, and no Au aggregated phase could be detected in IO-Au-D (Fig. 4b). The dispersion of the Au element in the IO-Au-D sample corresponding to Fig. 4b has been shown in Fig. S1 (ESI†), in which Au is uniformly dispersed in the In2O3 matrix and there is no evident aggregation. This indicated that different modified methods led to different morphologies, and Au was successfully doped and loaded without disturbing the ordered mesoporous structure. The aggregation of Au could be related to the interaction energy between Au and the mesoporous surface.37,38 The inset of Fig. 4b presents the fringe distances of 0.25 nm and 0.178 nm, corresponding to the (400) and (440) crystallographic planes of In2O3 (JCPDS No. 88-2160). The inset of Fig. 4c depicts the fringe distances of 0.117 nm and 0.238 nm, corresponding to the (222) crystallographic plane of Au (JCPDS No. 1-1172) and (411) of In2O3 (JCPDS No. 88-2160). In addition, the concentrations of Au detected by EDS in IO-Au-D and IO-Au-L were 0.38% and 0.40%, respectively.
Fig. 5 indicates the surface composition and chemical state of the elements existing in the samples by further performing XPS. All the obtained XPS spectra were corrected by referencing the C 1s peak located at 284.5 eV. In the full range survey scans of the obtained mesoporous materials depicted in Fig. 5a, the XPS peaks corresponding to the In, O and C elements can be observed with no other impurity peaks. Because of the small dose (0.5 mol%) of the modifier Au adopted in this system, the peak corresponding to Au is not obvious in the survey scans of IO-Au-D and IO-Au-L. As revealed in Fig. 5b, the binding energies of In 3d3/2 and In 3d5/2 occur at ∼451.5 eV and ∼444 eV, respectively, with the spin orbit splitting of 7.6 eV, indicating the formation of indium oxide. Compared with the observation for pure IO, there is a slight shift towards higher energy for IO-Au-D, which implies the electron density change in In atoms, and this can be related to the doping method used for introducing Au.39 In contrast, there is no shift found for IO-Au-L, revealing that the electron density in IO-Au-L is similar to that in pure IO. Fig. 5c presents two weak XPS peaks occurring at ∼83.4 eV and ∼86.4 eV, which are identified as Au 4f7/2 and Au 4f5/2, respectively, by decomposing the spectra into Gaussian components. The assigned Au XPS peaks of IO-Au-D and IO-Au-L correspond well with Au0 and happen to be at similar positions. The similar intensity of the Au peak indicates the similar dosage of Au introduced in the as-prepared samples.40 In addition, the concentration of Au is displayed in Table 2. The existence of Au can also be confirmed by the XRD and TEM patterns.
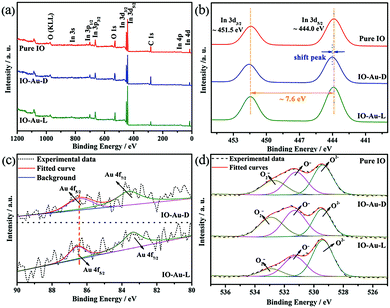 | ||
| Fig. 5 XPS spectra of mesoporous In2O3 replicas: (a) survey scans of as-prepared samples, (b) In 3d spectra, (c) Au 4f spectra and fitted curves, (d) O 1s spectra and fitted curves. | ||
| Sample | Au (%) | O2− (%) | O− (%) | O2− (%) |
|---|---|---|---|---|
| Pure IO | 0 | 40.30 | 34.75 | 24.95 |
| IO-Au-D | 0.36 | 30.88 | 38.35 | 30.76 |
| IO-Au-L | 0.41 | 54.24 | 33.38 | 12.38 |
The analyzed details of the O 1s XPS curves of the In2O3 replicas are displayed in Fig. 5d; the asymmetric O 1s peak is assigned and decomposed into three characteristic peaks. The peaks located at ∼529.4 eV, ∼531.2 eV and ∼532.3 eV are assigned to lattice O (O2−), dissociative O (O−) and molecular-type adsorbed O (O2−), respectively. O2− is attributed as oxygen ions in the crystals under an oxidized stoichiometric condition, which does not react with the reducing gas.41 O2− is attributed as the molecular-type adsorbed oxygen. Furthermore, O− can be ascribed as the dissociative oxygen species caused by an oxygen vacancy (Ov), oxygen interstitial (Oi) and oxygen antisite (Oa); it is more important than other oxygen species because of its interaction with a VOC gas.41 The proportion of oxygen species has been listed in Table 2. It was revealed that IO-Au-D presented the highest content of dissociative oxygen (O−) and molecular-type adsorbed oxygen (O2−). The more percentage of O− and O2− exhibited in IO-Au-D could be attributed to the formation of oxygen vacancies and deficient regions caused by the doping process. In contrast, the lower percentage of O− existing in IO-Au-L may be associated with the aggregation of Au, which reduces the interacting active sites aroused by Au0.
Gas sensing properties
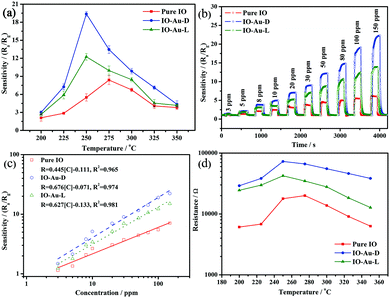
To evaluate the potential applicability of gas sensors, the gas sensing performances of Au-modified mesoporous In2O3 as well as pure mesoporous In2O3 were carefully investigated and compared; the sensors presented enhanced sensing properties towards acetone. The relative details are discussed below.As a gas sensor response highly depends on the operating temperature, the electron mobility and electrical conductivity of metal oxide semiconductors can be greatly influenced by temperature.42 The gas sensing response curves of the prepared mesoporous samples to 100 ppm of acetone on increasing the operating temperature have been given in Fig. 6a. Within the operating temperature range of 200–350 °C, the response patterns displayed a trend of increase before decrease. With the increase in temperature, a higher response was achieved because a higher temperature prompted the detected gas molecules to obtain higher thermal energy. This, on the one hand, could overcome the activation energy barrier and react with the surface adsorbed oxygen species; on the other hand, the increasing operation temperature facilitated the increase in ion sorption of the oxygen active sites on the semiconductor surface.43,44 In contrast, a further increase in the operation temperature would lead to the escape of the surface adsorbed oxygen species by acquiring enough kinetic energy; thus, the response of a semiconductor decreases after achieving the highest response.45 As depicted in Fig. 6a, the optimum operation temperature and effective response are greatly influenced by introducing the Au additive. The optimum operation temperature of Au-modified mesoporous In2O3 was reduced to 250 °C compared with that for pure mesoporous In2O3 (275 °C). The decrease of 25 °C can be attributed to the ion sorption of oxygen occurring on the metal nanoparticle surface46 and the highly conductive nature and free electrons in Au. Additionally, IO-Au-D exhibited a greatly enhanced response of 19.01 to 100 ppm acetone, which was much higher than those of the sensors named pure IO (8.38) and IO-Au-L (12.25) at their optimum temperatures. It can be concluded that doping Au plays a more significant role in enhancing sensitivity than the loading method. Moreover, the comparison of the gas sensing performances of various In2O3 gas sensors towards acetone has been presented in Table 3. It can be inferred that IO-Au-D reported in this work presents a much satisfying sensing performance.
The dynamic response-recovery curves based on different acetone concentrations of the obtained mesoporous sensitive materials were investigated (Fig. 6b). All the samples revealed rapid response and recovery characteristics with acetone concentrations ranging from 3 ppm to 150 ppm at the operation temperature of 250 °C. As the curves reveal in Fig. 6b, the responses monotonically increase on increasing the concentration of acetone, and the Au-modified samples present a higher response throughout the concentration range. IO-Au-D revealed a better sensing performance than IO-Au-L, which indicated that the method of introducing Au plays different roles in enhancing the sensing properties.
Fig. 6c presents the sensitivities of pure IO, IO-Au-D and IO-Au-L towards acetone gas pulses as a function of the acetone concentration at 250 °C. The sensitivity of semiconductor oxides can be expressed as R = A[C]n + B, where A and B and n and [C] are constants, exponent and target gas concentration, respectively.47 Data fitting provides the equations R = 0.445[C] − 0.111, R = 0.676[C] − 0.071 and R = 0.627[C] − 0.133 for pure IO, IO-Au-D and IO-Au-L, respectively. As depicted in Fig. 6c, the Au-decorated samples present higher sensitivities, which increase on increasing the acetone concentration. Moreover, the sensitivity of IO-Au-D tended to increase more rapidly on increasing the acetone concentration. On the basis of the standard for gas detection set to Ra/Rg > 1.2,48 the acetone detection limits were calculated to be 2.94 ppm, 1.88 ppm and 2.13 ppm for the sensors based on IO, IO-Au-D and IO-Au-L, respectively. This indicates that IO-Au-D is a strong competitor for monitoring low concentration levels of acetone gas.
As depicted in Fig. 6d, the resistances in air (Ra) of the obtained gas sensors have been detected to determine the influence of different introducing methods of Au. The shape of each plot is analogous to the shape of a bell. For each sensor, the increase in Ra in the sensor temperature range from 200 °C to 250 °C can be correlated to the increase in oxygen adsorption.49 The decreasing trend of resistance is attributed to the concentration of carriers in semiconductors, which increases with the increase in temperature. The maximum Ra value of pure IO is located at 275 °C, which matches well with the optimum operation temperature of pure IO in Fig. 6a. A similar phenomenon can be observed for IO-Au-D and IO-Au-L, for which the temperature at maximum Ra is equal to the optimum operation temperature of 250 °C. In the full range of the operation temperature, i.e., 200–350 °C, the values of Ra for Au-decorated samples were much higher than that for pure IO, which may be associated with the electronic sensitization and chemical sensitization of Au. IO-Au-D presented the highest Ra value, indicating that the doping process may induce more oxygen species adsorption caused by lattice defects and lattice disorder.
Repeatability as another significant parameter in evaluating the gas sensors applied in toxic and harmful gas environments was investigated (Fig. 7a). The sensitivity of IO-Au-D to 100 ppm of acetone presented 6 similar cycles at 250 °C, and the response error was in the range of 5%. The curve reveals the fast response and recovery characteristics in general. The response-recovery time of IO-Au-D has been illustrated in Fig. 7b. The resistance of the IO-Au-D sensor presented a sudden drop when exposed to acetone and a sharp rise to the baseline after being replaced in the air circumstance; the corresponding response and recovery times were 25 s and 31 s. IO-Au-D showed short response-recovery times at the optimum temperature (250 °C), which may be attributed to the ordered mesoporous structure of the In2O3 matrix and the catalysis of the Au element.
Based on the numerous excellent gas sensitive characteristics of IO-Au-D, the long-term stability of the IO-Au-D sensor was investigated by testing 100 ppm of acetone for 60 days and maintaining the operation temperature at 250 °C. The value of the response was adopted 1 time per 5 days, as shown as the dot-line plots in Fig. 7c. The IO-Au-D sensor exhibited rather good stability. The maximum deviation was less than 5% (an acceptable range), which demonstrated the excellent long-term stability of the sensor. The stability of IO-Au-D may result from the stable structures of mesoporous In2O3 and the lowering of the working temperature by introducing Au nanoparticles. Selectivity as an important criterion, especially in practical applications, was investigated (inset of Fig. 7c). The responses of each obtained sensor towards various gases with the concentration of 100 ppm (ammonia, acetone, methanol, formaldehyde, benzene, toluene and ethanol) at 250 °C have been plotted in a radar diagram. As depicted, Au-modified sensors presented good selectivity towards acetone, and IO-Au-D presented enhanced selectivity. This indicated that selectivity was greatly improved by the doping of Au. The sensitivity of gas sensors was verified to be related to the adsorption and reaction of the gas molecules on the sensitive material surface.53 The polar function of Au-decorated In2O3 benefits the adsorption of polar molecules.6 Among these commonly used VOCs, acetone molecules have stronger molecular polarity, which may explain the ease of the adsorption of acetone on Au-decorated In2O3. Additionally, the bond dissociation energy of CH3–COCH3 (352 kJ mol−1) is much smaller than those of C2H5O–H, CH3O–H (462 kJ mol−1), H–NH2 (452 kJ mol−1), etc.; thus, the acetone molecules are much easier to react with the adsorbed oxygen species.54,55
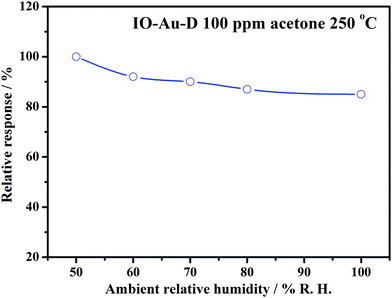
Moreover, the effect of humidity on the response of the sensor based on IO-Au-D to 100 ppm of acetone at 250 °C was studied, as depicted in Fig. 8. The relative response of the sensor slightly decreased with the increase in ambient humidity, and it was maintained above 85%. This indicates that relative humidity has little influence on the sensing response. This may be attributed to the relatively high operation temperature (250 °C), which may effectively eliminate the influence of water molecules.56
Gas sensing mechanism
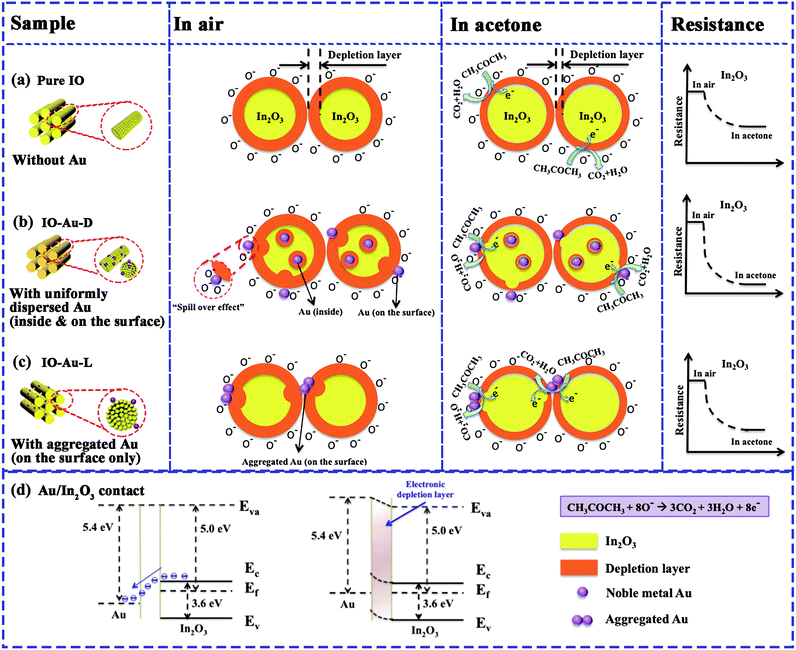
The gas sensing mechanism of the mesoporous In2O3 matrix is a typical n-type semiconductor sensing process, and the detected gas molecules adsorbed and desorbed on the surface cause a change in resistance.12 As illustrated in Fig. 9a, the oxygen molecules are adsorbed on the surface of metal oxides by trapping free electrons from the conduction band to form different oxygen species, namely, O2−, O− and O2− in the air circumstance.57 This process will form a depletion layer on the In2O3 surface and result in reduction in conductivity.58 The adsorbed oxygen sites act as active sites for the detected gas molecules to be attached. Once exposed to reducing gases, the detected reducing gas molecules can react with the adsorbed oxygen species and release the trapped electrons back to the conduction band; thus, the conductivity increases. In addition, the sensing performance strongly depends on the morphology and structure of a sensing material.59 In this work, the long-term ordered mesoporous structure of the In2O3 matrix was constructed to facilitate the diffusion of acetone gas and provide an effective reaction field.As depicted in gas sensing detection, Au-decorated samples presented an enhanced sensing performance towards acetone. Au as the active catalyst creates more active sites that are believed to be crucial for enhancing the response of acetone. As the work function of Au (5.4 eV) is higher than that of In2O3 (Ef = 5.0 eV), the electrons in the conduction band of In2O3 will transfer to Au nanoparticles; a Schottky barrier and an additional depletion layer are formed at the interface of Au/In2O3.1 As depicted in Fig. 9, the valence band bends upward to equilibrate the Fermi level; after contact, the electronic depletion region is formed at the surface of In2O3, which narrows the electron transfer channel and results in higher resistance. Thus, an enhanced acetone sensing performance was achieved for Au-decorated samples. Apart from the electronic sensitization referred above, the chemical sensitization of Au also contributed to the improved sensing performance. Au, as a far better oxygen dissociation catalyst than In2O3, can actively catalyze the dissociation of oxygen molecules; these generated activated oxygen species spill onto the metal oxide surface, leading to the formation of more reactive oxygen species for the reaction with detected acetone molecules.60 In addition, the catalysis of Au facilitated the reaction between the oxygen species and the reducing detected gases, which could decrease the reaction temperature further. This explains the decrease by 25 °C of the optimum operating temperature shown in Fig. 6a.
As indicated for the detection of the acetone sensing performance (Fig. 6 and 7), IO-Au-D presented a better sensing performance compared with IO-Au-L. In the case of Au doping, the uniformly dispersed Au with no aggregation activated both the inner and outer parts of the In2O3 matrix, as depicted in Fig. 9b, which can be observed in TEM characterization (Fig. S1, ESI†). The doping of Au induced lattice defects and vacancies, which could be well reflected by the more percentages of O− and O2− in XPS characterization. These defects and vacancies promoted the active adsorption of acetone gas molecules on the sensitive material surface. The doping process decreased the grain size of In2O3 (confirmed by XRD, Fig. 2c). When the size of the In2O3 particles decreased, the depletion region extended deeper into the grains, which led to the narrowing of the conduction region and hence increase in activation energy or intergranular energy barrier.61,62 However, Au aggregating as nanoparticles only attached on mesoporous In2O3 in the case of IO-Au-L, as revealed in Fig. 4c. The aggregated Au decorated on the surface of the In2O3 matrix (Fig. 9c) could only activate the adsorbed oxygen species at the interface of Au/In2O3. The reduced effective contact active sites for reaction and the limited decorated region may be responsible for the lower enhanced sensitivity.
Experimental
Chemical reagents
The involved chemical reagents have been listed as follows: Pluronic P123 (EO20PO70EO20, Mw = 5800, Sigma Aldrich), tetraethyl orthosilicate (TEOS) (C8H20O4Si, Sigma Aldrich), hydrogen tetrachloroaurate(III) trihydrate (HAuCl4·3H2O, Sigma Aldrich), indium trinitrate hydrate (In(NO3)3·4.5H2O, Sigma Aldrich), hydrochloric acid (HCl, 2 mol L−1), sodium hydroxide (NaOH, 2 mol L−1), absolute ethanol (C2H5OH, 99.9%) and acetone (C3H6O, 99.9%). Deionized water was used in the preparation process, and all chemicals were used as received without any purification.Synthesis processes
A highly ordered two-dimensional (2D) hexagonal mesostructure SBA-15 silica template was synthesized on the basis of a previous ref. 31. First, 2 g of P123 was dissolved in 60 mL HCl solution and maintained in stirring condition at 40 °C for 2 h. Then, 4.25 g of TEOS was added into the above solution and kept for stirring continuously at 40 °C for another 24 h. The obtained mixture was transferred into the closed Teflon-lined stainless steel autoclave, controlling the heating temperature at 100 °C for 24 h. The resulting solid product was centrifuged, washed with deionized water, dried at 100 °C, and sintered at 550 °C.The obtained mesoporous silica of SBA-15 that can serve as a hard template was used to prepare mesoporous In2O3 by the nanocasting method. HAuCl4·3H2O and In(NO3)3·4.5H2O (mole ratio of Au![[thin space (1/6-em)]](https://www.rsc.org/images/entities/char_2009.gif) :
:![[thin space (1/6-em)]](https://www.rsc.org/images/entities/char_2009.gif) In = 0.5
In = 0.5![[thin space (1/6-em)]](https://www.rsc.org/images/entities/char_2009.gif) :
:![[thin space (1/6-em)]](https://www.rsc.org/images/entities/char_2009.gif) 100) were dissolved in 30 mL of ethanol to form a homogeneous solution. Then, 0.5 g of SBA-15 was added into the above solution and kept stirring at 40 °C until all the ethanol evaporated, followed by calcination at 300 °C for 3 h. For further nanocasting, the previous process was repeated except reducing the original mass of the precursors (In(NO3)3·4.5H2O, HAuCl4·3H2O and SBA-15) by half and sintering at 300 °C for another 3 h. Afterwards, we repeated the previous process once more and reduced the original mass of the precursors to 25% for the third nanocasting procedure. After sintering the obtained powder at 500 °C for 3 h, the silica template SBA-15 was removed with NaOH. The as-prepared material was centrifuged, washed for several times and dried at 80 °C, and the final product was named IO-Au-D.
100) were dissolved in 30 mL of ethanol to form a homogeneous solution. Then, 0.5 g of SBA-15 was added into the above solution and kept stirring at 40 °C until all the ethanol evaporated, followed by calcination at 300 °C for 3 h. For further nanocasting, the previous process was repeated except reducing the original mass of the precursors (In(NO3)3·4.5H2O, HAuCl4·3H2O and SBA-15) by half and sintering at 300 °C for another 3 h. Afterwards, we repeated the previous process once more and reduced the original mass of the precursors to 25% for the third nanocasting procedure. After sintering the obtained powder at 500 °C for 3 h, the silica template SBA-15 was removed with NaOH. The as-prepared material was centrifuged, washed for several times and dried at 80 °C, and the final product was named IO-Au-D.
In the case of pure mesoporous In2O3 (pure IO), the target product was prepared by the same procedure mentioned above without the addition of HAuCl4·3H2O. In the case of In2O3 Au-loaded (IO-Au-L), Au was loaded on pure mesoporous In2O3 by the nanocasting method. Then, 0.5 mol% HAuCl4·3H2O acting as Au precursor was dissolved in the mixture of mesoporous In2O3 and ethanol. The homogenous solution was dried at 40 °C and calcined at 300 °C for 2 h to obtain the product named IO-Au-L. The detailed fabrication process of mesoporous materials is illustrated in Fig. 10.
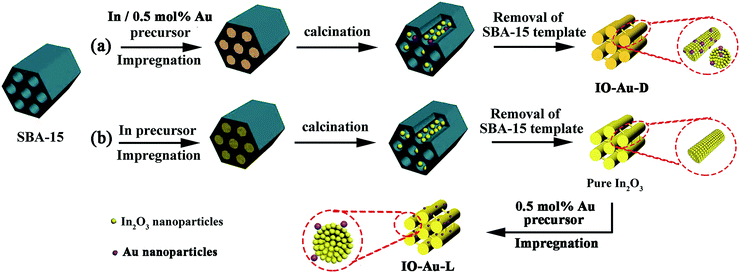 | ||
| Fig. 10 Schematic fabrication process of mesoporous In2O3 material modified by different methods: (a) IO-Au-D and (b) IO-Au-L. | ||
Characterization
All the obtained samples were deduced on a Rigaku X-ray diffractometer (XRD) with a model of D/MAX-2550 using Kα radiation (1.54178 Å) at 40 kV within the range of 1–6 degree for low-angle and 20–80 degree for wide-angle. Brunauer–Emmett–Teller (BET) nitrogen adsorption–desorption isotherms were measured with a Micrometrics Gemini VII surface area and porosity system by high purity nitrogen as adsorbate at 77 K; the samples were degassed at 120 °C for 12 h. The specific surface area and pore size distribution were estimated by five-point BET and Barrett–Joyner–Halenda (BJH) analysis, respectively. Morphology characterizations of the samples were performed using transmission electron microscopy (JEOL TEM-3010 instrument) with an operation acceleration voltage of 20 kV. X-ray photoelectron spectrometry (XPS) was conducted by a Thermo ESCALAB 250 spectrometer under the Al Kα X-ray source (hν = 1486.6 eV) and binding energies (±0.1 eV) determined with respect to the position C 1s at 284.5 eV.Sensor fabrication and evaluation of gas sensing performance
We added appropriate amounts of obtained samples into 0.5 mL of deionized water to form a paste and painted on the Al ceramic tube to make a uniform film and sintered at 300 °C. It was then dried under IR radiation in order to stabilize the sensing device and remove the solvent. The Al ceramic tube was 4 mm in length and 0.4 mm in radial thickness, with a pair of Au electrodes and four Pt wires. Ni–Cr alloy coil was inserted into the alumina tube, and it worked as a controllable heater by tuning the heating current. The final sensor unit was assembled the painted alumina tube onto a six-probe pedestal. The measurement of gas sensor was recorded in a static mode under laboratory circumstance (50 ± 5%RH, 25 ± 1 °C). The testing procedure was carried out using a previously reported method.33 The sensor response was defined as S = Ra/Rg (reducing gas detection) and S = Rg/Ra (oxidizing gas detection), in which Ra is the resistance in air and Rg is the resistance in target gas. The final response is the average of detected results for three times, and the error bars were added. The response and recovery times of sensors were defined as the time taken to achieve 90% of the total resistance change in the case of adsorption and desorption, respectively. For the investigation of humidity effect on sensing properties, the same measurement procedure was conducted under different relative humidity values.Conclusions
In this study, mesoporous In2O3 was successfully prepared by replicating the structure of silica template SBA-15. Noble metal Au-decorated samples (IO-Au-D and IO-Au-L) by different modified methods (doping and loading) were characterized by XRD, BET, TEM and XPS. As revealed, aggregated Au could be observed in IO-Au-L, while uniformly dispersed Au was revealed in IO-Au-D. The comprehensive gas sensing tests presented that different modified methods of Au induced different enhancements of the sensing performance. The sensor IO-Au-D exhibited the best sensing behavior, which offered a lower optimum operation temperature of 250 °C and a higher response of 19.01 to 100 ppm of acetone compared to pure IO (275 °C, S = 8.38) and IO-Au-L (250 °C, S = 12.25). The excellent sensing performance of IO-Au-D was attributed to the depressed lattice growth and enlarged depletion region induced by Au doping. However, the limited surface decorated region of the Au-loaded sample suppressed the enhancement in the acetone sensing performance. This work mainly discusses the influences of Au introduction through different methods on the sensing performance and significantly reveals that the sensing performance can be greatly enhanced by using different doping methods to introduce additives.Conflicts of interest
There are no conflicts to declare.Acknowledgements
This work was supported by the National Nature Science Foundation of China (No. 61604116, 61703348 and 61803289), Fundamental Research Funds for the Central Universities (No. JB151304, XJS14070, XDJK2017C074, JC1907, SWU116059 and SWU116013), China Postdoctoral Science Foundation (No. 2017M623120, 2019M653552 and 2017M622942).Notes and references
- R. Xing, Q. Li, L. Xia, J. Song, L. Xu, J. Zhang, Y. Xie and H. Song, Nanoscale, 2015, 7, 13051 RSC.
- J. W. Gardner, P. K. Guha, F. Udrea and J. A. Covington, IEEE Sens. J., 2010, 10, 1833 CAS.
- A. K. Nayak, R. Ghosh, S. Santra, P. K. Guha and D. Pradhan, Nanoscale, 2015, 7, 12460 RSC.
- C. Lee, Z. Dai, D. H. Kim, H.-Y. Li, Y.-M. Jo, B.-Y. Kim, H.-G. Byun, I. Hwang and J.-H. Lee, Sens. Actuators, B, 2018, 273, 1 CrossRef CAS.
- J. Y. Liu, T. Luo, F. L. Meng, K. Qian, Y. T. Wan and J. H. Liu, J. Phys. Chem. C, 2010, 114, 4887 CrossRef CAS.
- S. Zhang, P. Song, J. Zhang, H. Yan, J. Li, Z. Yang and Q. Wang, Sens. Actuators, B, 2017, 242, 983 CrossRef CAS.
- J. Zhang, X. Liu, G. Neri and N. Pinna, Adv. Mater., 2016, 28, 795–831 CrossRef CAS.
- F. Zee and J. W. Judy, Sens. Actuators, B, 2001, 72, 120 CrossRef CAS.
- J. Gao, L. L. Wang, K. Kan, S. Xu, L. Q. jing, S. Q. Liu, P. K. Shen, L. Li and K. Y. Shi, J. Mater. Chem. A, 2014, 2, 949 RSC.
- N. Du, H. Zhang, B. D. Chen, X. Y. Ma, Z. H. Liu, J. B. Wu and D. Yang, Adv. Mater., 2007, 19, 1641 CrossRef CAS.
- H. Fu, C. Hou, F. Gu, D. Han and Z. Wang, Sens. Actuators, B, 2017, 243, 516 CrossRef CAS.
- S. Park, S. Kim, G. J. Sun and C. M. Lee, ACS Appl. Mater. Interfaces, 2015, 7, 8138 CrossRef CAS PubMed.
- R.-J. Ma, G.-D. Li, X. Zou, R. Gao, H. Chen and X. Zhao, Sens. Actuators, B, 2018, 270, 247 CrossRef CAS.
- D. Han, P. Song, H. Zhang, Z. Yang and Q. Wang, Mater. Lett., 2014, 124, 93 CrossRef CAS.
- T. Waitz, T. Wagner, T. Sauerwald, C. D. kohl and M. Tiemann, Adv. Funct. Mater., 2009, 19, 653 CrossRef CAS.
- A. Montazeri and F. Jamali-Sheini, Sens. Actuators, B, 2017, 242, 778 CrossRef CAS.
- S. An, S. Park, H. Ko, C. Jin, W. I. Lee and C. Lee, J. Phys. Chem. Solids, 2013, 74, 979 CrossRef CAS.
- T. Zhou, X. Liu, R. Zhang, Y. Wang and T. Zhang, ACS Appl. Mater. Interfaces, 2018, 10, 37242 CrossRef CAS.
- M. R. Modaberi, R. Rooydell, S. Brahma, A. A. Akande, B. W. Mwakikunga and C.-P. Liu, Sens. Actuators, B, 2018, 273, 1278 CrossRef CAS.
- S. Kabcum, N. Kotchasak, D. Channei, A. Tuantranont, A. Wisitsoraat, S. Phanichphant and C. Liewhiran, Sens. Actuators, B, 2017, 252, 523 CrossRef CAS.
- H.-J. Cho, V. T. Chen, S. Qiao, W.-T. Koo, R. M. Penner and I.-D. Kim, ACS Sens., 2018, 3, 2152 CrossRef CAS PubMed.
- K. Anand, J. Kaur, R. C. Singh and R. Thangaraj, Chem. Phys. Lett., 2017, 670, 37 CrossRef CAS.
- T. V. Belysheva, E. A. Kazachkov and E. E. Gutman, J. Anal. Chem., 2001, 56, 676–678 CrossRef CAS.
- F. Li, T. Zhang, X. Gao, R. Wang and B. Hua, Sens. Actuators, B, 2017, 252, 822–830 CrossRef CAS.
- D. Han, J. Yang, F. Gu and Z. Wang, RSC Adv., 2016, 8, 45085 RSC.
- X. Zhang, D. Song, Q. Liu, R. Chen, J. Liu, H. Zhang, J. Yu, P. Liu and J. Wang, CrystEngComm, 2019, 21, 1876 RSC.
- F. Gong, Y. Gong, H. Liu, M. Zhang and Y. Zhang, Sens. Actuators, B, 2016, 223, 384 CrossRef CAS.
- X. Xu, H. Fan, Y. Liu, L. Wang and T. Zhang, Sens. Actuators, B, 2011, 160, 713–719 CrossRef CAS.
- J. Zhao, T. Yang, Y. Liu, Z. Wang, X. Li, Y. Sun, Y. Du, Y. Li and G. Lu, Sens. Actuators, B, 2014, 191, 806 CrossRef CAS.
- B. D. Ahn, H. S. Kang, J. H. Kim, G. H. Kim, H. W. Chang and S. Y. Lee, J. Appl. Phys., 2006, 100, 093701 CrossRef.
- B. Liu, D. Cai, Y. Liu, H. Li, C. Weng, G. Zeng, Q. Li and T. Wang, Nanoscale, 2013, 5, 2505 RSC.
- Y. Qu, H. Wang, H. Chen, M. Han and Z. Lin, Sens. Actuators, B, 2016, 228, 595–604 CrossRef CAS.
- Y. Wang, X. Cui, Q. Yang, J. Liu, Y. Gao, P. Sun and G. Lu, Sens. Actuators, B, 2016, 225, 544 CrossRef CAS.
- A. W. Burton, K. Ong, T. Rea and I. Y. Chan, Microporous Mesoporous Mater., 2009, 117, 75 CrossRef CAS.
- M. M. Araujo, L. K. R. Silva, J. C. Sczancoski, M. O. Orlandi, E. Longo, A. G. D. Santos, J. L. S. Sa, R. S. Santos, G. E. Luz Jr and L. S. Cavalcante, Appl. Surf. Sci., 2016, 389, 1137 CrossRef CAS.
- S. She, J. H. Kwak, J. Sun, J. Hu, M. Y. Hu, C. Wang, C. H. F. Peden and Y. Wang, ACS Catal., 2012, 2, 1020 CrossRef.
- J. Yue, X. Jiang and A. Yu, J. Phys. Chem. C, 2012, 116, 8145 CrossRef CAS.
- Y. V. Kaneti, Q. M. D. Zakaria, Z. Zhang, C. Chen, J. Yue, M. Liu, X. Jiang and A. Yu, J. Mater. Chem. A, 2014, 2, 13283 RSC.
- R. Xing, L. Xu, J. Song, C. Zhou, Q. Li, D. Liu and H. Song, Sci. Rep., 2015, 5, 10717 CrossRef CAS.
- Z. Huo, C.-K. Tsung, W. Huang, X. Zhang and P. Yang, Nano Lett., 2008, 8, 2041 CrossRef CAS.
- C. Dong, X. Liu, X. Chao, G. Chen, Y. Wang and I. Djerdj, J. Mater. Chem. A, 2014, 2, 20089 RSC.
- Y. V. Kaneti, Z. Zhang, J. Yue, Q. M. D. Zakaria, C. Chen and X. Jiang, et al. , Phys. Chem. Chem. Phys., 2014, 16, 11471 RSC.
- G. Y. Zhang, C. S. Li, F. Y. Cheng and J. Chen, Sens. Actuators, B, 2007, 120, 403 CrossRef CAS.
- A. M. Sutka, G. Stingaci, G. Mezinskis and J. Lusis, Mater. Sci., 2012, 47, 2856 CrossRef CAS.
- Z. A. Ansari, S. G. Ansari, T. Ko and J. H. Oh, Sens. Actuators, B, 2002, 87, 105 CrossRef CAS.
- M. E. Franke, T. J. Koplin and U. Simon, Small, 2006, 2, 36 CrossRef CAS.
- D. E. Williams, in Solid State Gas Sensors, ed. P. T. Moseley and B. C. Tofield, Azdam Hilger, Bristol, UK-Philadelphia, 1987 Search PubMed.
- S.-Y. Jeong, J.-W. Yoon, T.-H. Kim, H.-M. Jeong, C.-S. Lee, Y. Chan Kang and J.-H. Lee, J. Mater. Chem. A, 2017, 5, 1446–1454 RSC.
- C.-S. Lee, H.-Y. Li, B.-Y. Kim, Y.-M. Jo, H.-G. Byun, I.-S. Hwang, F. A. Hady, A. A. Wazzan and J. H. Lee, Sens. Actuators, B, 2019, 285, 193–200 CrossRef CAS.
- L. Xu, H. W. Song, B. Dong, Y. Wang, J. S. Chen and X. Bai, Inorg. Chem., 2010, 49, 10590–10597 CrossRef CAS.
- N. G. Pramod and S. N. Pandey, Ceram. Int., 2014, 40, 3461–3468 CrossRef CAS.
- J. Wang, Z. Xie, Y. Si, X. Liu, X. Zhou, J. Yang, P. Hu, N. Han, J. Yang and Y. Chen, Sensors, 2017, 17, 2220 CrossRef PubMed.
- E. X. Chen, H. R. Fu, R. Lin, Y. X. Tan and J. Zhang, ACS Appl. Mater. Interfaces, 2014, 6, 22871 CrossRef CAS PubMed.
- J. Li, P. G. Tang, J. J. Zhang, Y. J. Feng, R. X. Luo, A. F. Chen and D. Q. Li, Ind. Eng. Chem. Res., 2016, 55, 3588 CrossRef CAS.
- X. F. Chu, S. M. Liang, W. Q. Sun, W. B. Zhang, T. Y. Chen and Q. F. Zhang, Sens. Actuators, B, 2010, 148, 399–403 CrossRef CAS.
- X. Yang, H. Fu, Y. Tian, Q. Xie, S. Xiong, D. Han, H. Zhang and X. An, Sens. Actuators, B, 2019, 296, 126696 CrossRef.
- W. Tang and J. Wang, J. Mater. Sci., 2015, 50, 4209 CrossRef CAS.
- S. Yang, Y.l. Liu, W. Chen, W. Jin, J. Zhou, H. Zhang and G. S. Zakharova, Sens. Actuators, B, 2016, 226, 478 CrossRef CAS.
- C. Peng, J. J. Guo, W. K. Yang, C. K. Shi, M. R. Liu, Y. X. Zheng, J. Xu, P. Q. Chen, T. T. Huang and Y. Q. Yang, J. Alloys Compd., 2016, 654, 371 CrossRef CAS.
- M. Karmaoui, S. G. Leonardi, M. Latino, D. M. Tobaldi, N. Donato, R. C. Pullar, M. P. Seabra, J. A. Labrincha and G. Neri, Sens. Actuators, B, 2016, 230, 697 CrossRef CAS.
- A. Rothschild and Y. Komem, J. Appl. Phys., 2004, 95, 6374 CrossRef CAS.
- S. Seal and S. Shukla, JOM, 2002, 54, 35 CrossRef CAS.
Footnote |
| † Electronic supplementary information (ESI) available. See DOI: 10.1039/c9tc05082e |
| This journal is © The Royal Society of Chemistry 2020 |

