
Two-dimensional iron MOF nanosheet as a highly efficient nanozyme for glucose biosensing†
Ai
Yuan
,
Yuwan
Lu
,
Xiaodan
Zhang
,
Qiumeng
Chen
and
Yuming
Huang
 *
*
College of Chemistry and Chemical Engineering, Southwest University, Chongqing 400715, China. E-mail: ymhuang@swu.edu.cn
First published on 31st August 2020
Abstract
Two-dimensional (2D) nanomaterials are attractive in catalysis due to their rich accessible active sites. Iron-based metal organic frameworks (MOFs) are promising nanozymes because of their iron center and pore structure. However, it is challenging to obtain iron-based 2D MOF nanozymes due to the coordinated form of iron. Herein, we report a cation substitution strategy to transform an easily obtained Cu(HBTC)(H2O)3 (represented as Cu(HBTC)-1, the product of only two carboxylate groups in 1,3,5-benzenetricarboxylic acid (H3BTC) ligands linked by Cu ions) nanosheet into a 2D Fe-BTC nanosheet, which was characterized by SEM (scanning electron microscopy), AFM (atomic force microscopy), XPS (X-ray photoelectron spectroscopy), FT-IR (Fourier transform infrared spectroscopy), and XRD (X-ray diffraction). The 2D Fe-BTC nanosheet can catalyze TMB (3,3′,5,5′-tetramethylbenzidine) oxidation by H2O2, showing its intrinsic peroxidase mimetic characteristic. The catalytic performance of 2D Fe-BTC was superior to those of its template Cu(HBTC)-1 nanosheet and 3D MIL-100(Fe). Their catalytic activities follow the order of 2D Fe-BTC > MIL-100(Fe) > 2D Cu(HBTC)-1. The peroxidase-like activity of 2D Fe-BTC is 77 times that of its template Cu(HBTC)-1, and 2.2 times that of MIL-100(Fe), a well known 3D crystalline form of iron trimesates. The Km values of 2D Fe-BTC for TMB and H2O2 were 0.2610 mM and 0.0334 mM, which were 1.6 and 1.9-fold lower than those of 3D MIL-100(Fe), respectively. The TMB oxidation rate and H2O2 reduction rate at unit mass concentration of the catalyst (Kw) for 2D Fe-BTC were 2.7–72.3 and 1.5–37.9 times those for the previously reported 3D MOF nanozymes, respectively. In terms of the excellent peroxidase mimetic characteristic of 2D Fe-BTC, a sensitive and selective colorimetric biosensing platform for hydrogen peroxide and glucose was developed. The linear ranges are 0.04–30 μM and 0.04–20 μM for H2O2 and glucose, with a low detection limit of 36 nM and 39 nM, respectively. The assay was satisfactorily applied to glucose determination in biological matrices.
1. Introduction
Metal organic frameworks (MOFs) are porous crystalline materials, which are produced by self-assembly of polydentate organic ligands bridged with metal nodes. The unique micro-structure gives MOFs attractive characteristics, such as high specific surface area, adjustable porosity and cavities. Therefore, they have been widely used in various fields, such as small-molecule sensing, gas storage, and catalysis.1 In particular, great progress has been made in using MOFs as catalysts to mimic enzymatic activities.2–7 For example, Zhou's group demonstrated effective peroxidase-like activity of MOF PCN-222 with Fe-based tetrakis(4-carboxyphenyl)porphyrin (TCPP) ligands capable of catalyzing the oxidation of several substrates,2 while those with other metal-based (manganese, cobalt, nickel, copper, and zinc) TCPP ligands exhibited significantly lower peroxidase-like activity. Ma's group demonstrated the interesting peroxidase mimetic function of a highly stable mesoporous metal–metalloporphyrin framework-6 (MMPF-6) that was synthesized through self-assembly of iron-based ligands and Zr6O8(CO2)8(H2O)8 secondary building units (SBUs).3a Their excellent catalytic performance as peroxidase is attributed to the high density of the porphyrin (heme-like) active centers in PCN-222(Fe) and MMPF-6. In addition, other iron-based MOFs, such as MIL-53(Fe),4 Fe-NH2-MIL-88,5 MIL-68(Fe),6 and MIL-100(Fe),7 have also been reported to possess mimic enzyme activity because of their efficient catalytic decomposition of hydrogen peroxide to produce reactive oxygen species, and they can be used as nanozymes for bioanalytical applications. However, these MOF nanozymes are mainly 3D bulk MOF crystals. The intrinsic narrow pore window of MOFs makes the diffusion rate of the substrate limited, and thus reduces the accessible active sites in 3D bulk crystals and restricts the catalytic performance of MOF nanozymes.Two-dimensional (2D) nanomaterials have received considerable interest because of their uncommon structure, like large specific surface area, ultrathin thickness and high surface-to-volume ratios.8–10 Unlike bulk crystals where most of the active sites are hidden in the framework, thin 2D nanomaterials with large surface area expose highly accessible active sites on their surface.11a This leads to lower mass transfer resistance, a smaller diffusion barrier and great potential for application in catalysis. Metal organic framework nanosheets, a new member of ultrathin 2D nanomaterials that combine the advantages of 2D nanomaterials with MOF crystals, can be used to prepare nanozymes with excellent performance and have received increasing interest in recent years.8,11a,b,12 However, up to now, the reported MOF nanosheets are limited to Zn, Cu, or Co-based metal centers due to the specific SBU structure.8,12–15 Interestingly, Zhang's group designed a series of ultrathin 2D bimetallic MOF nanosheets via self-assembly of Zn, Cu, or Co as metal nodes and Fe-based TCPP as ligands,12 and investigated their enzyme-like property. Most recently, Wei's group reported interesting findings of phosphate-responsive 2D Zn-TCPP(Fe) MOF nanozymes with high performance of peroxidase-like activity for discriminating phosphates16a and for a colorimetric alkaline phosphatase activity assay.16b However, there is still a lack of iron-based MOF nanosheets with high enzyme-like activity and it is necessary to improve the synthesis method to synthesize high-quality 2D-MOF nanosheets.10a
Herein, based on a multivalent cation substitution strategy,17 we successfully prepared 2D iron-based MOF nanosheets and investigated their enzymatic mimetic property. As Fig. 1 shows, 2D Cu(HBTC)-1 nanosheets were prepared and used as a template, and then Fe3+ ions were introduced to prepare 2D Fe-BTC MOF nanosheets through cation exchange. The resultant Fe-BTC nanosheet displays 77 times the peroxidase-like activity of its template Cu(HBTC)-1 nanosheet, and 2.2 times that of MIL-100(Fe), a well known 3D crystalline form of iron trimesates. The kinetic parameters of the Fe-BTC nanosheet surpass those of the reported 3D MOF nanozymes. The result demonstrates the outstanding peroxidase mimetic characteristic of the Fe-BTC nanosheet. In terms of these outcomes, simple and sensitive detection of H2O2 and glucose could be achieved.
2. Experimental section
2.1. Reagents and instrumentation
The detailed reagents and instrumentation used in the work are provided in the ESI.†2.2. Synthesis of MIL-100(Fe), Cu(HBTC)-1 and 2D Fe-BTC MOFs
To prepare MIL-100(Fe), we took 3.6 mmol Fe(NO3)3·9H2O and put it into 3.6 mL of water, followed by addition of 2.4 mmol H3BTC (1,3,5-benzenetricarboxylic acid). After stirring for 60 min at room temperature, the mixture was transferred to an autoclave that was heated at 160 °C for 12 h.To prepare cubic Cu2O, we took 0.0134 g CuCl2 and 0.1 g PVP (polyvinylpyrrolidone) and put them into 40 mL of water, followed by stirring for 5 min, and then 2.5 mL of 0.2 M NaOH was added slowly. Just 5 min after all NaOH was added, 2.5 mL of 0.1 M ascorbic acid was added dropwise into the solution, followed by continuous stirring at room temperature for 5 min. The cubic Cu2O nanoparticles were obtained by centrifuging and washing the solid with ethanol twice. Finally, the obtained cubic Cu2O nanoparticles were re-suspended into 10 mL of 95% ethanol.
To prepare Cu(HBTC)-1, we took 0.4 g PVP and put it into 60 mL water to obtain solution A. We took 0.2 g H3BTC and put it into 4 mL ethanol to get solution B. We mixed solution A and solution B under stirring to get a white mixed solution, followed by addition of 10 mL of Cu2O suspension in ethanol. After 16 h stirring, the solid product was separated by centrifugation, and was rinsed two times using CH3CH2OH/H2O and vacuum-dried at 25 °C for 24 h.
To synthesize 2D Fe-BTC, we took 10 mg of Cu(HBTC)-1 and put it into 20 mL water, followed by ultrasound treatment for 5 min. Next, we added 30 mg of FeCl3·6H2O into the mixture. After 3 h stirring, the solid 2D Fe-BTC product was separated by centrifugation and cleaned three times with ethanol/water, and vacuum-dried at 60 °C for 8 h. The vacuum dried solid was utilized to prepare a 2D Fe-BTC suspension (100 mg L−1) by dispersing 1 mg of the dried solid into 10 mL of deionized water.
2.3. Evaluation of the peroxidase mimetic activity of 2D Fe-BTC
In order to assess the peroxidase mimetic activity of 2D Fe-BTC, we took an H2O2 solution, TMB solution and 2D Fe-BTC suspension, put them into a test tube and made them up to 5.0 mL with 0.2 M NaAc–HAc buffer (pH 3.5). The final concentrations of the H2O2 solution, TMB solution and 2D Fe-BTC suspension were 0.1 mM, 0.1 mM, and 10 mg L−1, respectively. The mixed solution was incubated at 45 °C for 15 min, and then moved to a quartz cell for subsequent UV-vis measurements.2.4. Steady-state kinetic analysis
The kinetic experiment was carried out by measuring the absorbance variance at 652 nm within 5 min. The experiment was performed under the optimized conditions by changing the H2O2 concentration at a fixed TMB concentration (0.1 mM) or vice versa (0.08 mM H2O2). The kinetic parameters were determined by the following equation:| v = Vmax[S]/(Km + [S]) |
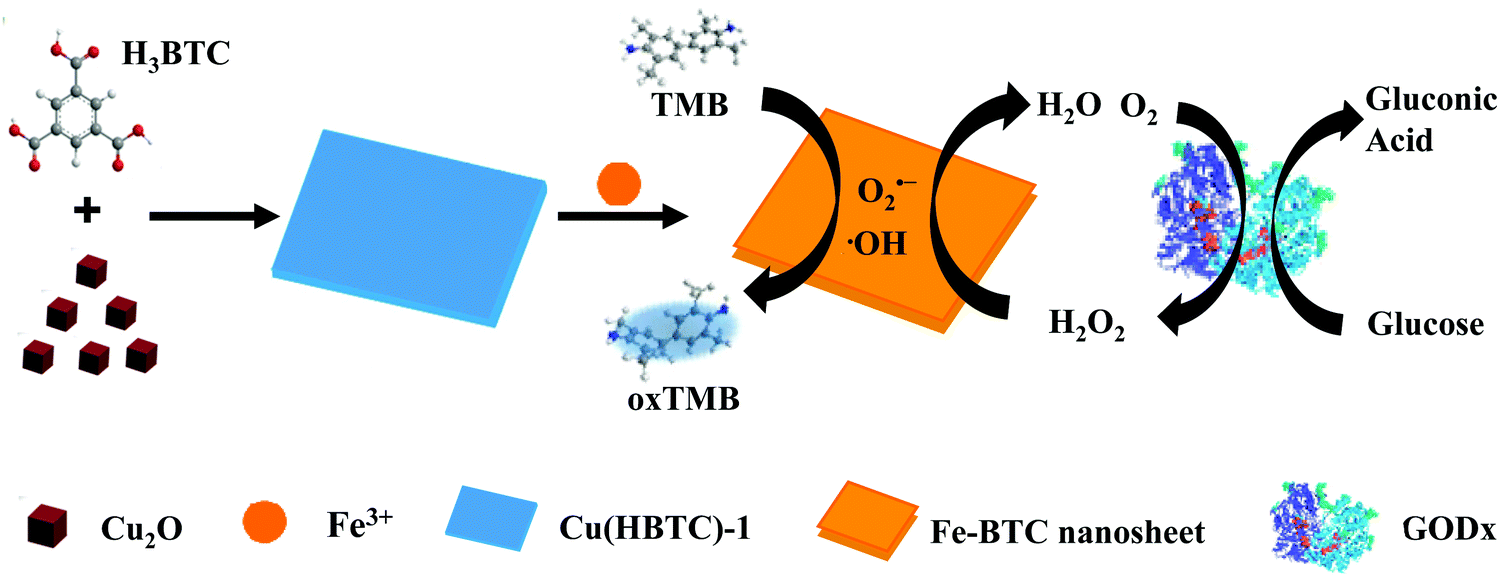 | ||
| Fig. 1 Schematic of the 2D Fe-BTC preparation and its use in glucose sensing. | ||
2.5. Glucose determination in biological samples
Glucose detection in real serum samples involves a two-stage procedure, namely, glucose standard curve construction and the determination of the glucose content in the actual sample. The detailed procedures for constructing the glucose standard curve, treating the serum samples, and determining the glucose content are given in the ESI.†3. Results and discussion
3.1. Characterization
2D Cu(HBTC)-1 was prepared by self-assembly of trimesic acid as organic ligands bridged with copper as metal nodes. As displayed in Fig. 2a, Cu(HBTC)-1 exhibits a sheet-like morphology with a smooth surface, indicating successful preparation of two-dimensional structure precursors. The nanosheet structure was also confirmed by AFM characterization (Fig. S1a, ESI†). After introducing Fe3+ ions into the Cu(HBTC)-1 precursor and stirring for 3 h, Cu(HBTC)-1 was converted to Fe-BTC, which inherited the 2D structure of the Cu(HBTC)-1 precursor with a rough surface (Fig. 2b). The size of Fe-BTC was about 2.6 μm × 2.1 μm (length × width, Fig. 2b and Fig. S1c, d, ESI†). AFM characterization shows that the average thickness of the 2D Fe-BTC nanosheets was about 77 nm (Fig. S1b, ESI†). However, a few stacked and some smaller Fe-BTC nanosheets can also be found (Fig. 2b and Fig. S1c, d, ESI†).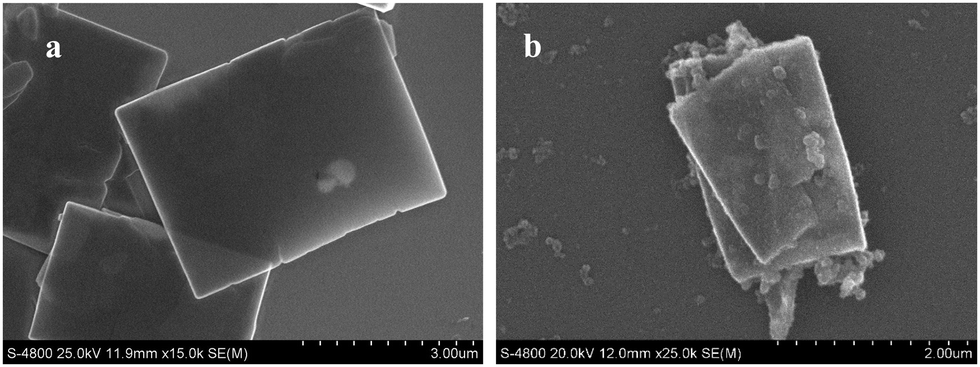 | ||
| Fig. 2 (a) SEM image of Cu(HBTC)-1. (b) SEM image of 2D Fe-BTC. | ||
The characteristic XRD diffraction peaks of Cu(HBTC)-1 (Fig. 3a) are similar to a previous report,18 confirming successful formation of Cu(HBTC)-1 through Cu2O and H3BTC. After reaction with Fe3+ ions, the characteristic peaks in the XRD pattern of Cu(HBTC)-1 disappear, while some new peaks at a 2θ of 18.95°, 23.45°, 28.2°, and 33.5° appear (Fig. 3a). They can be assigned to characteristic peaks of Basolite F300 (commercial Fe-BTC).19 This indicates that 2D Cu(HBTC)-1 has been transformed to 2D Fe-BTC.
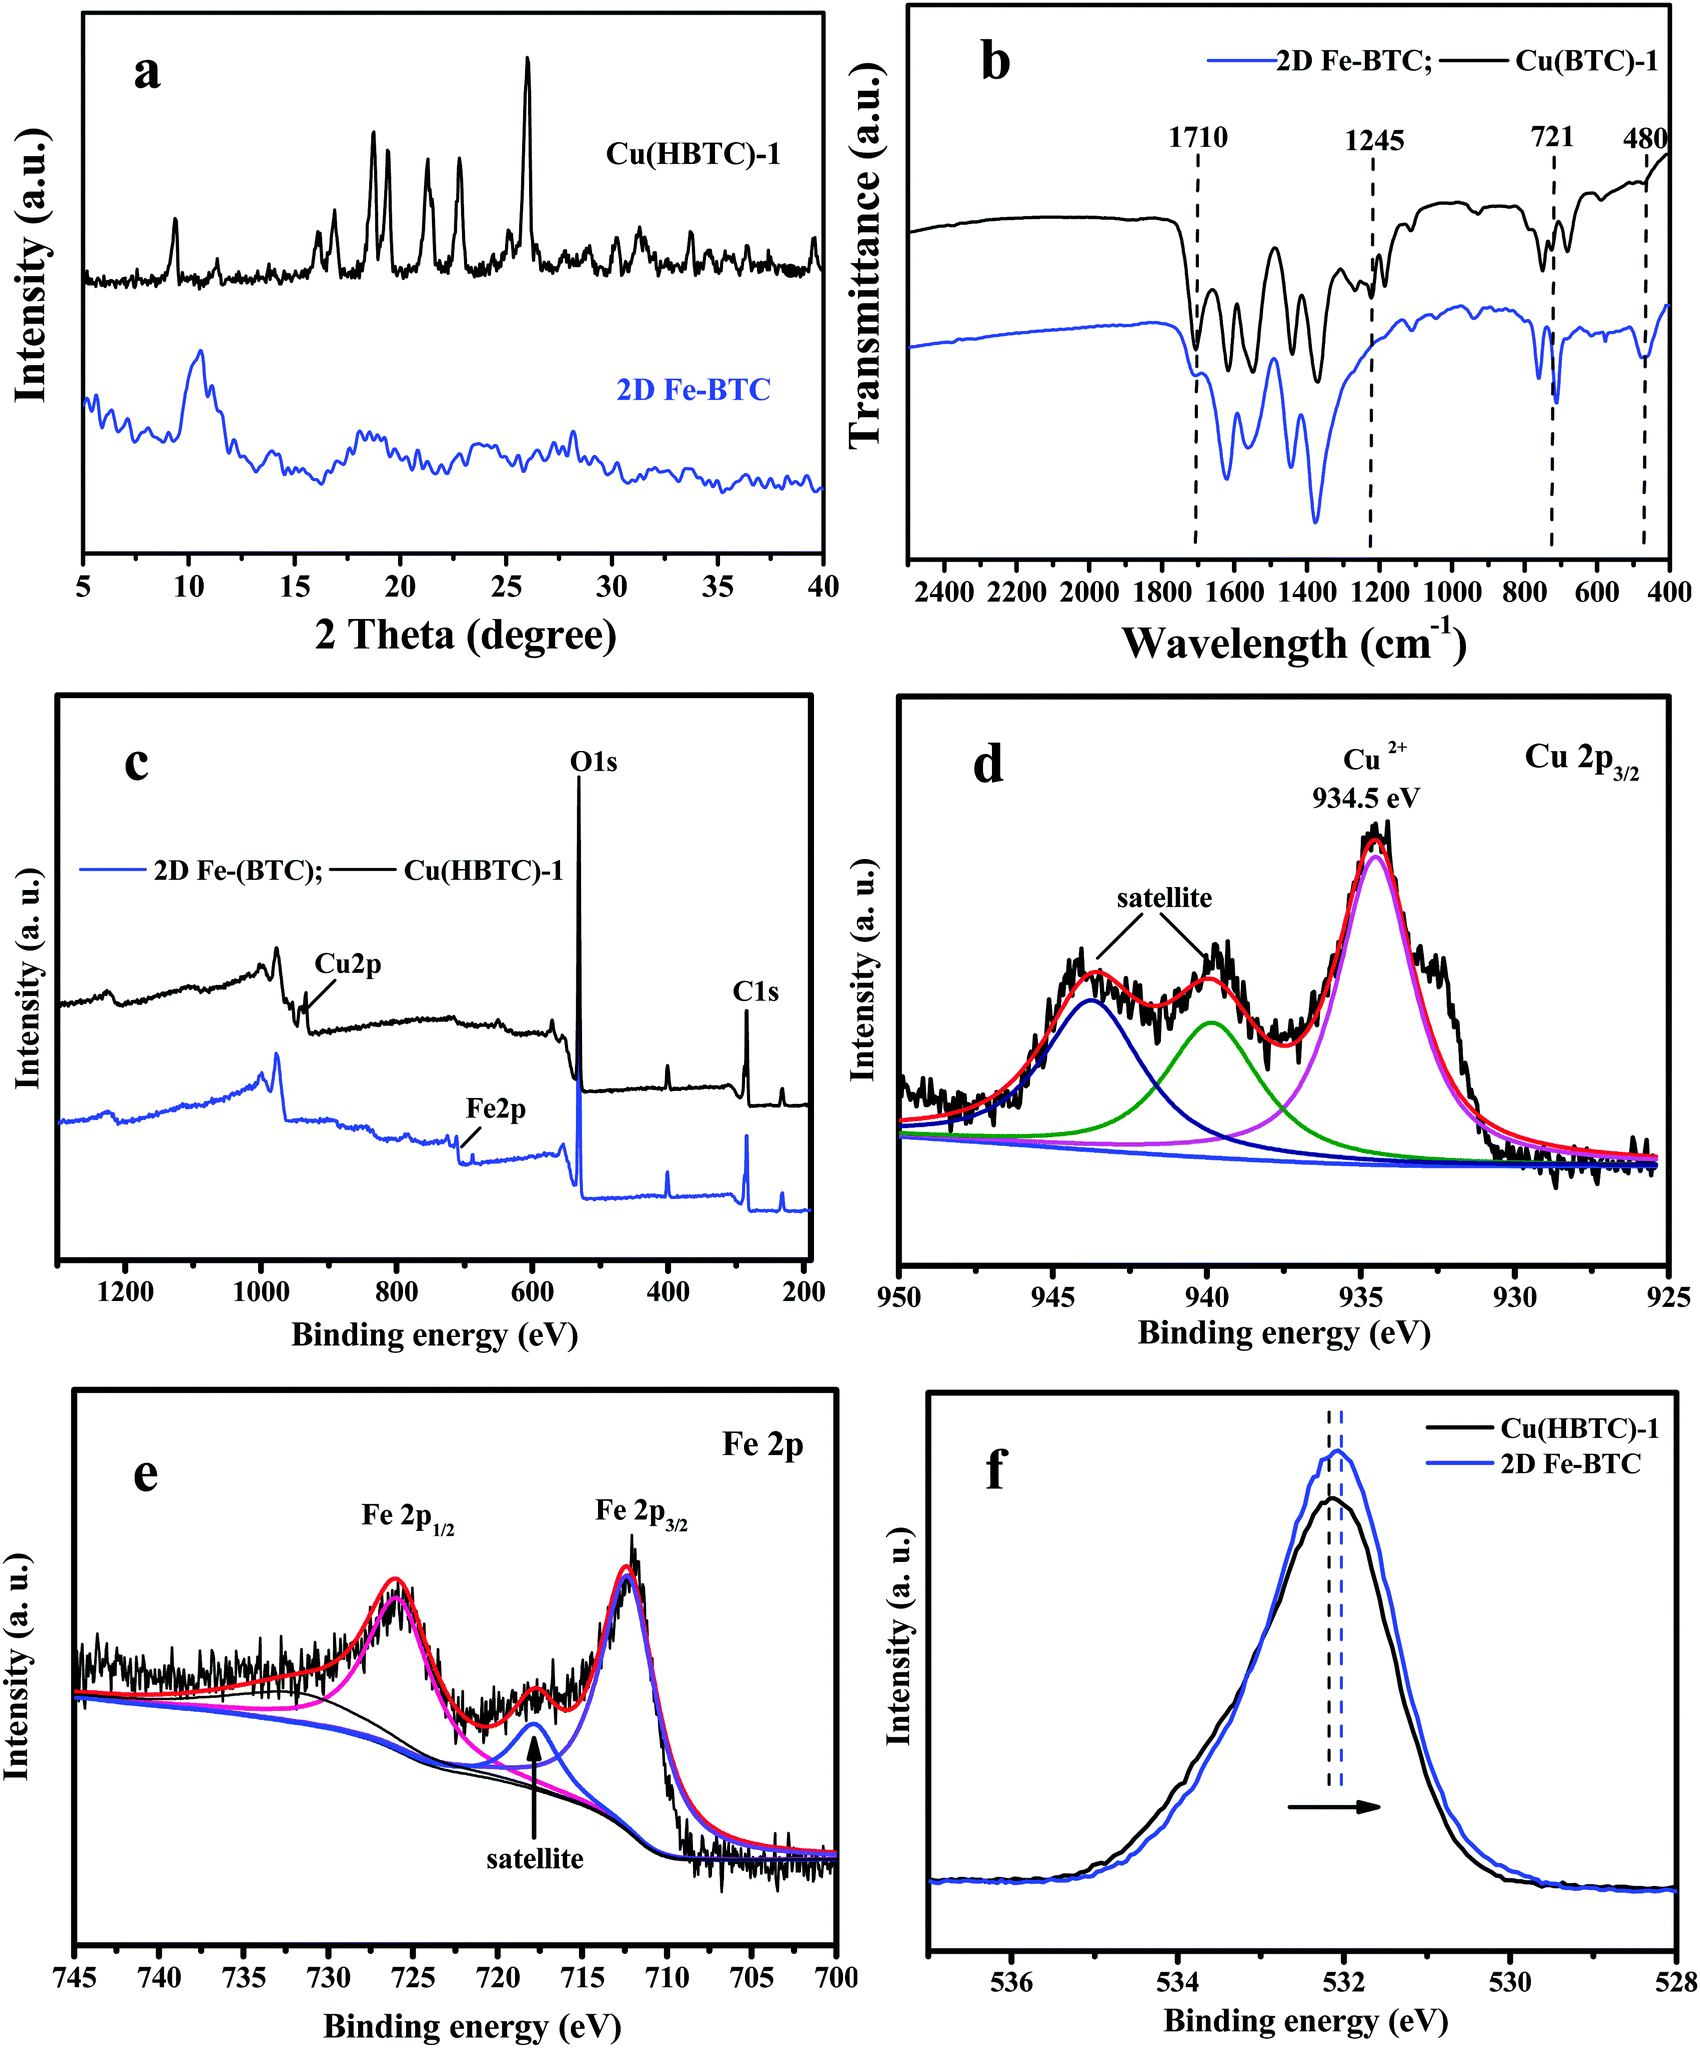 | ||
| Fig. 3 (a) XRD patterns of Cu(HBTC)-1 and 2D Fe-BTC. (b) The FT-IR spectra of Cu(HBTC)-1 and 2D Fe-BTC. (c) The XPS spectra of Cu(HBTC)-1 and 2D Fe-BTC. (d) XPS Cu 2p peaks of Cu(HBTC)-1. (e) XPS Fe 2p peaks of 2D Fe-BTC. (f) XPS O 1s peaks of Cu(HBTC)-1 and 2D Fe-BTC. | ||
The FT-IR spectra of the Cu(HBTC)-1 nanosheet display peaks at 1710 cm−1 and 1245 cm−1 (Fig. 3b), assigned to the C![[double bond, length as m-dash]](https://www.rsc.org/images/entities/char_e001.gif) O and C–OH combination bands of a carboxylic acid.20 The two bands at 1710 cm−1 and 1245 cm−1 in 2D Fe-BTC are somewhat weak relative to those in Cu(HBTC)-1, probably due to the different coordination ability of H3BTC ligands with Fe3+ and Cu2+ in the 2D MOF structure. The peaks at 721 cm−1 and 480 cm−1 belong to stretching and bending of Cu–O bonds in Cu(HBTC)-1,21 while that at 480 cm−1 corresponds to the stretching Fe–O vibration in Fe-BTC.22 The result suggested the successful transformation of Cu(HBTC)-1 into 2D Fe-BTC.
O and C–OH combination bands of a carboxylic acid.20 The two bands at 1710 cm−1 and 1245 cm−1 in 2D Fe-BTC are somewhat weak relative to those in Cu(HBTC)-1, probably due to the different coordination ability of H3BTC ligands with Fe3+ and Cu2+ in the 2D MOF structure. The peaks at 721 cm−1 and 480 cm−1 belong to stretching and bending of Cu–O bonds in Cu(HBTC)-1,21 while that at 480 cm−1 corresponds to the stretching Fe–O vibration in Fe-BTC.22 The result suggested the successful transformation of Cu(HBTC)-1 into 2D Fe-BTC.
The XPS spectrum of 2D Fe-BTC further clarified the composition and surface information. Comparing the XPS spectrum of Cu(HBTC)-1 with that of 2D Fe-BTC in Fig. 3c, the Fe 2p peak appeared in Fe-BTC, while that of Cu 2p disappeared. Table S1 (ESI†) shows that the atomic ratios of C, O, and Cu in 2D Cu(HBTC)-1 are 48.31%, 48.21%, and 3.47%, respectively. The atomic ratios of C, O, and Fe in 2D Fe-BTC are 41.94%, 54.93%, and 3.13%, respectively. Fig. 3d shows that the characteristic XPS peak in the Cu 2p3/2 region is observed at 934.5 eV, together with two shake-up satellites. This indicates the presence of divalent Cu(II) species.18a The high-resolution Fe 2p spectrum displays two peaks at 712.2 eV and 725.8 eV, with a satellite peak at 717.8 eV (Fig. 3e). They are attributed to Fe 2p3/2 and Fe 2p1/2 of Fe3+,18b indicating that iron is in the trivalent form in 2D Fe-BTC. Fig. 3f shows that the peak positions of the C–O–Cu bond in Cu(HBTC)-1 and C–O–Fe bond in 2D Fe-BTC were 532.20 and 532.02 eV, respectively. The binding energy of the C–O–Cu bond has a positive shift (∼0.18 eV) compared to the C–O–Fe bond (Fig. 3f). The small shift in O 1s XPS indicates the successful transformation of the C–O–Cu bond in Cu(HBTC)-1 to the C–O–Fe bond in Fe-BTC through the cation substitution strategy.17 However, it should be indicated that the O 1s peak (Fig. S2, see the ESI†) in the physically mixed Fe added to Cu(HBTC)-1 is the same as that of Cu(HBTC)-1, indicating that Fe-BTC cannot be formed through physical mixing.
To sum up, the characterization results from XRD, FT-IR spectra and XPS indicate successful transformation of Cu(HBTC)-1 to 2D Fe-BTC. The cation exchange also is confirmed by SEM-EDS (energy dispersive spectroscopy) elemental mapping, which shows the presence of iron element on the nanosheets (Fig. S3, ESI†).
3.2. The peroxidase mimetic activity of 2D Fe-BTC
TMB was utilized as a peroxidase mimic substrate to assess the catalytic performance of 2D Fe-BTC. Fig. 4a reveals that the introduction of 2D Fe-BTC into the H2O2/TMB system caused significant absorption at 652 nm (A652), while no obvious A652 was observed when H2O2 or 2D Fe-BTC was introduced into TMB solution. The result confirms the intrinsic peroxidase-like activity of 2D Fe-BTC. Fig. 4b displays the performance of MIL-100(Fe), 2D Cu(HBTC)-1 and 2D Fe-BTC as peroxidase mimics for catalytic oxidation of TMB by H2O2. The catalytic activity follows the order of 2D Fe-BTC > MIL-100(Fe) > 2D Cu(HBTC)-1. 2D Fe-BTC exhibits 77 times higher activity than its template Cu(HBTC)-1. In addition, the catalytic activity of 2D Fe-BTC is 2.2 times that of MIL-100(Fe), a well known 3D crystalline form of iron trimesates. This suggests that 2D nanosheet structure Fe-BTC has a higher density of accessible active sites than 3D bulk MOF crystals. Hence, our result shows that 2D Fe-BTC is an excellent peroxidase-like nanozyme.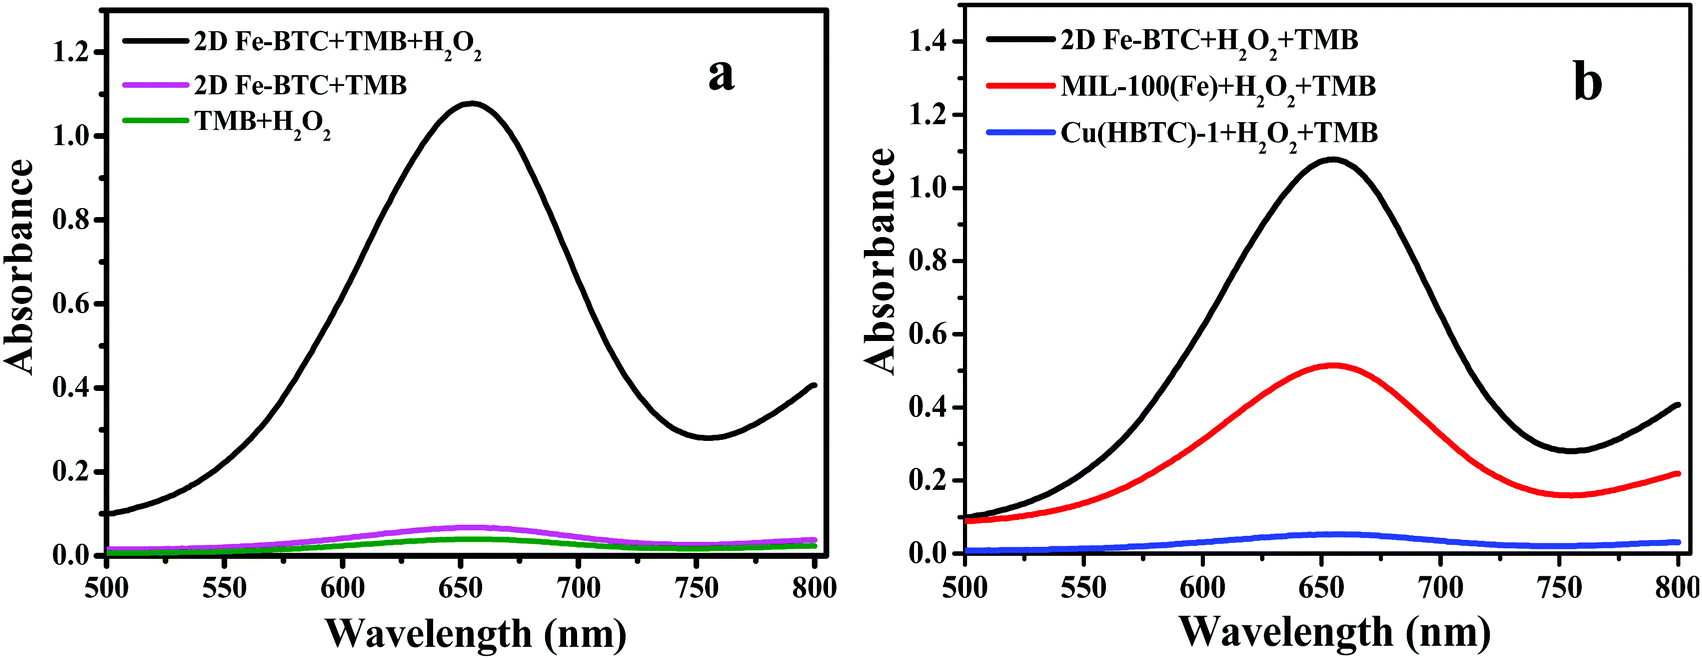 | ||
| Fig. 4 (a) UV-vis absorption spectra of TMB solutions with and without 2D Fe-BTC in the absence and presence of H2O2. (b) Catalytic activities of 2D Fe-BTC, Cu(HBTC)-1, and MIL-100(Fe) under the same conditions. Reaction conditions: 0.1 mM H2O2, 0.1 mM TMB, and 10 mg L−1 catalyst for 15 min reaction at pH 3.5 (0.2 M acetate buffer) and 45 °C. | ||
2D Fe-BTC displays good storage stability because its catalytic activity was held at 95% after three-month storage (Fig. S4, ESI†). Furthermore, only 4.6% iron was leached out in 0.2 M acetate buffer (pH 3.5) (see the ESI†). In addition, four batches of 2D Fe-BTC synthesized under identical conditions show good reproducibility with less than 2% variance in the peroxidase-like activity (Table S2, ESI†). The result suggested the satisfactory storage stability and reproducibility of the 2D Fe-BTC nanozymes.
3.3. Kinetic analysis of the 2D Fe-BTC nanozyme
The Michaelis–Menten kinetic curves of 2D Fe-BTC with a constant TMB concentration and changed H2O2 concentration or vice versa are illustrated in Fig. 5a and b, respectively. Two apparent kinetic parameters, namely, Km and Vmax, for 2D Fe-BTC were obtained and compared with other 3D Fe-based MOF nanozymes and HRP. As shown in Table 1, the Km values of 2D Fe-BTC for TMB and H2O2 were 0.2610 mM and 0.0334 mM, which were 1.6 and 1.9-fold lower than those of 3D MIL-100(Fe), respectively. Km is an indicator of the affinity of an enzyme for a substrate. In general, a lower Km value indicates higher affinity between the nanozyme and the substrate, and vice versa. Compared with 3D MIL-100(Fe), 2D Fe-BTC shows better affinity to H2O2 and TMB due to their nearly half Km value relative to MIL-100(Fe). In addition, the TMB oxidation rate and H2O2 reduction rate at a unit mass concentration of catalyst (Kw, see the ESI†) for 2D Fe-BTC were 2.7–72.3 and 1.5–37.9 times those of the previously reported 3D Fe-MOF nanozymes,4,5,7,23,24a respectively. This suggests high catalytic performance of 2D Fe-BTC, which is attributed to the 2D structure of Fe-BTC with rich accessible active sites. Also, the Km and Vmax values of 2D Fe-BTC for the H2O2 substrate were 14.6-fold lower and 0.47-fold higher than those of HRP,24b respectively. This indicated that the 2D Fe-BTC nanosheets had a stronger affinity and a higher reaction rate for H2O2 than HRP. Thus, using the 2D Fe-BTC nanozyme may lead to a higher sensitivity for glucose detection than HRP (Table S3, ESI†).24c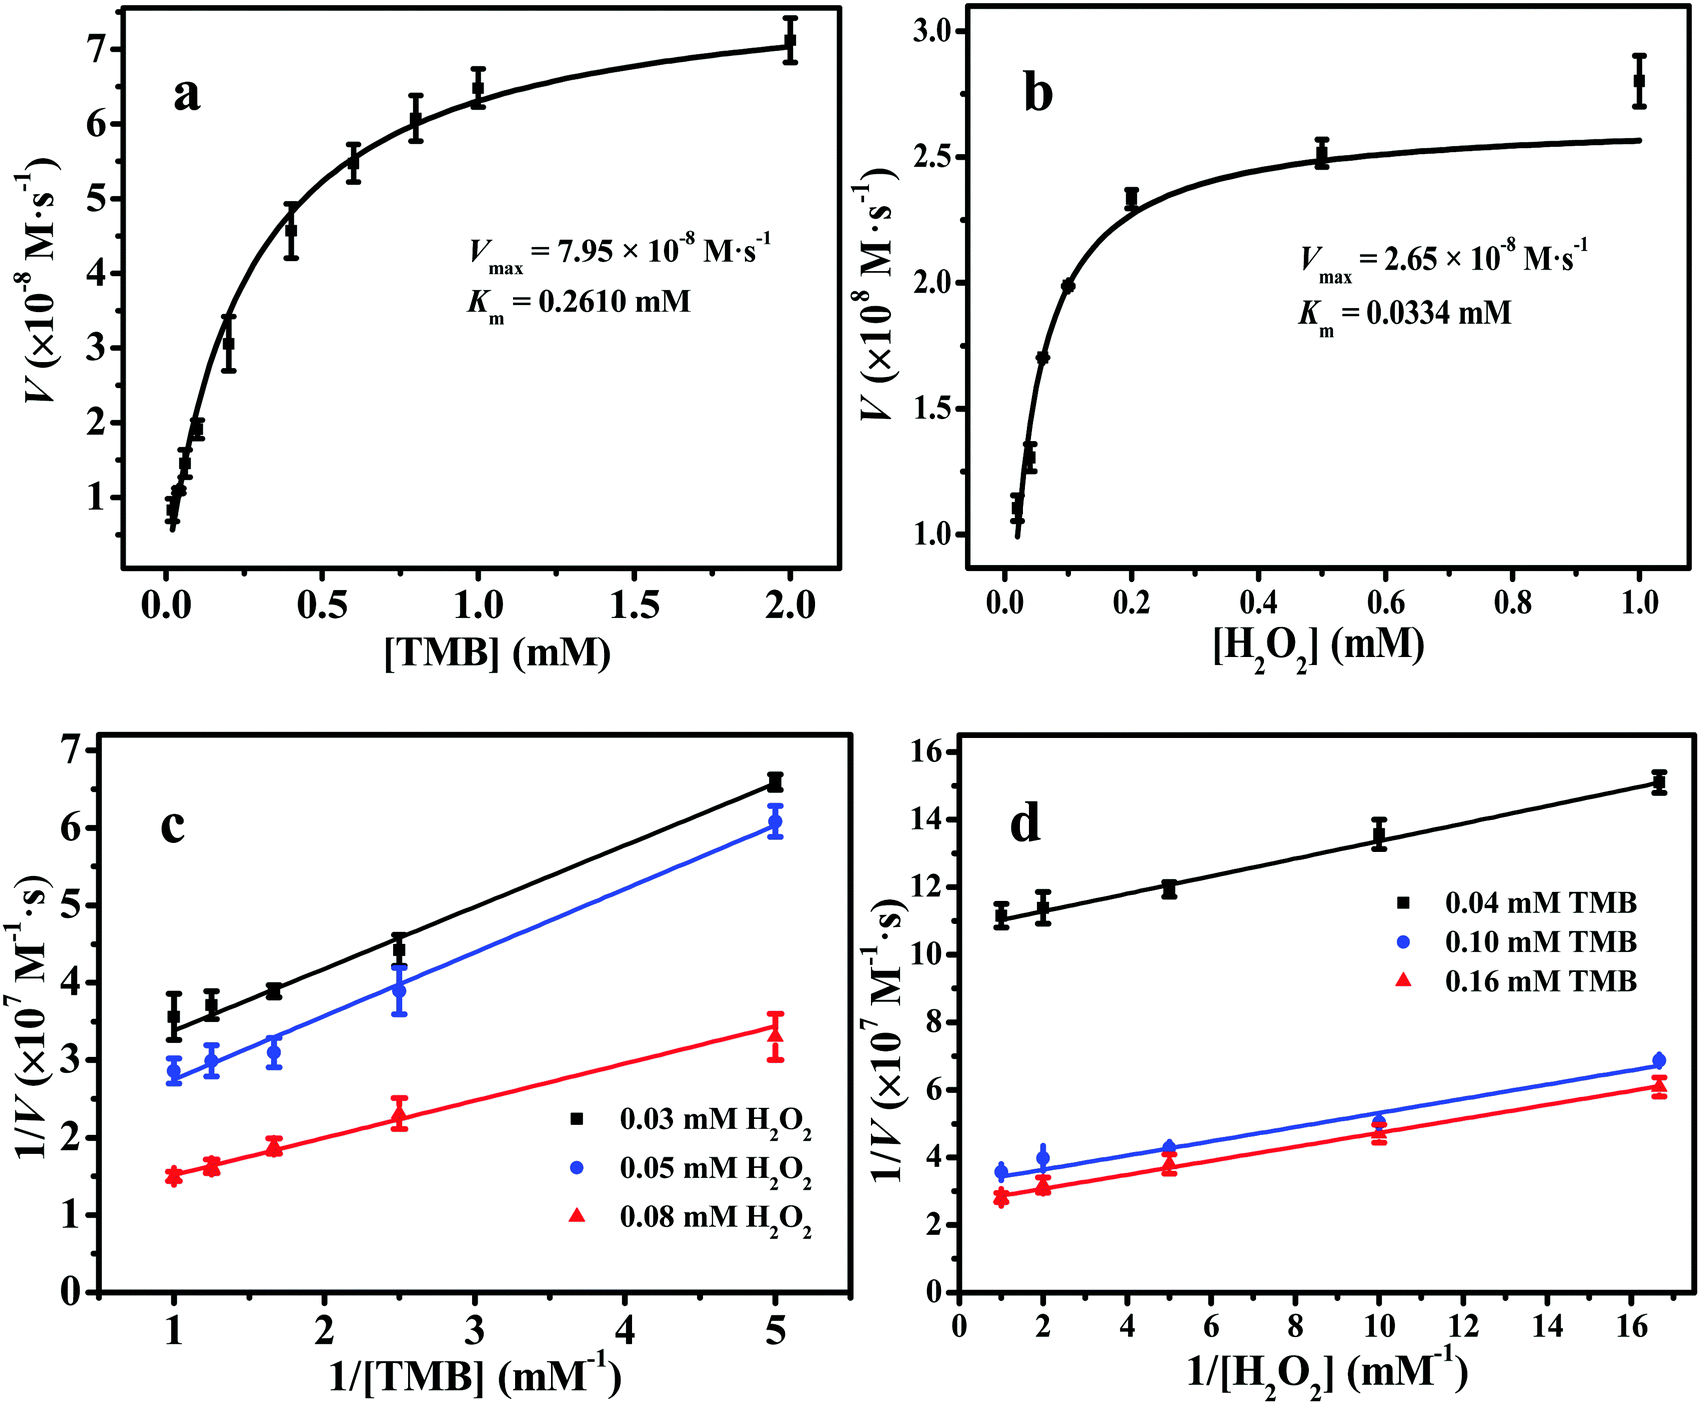 | ||
| Fig. 5 (a) Steady-state kinetic assay of 2D Fe-BTC at 0.08 mM H2O2 and different TMB concentrations. (b) Steady-state kinetic assay of 2D Fe-BTC at 0.1 mM TMB and different H2O2 concentrations. (c) Double reciprocal plots of the 2D Fe-BTC activity at 0.08 mM H2O2 and varied TMB concentration. (d) Double reciprocal plots of the 2D Fe-BTC activity at 0.1 mM TMB and varied H2O2 concentration. | ||
| Catalyst | Substrate | K m (mM) | V max (10−8 M s−1) | C catalyst (mg L−1) | K w (10−10 M s−1 L mg−1) | Ref. |
|---|---|---|---|---|---|---|
| MIL-53(Fe) by CE | H2O2 | 0.04 | 1.86 | 38 | 4.9 | 4 |
| TMB | 1.08 | 8.78 | 23.1 | |||
| Fe-MIL-88NH2 | H2O2 | 0.206 | 7.04 | 40 | 17.6 | 5 |
| TMB | 0.284 | 10.47 | 26.2 | |||
| MIL-100(Fe) | H2O2 | 0.064 | 1.4 | 200 | 0.7 | 7 |
| TMB | 0.424 | 2.1 | 1.1 | |||
| Glycine-MIL-53(Fe) | H2O2 | 0.10 | 2.25 | 30 | 7.5 | 23 |
| TMB | 0.11 | 2.28 | 7.6 | |||
| MIL-53(Fe) by MW | H2O2 | 0.03 | 0.96 | 15 | 6.4 | 24a |
| TMB | 0.28 | 4.48 | 29.9 | |||
| HRP | H2O2 | 0.52 | 1.82 | 10−3 | 1.82 × 10⁵ | 24b |
| TMB | 0.16 | 4.72 | 4.72 × 10⁵ | |||
| 2D Fe-BTC | H2O2 | 0.0334 | 2.65 | 10 | 26.5 | This work |
| TMB | 0.2610 | 7.95 | 79.5 |
The double-reciprocal plots of 2D Fe-BTC are exhibited in Fig. 5c and d. They were acquired at three H2O2 concentration levels (0.03 mM, 0.05 mM and 0.08 mM) and three TMB concentration levels (0.04 mM, 0.10 mM and 0.16 mM), respectively. As Fig. 5c and d show, the slope of the lines is near parallel, which is the feature of the ping-pong mechanism for substrate oxidation, like the natural enzyme HRP25a and other nanoyzmes.24a,25b–d This indicates that 2D Fe-BTC reacts with the first substrate and then sets free the first product before reacting with the second one.25b–d
3.4. Possible reactive species in the 2D Fe-BTC catalyzed TMB oxidation by H2O2
To explore the reactive oxygen types in the H2O2/TMB/2D Fe-BTC system, five radical scavengers were used, including NaN3 (1O2 quencher), thiourea (TH, ˙OH radical quencher), p-benzoquinone (BQ, O2˙− radical quencher), and ascorbic acid (AA, quencher of ˙OH and O2˙− radicals). As Fig. S5 (ESI†) shows, BQ, TH and AA caused an apparent decrease in the A652 value of the H2O2/TMB/2D Fe-BTC system, and A652 decreased with the scavenger concentration. Thus, ˙OH radicals and O2˙− radicals were produced in this system and played an important role in TMB oxidation. The production of ˙OH and O2˙− radicals was further confirmed by EPR (electron paramagnetic resonance, see the ESI†) results. Fig. S6a (ESI†) displays the enhanced characteristic EPR peaks of the DMPO/˙OH adduct with an intensity ratio of 1![[thin space (1/6-em)]](https://www.rsc.org/images/entities/char_2009.gif) :2:2:1 upon addition of 2D Fe-BTC into the DMPO/H2O2 system, indicating the generation of more ˙OH radicals in the presence of 2D Fe-BTC. Similarly, when 2D Fe-BTC aqueous solution was replaced by 2D Fe-BTC methanol solution, the EPR spectrum presents four peaks with almost equal intensity (Fig. S6b, ESI†), suggesting generation of O2˙− radicals in the reaction system. In addition, the introduction of NaN3 caused a subtle change in A652 of the H2O2/TMB/2D Fe-BTC system (Fig. S5, ESI†), suggesting that singlet oxygen was not the key reactive species.
:2:2:1 upon addition of 2D Fe-BTC into the DMPO/H2O2 system, indicating the generation of more ˙OH radicals in the presence of 2D Fe-BTC. Similarly, when 2D Fe-BTC aqueous solution was replaced by 2D Fe-BTC methanol solution, the EPR spectrum presents four peaks with almost equal intensity (Fig. S6b, ESI†), suggesting generation of O2˙− radicals in the reaction system. In addition, the introduction of NaN3 caused a subtle change in A652 of the H2O2/TMB/2D Fe-BTC system (Fig. S5, ESI†), suggesting that singlet oxygen was not the key reactive species.
3.5. Optimization of the 2D Fe-BTC nanozyme activity for the determination of H2O2
Like other nanozymes, the peroxidase mimic catalytic performance of 2D Fe-BTC was controlled by pH, temperature and its concentration. Fig. S7a (ESI†) shows that the catalytic activity of 2D Fe-BTC increased with pH from 2.5 to 3.5 and decreased with pH from 3.5 to 9.0. This is likely attributed to the diamine structure of TMB, which has poor solubility at a higher pH.25e Thus, pH 3.5 was used as the optimal pH for subsequent experiments. The temperature effect was studied from 20 °C to 55 °C. Fig. S7b (ESI†) shows that the catalytic activity reached its peak when the temperature was 45 °C, which was used as the optimum temperature. This is because when the temperature is increased from 20 °C to 45 °C, the content of TMB+˙ (cation free-radical, one-electron oxidation product of TMB, Scheme S1, see the ESI†) grows to a maximum,25f leading to maximal A652 (Fig. S7c, ESI†). Meanwhile, when the temperature is above 45 °C, the peak at 652 nm decays due to formation of an abundant yellow complex of a two-electron oxidation product of TMB (inset in Fig. S7c, ESI†) with a peak at 450 nm (Fig. S7c, ESI†). The effect of the concentration of 2D Fe-BTC was investigated from 2.5 to 35 mg L−1. As displayed in Fig. S7d (ESI†), the catalytic activity of 2D Fe-BTC increased with the 2D Fe-BTC concentration in the 2.5–10 mg L−1 range, while it decreased slowly at above 10 mg L−1 2D Fe-BTC. Based on the above results, the optimal peroxidase-like activity of 2D Fe-BTC was obtained under the conditions of pH 3.5, 45 °C and 10 mg L−1 of 2D Fe-BTC. Fig. 6a shows that the absorbance of the TMB/2D Fe-BTC/H2O2 system increases with the H2O2 concentration up to 200 μM. Fig. 6b shows that the linear range for H2O2 is 0.04–30 μM (r2 = 0.9952, n = 10). The limit of detection (LOD, 3σ) for H2O2 is 36 nM, which is much lower than those obtained by other 3D Fe-MOF and Fe-based nanozymes, including MIL-53(Fe),4 MIL-68(Fe),6 MIL-100(Fe),7 Fe3O4@MS NPs,26 Fe3O4@C nanostructures,27 and Fe3S4 MNPs28 (Table S3, ESI†).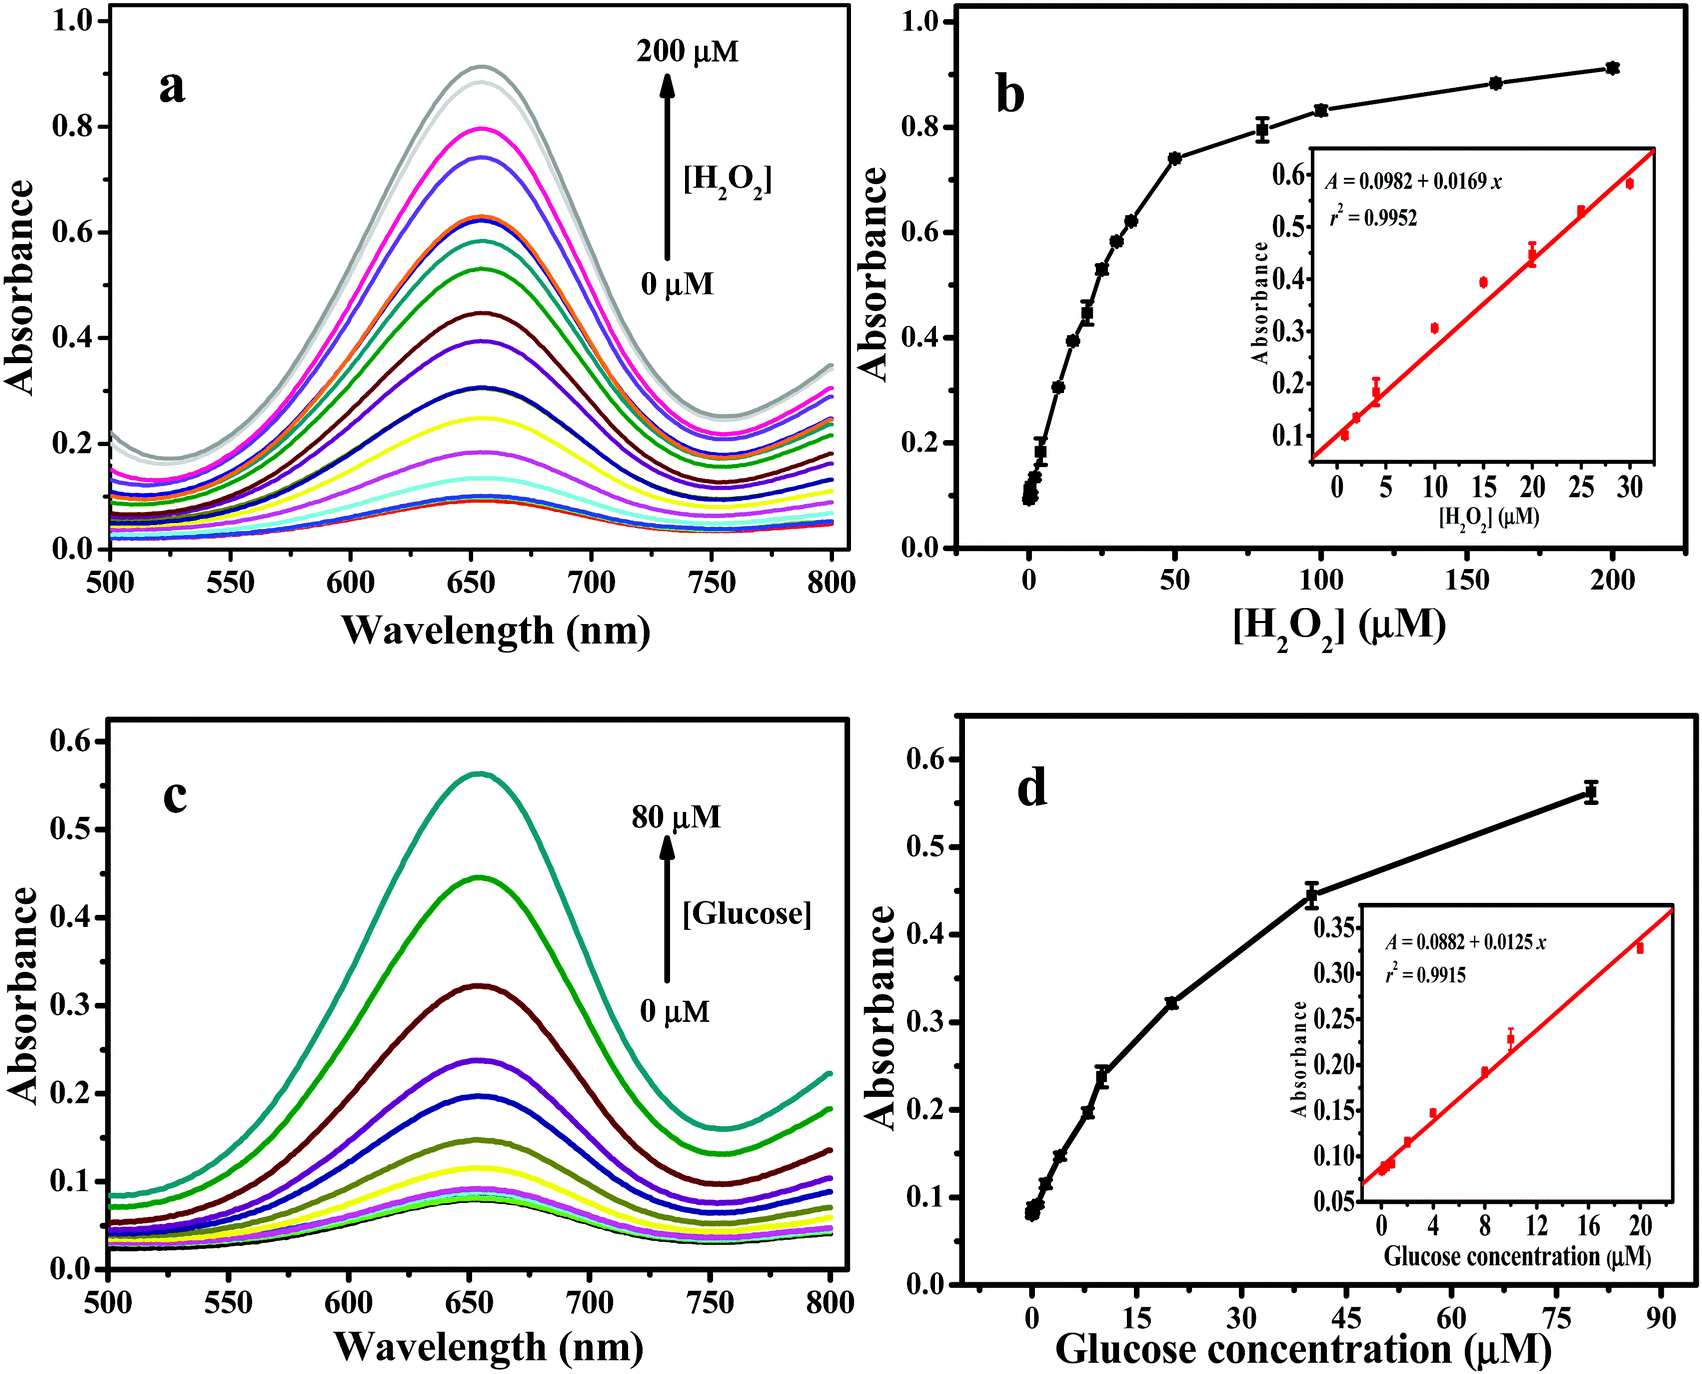 | ||
| Fig. 6 (a) UV/vis spectra of the TMB/2D Fe-BTC system upon addition of various concentrations of H2O2. (b) A concentration–response curve for H2O2. Inset: Linear calibration plot for H2O2. (c) UV/vis spectra of the TMB/2D Fe-BTC/GODx system upon addition of various concentrations of glucose. (d) A concentration–response curve for glucose. Inset: Linear calibration plot for glucose. | ||
3.6. Application of the 2D Fe-BTC nanozyme for glucose biosensing
To demonstrate the potential application of the 2D Fe-BTC peroxidase-like nanozyme in biosensing, we constructed a colorimetric assay by coupling glucose oxidase (GODx) with 2D Fe-BTC as peroxidase mimics for detecting glucose in serum because H2O2 is a glucose oxidation product in the presence of GODx. Following the procedure for construction of the glucose standard curve in the Experimental section (see the ESI†), the absorbance of the 2D Fe-BTC nanozyme-based color system increases with the glucose concentration up to 80 μM (Fig. 6c). A linear response for glucose was obtained over the range of 0.04 to 20 μM (r2 = 0.9915, n = 9) (Fig. 6d). The LOD (3σ) for glucose was 39 nM. As shown in Table S3 (ESI†), the LOD obtained for 2D Fe-BTC for glucose was much lower than those for other 3D Fe-MOFs, such as Fe-MIL-88NH2,5 and MIL-53(Fe),24 and other Fe-based nanozymes, including Fe3O4@MS NPs,26 Fe3O4@C nanostructures,27 Fe3S4 MNPs,28 and Fe-g-C3N4.29 The result indicated high sensitivity of the 2D Fe-BTC nanozyme based method for glucose.To verify the specificity of the assay for glucose detection in practical serum samples, selectivity trials were conducted by replacing 0.05 mM glucose with 0.5 mM of lactose, fructose and maltose, respectively. Fig. S8 (ESI†) shows that these analogues of glucose have a minor response even at 10 times the glucose concentration. This indicates that the 2D Fe-BTC peroxidase mimetic-based colorimetric assay promises high selectivity for glucose detection. Following the experimental details for glucose detection in real samples in the Experimental section (see the ESI†), the method was used for glucose determination in three human serum samples. Table 2 shows that the result obtained from this method is consistent with that from a commercial glucose GODx-PAP assay. This demonstrates high accuracy and reliability of the assay for glucose detection in complex samples.
4. Conclusion
In conclusion, via a multivalent cation substitution strategy, we successfully prepared 2D Fe-BTC with high peroxidase mimetic activity. The Cu(HBTC)-1 nanosheet was used as a precursor to synthesize 2D Fe-BTC at room temperature. 2D Fe-BTC shows much higher affinity to H2O2 and TMB relative to other 3D Fe-based MOFs. The enhanced catalytic activity is mainly attributed to highly accessible active sites on the surface of 2D Fe-BTC, which is beneficial for the contact of substrate molecules with the catalyst during TMB oxidation by H2O2. The major reactive oxygen types in the H2O2/TMB/2D Fe-BTC system are ˙OH radicals and O2˙− radicals. Based on the excellent peroxidase-like activity of 2D Fe-BTC, a simple, sensitive and selective platform was constructed to determine H2O2 and glucose. The assay was satisfactorily utilized for glucose determination in complex matrices, such as human serum samples. Our work reveals a prospective strategy for the rational design of 2D MOF nanozymes for chemo/biosensing applications.Conflicts of interest
There are no conflicts to declare.Acknowledgements
This work is financially supported by the Fundamental Research Funds for the Central Universities (XDJK2019C030).References
- R. J. Kuppler, D. J. Timmons, Q. Fang, J. Li, T. A. Makal, M. D. Young, D. Yuan, D. Zhao, W. Zhuang and H. Zhou, Coord. Chem. Rev., 2009, 253, 3042–3066 Search PubMed.
- D. Feng, Z. Gu, J. Li, H. Jiang, Z. Wei and H. Zhou, Angew. Chem., Int. Ed., 2012, 51, 10307–10310 Search PubMed.
- (a) Y. Chen, T. Hoang and S. Ma, Inorg. Chem., 2012, 51, 12600–12602 Search PubMed; (b) S. Li, X. Liu, H. Chai and Y. Huang, TrAC, Trends Anal. Chem., 2018, 105, 391–403 Search PubMed; (c) S. Li, X. Hu, Q. Chen, X. Zhang, H. Chai and Y. Huang, Biosens. Bioelectron., 2019, 137, 133–139 Search PubMed.
- L. Ai, L. Li, C. Zhang, J. Fu and J. Jiang, Chem. – Eur. J., 2013, 19, 15105–15108 Search PubMed.
- Y. Liu, X. J. Zhao, X. X. Yang and Y. F. Li, Analyst, 2013, 138, 4526–4531 Search PubMed.
- J. W. Zhang, H. T. Zhang, Z. Y. Du, X. Q. Wang, S. H. Yu and H. L. Jiang, Chem. Commun., 2014, 50, 1092–1094 Search PubMed.
- A. H. Valekar, B. S. Batule, M. I. Kim, K. Cho, D. Hong, U. Lee, J. Chang, H. Park and Y. K. Hwang, Biosens. Bioelectron., 2018, 100, 161–168 Search PubMed.
- M. Zhao, Q. Lu, Q. Ma and H. Zhang, Small Methods, 2017, 1, 1600030 Search PubMed.
- D. Deng, K. S. Novoselov, Q. Fu, N. Zheng, Z. Tian and X. Bao, Nat. Nanotechnol., 2016, 11, 218–230 Search PubMed.
- (a) M. T. Zhao, Y. Huang, Y. W. Peng, Z. Q. Huang, Q. L. Ma and H. Zhang, Chem. Soc. Rev., 2018, 47, 6267–6295 Search PubMed; (b) Y. Sun, S. Gao, F. Lei and Y. Xie, Chem. Soc. Rev., 2015, 44, 623–636 Search PubMed.
- (a) X. Q. Liu, Z. Q. Yan, Y. Zhang, Z. W. Liu, Y. H. Sun, J. S. Ren and X. G. Qu, ACS Nano, 2019, 13, 5222–5230 Search PubMed; (b) F. Cao, M. Zhao, Y. Yu, B. Chen, Y. Huang, J. Yang, X. Cao, Q. Lu, X. Zhang, Z. Zhang, C. Tan and H. Zhang, J. Am. Chem. Soc., 2016, 138, 6924–6927 Search PubMed.
- Y. Wang, M. Zhao, J. Ping, B. Chen, X. Cao, Y. Huang, C. Tan, Q. Ma, S. Wu, Y. Yu, Q. Lu, J. Chen, W. Zhao, Y. Ying and H. Zhang, Adv. Mater., 2016, 28, 4149–4155 Search PubMed.
- Y. Peng, Y. Li, Y. Ban, H. Jin, W. Jiao, X. Liu and W. Yang, Science, 2014, 346, 1356–1359 Search PubMed.
- P. Li, Y. Maeda and Q. Xu, Chem. Commun., 2011, 47, 8436–8438 Search PubMed.
- T. Rodenas, I. Luz, G. Prieto, B. Seoane, H. Miro, A. Corma, F. Kapteijn, F. X. L i. Xamena and J. Gascon, Nat. Mater., 2015, 14, 48–55 Search PubMed.
- (a) L. Qin, X. Wang, Y. Liu and H. Wei, Anal. Chem., 2018, 90, 9983–9989 Search PubMed; (b) X. Wang, X. Jiang and H. Wei, J. Mater. Chem. B, 2020, 8, 6905–6911 Search PubMed.
- W. Li, Y. Zhang, C. Zhang, Q. Meng, Z. Xu, P. Su, Q. Li, C. Shen, Z. Fan, L. Qin and G. Zhang, Nat. Commun., 2016, 7, 11315 Search PubMed.
- (a) G. Zhan and H. C. Zeng, Adv. Fun. Mater., 2016, 26, 3268–3281 Search PubMed; (b) W. H. Niu, L. G. Li, X. J. Liu, N. Wang, J. Liu, W. J. Zhou, Z. H. Tang and S. W. Chen, J. Am. Chem. Soc., 2015, 137, 5555–5562 Search PubMed.
- M. Sanchezsanchez, I. De Asua, D. Ruano and K. Diazl, Cryst. Growth Des., 2015, 15, 4498–4506 Search PubMed.
- J. B. Decoste, G. W. Peterson, B. J. Schindler, K. L. Killops, M. A. Broweb and J. J. Mahle, J. Mater. Chem. A, 2013, 1, 11922–11932 Search PubMed.
- R. Kaur, A. Kaur, A. Umar, W. A. Andersonc and S. K. Kansal, Mater. Res. Bull., 2019, 109, 124–133 Search PubMed.
- N. M. Mahmoodi, J. Abdi, M. Oveisi, M. A. Asli and M. Vossoughi, Mater. Res. Bull., 2018, 100, 357–366 Search PubMed.
- W. Dong, L. Yang and Y. Huang, Talanta, 2017, 167, 359–366 Search PubMed.
- (a) W. Dong, X. Liu, W. Shi and Y. Huang, RSC Adv., 2015, 5, 17451–17457 Search PubMed; (b) L. Liu, Y. Shi, Y. Yang, M. Li, Y. Long, Y. Huang and H. Zheng, Chem. Commun., 2016, 52, 13912–13915 Search PubMed; (c) S. Xu, H. Qi, S. Zhou, X. Zhang and C. Zhang, Microchim. Acta, 2014, 181, 535–541 Search PubMed.
- (a) D. J. T. Porter and H. J. Brights, J. Bio. Chem., 1983, 258, 9913–9924 Search PubMed; (b) Y. L. Dong, H. G. Zhang, Z. U. Rahman, L. Su, X. J. Chen, J. Hu and X. G. Chen, Nanoscale, 2012, 4, 3969–3976 Search PubMed; (c) L. Z. Gao, J. Zhuang, L. Nie, J. B. Zhang, Y. Zhang, N. Gu, T. Wang, J. Feng, D. Yang and S. Perrett, Nat. Nanotechnol., 2007, 2, 577–583 Search PubMed; (d) A. Ahmed, P. John, M. H. Nawaz, A. Hayat and M. Nasir, ACS App. Nano Mater., 2019, 2, 5156–5168 Search PubMed; (e) W. He, Y. Liu, J. Yuan, J.-J. Yin, X. Wu, X. Hu, K. Zhang, J. Liu, C. Chen, Y. Ji and Y. Guo, Biomaterials, 2011, 32, 1139–1147 Search PubMed; (f) J. Yin, H. Cao and Y. Lu, J. Mater. Chem., 2012, 22, 527–534 Search PubMed.
- Y. Wang, B. Zhou, S. Wu, K. Wang and X. He, Talanta, 2015, 134, 712–717 Search PubMed.
- N. Lu, M. Zhang, L. Ding, J. Zheng, C. Zeng, Y. Wen, G. Liu, A. Aldalbahi, J. Shi, S. Song, X. Zuo and L. Wang, Nanoscale, 2017, 9, 4508–4515 Search PubMed.
- C. Ding, Y. Yan, D. Xiang, C. Zhang and Y. Xian, Microchim. Acta, 2016, 183, 625–631 Search PubMed.
- J. Tian, Q. Liu, A. M. Asiri, A. H. Qusti, A. O. Al-Youbi and X. Sun, Nanoscale, 2013, 5, 11604–11609 Search PubMed.
Footnote |
| † Electronic supplementary information (ESI) available. See DOI: 10.1039/d0tb01598a |
| This journal is © The Royal Society of Chemistry 2020 |