 Open Access Article
Surfactant-free liquid-exfoliated copper hydroxide nanocuboids for non-enzymatic electrochemical glucose detection†
Peter J.
Lynch
 *a,
Aline
Amorim Graf
 a,
Sean P.
Ogilvie
 a,
Matthew J.
Large
 a,
Jonathan P.
Salvage
b and
Alan B.
Dalton
 *a
*a
aUniversity of Sussex, Department of Physics and Astronomy, Brighton, BN1 9RH, UK. E-mail: p.j.lynch@sussex.ac.uk
bUniversity of Brighton, School of Pharmacy and Biomolecular Science, Brighton, BN2 4GJ, UK
First published on 29th July 2020
Abstract
To facilitate printable sensing solutions particles need to be suspended and stabilised in a liquid medium. Hansen parameters were used to identify that alcohol–water blends are ideal for stabilising colloidal copper hydroxide in dispersion. The suspended material can be further separated in various size fractions with a distinct cuboid geometry which was verified using atomic force microscopy. This facilitates the development of Raman spectroscopic metrics for determining particle sizes. This aspect ratio is related to the anisotropic crystal structure of the bulk crystallites. As the size of the nanocuboids decreases electrochemical sensitivity of the material increases due to an increase in specific surface area. Electrochemical glucose sensitivity was investigated using both cyclic voltammetry and chronoamperometry. The sensitivity is noted to saturate with film thickness. The electrochemical response of 253 mA M−1 cm−2 up to 0.1 mM and 120 mA cm−2 up to 0.6 mM allow for calibration of potential devices. These results indicate suitability for use as a glucose sensor and, due to the surfactant-free, low boiling point solvent approach used to exfoliate the nanocuboids, it is an ideal candidate for printable solutions. The ease of processing will also allow this material to be integrated in composite films for improved functionality in future devices.
Introduction
Glucose concentration sensing is critical for diagnosis and monitoring of a variety of medical conditions, particularly diabetes.1 Electrochemical sensing of glucose is a mature field, but significant challenges remain. While enzymatic glucose sensors are capable of operating in physiological conditions they suffer from being relatively expensive and with stability issues.1–3 This has led to a foray into non-enzymatic detectors to avoid these issues,1,2,4,5 which are mainly comprised of metal oxides and associated compounds. For enhanced surface area electrodes, layered materials are a relevant and exciting avenue to pursue.Graphene is the archetypical two-dimensional material.6 First reported as isolated in 2004, it has excellent mechanical and electrical properties. These properties, compounded with the excellent surface area, make for an excellent candidate for electrochemical sensors. Liquid processing of this material is required to produce sufficient quantity of material for effective devices in addition to allowing for printable devices. To that end, extensive work has been done from functionalising graphite by oxidation, to allow the delamination of graphene oxide (GO) flakes,7 to choosing appropriate additives or solvents for liquid phase exfoliation, to stabilise pristine graphene flakes in dispersion.8,9 Liquid exfoliation, traditionally through ultrasonication, has now been increased in scale by shear exfoliation10 and microfluidic shearing.11 Both of these materials have advantages associated with them, however, graphene oxide and reduced derivatives have found a niche in enzymatic glucose sensing by using basal plane defects as preferential adsorption sides for enzymes.12,13 Pristine graphene, with no basal plane defects and thus better electrical properties, is of more interest as a charge transport material in films where the sensing material is a less conductive semiconductor or insulator.14
For non-enzymatic glucose sensing, layered double hydroxides (LDHs) present an interesting avenue of investigation. While similar to the metal oxides on which many sensors are based they are a layered material like graphene, with a plane of metal atoms sandwiched between two planes of hydroxyl groups,15 and can be processed in liquids.16 While many LDHs are naturally occurring as minerals they are often synthesised due to the ready availability of reagents.17,18
Copper hydroxide presents as a blue solid in the bulk. It is a wide bandgap semiconductor. The structure of Cu(OH)2 is different to brucite-structured LDHs such as Mg(OH)2 and Ni(OH)2 in that rather than a hexagonal array of metal atoms they are arranged in a corrugated structure with the symmetry group Cmc21.19 A variety of electrochemical applications of this material have been proposed, namely pseudocapacitive charge storage,20 oxygen evolution,21 and glucose sensing.14 Copper hydroxide, while naturally occurring, is often synthesised to achieve various nanoscale geometries by a simple chemical oxidation of copper metal22 or copper ionic compounds.23 These include scrolls,24 tubes,25 needles,25 and platelets.26 Certain copper hydroxides exist as layered intercalation compounds.27,28 Studies on these compounds allowed for anion exchange increasing the layer separation, which could then allow platelet individualization by exfoliation in certain solvents.29
Nickel hydroxide was exfoliated in both solvent and surfactant media by Harvey et al. eliminating the need for synthetic methods or complex anion exchange.16 This method was then expanded to include a range of other LDHs proving to be a versatile route to procuring thin sheets of material from bulk crystals.30
For many years, liquid processing of nanoparticles has been aided by the use of surfactants to facilitate colloidal stabilisation for a variety of deposition techniques: spin-coating, spraying and printing. This allows scalable production of printed sensing devices. While the stability and relative concentration of these materials is excellent,16 the presence of the surfactant can be a hindrance to electrochemical applications or provide interfering signals requiring a further washing step to remove the material.31
An alternative to surfactant stabilisation, such as solvent stabilisation, is of particular interest for additive free deposition. The choice of solvent is governed by surface properties, namely, surface tension, surface energy, Hildebrand parameters, and Hansen parameters.27,28 These properties describe the minimisation of the enthalpy of mixing, allowing for exfoliation and subsequent stabilisation. However, these metastable dispersions generally have lower concentrations and stabilities than surfactant dispersions. Furthermore, the solvents that typically match well with these layered materials, in particular N-methyl-2-pyrrolidone (NMP), have high boiling points and are toxic.32,33 Low boiling point and non-toxic solvents are of significant interest for printable electronics and sensors.
In this paper, we present a scalable method of producing stable dispersions of copper hydroxide nanocuboids in alcohol–water blends, which allow for a variety of deposition methods. We use aerosol spray to fabricate non-enzymatic glucose sensors. These sensors display good stability and sensitivity while maintaining simplicity in synthesis and manufacture.
Results and discussion
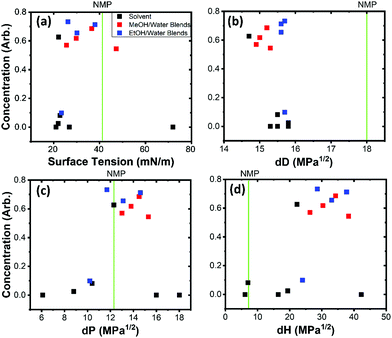
Dispersion of nanomaterials for electrochemical devices requires a minimisation of inactive components. Aqueous exfoliation usually requires the presence of a surfactant to stabilise the particles against reaggregation.16,32 As particles reduce in size, the fraction of surfactant relative to the nanomaterial increases and, as smaller nanomaterials with high specific surface areas are generally more electrochemically active, require post processing to remove excess inactive material. Using solvents eliminates the need for post processing to remove unnecessary material allowing for precise addition of binders and conductive additives. A solvent stabilises nanomaterials by a minimisation of surface forces in a like-for-like interaction.32 As copper hydroxide has hydroxy-terminated surfaces,19 solvents with hydroxy groups were considered. As water does not provide stabilisation without the presence of surfactant,16 alcohols and alcohol–water blends were also considered. Solvent blends have been reported as a way of achieving intermediate properties.Copper hydroxide was dispersed in a variety of solvents and solvent blends and centrifuged to remove large aggregates. The relative concentration was analysed by UV-Vis spectroscopy as concentration is proportional to the extinction of the medium. The effect of the surface tension on solvent and solvent blends is illustrated in Fig. 1(a). A line representing NMP is shown, as it is an archetypical solvent for nanomaterial dispersion and has been used to stabilise nickel hydroxide. NMP is a high boiling point solvent and is also harmful, therefore such solvents were not considered. Of the pure alcohols, methanol was the most effective. Ethanol had minimal material stabilised after centrifugation and isopropyl alcohol displayed no effectiveness. Methanol and ethanol blends were then explored. The concentration in Fig. 1(a) plateaus from around 25 mN m−1, however the absence of solvents with a surface tension above 50 mN m−1 fails to provide an upper limit on the surface tension stability.
Hansen parameters break down surface energy considerations into 3 components; the dispersive, polar and hydrogen bonding components.34 By minimizing the distance between two materials in Hansen space the mismatch in surface energy is minimized. The selection of alcohol and alcohol blends is vindicated as Fig. 1(b–d) show that the polar and hydrogen bonding components are the most relevant parameters for stabilising with alcohol blends giving ranges of 11–16 MPa1/2 for the polar component and 21–40 MPa1/2. The dispersion component of small molecules tend to be very similar and, in this case, do not provide meaningful insight into the stabilisation mechanism. NMP, which has a high dispersive component, a low hydrogen bonding component, and an appropriate polar component, is also sufficiently close in Hansen space to stabilise the material. For the remainder of this work, 40% methanol by weight in water blends were chosen as the most effective solvent due to the position close to the centre of the polar and hydrogen bonding components of the Hansen parameter stability range.
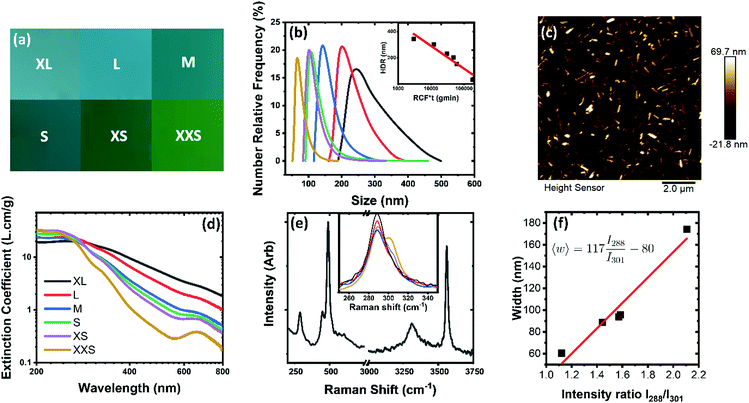
Due to smaller nanoparticles having a higher surface area, effectively separating materials into a range of fractions was used to observe the influence of size on electrochemical activity. The redispersed materials are visually distinct; a colour palette showing the appearance of each material after filtration is shown in Fig. 2(a) and a corresponding RGB analysis is given in Table S1 (ESI†).
To get an estimate on the size of the particles dynamic light scattering (DLS) was employed. While DLS is designed for spherical particles it can be used to gain a rough insight into non-spherical materials and can even be calibrated for certain material systems.35Fig. 2(b) shows the size distributions from DLS. The averages of these were taken and, when the relative centrifugal force (RCF)–time product is considered, a clear relationship emerges, shown in the inset. The RCF–time product is the cut-off at which the material was collected in the liquid cascade centrifugation (LCC-see methods). This is consistent with literature on liquid cascade centrifugation.36
To fully characterise the size of the materials atomic force microscopy (AFM) was employed and a sample micrograph is provided in Fig. 2(c). By measuring individual particles, the statistics of size distributions are revealed. The statistical analysis is available in Fig. S1–S5 (ESI†) for the L to XXS fractions of material along with sample micrographs of each. Analysis reveals that the particles have a similar aspect ratio that is close to invariant being approximately 8 and 3 times as long and wide as they are thick. This is due to copper hydroxide having anisotropy in its crystal structure (Cmc21).19 The average length and width have been plotted against the thickness in Fig. S6(a) (ESI†). While length correlates well with thickness, width seems to be invariant for the middle fractions. It is worth noting that surfactant exfoliated layered double hydroxides have been assigned a layer thickness of 1 nm.30 The only sub 10 nm, and hence sub 10 layer, material is found in the XS and XXS fractions. Of more practical interest, however, is the area and specific area to volume ratio of these materials as size decreases. This is shown in Fig. S6(b–d) (ESI†) and the specific surface area to volume ratio undergoes a factor of 2 change with diminishing size.
Fig. 2(d) provides further analysis achieved using UV-Vis spectroscopy, which quantifies the colour change in Fig. 2(a). As the particles get smaller, peaks representing copper complex absorbances become more obvious and the negative slope increases. This negative slope is due to scattering of the particles and has been reported previously.30 Around the wavelength of 300 nm, an isosbestic point allows for determination of concentration of all fractions of copper hydroxide.
Further characterisation was performed using Raman spectroscopy, an effective method for identifying and characterising nanomaterials. Raman spectrum, shown in Fig. 2(e), confirms the presence of hydroxy bonds with a large –OH stretching features at 3320 and 3560 cm−1 which can be attributed to bound water and the bound hydroxy groups respectively.15 For layered compounds with metallic elements the lower wavenumbers generally describe the structure of the solid. Review of the literature reveals little analysis on Cu(OH)2 and, due to the corrugated structure and different symmetry to other LDHs, it is challenge to draw comparisons.15,19 However, they compare favourably to reference spectra from geological samples37 and the Raman of both bulk CuO38 and Cu2O39 have modes at lower wavenumbers near the 288 cm−1 peak, with the layered structure likely responsible for stiffening of the peak. As a caveat, nanoparticulate copper oxides also experience a similar blue shift40 and as such; further work is required to ascertain the surface functionality of the material. Close analysis of the peak (inset) shows that as the size fraction sample reduces a blue-shifted shoulder appears. This, in conjunction with AFM data, leads to a spectroscopic metric for nanoparticulate Cu(OH)2 shown in Fig. 2(f). Further metrics for particle size criteria are available in Fig. S7 (ESI†).
The electrochemical activity of catalytically active nanoparticles increases with decreasing size due to an increase in specific surface area. From AFM analysis the specific surface area of these cuboids increases from ∼22 m2 g−1 to ∼50 m2 g−1. The electrochemical sensing of glucose by copper hydroxide in a basic medium is achieved via this reaction sequence22:
| Cu(OH)2 + OH− ↔ CuOOH + H2O + e− | (1) |
| CuOOH + glucose + e− → CuO + OH− + Gluconolactone | (2) |
 | (3) |
| CuO + OH− ↔ CuOOH + e− | (4) |
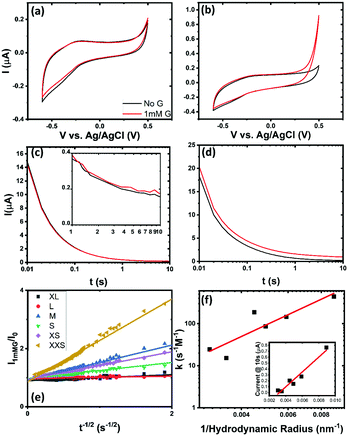
This suggests that the Cu(II/III) reaction acts as the main electron transfer component in the sensing of glucose. This can be observed using cyclic voltammetry. The cathodic character of the current increases for both the largest fraction of material, Fig. 3(a), and the smallest fraction of material, Fig. 3(b). A comparison of the glassy carbon in 0.1 M NaOH with glucose is provided in Fig. S9 (ESI†). The smallest fraction shows the most promising current as expected with the increase in current evident from 0.2 V versus Ag/AgCl. Similar trends in effectiveness are noted in the chronoamperometry shown in Fig. 3(c and d). The chronoamperometry was taken at a potential of 0.5 V vs. Ag/AgCl and allows a more direct comparison of effectiveness of the material via analysis of the modified Cottrell equation:
 | (5) |
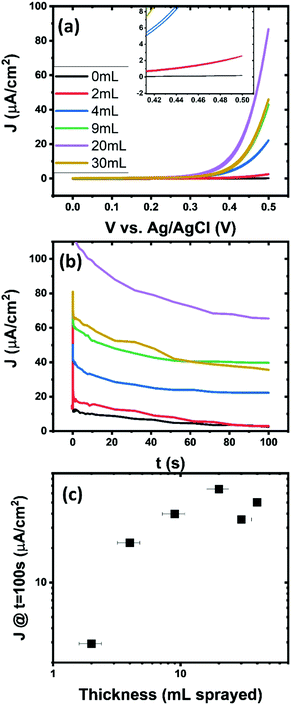
To increase current density of a sensor more material can be deposited. Films were deposited by aerosol spraying onto indium tin oxide (ITO). A scanning electron micrograph (SEM) with a scale bar of 200 nm (shown in Fig. S10, ESI†) indicates the overall porous morphology of the film. Fig. S11 (ESI†) indicates that ITO has some sensitivity to glucose though it is much lower than the currents generated from the Cu(OH)2. Both cyclic voltammetry, shown in Fig. 4(a) and chronoamperometry, shown in Fig. 4(b), display higher currents with increasing volume of dispersion deposited. Current saturates very quickly with volume deposited and the thickness of the thickest films are estimated by optical microscopy to be around 5 μm thick. The increase of current density after 100 seconds of chronoamperometry is shown in Fig. 4(c). It saturates to a current density of 50 μA cm−2 but reaches a maximum of approximately 70 μA cm−2. This reduction after a maximum could be explain by conductivity and coverage issues in disordered films. This is mostly due to the fact that copper hydroxide is a wide bandgap semiconductor. This means that possibly only the particles on the surface of the ITO or possible nearest neighbours are contributing to the sensitivity and subsequent particles could hinder performance by either inhibiting mass transport or by film packing blocking active sites. Impedance spectroscopy analysis was done to investigate effects of thickness on the impedance of the film. A Randles circuit (shown inset in Fig. S12b, ESI†) with a constant phase element was fitted to the impedance data, shown in Fig. S12 (ESI†). This showed a decrease in charge transfer resistance in the films consistent with the current increase from previous experiments. The analysis of the Warburg element, which indicates the impedance associated with diffusion, increase with thickness as expected. A dramatic increase in diffusive impedance for the samples with more than 20 mL of dispersion deposited is not evident. This indicates that diffusion is not the limiting factor in the performance but film packing possibly is.
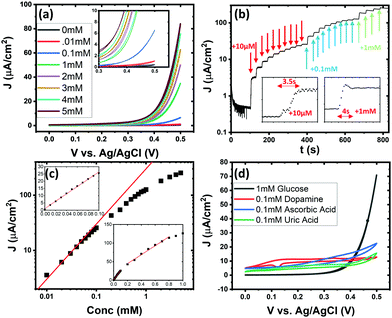
Full characterisation of the device requires calibration of the response of the sensor to glucose at varying concentrations. The concentration of glucose in human blood is in the range of mM and measurements in excess of 1 mM in urine is indictive of health problems. A typical sensor was tested in the range of 0.01–5 mM. Cyclic voltammetry, Fig. 5(a), and chronoamperometry, Fig. 5(b) show the increase of current with increasing glucose concentration as well a response time of less than 4 seconds. The chronoamperometric response is plotted against concentration in Fig. 5(c). The slope of the log–log plot is approximately 1 at low concentrations indicating a linear response. Inset graphs show the low concentration linear ranges with a response of 253 mA M−1 cm−2 from 0.01 to 0.1 mM and 120 mA M−1 cm−2 from 0.1 to 0.8 mM. The change in fitting slope and deviation from linearity is possibly due to a saturation of active sites with glucose. The response of the materials to other chemicals present in the body is also assessed. Fig. 5(d) shows cyclic voltammetry of the various other chemicals that are commonly tested as sensor inhibitors. Due to these molecules generally being lower in concentration than glucose they were analysed at one tenth of the concentration. Glucose displays a much higher current than the other chemicals but, due to the differences in shape of the voltammogram, this material in combination with voltammetry is an effective sensor.
Comparison with other copper-based glucose sensors (a full analysis is given in Table S2, ESI†) shows that this material needs further optimisation. The best copper-based sensors use either extremely high surface area14 or high conductivity substrates41,42 to get in excess of a mA mM−1 cm−2. In addition, a conductive component and/or binder could also enhance the performance. Due to the liquid processability of the copper hydroxide nanocuboids, the material is compatible with all of these processes allowing for an effective, printable solution to providing scalable glucose sensors.
Conclusions
Copper hydroxide was exfoliated in an appropriate solvent blend of 40% w/w methanol in water. The suspended material can be further separated in various size fractions which have similar aspect ratio dependences. This aspect ratio is related to the anisotropic crystal structure of the bulk crystallites. This top down method allows for the production of high surface area nanoparticles without additives and therefore the need for further purification after centrifugation. Size effects on spectroscopy are ascertained and metrics for size are developed using summed Raman spectra. As the size of the nanocuboids decreases, electrochemical sensitivity of the material increases. Analysis of the thickness dependence of sensitivity reveals saturation behaviour with thickness. An optimised sensor has a sensitivity of 253 mA M−1 cm−2 below 0.1 mM and maintains linearity up to 0.8 mM The effect of common chemicals that affect glucose sensors is also investigated and the currents are shown to be lower at the appropriate concentrations. The material is therefore suitable for use as a glucose sensor and due to the surfactant-free, low boiling point solvent approach in isolating the material it is an ideal candidate for printable solutions. The ease of processing will also allow this material to be integrated in composite films for improved functionality.Experimental Section
Materials
Copper hydroxide and all analytical chemicals and solvents were purchased from Sigma Aldrich. With the exception of methanol and ethanol procured from VWR Chemicals. Deionised water was produced in-house using a Thermo Scientific Barnstead MicroPure purification system (18.2 MΩ resistivity).Methods
Copper hydroxide powder at a concentration of 20 g L−1 in deionised water was pre-treated by ultrasonication at 60% amplitude for 3 hours using a horn probe Sonics Vibracell 750 W (Sonics Vibracell VCX750 and the 13 mm tip). The powder was collected by vacuum filtration and subsequently dried under vacuum. For the solvent study 20 g L−1 pre-treated copper hydroxide powder was exfoliated in 20 mL of the solvent of choice for 1 h at 60% amplitude with a horn probe Sonics Vibracell 130 W (Sonics Vibracell VCX130 with 6.3 mm tip). To remove the larger aggregates from the solution the dispersion was centrifuged for the density- and viscosity-adjusted equivalent of 16![[thin space (1/6-em)]](https://www.rsc.org/images/entities/char_2009.gif) 000g minutes in water.36 The adjustment was based on calculations from viscosity and density values from the CRC Handbook of Chemistry and Physics.43
000g minutes in water.36 The adjustment was based on calculations from viscosity and density values from the CRC Handbook of Chemistry and Physics.43
Once the optimum solvent was decided, the material was dispersed at 20 g L−1 in 80 mL of the solvent. The parameters were 5 hours at 60% amplitude using the Sonics Vibracell 750 W horn tip. Separation of material was done via liquid cascade centrifugation (LCC) where larger material is successively spun out of dispersion by longer centrifugation times. The size fractions were then redispersed in the same solvent blend by bath sonication for one hour. UV-Vis was carried out in a Shimadzu UV-3600 Plus spectrophotometer. Dynamic Light scattering (DLS) was done using an AntonPaar Litesizer 500 particle analyser. Atomic force microscopy (AFM) was done using a Bruker Dimension Icon with a Scan Assist tip, micrographs of edge 10 μm were taken with 1024 lines at 0.5 Hz. Some larger micrographs were obtained with the resolution adjusted to compensate.
For the electrochemistry experiments, the dispersions were diluted to 0.5 g L−1 and 5 μL were dropcast on a glassy carbon working electrode. A platinum counter electrode and an Ag/AgCl reference electrode were used. A 0.1 M NaOH electrolyte was used with glucose added as necessary. All electrochemical measurements were taken after 30 minutes of bubbling the electrolyte with nitrogen gas. To ensure stability of electrodes all electrochemical tests were preceded by cycling the electrodes in the potential range of the experiment till current remained steady.
For the thickness study the working electrode was replaced with a 10 Ω □−1 ITO glass sheet. The copper hydroxide film was deposited using spray deposition at 3 bar and a distance of 10 cm. The substrate was heated to 40 °C during deposition to aid evaporation of solvent.
Conflicts of interest
There are no conflicts to declare.Acknowledgements
This work is supported by strategic development funding from the University of Sussex and Advanced Material Development Ltd.References
- G. Wang, X. He and L. Wang, et al. , Microchim. Acta, 2013, 180, 161–186 CrossRef CAS.
- D.-W. Hwang, S. Lee and M. Seo, et al. , Anal. Chim. Acta, 2018, 1033, 1–34 CrossRef CAS PubMed.
- R. Zeng, Z. Huang and Y. Wang, et al. , ChemElectroChem, 2020, 7, 1537–1541 CrossRef CAS.
- B. Zhang, Y. He and B. Liu, et al. , Microchim. Acta, 2015, 182, 625–631 CrossRef CAS.
- Z. Gao, Y. Lin and Y. He, et al. , Microchim. Acta, 2017, 184, 807–814 CrossRef CAS.
- A. K. Geim and K. S. Novoselov, Nat. Mater., 2007, 6, 183–191 CrossRef CAS PubMed.
- D. A. Dikin, S. Stankovich and E. J. Zimney, et al. , Nature, 2007, 448, 457–460 CrossRef CAS PubMed.
- U. Khan, A. O’Neill and M. Lotya, et al. , Small, 2010, 6, 864–871 CrossRef CAS PubMed.
- M. Lotya, P. J. King and U. Khan, et al. , ACS Nano, 2010, 4, 3155–3162 CrossRef CAS PubMed.
- K. R. Paton, E. Varrla and C. Backes, et al. , Nat. Mater., 2014, 13, 624–630 CrossRef CAS PubMed.
- A. E. D. R. Castillo, V. Pellegrini and A. Ansaldo, et al. , Mater. Horiz., 2018, 5, 890–904 RSC.
- V. Mani, B. Devadas and S.-M. Chen, Biosens. Bioelectron., 2013, 41, 309–315 CrossRef CAS PubMed.
- S. Palanisamy, S. Cheemalapati and S.-M. Chen, Mater. Sci. Eng., C, 2014, 34, 207–213 CrossRef CAS PubMed.
- I. Shackery, U. Patil and A. Pezeshki, et al. , Electrochim. Acta, 2016, 191, 954–961 CrossRef CAS.
- D. S. Hall, D. J. Lockwood and C. Bock, et al. , Proc. R. Soc. A, 2015, 471, 20140792 CrossRef PubMed.
- A. Harvey, X. He and I. J. Godwin, et al. , J. Mater. Chem. A, 2016, 4, 11046–11059 RSC.
- G. Arizaga, K. Satyanarayana and F. Wypych, Solid State Ionics, 2007, 178, 1143–1162 CrossRef CAS.
- G. J. de, A. A. Soler-Illia, M. Jobbágy and A. E. Regazzoni, et al. , Chem. Mater., 1999, 11, 3140–3146 CrossRef.
- H. R. Oswald, A. Reller and H. W. Schmalle, et al. , Acta Crystallogr., Sect. C: Cryst. Struct. Commun., 1990, 46, 2279–2284 CrossRef.
- J. Kang, J. Sheng and Y. Ji, et al. , ChemistrySelect, 2017, 2, 9570–9576 CrossRef CAS.
- S. Cui, X. Liu and Z. Sun, et al. , ACS Sustainable Chem. Eng., 2016, 4, 2593–2600 CrossRef CAS.
- S. Shahrokhian, E. Khaki Sanati and H. Hosseini, Biosens. Bioelectron., 2018, 112, 100–107 CrossRef CAS PubMed.
- A. P. LaGrow, L. Sinatra and A. Elshewy, et al. , J. Phys. Chem. C, 2014, 118, 19374–19379 CrossRef CAS.
- W. Zhang, X. Wen and S. Yang, et al. , Adv. Mater., 2003, 15, 822–825 CrossRef CAS.
- X. Wu, H. Bai and J. Zhang, et al. , J. Phys. Chem. B, 2005, 109, 22836–22842 CrossRef CAS PubMed.
- O. L. Maddan, US Pat., US20080171158A1, 2008.
- W. Fujita and K. Awaga, Synth. Met., 2001, 122, 569–572 CrossRef CAS.
- S. Yamanaka, Solid State Ionics, 1992, 53–56, 527–533 CrossRef CAS.
- R. Ma and T. Sasaki, Adv. Mater., 2010, 22, 5082–5104 CrossRef CAS PubMed.
- Non-resonant light scattering in dispersions of 2D nanosheets | Nature Communications, https://www.nature.com/articles/s41467-018-07005-3, accessed 24 April 2020.
- D. A. C. Brownson, J. P. Metters and D. K. Kampouris, et al. , Electroanalysis, 2011, 23, 894–899 CrossRef CAS.
- J. N. Coleman, Adv. Funct. Mater., 2009, 19, 3680–3695 CrossRef CAS.
- C. Backes, K. R. Paton and D. Hanlon, et al. , Nanoscale, 2016, 8, 4311–4323 RSC.
- M. Yi, Z. Shen and X. Zhang, et al. , J. Phys. D: Appl. Phys., 2012, 46, 025301 CrossRef.
- M. Lotya, A. Rakovich and J. F. Donegan, et al. , Nanotechnology, 2013, 24, 265703 CrossRef PubMed.
- S. P. Ogilvie, M. J. Large and M. A. O’Mara, et al. , 2D Mater., 2019, 6, 031002 CrossRef CAS.
- R100193 - RRUFF Database: Raman, X-ray, Infrared, and Chemistry, https://rruff.info/chem=Cu/chemistry/asc/display=default/R100193, accessed 24 April 2020.
- R120076 - RRUFF Database: Raman, X-ray, Infrared, and Chemistry, https://rruff.info/chem=Cu/chemistry/asc/display=default/R120076, accessed 24 April 2020.
- R140763 - RRUFF Database: Raman, X-ray, Infrared, and Chemistry, https://rruff.info/chem=Cu/chemistry/asc/display=default/R140763, accessed 24 April 2020.
- Y. Deng, A. D. Handoko and Y. Du, et al. , ACS Catal., 2016, 6, 2473–2481 CrossRef CAS.
- Z. Zhuang, X. Su and H. Yuan, et al. , Analyst, 2008, 133, 126–132 RSC.
- L.-C. Jiang and W.-D. Zhang, Biosens. Bioelectron., 2010, 25, 1402–1407 CrossRef CAS PubMed.
- Handbook of Chemistry and Physics 100th Edition, http://hbcponline.com/faces/contents/ContentsSearch.xhtml;jsessionid=D0BC80F99FBB08C5897E6474BB0EE4A0, accessed 24 April 2020.
Footnote |
| † Electronic supplementary information (ESI) available. See DOI: 10.1039/d0tb01476a |
| This journal is © The Royal Society of Chemistry 2020 |

