
Boosting biomolecular interactions through DNA origami nano-tailored biosensing interfaces†
Iene
Rutten
,
Devin
Daems‡
and
Jeroen
Lammertyn
 *
*
KU Leuven, Department of Biosystems, Biosensors group, Willem de Croylaan 42, B-3001 Leuven, Belgium. E-mail: jeroen.lammertyn@kuleuven.be; Tel: +32 16 321459
First published on 9th January 2020
Abstract
The interaction between a bioreceptor and its target is key in developing sensitive, specific and robust diagnostic devices. Suboptimal interbioreceptor distances and bioreceptor orientation on the sensor surface, resulting from uncontrolled deposition, impede biomolecular interactions and lead to a decreased biosensor performance. In this work, we studied and implemented a 3D DNA origami design, for the first time comprised of assay specifically tailored anchoring points for the nanostructuring of the bioreceptor layer on the surface of disc-shaped microparticles in the continuous microfluidic environment of the innovative EvalutionTM platform. This bioreceptor immobilization strategy resulted in the formation of a less densely packed surface with reduced steric hindrance and favoured upward orientation. This increased bioreceptor accessibility led to a 4-fold enhanced binding kinetics and a 6-fold increase in binding efficiency compared to a directly immobilized non-DNA origami reference system. Moreover, the DNA origami nanotailored biosensing concept outperformed traditional aptamer coupling with respect to limit of detection (11 × improved) and signal-to-noise ratio (2.5 × improved) in an aptamer-based sandwich bioassay. In conclusion, our results highlight the potential of these DNA origami nanotailored surfaces to improve biomolecular interactions at the sensing surface, thereby increasing the overall performance of biosensing devices. The combination of the intrinsic advantages of DNA origami together with a smart design enables bottom-up nanoscale engineering of the sensor surface, leading towards the next generation of improved diagnostic sensing devices.
Introduction
A biosensor achieves specific recognition of target molecules through bioreceptors immobilized on the biosensing surface. The performance of the molecular recognition layer is limited not only by the affinity of these bioreceptors, but also highly depends on the structuring of the bioreceptors at the nanoscale level.1 Suboptimal positioning of these bioreceptors on the biosensor surface results in restricted accessibility and therefore reduced target interactions.2 Although the interfacial properties of the biosensor are of critical importance, the immobilization strategies are typically derived from experimentally determined and uncontrolled coupling strategies, including but not limited to covalent attachment, affinity immobilization or self-assembly processes.3,4To improve the interaction between target and surface-based bioreceptors, research has been devoted to control the surface functionalization with respect to orientation and packing density of the bioreceptors, as well as the geometry and dimensions of the sensing surface. The effects of strategies such as backfilling,5–7 self-assembled monolayers8–10 and the use of inorganic nanostructures11–13 have been demonstrated, all resulting in increased target interaction. These strategies are, amongst other reasons, used to reduce steric hindrance and enhance the upright orientation of the bioreceptors on the biosensor surface, hereby improving their overall accessibility. However, reproducible assembly of biosensor surfaces possessing these qualities in a precise and controlled way remains challenging.2
The past decade significant progress has been made towards improved and more controlled immobilization of bioreceptors on the biosensor surface by introducing DNA nanostructures.14–17 The DNA nanostructures are unique tools to incorporate nanoscale features, with a predefined shape and pattern, onto the micro- or macroscopic biosensor surface. These nanostructures include designs with a varying range of complexity including two-dimensional DNA lattices18 and three-dimensional shapes such as cubes19 or tetrahedrons.20,21 Combining bioreceptors with DNA tetrahedrons, as anchoring points on gold electrodes to control the receptor density, significantly improves their availability and thus the performance of the electrochemical biosensor.14 Nevertheless, the implementation of DNA tetrahedrons comes with issues regarding stability when exposed to buffers with slightly different pH, salt concentrations or temperature, which are typically required in biosensing applications. Moreover, due to the use of the multi-stranded assembly approach as described by Seeman et al., nanostructures of only limited complexity can be designed, impeding the implementation of multiple bioreceptors per nanostructure.22
An important milestone in the development of nanometre-sized DNA structures occurred with the introduction of scaffolded DNA origami.22 The folding of DNA origami into the desired shape is achieved through the hybridization of many complementary, short single stranded oligonucleotides, called staples, to a long single-stranded DNA (ssDNA) scaffold. The engineering of nanostructures through this scaffold-based self-assembling process allows a greatly simplified construction and design of various 2D and 3D shapes with increasing complexity and chemical, as well as mechanical, robustness.23–25 Similar to the tetrahedral DNA nanostructures, 3D DNA origami structures have been exploited to nanopattern a surface plasmon resonance (SPR) biosensing surface.26 Here, it was demonstrated that the applied modifications allowed the attachment of bioreceptors to a biosensor surface in a controllable way. Bioreceptors can be precisely positioned as extensions of staple strands, incorporated in the DNA origami structure. This characteristic, intrinsic to scaffolded folding of DNA origami, allows the manipulation of multiple bioreceptors in a site specific manner on one biological entity.27–29 The implementation of DNA origami structures resulted in an increased performance of the biosensor, compared to tetrahedral DNA nanostructures, by moving to a more organized functionalization of the biosensor surface.26 Although evidence of an increase in biosensing performance is provided, the underlying effects on the biomolecular interactions, when using DNA origami as bioreceptor anchoring points, have not been described.
In this work, we evaluated for the first time a smart 3D DNA origami design on an innovative continuous microfluidic platform (EvalutionTM)30 to (1) optimally position the anchoring points for aptamer bioreceptors for capturing their target molecule, and, (2) study the effects of the origami-structured sensing surface on the biosensor performance. To this purpose, we first designed an assay-specific antenna-like DNA origami structure and used it to functionalize the surface of encoded microparticles present in the channels of the EvalutionTM platform. The origami structure was tailored to perfectly accommodate the well-characterized aptamer–thrombin complex that was used as a model system.6,31–35 Secondly, the effect of this DNA origami structured surface on the performance of the thrombin–aptamer bioreceptor was studied, focusing on the binding efficiency, affinity, kinetics and signal intensity. In addition, the effect of origami structuring on the latter two aspects was challenged using additional receptor-target complexes with varying sizes. Lastly, the overall biosensing performance was evaluated by means of the aptamer sandwich assay configuration, to validate the effect of the tailored biosensor surface. A schematic overview of the different assay configurations used throughout the experiments is displayed in Fig. 1.
 | ||
| Fig. 1 Schematic overview of the different assay configurations used to test the bioreceptor immobilization, bioreceptor performance and biosensor performance. For each configuration, direct bioreceptor immobilization is compared to origami-based bioreceptor immobilization (components not to scale). | ||
Results and discussion
DNA origami design, validation and surface structuring
DNA-origami nanostructures feature rationally designed geometries and precise spatial addressability, thus being a promising candidate to engineer well-defined, programmable and robust biosensing interfaces. However, there are several aspects that need to be taken into account for origami-based biosensing applications: (1) the in silico origami design, (2) the successful assembly of the origami products, and, (3) their implementation on the biosensor surface. Here, they will be addressed for the development of an origami-based biosensor for thrombin, relying on the well-characterized binding of this model system with the thrombin-binding aptamers (Tasset and Bock).27,33,34In silico origami design
To obtain a 3D DNA origami with a large sensing surface, we modified an in silico generated 24-helix bundle26 to obtain an antenna-like shape, with protruding arms serving as anchoring points for bioreceptor attachment (Fig. 2). These single-stranded protruding strands of DNA are linkers that allow the immobilization of bioreceptors through Watson–Crick basepairing. Aiming for the most optimal positioning of these protruding arms, we needed to take certain limitations into account. First, the positions on the coiled DNA helix, resulting in protrusions pointing out in a similar plane, are limited by the average twist per basepair of 34.3° together with the distance of 0.34 nm per basepair rise.36 This theoretically translates to one protrusion every 540° and a maximal resolution of 5.44 nm. Secondly, although the number of effective bioreceptors (i.e. available for target interaction) increases along with the interreceptor distance due to a decrease in steric hindrance, over-dimensioning the distance will eventually lead to a signal decrease due to a reduction in the absolute number of effective bioreceptors.14 In this context, a perfect balance must be found in the assay-specific design of the DNA origami structure.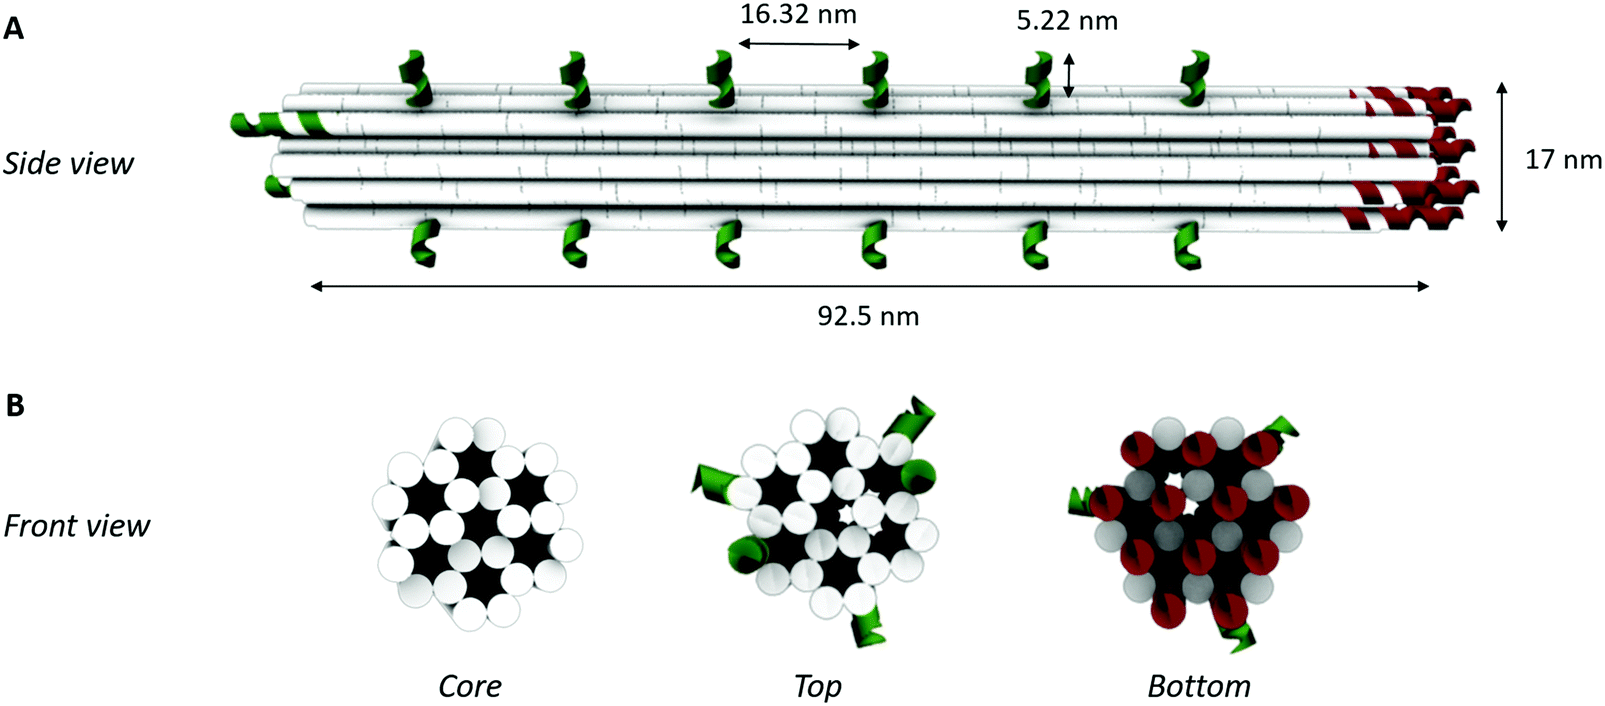 | ||
| Fig. 2 3D DNA origami design. (A) Schematic representation of the side view showing the lateral spacing of each of the elongations for bioreceptor coupling (depicted in green) along the helix surface. (B) Schematic representation of the front views of the 24-helix bundle representing the core structure without any modification, a top view with ssDNA elongations for bioreceptor coupling (depicted in green) and a bottom view showing the ssDNA elongations for coupling to the microparticle surface (depicted in red). Each white solid circle represents one dsDNA helix. | ||
Taking into account the aforementioned limitations and relying on the predicted aptamer–thrombin complex diameter of approximately 7 nm (obtained using the protein data base (PDB) model), we modified the 24-helix bundle origami structure (Fig. 2) to incorporate a total of 38 protruding arms with an interreceptor distance of 16 nm. Bearing in mind the uncertainty on this interbioreceptor distance caused by the overall flexibility of the origami structure and protruding arms, the indicated interreceptor distances are likely to vary with an additional 0.89 nm.37 This structure comprises the maximal number of protruding arms while taking into account the interreceptor distance required to accommodate the thrombin–aptamer complex.
In addition to the above described, theoretically optimal origami configuration (design 1 in Fig. 3), variations on this origami structure were designed to evaluate the effect of the load of the protruding arms on the core stability of the origami. For this purpose, the number protruding arms on the 24-helix bundle was decreased to a total number of 32 (design 2 in Fig. 3), 26 (design 3 in Fig. 3), 20 (design 4 and 5 in Fig. 3), 14 (design 6 and 7 in Fig. 3), 8 (design 8 in Fig. 3) and zero (design 9 in Fig. 3). Moreover, two versions of the designs with 20 and 14 protruding arms were obtained by repositioning the protruding arms along the axis of the 24-helix bundle core in a rotated manner (design 4 vs. 5 and design 6 vs. 7 in Fig. 3), to evaluate the effect of the rotation on the stability of the core.
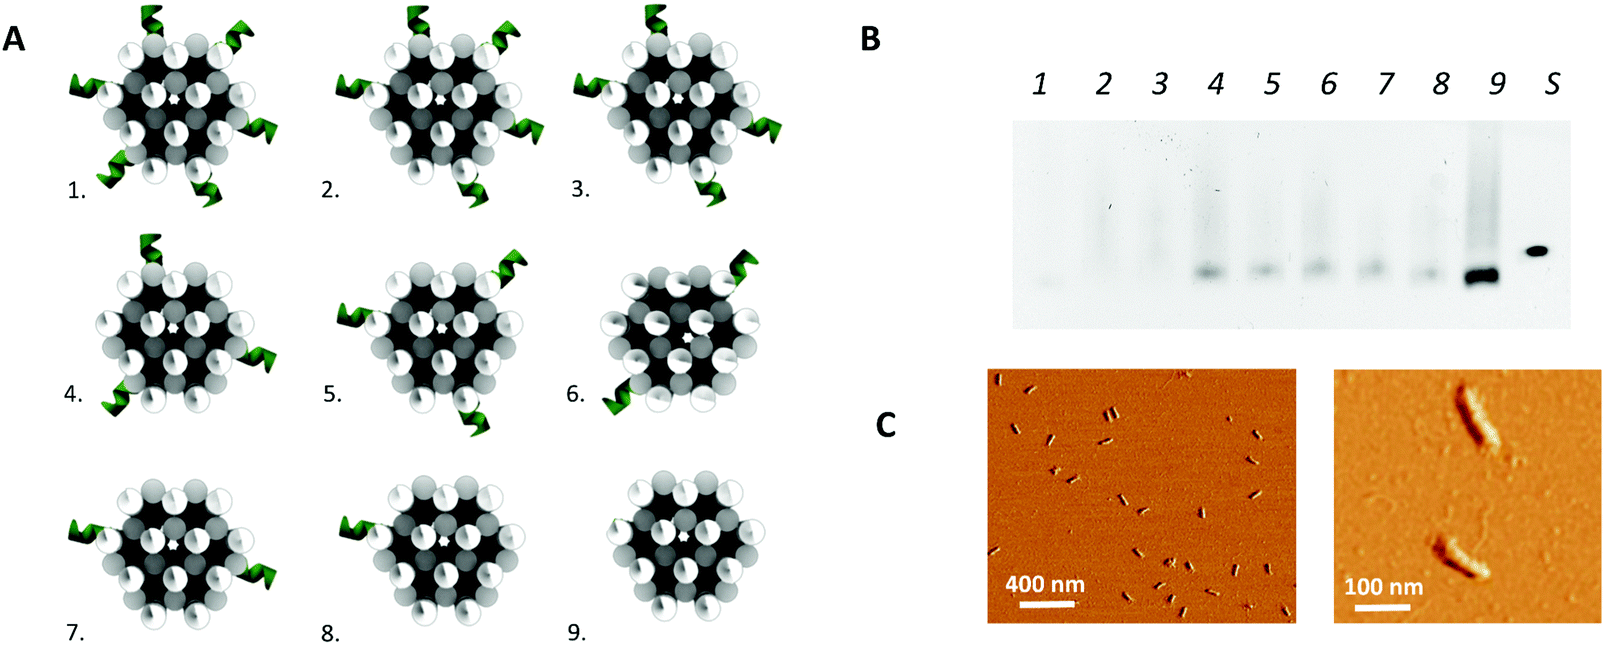 | ||
| Fig. 3 3D DNA origami design optimization. (A) The different design configurations tested. (B) Gel electrophoresis experiment, using a 0.8% agarose gel. Each lane (1–9) represents one of the different design configurations with the corresponding number and S represents a reference sample containing only scaffold. (C) AFM image of the 24-helix bundle design 4 (left), including a close-up (right). | ||
Origami design validation
In a second step, the assembly of the designed DNA nanostructures was validated. Here, the absence of structures of the theoretically optimal design (design 1 in Fig. 3A), as well as design 2 and 3, in gel electrophoresis (Fig. 3B) pointed to a failed assembly of the 24-helix bundle core when intertwined with 38, 32 and 26 protruding arms. Investigation of different factors influencing the origami assembly (e.g. magnesium concentration and thermal annealing time) indicated that the large number of protruding arms posed an excessive load on the origami core, hence causing its destabilization. This was furthermore substantiated by the presence of correctly folded origami structures containing 20 or less protruding arms (design 4 to 9) in the gel (Fig. 3B), indicating successful origami assembly. Furthermore, axial rotation of the protruding arms on the origami structure did not indicate a significant difference in the successful folding of the structure. Since design 4 comprises the largest number of protruding arms while enabling stable assembly of the origami structure, which are two key factors for the successful integration into a biosensor, it was decided to continue with these structures. This design comprises a total of 20 protruding arms per origami structure, of which 18 are equally distributed along the side and 2 on top of the 24-helix bundle. Moreover, AFM images (Fig. 3C and Fig. S4, ESI†) show that the experimentally determined shape and size of this design (L: 97 ± 3 nm and W: 20 ± 1 nm) corresponds well to the theoretical predictions (L: 93 nm and W: 17 nm), while taking into account the non-native conditions endured during AFM imaging. Additional experiments (Fig. S5, ESI†) demonstrated the stability of the DNA origami structure over a range of temperature an pH conditions relevant for biosensing, furthermore confirming its potential for biosensor surface structuring.Origami-based surface nanopatterning
Origami design 4 was chosen to nanopattern the surface of the microparticles stacked in the channels of the EvalutionTM microfluidic platform. The EvalutionTM platform comprises a cartridge with 16 parallel microfluidic channels filled with encoded microparticles enabling multiplex detection. By applying a pressure difference over the channels, a flow of reagents is generated allowing to carry out a bioassay on the microparticles in the channel. The platform is equipped with an optical unit for fluorescent signal readout. In our experiments, the microparticles were pre-functionalized with origami probes (Fig. 1) and subsequently loaded into the microfluidic channels. Next, different concentrations of origami (10-fold dilution from 50 to 0.0005 nM, and a blank) were flowed over the pre-functionalized particles to investigate different DNA origami densities on the microparticle surface. Proceeded by a washing step, the immobilized structures were visualized through hybridization of the protruding arms of the DNA origami fluorescent labels (Fig. 1). The results (Fig. S6, ESI†) show a significant drop in fluorescence for a 100-fold dilution of DNA origami stock solution (0.5 nM). When incubating with even lower concentrations of DNA origami (0.05 nM), the depicted fluorescence images show a remarkable change from a uniform distribution into several patches spread across the microparticle surface. This observation is known as surface heterogeneity.38,39 The occurrence of this effect could be circumvented in future applications by generating large concatenations of DNA origami structural units to completely cover the biosensor surface.40 In order to maintain a visually uniform distribution without significant signal loss, a 10-fold dilution (5 nM) of DNA origami stock solution was used in the following experiments. Before introducing the thrombin bioassay, the effect of each of the assay-related buffers (TGK, Tris–HCL and PBST) on the DNA origami structures was determined (Fig. S7, ESI†). These results indicated no significant influence of the tested buffers on the DNA origami structural stability. This observation corresponds to what has already been described in literature, that DNA origami structures maintain their stability even in environments with low Mg2+ concentrations although a superstructure-dependent effect seems to exists.41,42Next, the average number of aptamers, present on the origami-structured microparticle surface, was experimentally determined and compared relatively to the number of aptamers on microparticles, directly functionalized with the bioreceptor probe (i.e. without DNA origami) (Fig. 1A). For this purpose, thrombin-binding aptamer was flowed over the pre-loaded and pre-functionalized microparticles (i.e. with and without DNA origami) in an excess concentration, together with the fluorescent aptamer label (Fig. 1A). In parallel channels we kept track of the non-specific interactions, occurring in the absence of the thrombin-binding aptamer. Afterwards, the aptamer label was melted off by elevating the temperature to 95 °C. In this step, the liquids, leaving the microfluidic channels, were collected and analysed in a spectrophotometer to determine the presence and concentration of the aptamer bioreceptors (Fig. S8, ESI†). This approach indicated an average of 5 × 10⁷ aptamers per microparticle through DNA origami-linked aptamer attachment and 2.5 × 10⁸, which is 5-fold more, aptamer bioreceptors through direct coupling to the microparticle surface.
Bioreceptor performance
Being able to precisely control the number and spacing of the bioreceptors per DNA origami, we subsequently studied the impact hereof on the aptamer bioreceptor performance in terms of the binding efficiency, affinity, kinetics and signal intensity. Furthermore, the microfluidic channels of the EvalutionTM platform provide a particularly interesting environment to study target interactions as the active flow guarantees a continuous supply of reagents.30 Fluorescently labelled thrombin was used to perform these binding studies, as it allows direct detection of the monovalent interaction with the aptamer (Fig. 1B).Taking into account the total aptamer density, the binding efficiency of both origami-based and direct immobilization strategies can be calculated. The binding efficiency is a measure for how many of the aptamer bioreceptors, present on the microparticle surface, are available for target interaction. When immobilizing the aptamers to the microparticle surface through the DNA origami structure, we observed a 6-fold increase in binding efficiency (93 ± 3%) when compared to direct coupling of aptamers (16 ± 2%). This illustrates that the direct-coupling approach, although resulting in more aptamers per microparticle as shown in the previous paragraph, leaves them with reduced availability for target interaction. This finding demonstrates a first benefit of implementing DNA origami for nanostructuring of a biosensor surface.
To evaluate the binding affinity, the dissociation constant (KD) of the aptamer in both the DNA origami-based and directly immobilized configuration was determined. To this purpose the interaction of the aptamer with several concentrations of labelled thrombin (ranging from 24 to 676 nM) was monitored over a time interval of 25 min. The established one-site binding curves, with corresponding fittings for both immobilization strategies, are shown in Fig. 4. The calculated apparent KD values were equal to 36 ± 5 nM and 34 ± 4 nM for origami-linked and directly immobilized aptamers, respectively. These values correspond to the values of apparent KD reported in literature for this particular aptamer–thrombin complex, ranging from 0.5 nM to about 100 nM depending on the applied experimental technique.6
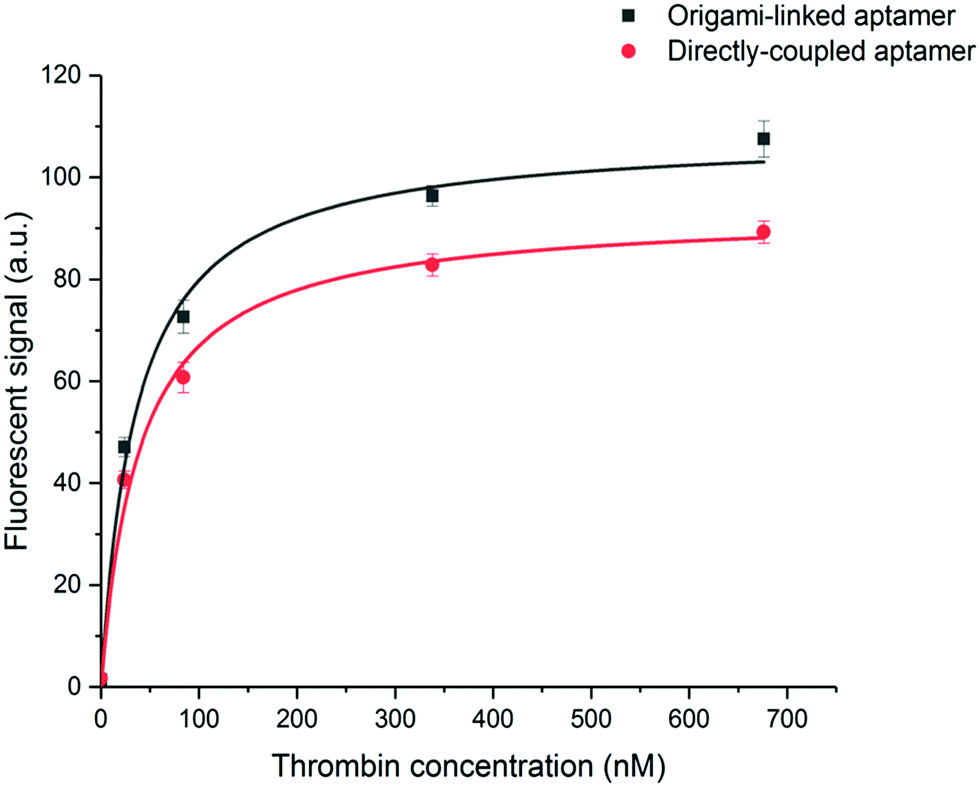 | ||
| Fig. 4 One-site binding curves resulting from the measurement of fluorescently labelled thrombin (24–676 nM) for the aptamer linked to the origami structure (black, R2 = 0.98) or the aptamer directly immobilized on the microparticle surface (red, R2 = 0.99). From these data, KD values were calculated as the average, obtained from fitting three independent repetitions. Error bars represent one standard deviation (n = 3). | ||
Although, as described above, the apparent KD values did not differ significantly, the recorded endpoints reached a slightly higher signal intensity for the origami-linked aptamers (Fig. 4). This contra-intuitive observation can be explained by the thermodynamics that apply in steady-state conditions (here, the assumption of steady state conditions is made, based on the observation of nearly saturated signals for each of the concentrations). In these steady-state conditions, the binding constant could be recalculated into the Gibbs free energy of binding (ΔG) corresponding to an approximate value of 42 kJ mol−1.43 Since using the origami-linked aptamer immobilization strategy does not implement any direct modifications to the target recognition site of the aptamer that would significantly influence the ΔG of the aptamer–thrombin complex, no significant change in the binding constant was expected.17 In spite of the similar KD values, the improved final signal intensities (achieved with 5-fold less aptamer bioreceptors) indicated a second advantage of using DNA origami in biosensing applications.
In addition to the binding efficiency, KD and signal intensity, we compared the binding kinetics for both immobilization strategies (Fig. 5A). The reaction rates were quantified based on the increase of fluorescent signal, monitored over time, for a thrombin concentration of 84 nM. The reaction rate was determined by fitting the integrated formulation of the time-dependent reaction rate equations.44 It was observed that the obtained reaction rate increased significantly, from 0.07 min−1 for the directly immobilized aptamers to 0.3 min−1 for the origami-linked aptamers (i.e. a 4.3-fold acceleration). Again, this observation can be related to the thermodynamic principles, more specifically to the difference in surface entropy of both immobilization approaches. By positioning the aptamers on the DNA origami instead of directly coupling them to the surface, the immobilization of the bioreceptor population changed from more or less random to highly ordered, resulting in a change in surface entropy.17 This translates into a decrease in the free energy of activation for the origami-based approach, resulting in a lower energy barrier that needs to be overcome upon formation of the aptamer–target complex. As such, these results indicate that the immobilization of aptamers, using a well-designed DNA origami structure, results in a more organized surface, which in turn reduces steric hindrance, increases the aptamer accessibility and leads to enhanced binding kinetics. Moreover, the origami-linked aptamers benefit from their upward orientation, which is ensured by the double-stranded attachment sites with a length (5.22 nm) that is far below the persistence length of dsDNA (50 nm).45
 | ||
| Fig. 5 (A) Comparison of the reaction kinetics between the origami-linked (black, R2 = 0.99) and directly immobilized aptamer bioreceptors (red, R2 = 0.99) for a thrombin concentration of 84 nM. (B) Increase in fluorescent signal and reaction rate comparing origami-linked bioreceptors to the directly immobilized bioreceptors for four different target molecules: (1) DNA, (2) streptavidin, (3) thrombin and (4) IgE. Error bars represent one standard deviation (n = 3). | ||
In addition, we studied how the origami-mediated interreceptor distances, optimized for the thrombin assay, translate to target molecules of other sizes by means of the signal intensity and kinetics. More specifically, we evaluated two molecules that are smaller than thrombin (DNA and streptavidin, Fig. 1B) and one larger molecule (IgE, Fig. 1B). For this comparison, bioreceptor molecules were altered for their specific target while the origami structure and bioreceptor probes were maintained. As depicted in Fig. 5B, an overall decrease in endpoint signal intensities was observed when using DNA origami-based compared to direct bioreceptor immobilization, for the detection of all targets, except for thrombin. For the DNA and streptavidin targets, both smaller than thrombin, we hypothesize that the interreceptor distance exceeds the optimal spacing. For the large IgE molecule on the other hand, we hypothesize that the interreceptor distance did not meet the minimally required spacing for an optimal target interaction. Both situations eventually lead to a reduced number of effective bioreceptors, resulting in an overall decrease in signal when using DNA origami-structured surfaces. Finally, when comparing the binding kinetics of bioreceptors immobilized through DNA origami with directly coupled bioreceptors, we observed an increase in kinetics for all target molecules. This could be expected, considering the intrinsic advantages of using DNA origami nanostructures for the positioning of bioreceptors mentioned above. Nevertheless, the largest effect was obtained for thrombin detection, for which the DNA origami structure was specifically designed. Together, these results show the importance of a smart assay-specific DNA origami design to obtain maximal benefit of the controlled bioreceptor positioning.
Bioassay performance
In a final step, the influence of the application-specific DNA origami on the performance of the thrombin bioassay in the microfluidic environment of the EvalutionTM was evaluated. To this purpose, a two-step sandwich assay (Fig. 1C) was used to detect five different concentrations of thrombin. These concentrations, ranging from 5 to 1350 nM and a blank, corresponded to typical values found in literature.33 To construct the sandwich assay configuration, an additional aptamer was introduced for the detection of thrombin. This detection aptamer was directly labelled through modification with a fluorescent tag and interacted independently with a distinct thrombin region, different from the region occupied after the first capturing interaction.32 Introducing the sandwich assay configuration bypasses the need for a fluorescently modified target and allows an additional washing step prior to the labelling step. This typically reduces the non-specific interactions and makes the developed assays more suitable for real-sample applications. An exponential model was used to describe the experimental data (Fig. 6) obtained for the origami-linked and directly immobilized aptamers. Notwithstanding the fact that on average 5-fold less aptamers were present on the microparticle surface, a higher overall signal was reached through the controlled positioning of the aptamers on the DNA origami nanostructures. This could be explained by the enhanced number of accessible aptamers, resulting from a decreased impact of steric hindrance and improved orientations. Many of the directly immobilized aptamers on the other hand, appeared less available for binding. The resulting overall signal-to-noise ratio increased by a factor 2.5 for the origami-mediated immobilization strategy while maintaining the reproducibility (average CV = 4.1%). The high reproducibility corresponds with other findings in literature that indicate the reproducible assembly of DNA origami structures as well as the stability of the assembled products over time.26,46 The DNA origami-mediated nanostructuring of aptamers on the microparticle surfaces resulted in an 11-fold improved sensitivity (LOD = 2 ± 0.2 nM) when compared to the direct coupling of aptamers (LOD = 22 ± 3 nM). These results validated the increased biosensor performance (with respect to sensitivity, signal intensity, signal-to-noise ratio and reproducibility) by means of DNA origami with an application-specific design by improving the accessibility of the bioreceptors and promoting biomolecular interaction between bioreceptor and target. This observation was further confirmed in 10-fold diluted plasma samples spiked with a known concentration of thrombin (Fig. S9, ESI†). In spite of the complex matrix environment causing a reduced signal intensity and enhanced background, the DNA origami functionalised sensing surfaces still outperformed the original surface functionalization with respect to signal-to-noise ratio. Although the results in this application, illustrate the potential of DNA origami structured surfaces in the field of biosensing, further research is required in order to achieve a full understanding of DNA origami structures in real sample matrices.47,48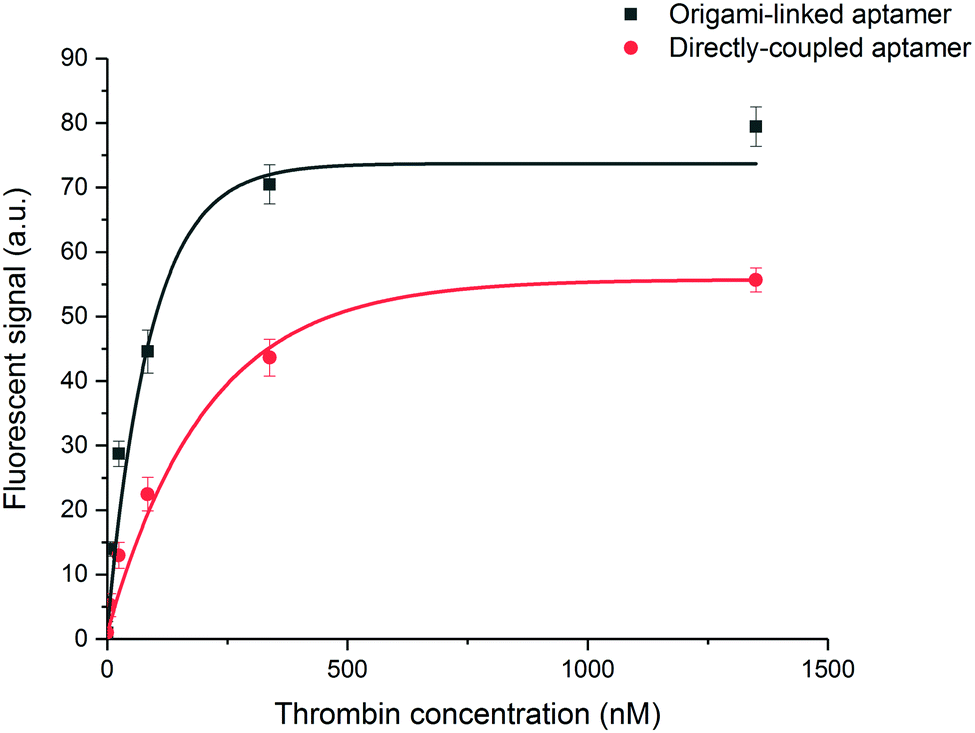 | ||
| Fig. 6 Performance of the sandwich assay for the detection of thrombin. Five different concentrations of thrombin were measured (5–1350 nM) including a blank resulting in calibration curves for aptamers linked to the DNA origami structures (black, R2 = 0.96) or directly immobilized to the microparticle surface (red, R2 = 0.97). Error bars represent one standard deviation (n = 3). | ||
Conclusions
A smart (i.e. assay-specific) 3D DNA origami design approach was described for the first time, to nanopattern the surface of encoded microparticles present in the channels of a continuous microfluidic platform (EvalutionTM). The DNA origami design aspects that need to be taken into account for origami-based biosensing applications were illustrated through a nano-tailored origami design, perfectly accommodating the well-characterized aptamer–thrombin model system. The effects of the DNA origami nanotailored sensing surface on the performance were evaluated not only at the biosensor level but also at the bioreceptor level. The obtained results confirmed a correlation between the nano-architecture of the biosensing surface and the performance of immobilized bioreceptors. Furthermore, they indicated the necessity of a ‘smart’ design approach in order to achieve the desired improved overall biosensing performance. The combination of the assay-specific interreceptor distances together with an enhanced upward orientation of the aptamer bioreceptors immobilized on the DNA origami structures, lead to improved binding efficiency, kinetics and signal intensity when compared to direct bioreceptor immobilization. This directly translated into an improved biosensor performance in terms of sensitivity, overall signal intensity and signal-to-noise ratio while maintaining the reproducibility. These results highlight the potential for assay-specific DNA origami nano-tailored surfaces to improve biomolecular interactions at the sensing surface and hereby increasing the overall performance of sensing devices for diagnostics. We believe that the reported strategy and insights presents a novel approach that can be transferred to detect a variety of target molecules. Moreover, depending on the sensing platform, a different structural origami basis can be used such as a 2D origami for SPR measurements39 or a wireframe DNA origami structure in electrochemical biosensing.49 The combination of the intrinsic advantages of DNA origami to specifically structure bioreceptors together with a better understanding on the specific design, can be used as a tool that allows a bottom-up engineering of the next generation of improved diagnostic sensing devices.Experimental section
Reagents
All chemicals were of analytical reagent grade and purchased from The Merck group – Sigma Aldrich (Diegem, Belgium), unless stated otherwise. All buffer solutions were prepared using deionized water filtered by a Milli-Q Plus system (The Merck group – Millipore, Marlborough, MA, USA). All unmodified, biotin-modified, amino-modified and fluorescently labelled oligonucleotides were purchased from Integrated DNA technologies (IDT, Haasrode, Belgium) and delivered lyophilized in 96-well plates or in vials. Each of these sequences can be found in ESI† (Tables S1–S4). The Human α-thrombin was purchased from Haematologic Technologies (Essex, VT, USA). Immunoglobulin E (IgE), Human Myeloma Plasma, Kappa was purchased from Athens Research & Technology (Athens, GA, USA). The ATTO 550 Protein labelling Kit was purchased from the Merck group – Sigma Aldrich (Diegem, Belgium) and used to label thrombin and IgE. Streptavidin conjugated with R-Phycoerythrin (SA-PE) was bought from Moss Inc. (Pasadena, MD, USA). The human plasma sample buffer was purchased from Sigma Aldrich (Diegem, Belgium).EvalutionTM instrument
The EvalutionTM platform (MyCartis, Gent, Belgium) consists of three major components: (i) encoded microparticles, that act as solid support for bioreceptors, (ii) the microfluidic assay cartridge, composed of 16 parallel channels, and, (iii) the instrument that integrates the previous elements with fluid actuation, temperature control (25–90 °C) and the necessary components to perform bright-field as well as a fluorescent imaging of the barcoded microparticles.30,50,51 The disk-shaped silicon microparticles (diameter of 40 μm and thickness of 10 μm) carry 10 binary coding bits on their outer ring represented by holes at defined places allowing software identification. The pre-functionalized microparticles were loaded into the microfluidic cartridge, which on its turn was inserted into the instrument. The channels were loaded up to 1 mm, accommodating an average of 250 microparticles. The transport of fluids through the channels was obtained by applying a pressure difference over their in- and outlet. A pressure of 300 mbar (corresponding to 30 nL s−1) was applied throughout each of the experiments while the temperature was kept constant at 25 °C. At the start of each run, the background fluorescence signal of the microparticles was determined. At the end or during each run, the central area of each of the microparticles was imaged to determine the fluorescence signal resulting from the binding of the fluorescently labelled assay component. Visualization of the fluorophore (ATTO 550) was achieved using the green laser (laser power 20 mW; exposure time of 500 ms) and CMOS camera (10× objective) included in the instrument.Pre-functionalization of the microparticles
Three batches of uniquely coded lyophilized microparticles with carboxyl groups grafted on their surface (MyCartis, Gent, Belgium) were resuspended in 200 μL of molecular biology grade water. Subsequently, two of the microparticle batches were washed three times with 500 μL of coupling buffer (100 mM MES, 0.3% Tween20, pH 5.4). The third batch of microparticles, which will remain non-functionalized, was washed three times with PBST buffer (137 mM NaCl, 2.7 mM KCl, 10 mM Na2HPO4, 1.8 mM KH2PO4, 0.3% Tween20, pH 7.4), aliquoted and stored at −20 °C until further use. Washing was performed by allowing intermediate sedimentation and removing the supernatant without touching the microparticle pellet. To the two remaining batches of microparticles, a mixture of 500 μL of 10 mg mL−1 sulfo-NHS solution and 100 μL of 50 mg mL−1 EDC solution, both prepared in activation solution, was added to activate the carboxyl groups on the microparticle surface. The microparticle suspension was homogenized by vortexing briefly prior to a 40 min incubation in a thermoshaker at 1100 rpm and 22 °C. Following this activation, the microparticles were washed three times with coupling buffer. After washing, the activated microparticles were suspended in 590 μL coupling buffer and 10 μL of 20 μM amino-modified DNA probe solution. The two batches of microparticles were functionalized with different amino-modified DNA probes, either for the specific and direct coupling of the aptamers (Tasset aptamer35) called bioreceptor probe, or for the coupling of the DNA origami structures, called origami probe (Fig. 1). The microparticles were vortexed and incubated for 40 min in a thermoshaker at 1100 rpm and 22 °C. Finally, the microparticles were washed three times in PBST buffer, aliquoted and stored at −20 °C until further use. The quality of both batches of functionalized microparticles was established by performing an end-point assay. An ATTO 550-labelled sequence of DNA, complementary to the bioreceptor probes or the origami probes, was flowed in the channel of the cartridge for 20 min followed by a short washing step of 60 s with PBST buffer. Afterwards the fluorescent read-out was recorded for each batch of functionalized microparticles to establish the batch-to-batch variability (Fig. S1, ESI†). After functionalization three different populations of microparticles were obtained: (i) non-functionalised microparticles, (ii) functionalized with bioreceptor probes for the direct coupling of the bioreceptor, (iii) functionalized with origami probes for the coupling of DNA origami nanostructures.Design and assembly of the 3D DNA origami structures
A 3D origami nanostructure was designed using caDNAno (caDNAno 2.2.0, Cambridge, MA, USA)52 and visualized with Maya 2015 (Autodesk, San Rafael, CA, USA). The complete list of oligonucleotide sequences used for folding the M13mp18 ssDNA scaffold22 into the desired shapes is shown in ESI† (Tables S3 and S4) as well as the caDNAno designs (Fig. S2 and S3, ESI†). The DNA origami structure, a 24-helix bundle,53 was modified in a way that one of the distal ends can attach to the microparticles and the opposite side together with the lateral sides can hybridize to a bioreceptor. The designed DNA origami structure with bioreceptor and microparticle surface-coupling strands as protruding arms on predefined positions was assembled by heating the mixture to 75 °C. This was followed by a gradual temperature decrease from 65 °C to 30 °C (ramp speed: −0.5 °C/60 min) and from 30 °C to 20 °C (ramp speed: −1 °C/5 min) using a Thermocycler (Eppendorf, Rotselaar, Beligum). A mixture of 1![[thin space (1/6-em)]](https://www.rsc.org/images/entities/char_2009.gif) :20 molar ratio between the ssDNA scaffold and each of the staple strands in 1 × TEMg(13) buffer (5 mM Tris base, 1 mM Na2EDTA, 13 mM MgCl2, pH 7.6). Afterwards excess staples were removed using a PEG purification method.26
:20 molar ratio between the ssDNA scaffold and each of the staple strands in 1 × TEMg(13) buffer (5 mM Tris base, 1 mM Na2EDTA, 13 mM MgCl2, pH 7.6). Afterwards excess staples were removed using a PEG purification method.26
Gel electrophoresis
3D DNA origami structures were visualized on a 0.8% agarose gel, using a homemade loading dye (50% glycerol, 10% 10 × TE buffer, 40% H2O and traces of bromophenol blue). 1 × TBEMg(13) (40 mM Tris base, 20 mM boric acid, 2 mM Na2EDTA, 13 mM MgCl2, pH 8.0) was used as the running buffer for 2.5 h at 80 V. After 15 min SYBR™ Green (Thermo Fisher Scientific, Waltham, MA, USA) staining, band intensities were visualized using a Typhoon FLA 9000 (GE Healthcare Life Sciences, Diegem, Belgium).Atomic force microscopy imaging
For atomic force microscopy (AFM) imaging, freshly cleaved mica (Agar scientific, Essex, UK) was incubated with 0.1% poly-L-lysine solution by applying 20 μL to adsorb for 20 s. Afterwards the mica was washed with 10 mL of Milli-Q water (Millipore Corporation, Burlington, MA, USA). After washing, the mica was dried using a gentle stream of argon. In a next step, a droplet of 20 μL of sample was incubated for 20 s with the surface of the adsorption-enhanced mica. The mica surface was washed with 10 mL of Milli-Q water and dried under a gentle stream of argon. Imaging was performed using the Pico LE 1-AFM (Aligent AFM system, Newton, NJ, USA) in air, using OLTESPA probes (nominal radius of 5 nm and max radius of 10 nm) with 9 N m−1 force constant cantilevers (Oxford instruments, Santa Barbara, CA, USA). The resulting images were analysed using the SPIPTM—Scanning Probe Image Processor Software (Image Metrology, version 6.7.4, Hørsholm, Denmark).Bioreceptor immobilization
A pre-functionalized microparticle mixture of 5000 microparticles per mL was prepared in PBST buffer and loaded into the channels. This mixture consisted of two different populations of microparticles (i.e. one functionalized and one non-functionalized), as were previously described, in an equal population ratio. In a first step, the DNA origami structures were immobilized on the surface of the designated microparticles, present in separate channels, by flowing 5 nM of the purified DNA origami stock solution in 1 × TEMg(13) buffer. To check the specific immobilization of these nanostructures on the microparticle surface, 1 μM excess of a fluorescently labelled sequence (surface label), complementary to the bioreceptor probes present on the DNA origami structure, was used (Fig. 1B). After immobilization of the DNA origami structures, 1 μM of the thrombin aptamer in 1 × TEMg(13) was incubated. This allowed hybridization of the aptamer to the bioreceptor probes, present on the microparticle surface, either as protruding arms of the DNA origami nanostructures or as directly linked probes (Fig. 1A). To check the presence of the directly immobilized as well as the origami-linked thrombin aptamer, 1 μM of a fluorescently labelled sequence complementary to the aptamer sequence (aptamer label) was flowed in 1 × TEMg(13) (Fig. 1A). Following the same procedure, other bioreceptors (Fig. 1B), including a biotin probe and the IgE aptamer were immobilized to the microparticle surface.Target detection on EvalutionTM
Following the bioreceptor immobilization, each of the assay steps was executed in the microfluidic channels of the cartridge. Every assay component was incubated for a duration of 20 min, unless stated otherwise. The assay steps were separated by a 2 min washing step in PBST buffer. Target detection was performed in two different ways, either by using a direct fluorescently labelled target or sandwich assay concept (Fig. 1B and C).First, the fluorescently labelled targets (i.e. thrombin, DNA, streptavidin and IgE) were used to study the corresponding bioreceptor performance. Their bioreceptors were immobilized either directly to the microparticle surface or by using DNA origami structures (Fig. 1B). Different concentrations of thrombin (338, 84, 21, 5 nM and blank) were flowed in parallel channels in TGK buffer (25 mM Tris base, 192 mM glycine, 5 mM K2HPO4, pH 8.3). The resulting fluorescent signal was recorded with time intervals of 2 min for a duration of 25 min. Similar measurements were performed for a concentration of 84 nM of DNA, streptavidin and IgE target respectively in 1 × TEMg(13), 1 × PBS and PBSMT (8.1 mM Na2HPO4, 1.1 mM KH2PO4, 2.7 mM KCl, 137 mM NaCl, 1 mM MgCl2, 138 mM NaCl, pH 7.4).
Secondly, the performance of the thrombin sandwich assay was evaluated (Fig. 1C). Different concentrations (1350, 338, 84, 21, 5 nM and blank) of thrombin were flowed and incubated in TGK buffer with the aptamer immobilized to the microparticle surface either directly or origami-based. Next, 1 μM of the fluorescently labelled detection aptamer was introduced to the channels in detection buffer (50 mM Tris–HCl, 100 mM NaCl, 5 mM KCl, 5 mM MgCl2, pH 7.4) allowing the end-point detection of thrombin with intermediate washing step.
Data analysis
The fluorescent signals were processed using Origin 8 (OriginLab, Northampton, MA, USA). While fluorescently monitoring the binding reactions over time, the signals, recorded in each of the 16 microfluidic channels, were corrected for the in-channel fluorescence background. The latter is constant and intrinsic to this type of measurement due to the presence of the fluorescent probes. Calibration curves obtained for directly labelled thrombin and the one-step sandwich assay were fitted with a one-site binding curve (eqn (1)):39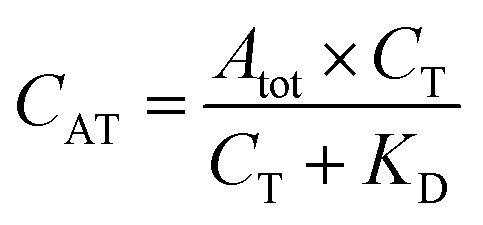 | (1) |
The apparent first-order reaction rates (k′) were determined based on eqn (2), obtained by integrating the rate equations over time (t):54
| CAT = C0AT × e−k′×t | (2) |
| y = y0 + eR0x | (3) |
Conflicts of interest
The authors declare no conflicts of interest.Acknowledgements
We gratefully acknowledge financial support from Fund for Scientific Research (FWO, FWO-Flanders Doctoral grant Iene Rutten 1S30016N and FWO-Flanders Postdoctoral Fellow Devin Daems 12U1618N). We kindly thank MyCartis for access to their EvalutionTM platform, microparticle supplies and technical support. We would also like to thank Steven De Feyter and Joan Teyssandier (Molecular imaging and Photonics, Department of Chemistry, KU Leuven, Belgium) for providing the AFM facilities and technical support. We thank Peter Vangheluwe (Laboratory of Cellular Transport Systems, Department of Cellular and Molecular Medicine, KU Leuven) for access to their gel imaging system, Typhoon FLA 9000.Notes and references
- T. M. Squires, R. J. Messinger and S. R. Manalis, Nat. Biotechnol., 2008, 26, 417–426 CrossRef CAS PubMed.
- H. Pei, X. Zuo, D. Pan, J. Shi, Q. Huang and C. Fan, NPG Asia Mater., 2013, 5, 1–9 Search PubMed.
- E. Pérez-Ruiz, J. Lammertyn and D. Spasic, New Biotechnol., 2016, 33, 755–762 CrossRef PubMed.
- M. Oliverio, S. Perotto, G. C. Messina, L. Lovato and F. De Angelis, ACS Appl. Mater. Interfaces, 2017, 9, 29394–29411 CrossRef CAS PubMed.
- T. M. Herne and M. J. Tarlov, J. Am. Chem. Soc., 1997, 119, 8916–8920 CrossRef CAS.
- C. Daniel, Y. Roupioz, D. Gasparutto, T. Livache and A. Buhot, PLoS One, 2013, 8, 1–6 Search PubMed.
- A. W. Peterson, Nucleic Acids Res., 2001, 29, 5163–5168 CrossRef CAS PubMed.
- R. L. C. Naumann, A. F. Geiss, C. Steininger and W. Knoll, Int. J. Mol. Sci., 2016, 17, 1–15 Search PubMed.
- S. M. Sohreiner, D. F. Shudy, A. L. Hatoh, A. Opdahl, L. J. Whitman and D. Y. Petrovykh, Anal. Chem., 2010, 82, 2803–2810 CrossRef PubMed.
- H. Pei, F. Li, Y. Wan, M. Wei, H. Liu, Y. Su, N. Chen, Q. Huang and C. Fan, J. Am. Chem. Soc., 2012, 134, 11876–11879 CrossRef CAS PubMed.
- P. De Luna, S. S. Mahshid, J. Das, B. Luan, E. H. Sargent, S. O. Kelley and R. Zhou, Nano Lett., 2017, 17, 1289–1295 CrossRef CAS PubMed.
- L. Soleymani, Z. Fang, E. H. Sargent and S. O. Kelley, Nat. Nanotechnol., 2009, 4, 844–848 CrossRef CAS PubMed.
- X. Bin, E. H. Sargent and S. O. Kelley, Anal. Chem., 2010, 82, 5928–5931 CrossRef CAS PubMed.
- M. Lin, J. Wang, G. Zhou, J. Wang, N. Wu, J. Lu, J. Gao, X. Chen, J. Shi, X. Zuo and C. Fan, Angew. Chem., Int. Ed., 2015, 54, 2151–2155 CrossRef CAS PubMed.
- M. Lin, P. Song, G. Zhou, X. Zuo, A. Aldalbahi, X. Lou, J. Shi and C. Fan, Nat. Protoc., 2016, 11, 1244–1263 CrossRef CAS PubMed.
- S. Li, T. Tian, T. Zhang, X. Cai and Y. Lin, Mater. Today, 2018, 24, 57–68 CrossRef.
- D. Ye, X. Zuo and C. Fan, Annu. Rev. Anal. Chem., 2018, 11, 171–195 CrossRef CAS PubMed.
- E. Winfree, F. Liu, L. A. Wenzler and N. C. Seeman, Nature, 1998, 394, 539–544 CrossRef CAS PubMed.
- J. Chen and N. C. Seeman, Nature, 1991, 350, 631–633 CrossRef CAS PubMed.
- C. M. Erben, R. P. Goodman and A. J. Turberfield, Angew. Chem., Int. Ed., 2006, 45, 7414–7417 CrossRef CAS PubMed.
- R. P. Goodman, M. Heilemann, S. Doose, C. M. Erben, A. N. Kapanidis and A. J. Turberfield, Nat. Nanotechnol., 2008, 3, 93–96 CrossRef CAS PubMed.
- P. W. K. Rothemund, Nature, 2006, 440, 297–302 CrossRef CAS PubMed.
- B. Saccà and C. M. Niemeyer, Angew. Chem., Int. Ed., 2012, 51, 58–66 Search PubMed.
- H. Kim, K. Arbutina, A. Xu and H. Liu, Beilstein J. Nanotechnol., 2017, 8, 2363–2375 CrossRef CAS PubMed.
- C. Kielar, Y. Xin, B. Shen, M. A. Kostiainen, G. Grundmeier, V. Linko and A. Keller, Angew. Chem., Int. Ed., 2018, 57, 9470–9474 CrossRef CAS PubMed.
- D. Daems, W. Pfeifer, I. Rutten, B. Sacca, D. Spasic and J. Lammertyn, ACS Appl. Mater. Interfaces, 2018, 10, 23539–23547 CrossRef CAS PubMed.
- S. Rinker, Y. Ke, Y. Liu, R. Chhabra and H. Yan, Nat. Nanotechnol., 2008, 3, 418–422 CrossRef CAS PubMed.
- M. Godonoga, T. Lin, A. Oshima, K. Sumitomo, M. S. L. Tang, Y. Cheung, A. B. Kinghorn, R. M. Dirkzwager, C. Zhou, A. Kuzuya, J. A. Tanner and J. G. Heddle, Sci. Rep., 2016, 6, 21266 CrossRef CAS PubMed.
- Y. Fu, D. Zeng, J. Chao, Y. Jin, Z. Zhang, H. Liu, D. Li, H. Ma, Q. Huang, K. V. Gothelf and C. Fan, J. Am. Chem. Soc., 2013, 135, 696–702 CrossRef CAS PubMed.
- D. Falconnet, J. She, R. Tornay, E. Leimgruber, D. Bernasconi, L. Lagopoulos, P. Renaud, N. Demierre and P. Van Den Bogaard, Anal. Chem., 2015, 87, 1582–1589 CrossRef CAS PubMed.
- L. C. Bock, L. C. Griffin, J. A. Latham, E. H. Vermaas and J. J. Toole, Nature, 1992, 355, 564–566 CrossRef CAS PubMed.
- I. R. Olmsted, Y. Xiao, M. Cho, A. T. Csordas, J. H. Sheehan, J. Meiler, H. T. Soh and D. J. Bornhop, Anal. Chem., 2011, 83, 8867–8870 CrossRef CAS PubMed.
- B. Deng, Y. Lin, C. Wang, F. Li, Z. Wang, H. Zhang, X. F. Li and X. C. Le, Anal. Chim. Acta, 2014, 837, 1–15 CrossRef CAS PubMed.
- P. H. Lin, R. H. Chen, C. H. Lee, Y. Chang, C. S. Chen and W. Y. Chen, Colloids Surf., B, 2011, 88, 552–558 CrossRef CAS PubMed.
- D. Tasset, M. Kubik and W. Steiner, J. Mol. Biol., 1997, 272, 688–698 CrossRef CAS PubMed.
- S. M. Douglas, H. Dietz, T. Liedl, B. Högberg, F. Graf and W. M. Shih, Nature, 2009, 459, 414–418 CrossRef CAS PubMed.
- A. Shaw, I. T. Hoffecker, I. Smyrlaki, J. Rosa, A. Grevys, D. Bratlie, I. Sandlie, T. E. Michaelsen, J. T. Andersen and B. Högberg, Nat. Nanotechnol., 2019, 14, 184–190 CrossRef CAS PubMed.
- S. Ranallo, A. Porchetta and F. Ricci, Anal. Chem., 2019, 91, 44–59 CrossRef CAS PubMed.
- D. Daems, W. Pfeifer, I. Rutten, B. Saccà, D. Spasic and J. Lammertyn, ACS Appl. Mater. Interfaces, 2018, 10, 23539–23547 CrossRef CAS PubMed.
- G. Tikhomirov, P. Petersen and L. Qian, Nature, 2017, 552, 67–71 CrossRef CAS PubMed.
- H. Bila, E. E. Kurisinkal and M. M. C. Bastings, Biomater. Sci., 2019, 7, 532–541 RSC.
- C. Kielar, Y. Xin, B. Shen, M. A. Kostiainen, G. Grundmeier, V. Linko and A. Keller, Angew. Chem., Int. Ed., 2018, 57, 9470–9474 CrossRef CAS PubMed.
- G. Klebe, Nat. Rev. Drug Discovery, 2015, 14, 95–110 CrossRef CAS PubMed.
- R. Grima and S. Schnell, ChemPhysChem, 2006, 7, 1422–1424 CrossRef CAS PubMed.
- G. S. Manning, Biophys. J., 2006, 91, 3607–3616 CrossRef CAS PubMed.
- D. Mathur, W. P. Klein, M. Chiriboga, H. Bui, E. Oh, R. Nita, J. Naciri, P. Johns, J. Fontana, S. A. Díaz and I. L. Medintz, Nanoscale, 2019, 11, 20693–20706 RSC.
- S. Ramakrishnan, H. Ijäs, V. Linko and A. Keller, Comput. Struct. Biotechnol. J., 2018, 16, 342–349 CrossRef CAS PubMed.
- Q. Mei, X. Wei, F. Su, Y. Liu, C. Youngbull, R. Johnson, S. Lindsay, H. Yan and D. Meldrum, Nano Lett., 2011, 11, 1477–1482 CrossRef CAS PubMed.
- E. Benson, A. Mohammed, J. Gardell, S. Masich, E. Czeizler, P. Orponen and B. Högberg, Nature, 2015, 523, 441–444 CrossRef CAS PubMed.
- P. Leblebici, K. Leirs, D. Spasic and J. Lammertyn, Anal. Chim. Acta, 2019, 1053, 70–80 CrossRef CAS PubMed.
- K. Leirs, P. Leblebici, J. Lammertyn and D. Spasic, Anal. Chim. Acta, 2017, 982, 193–199 CrossRef CAS PubMed.
- S. M. Douglas, A. H. Marblestone, S. Teerapittayanon, A. Vazquez, G. M. Church and W. M. Shih, Nucleic Acids Res., 2009, 37, 5001–5006 CrossRef CAS PubMed.
- W. Pfeifer, P. Lill, C. Gatsogiannis and B. Saccà, ACS Nano, 2018, 12, 44–55 CrossRef CAS PubMed.
- U. Rant, Dynamic Biosensors, 2017, 1, 1–6 Search PubMed.
Footnotes |
| † Electronic supplementary information (ESI) available. See DOI: 10.1039/c9tb02439e |
| ‡ Present address: AXES research group, University of Antwerp, 2020 Antwerp, Belgium. |
| This journal is © The Royal Society of Chemistry 2020 |