
 Open Access Article
 This Open Access Article is licensed under a
 Creative Commons Attribution 3.0 Unported Licence
KFSA/glyme electrolytes for 4 V-class K-ion batteries†
Tomooki
Hosaka
 a,
Tatsuo
Matsuyama
a,
Kei
Kubota
ab,
Ryoichi
Tatara
ab and
Shinichi
Komaba
*ab
a,
Tatsuo
Matsuyama
a,
Kei
Kubota
ab,
Ryoichi
Tatara
ab and
Shinichi
Komaba
*ab
aDepartment of Applied Chemistry, Tokyo University of Science, Shinjuku, Tokyo 162-8601, Japan. E-mail: komaba@rs.tus.ac.jp
bElements Strategy Initiative for Catalysts and Batteries (ESICB), Kyoto University, 1-30 Goryo-Ohara, Nishikyo-ku, Kyoto 615-8245, Japan
First published on 5th November 2020
Abstract
Highly concentrated electrolytes of KN(SO2F)2 (KFSA)/diglyme and KFSA/triglyme are developed for high-voltage K-ion batteries. They demonstrate high oxidation stability up to 4.7 V vs. K/K+, which is considerably higher than that of the KFSA/monoglyme electrolyte. Moreover, these electrolytes can improve the cycling stability of high-voltage K-ion batteries.
Introduction
Recently, K-ion batteries (KIBs), which do not contain minor metals like Li and Co, have attracted considerable attention as potential high-voltage and high-power secondary batteries.1–3 The high-voltage and high-power characteristics are attributed to the low standard electrode potential of K/K+ in carbonate-ester-based electrolytes and the fast ionic diffusion of K+ ions in electrolytes, respectively.1 One of the main challenges in the development of high-voltage KIBs is the requirement of high-performance electrolytes that have the passivation ability of Al, high oxidation stability, and enabling the formation of stable solid electrolyte interphase (SEI) on the surface of the negative electrodes.4–7To date, aprotic solutions containing KPF6 salt have been mainly utilized for developing KIBs as its counterpart Li electrolyte is broadly used in commercialized LIBs.1 According to our investigation and knowledge,1 KPF6 salt has some advantages such as passivation of Al current collector similar to LIB cases due to the formation of AlF3 as a stable passivation layer on the Al surface.8,9 Although the second common K salt of KN(SO2F)2 (KFSA) normally corrode Al current collector, highly concentrated KFSA electrolytes can passivate it.5 Moreover, previous studies have indicated that an appropriate SEI is formed in highly concentrated electrolytes of imide salts in glymes such as KFSA/monoglyme (G1).5,10,11 However, the low oxidation stability of G1 causes electrolyte decomposition at high-potential positive electrodes, thereby limiting the application of the electrolytes for high-voltage KIBs. Indeed, a previous study of the electrochemical performance of positive and negative electrodes in 7 mol kg−1 KFSA/G1 electrolyte reported a slightly lower coulombic efficiency for the K2Mn[Fe(CN)6] positive electrode at a working potential ca. 3.8 V than that for the graphite negative electrode.5 The mismatch of coulombic efficiency would result in capacity degradation of full cells.12 To solve the low oxidation stability of G1 electrolytes, we utilized longer glymes such as diglyme (G2) and triglyme (G3) based on Yoshida et al.'s report that the oxidation stability of glyme molecule increases when they form solvate complexes with Li+ ions. This occurs because of electron pair donation to Li+ and consequent lowering of the highest occupied molecular orbital energy level.13 Most of the glyme molecules are coordinated to alkali-metal cations in highly concentrated electrolytes, and the oxidation stability of the electrolyte is improved.13 The degree of oxidation stability improvement depends on the stability of the solvate complexes in electrolytes. Electrolytes consisting of highly stable solvate complexes demonstrate higher oxidation stability14 because the glyme molecules are tightly bound to the cation. Therefore, an appropriate combination of cation size and glyme length can enhance the oxidation stability of the highly concentrated electrolytes, and longer glymes are suitable for the large K+ ions.15 In this study, we have evaluated the physical and electrochemical properties of highly concentrated KFSA/G2 and KFSA/G3 solutions, which are liquid at room temperature. We have also investigated the electrochemical properties of K2Mn[Fe(CN)6] and graphite electrodes in these electrolytes.
Results and discussion
We prepared KFSA/G1, KFSA/G2, and KFSA/G3 solutions with molalities of K![[thin space (1/6-em)]](https://www.rsc.org/images/entities/char_2009.gif) :O = 1:10 (∼2.2 mol kg−1) and K:O = 1:4 (∼5.5 mol kg−1 for KFSA/G1, ∼5.6 mol kg−1 for KFSA/G2, and G3). Physicochemical properties of the electrolytes were examined in terms of their ionic conductivities and viscosities (Table 1). The 2.2 mol kg−1 KFSA/G1 solution showed high ionic conductivity and low viscosity. The highly concentrated (5.5 mol kg−1) KFSA/G1 solution also showed a high ionic conductivity of 8.60 mS cm−1 and a relatively low viscosity of 20.2 mPa s. The high conductivity and low viscosity could be attributed to the low viscosity of the G1 solvent. Compared with the G1 solutions, the highly concentrated KFSA/G2 and KFSA/G3 solutions exhibited lower ionic conductivity and higher viscosity. The 5.6 mol kg−1 KFSA/G3 (K:G3 = 1:1 mol:mol) solution showed a low ionic conductivity of 0.89 mS cm−1 and a high viscosity of 229 mPa s. The viscosities of these solutions tend to be lower than the Na counterparts.16 For example, the NaFSA/G3 (Na:G3 = 1:1 mol:mol) solution exhibits a considerably higher viscosity of 497 mPa s.16 The 5.6 mol kg−1 G3 solution was a transparent liquid without any precipitate at room temperature, whereas the 2.2 mol kg−1 G3 mixture was a solid at room temperature (see Fig. S1 in ESI†). This phenomenon is often observed in alkali metal–glyme mixtures. This is caused by the lower melting point of the solvates in higher concentration solutions compared to that in lower concentration solutions.15,17 We also prepared KFSA/tetraglyme and KFSA/pentaglyme solutions with a molar ratio of 1:1, but both were solid at room temperature and, therefore, excluded from the investigation of electrochemical behavior in this study.
:O = 1:10 (∼2.2 mol kg−1) and K:O = 1:4 (∼5.5 mol kg−1 for KFSA/G1, ∼5.6 mol kg−1 for KFSA/G2, and G3). Physicochemical properties of the electrolytes were examined in terms of their ionic conductivities and viscosities (Table 1). The 2.2 mol kg−1 KFSA/G1 solution showed high ionic conductivity and low viscosity. The highly concentrated (5.5 mol kg−1) KFSA/G1 solution also showed a high ionic conductivity of 8.60 mS cm−1 and a relatively low viscosity of 20.2 mPa s. The high conductivity and low viscosity could be attributed to the low viscosity of the G1 solvent. Compared with the G1 solutions, the highly concentrated KFSA/G2 and KFSA/G3 solutions exhibited lower ionic conductivity and higher viscosity. The 5.6 mol kg−1 KFSA/G3 (K:G3 = 1:1 mol:mol) solution showed a low ionic conductivity of 0.89 mS cm−1 and a high viscosity of 229 mPa s. The viscosities of these solutions tend to be lower than the Na counterparts.16 For example, the NaFSA/G3 (Na:G3 = 1:1 mol:mol) solution exhibits a considerably higher viscosity of 497 mPa s.16 The 5.6 mol kg−1 G3 solution was a transparent liquid without any precipitate at room temperature, whereas the 2.2 mol kg−1 G3 mixture was a solid at room temperature (see Fig. S1 in ESI†). This phenomenon is often observed in alkali metal–glyme mixtures. This is caused by the lower melting point of the solvates in higher concentration solutions compared to that in lower concentration solutions.15,17 We also prepared KFSA/tetraglyme and KFSA/pentaglyme solutions with a molar ratio of 1:1, but both were solid at room temperature and, therefore, excluded from the investigation of electrochemical behavior in this study.
| Molar ratio (KFSA:glyme) |
Molality/mol kg−1 | Ionic conductivity/mS cm−1 | Viscosity/mPa s | |
|---|---|---|---|---|
| KFSA/G1 | 1:5 |
2.2 | 17.47 | 2.7 |
| KFSA/G1 | 1:2 |
5.5 | 8.60 | 20.2 |
| KFSA/G2 | 1:3.3 |
2.2 | 7.82 | 10.3 |
| KFSA/G2 | 1:1.33 |
5.6 | 2.84 | 68.0 |
| KFSA/G3 | 1:2.5 |
2.2 | Solid at 25 °C | Solid at 25 °C |
| KFSA/G3 | 1:1 |
5.6 | 0.89 | 229 |
The solution structures were investigated using Raman spectroscopy. Fig. 1a–c display the Raman spectra over the range of 780–900 cm−1, where important Raman bands assigned to mixed modes of CH2 rocking and C–O–C stretching vibrations in glymes are known to appear.18 Pure G1 exhibited two broad peaks around 817 and 844 cm−1. The intensity of these peaks decreased as the molality of KFSA in the solution increased. In contrast, the intensity of a new peak at 854 cm−1, which can be assigned to G1 bound to a K+ ion, monotonously increased. The Raman spectra were deconvoluted (see Fig. S2†); the intensities of each peak are shown in Fig. 1d–f. Peak deconvolution revealed that the intensity of a peak at 829.5 cm−1 also increased with increasing molality up to 3.7 mol kg−1 (Fig. 1d), implying that this peak could also be attributed to the bound G1. Similarly, the G2 and G3 solutions exhibited a decrease in the intensity of the peaks assigned to free glyme and an increase in the intensity of the peaks corresponding to bound glyme peaks with an increase in the molality of KFSA. The area fractions of the bound glyme peaks were 70%, 67%, and 78% for the highly concentrated G1, G2, and G3 solutions, respectively. It should be noted that the Raman scattering coefficients of free and bound glyme are almost identical and independent of the salt concentration. This is because the normalized area intensities of the FSA band between 680 and 780 cm−1 (IFSA/IGlyme) for the G1 and G2 solutions exhibited a linear relationship with the molality (Fig. S3†).19 This indicates that the ratios of peak areas of free and bound glyme would reflect their molar ratio. Therefore, 70–80% of glyme molecules are bound to K+ ions in the highly concentrated electrolytes, which is similar to the case of a highly concentrated NaTFSA/G1 solution (∼68% at a molar ratio of Na:G1 = 1:2.5).19 These solution structures will contribute to the enhancement of oxidation stability if the solvate complexes are stable.
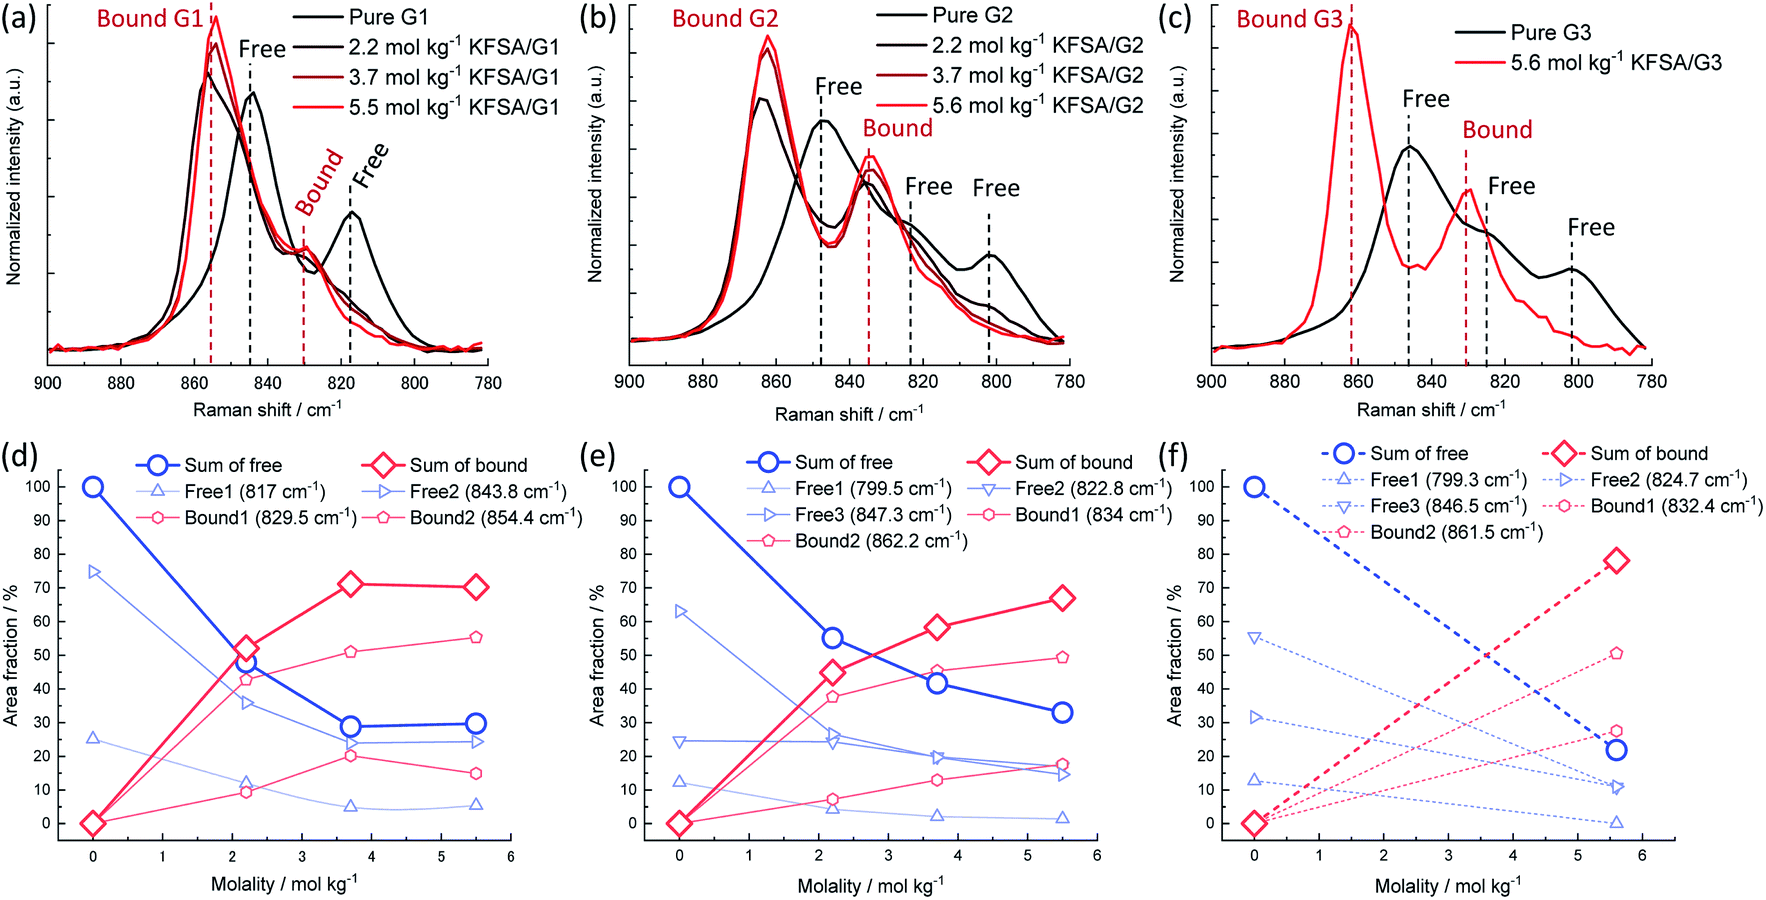 | ||
| Fig. 1 Normalized Raman spectra of (a) KFSA/G1, (b) KFSA/G2, and (c) KFSA/G3 solutions in the range of 780–900 cm−1. Dependence of area fraction of deconvoluted Raman spectra (detailed data in Fig. S2†) on KFSA concentration in (d) KFSA/G1, (e) KFSA/G2, and (f) KFSA/G3 solutions. | ||
The coordination structure of the FSA− anion was also examined by Raman spectroscopy. In the 2.2 mol kg−1 KFSA/G1 solution, the Raman band of the FSA− anion was observed around 720 cm−1 (Fig. S4a†), which can be assigned to free FSA− or weakly interacting FSA− weekly interacting with K+ ions (solvent separated ion pairs, SSIPs).20 The peak blue-shifted with increasing molality. The shift indicates the formation of ion pairs, such as contact ion pairs and aggregates (AGGs).20 The G2 solutions also exhibited the same trend (Fig. S4b†). The peak positions of the highly concentrated G1, G2, and G3 solutions were almost identical (Fig. S4c†), revealing that, in these solutions, ion pairing is not solvent dependent. The significant degree of ion-pair formation in these solutions is reasonable because the number of ether groups per K+ ion is lower than the typical solvation number of K+ ions in aprotic solutions, i.e., 6 to 8.15,21
Thermal stabilities of these highly concentrated solutions were further tested by thermogravimetric analysis (Fig. S5†). The 5.5 mol kg−1 KFSA/G1 solution showed significant weight loss above 30 °C, indicating high volatility. This could be attributed to the weak interaction between K+ and G1 as well as the high volatility of G1. In contrast, 5.6 mol kg−1 KFSA/G2 and KFSA/G3 solutions showed a significant improvement in thermal stability as compared to the pure solvent. The pure G2 solvent showed weight loss from ca. 50 °C, whereas the 5.6 mol kg−1 G2 solution showed almost no weight loss up to 80 °C. Most notably, the 5.6 mol kg−1 KFSA/G3 solution exhibited almost no weight loss up to 140 °C and 10 wt% loss at 185 °C, demonstrating the highest thermal stability among the solutions studied. The thermal stability of the KFSA/G3 solution is similar to that of the LiFSA/G3 (molar ratio of 1:1) solution, which exhibited a 10 wt% loss at 152 °C at the same scan rate used in this study.22 The improved thermal stability of the G2 and G3 solutions indicates a strong interaction between K+ ions and the glymes.
The Al corrosion behavior and anodic stability were electrochemically evaluated using voltammetry. Fig. 2a shows CV curves of the Al working electrodes in three-electrode cells filled with the highly concentrated electrolytes. Also shown, for comparison, is the CV curve with the 2.2 mol kg−1 KFSA/G1 solution. In the 2.2 mol kg−1 KFSA/G1 electrolyte, the CV curve delivered a potential hysteresis loop showing continuous current rise even in the cathodic scan, which indicates localized corrosion of Al foil.23 A microscopic image of this Al working electrode showed significant pitting corrosion (Fig. S6†). However, in case of the highly concentrated electrolytes, the anodic current was negligible up to 5 V vs. K/K+, and no pitting corrosion was observed in the microscopic images (Fig. S6†). This result revealed that Al foil was successfully passivated in highly concentrated solutions, which is consistent with our previous data with highly concentrated KFSA/DME solution.5 Although all the highly concentrated electrolytes demonstrated sufficient passivation ability and anodic stability with an Al electrode, the electrolytes can be oxidized on active materials or conductive carbons when a composite electrode is used instead of an Al electrode. Therefore, we further investigated the oxidation stability by linear sweep voltammetry using Ketjen black (KB) electrodes consisting of KB:PVdF = 80:20 (wt%). As shown in Fig. 2b, the 2.2 mol kg−1 KFSA/G1 and 2.2 mol kg−1 KFSA/G2 electrolyte cells exhibited an increase in anodic current from ca. 4.3 V vs. K/K+. More importantly, the 5.5 mol kg−1 KFSA/G1 electrolyte exhibited a curve similar to that of 2.2 mol kg−1 KFSA/G1, indicating a negligible enhancement in oxidation stability. In contrast, the 5.6 mol kg−1 KFSA/G2 and KFSA/G3 solutions exhibited an increase in anodic current from ∼4.7 V vs. K/K+. The anodic stability is higher than that of the 5.5 mol kg−1 KFSA/G1 electrolyte and similar to that of highly concentrated NaFSA/G2 (∼4.6 V vs. Na/Na+) reported by Geysens et al.16 The high oxidation stability can be attributed to the higher stability of the solvate complexes in G2 and G3 compared to that in G1.14,15
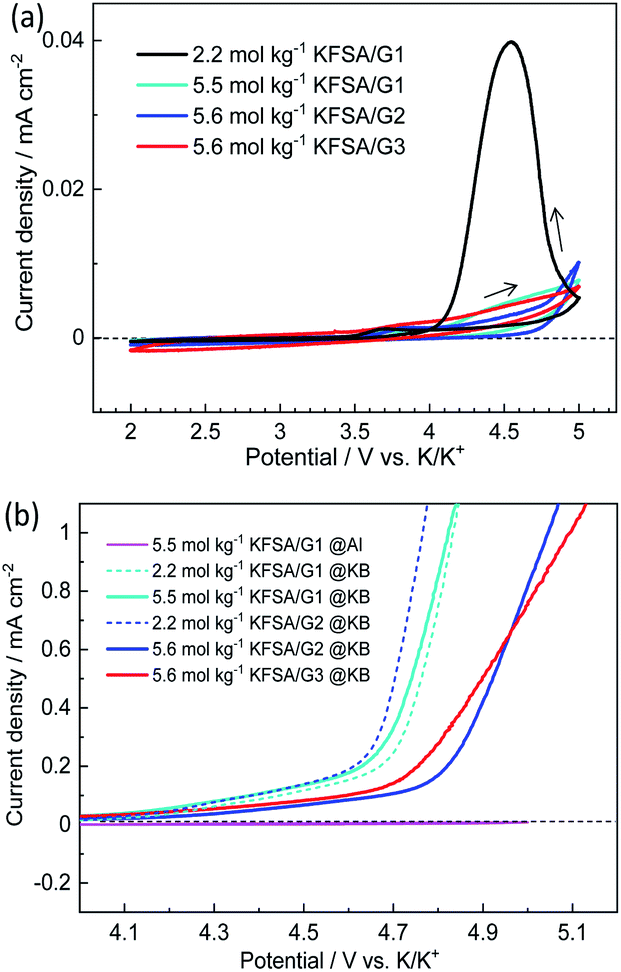 | ||
| Fig. 2 (a) Cyclic voltammograms of Al foil as working electrodes and (b) linear sweep voltammograms of Ketjen black (KB)–PVdF composite electrodes formed on Al foil in three-electrode cells filled with various KFSA/glyme electrolytes. The cyclic voltammograms of the Al electrode in 5.5 mol kg−1 KFSA/G1 are also shown in (b) (pink line) for comparison. | ||
Fig. 3a–c show the galvanostatic charge–discharge curves of K‖K2Mn[Fe(CN)6] cells24 filled with the highly concentrated KFSA/G1, KFSA/G2, and KFSA/G3 solutions. The KFSA/G1 cell exhibited an initial charge capacity of 164 mA h g−1 and a discharge capacity of 101 mA h g−1, resulting in a low initial coulombic efficiency of 61%. By contrast, the KFSA/G2 cell delivered a discharge capacity of 111 mA h g−1 and an initial coulombic efficiency of 78%. The higher discharge capacity and higher coulombic efficiency of the KFSA/G2 than those of the KFSA/G1 cell are likely due to lower electrolyte decomposition and self-discharge in the former. Moreover, the KFSA/G3 cell achieved the largest discharge capacity of 115 mA h g−1 and the highest initial coulombic efficiency of 87%. After the initial cycle, the KFSA/G1 cell maintained a low coulombic efficiency of around 90% (Fig. 3d). In contrast, the G2 and G3 cells demonstrated higher coulombic efficiencies of ca. 99.0% and 99.5%, respectively (Fig. 3d), and large reversible capacity (Fig. 3b and c). Furthermore, even when the upper cut-off voltage was changed from 4.3 V to 4.5 V, the G3 electrolyte cell delivered good cycle performance and high coulombic efficiency. In contrast, a cell filled with a highly concentrated G1 electrolyte exhibited huge irreversible capacity attributed to the continuous anodic decomposition of the electrolyte (see Fig. S7†). These data reveal excellent compatibility between the K2Mn[Fe(CN)6] composite electrodes and the G3 electrolytes because of the high oxidation stability of the electrolytes.
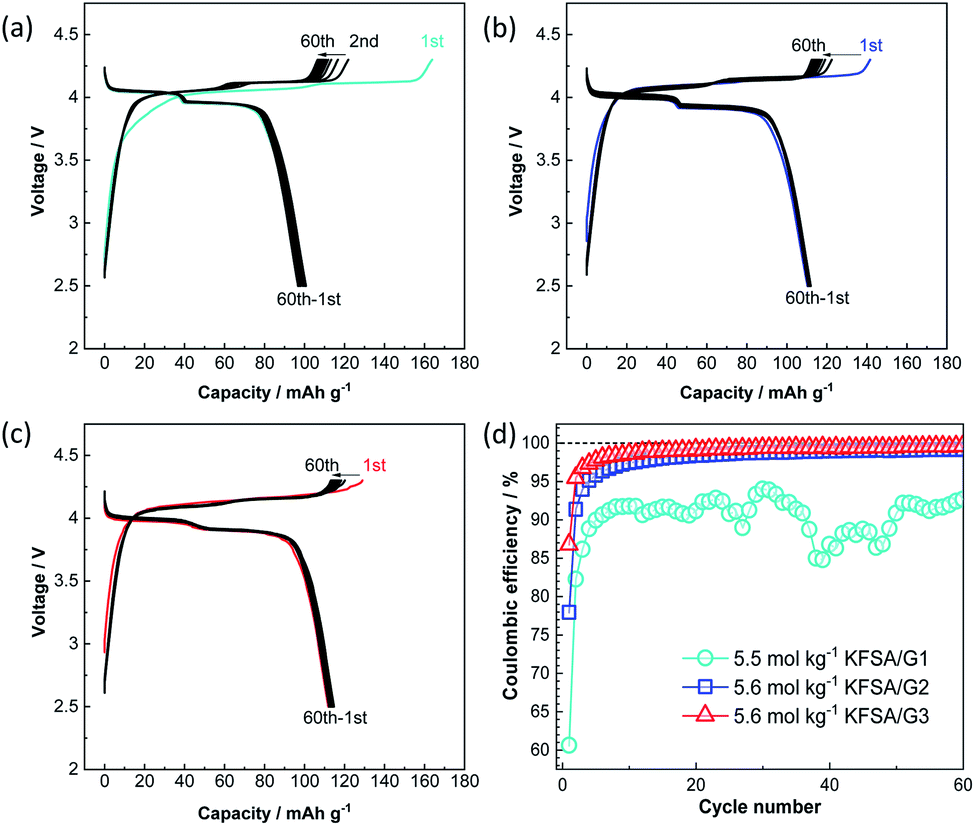 | ||
| Fig. 3 Charge–discharge curves of K‖K2Mn[Fe(CN)6] cells filled with (a) 5.5 mol kg−1 KFSA/G1, (b) 5.6 mol kg−1 KFSA/G2, and (c) 5.6 mol kg−1 KFSA/G3 electrolytes. (d) Variations of their coulombic efficiency. | ||
In addition to the K2Mn[Fe(CN)6] positive electrodes, graphite negative electrodes25 were evaluated using highly concentrated KFSA/glyme electrolytes. Fig. S8a–c† show the charge and discharge curves, corresponding to K intercalation and deintercalation, respectively, of K‖graphite cells filled with the KFSA/G1, KFSA/G2, and KFSA/G3 solutions. These cells showed initial reversible capacities of >270 mA h g−1 and coulombic efficiencies of 82–85%. The reversible capacity is almost the theoretical capacity of KC8 (279 mA h g−1), suggesting the insertion of desolvated K+ ions and the formation of binary graphite intercalation compounds. It has been reported that, in case of highly concentrated electrolytes, desolvated K+ ions are intercalated into graphite5 instead of K+-glyme co-intercalation that occurs in conventionally concentrated electrolytes.26 In subsequent cycles, all the cells exhibited excellent cycle performance with high coulombic efficiencies of >99% (Fig. S8†). These results are consistent with good electrochemical performances of negative electrodes in imide salt/glyme electrolytes5,10,11 and prove that these KFSA/glyme electrolytes are similarly effective in forming a stable SEI, so as to achieve highly reversible K intercalation into graphite. To characterize the SEI formed in a highly concentrated KFSA/glyme electrolyte, we conducted hard X-ray photoelectron spectroscopy (HAXPES) on the graphite electrode tested in a highly concentrated KFSA/G1 electrolyte. Fig. S9a–e† display HAXPES spectra of the pristine graphite electrode and that tested in the highly concentrated KFSA/G1 electrolyte. The obtained C 1s spectra of the cycled electrode can be deconvoluted into six peaks, which are assigned to sp2 ![[C with combining low line]](https://www.rsc.org/images/entities/char_0043_0332.gif) , –Hx–, –Hx–C(
, –Hx–, –Hx–C(![[double bond, length as m-dash]](https://www.rsc.org/images/entities/char_e001.gif) O)O–,
O)O–, ![[R with combining low line]](https://www.rsc.org/images/entities/char_0052_0332.gif) –OK/–(O)–, –(O)O–, and –O(O)O– components.27 The organic components are mainly attributed to the solvent-derived decomposition products. Moreover, S 1s and F 1s spectra showed several peaks assigned to FSA−-derived components, such as SOxF, –SO2–, –S(O)–, as well as KF. These decomposition products would be a key component of the SEI enabling high coulombic efficiency, as reported before.28–30 Fig. S9f† shows the relative atomic amount of carbon (except for sp2 carbon), oxygen, potassium, phosphorus, nitrogen, fluorine, and sulfur elements relative to that of sp2 carbon estimated from the HAXPES data of the tested electrode in comparison to the one tested in a conventional KPF6/EC:DEC electrolyte.31 In the KFSA/G1 electrolyte, the relative amount of carbon was much lower than in the KPF6/EC:DEC electrolyte, indicating less organic species were deposited in the KFSA/G1 electrolyte. Furthermore, the total atomic amount on the graphite surface in the highly concentrated KFSA/G1 electrolyte was ∼60% of that in the KPF6 one, suggesting that a relatively thin SEI layer was formed on the graphite electrode in the KFSA/G1 electrolyte.
–OK/–(O)–, –(O)O–, and –O(O)O– components.27 The organic components are mainly attributed to the solvent-derived decomposition products. Moreover, S 1s and F 1s spectra showed several peaks assigned to FSA−-derived components, such as SOxF, –SO2–, –S(O)–, as well as KF. These decomposition products would be a key component of the SEI enabling high coulombic efficiency, as reported before.28–30 Fig. S9f† shows the relative atomic amount of carbon (except for sp2 carbon), oxygen, potassium, phosphorus, nitrogen, fluorine, and sulfur elements relative to that of sp2 carbon estimated from the HAXPES data of the tested electrode in comparison to the one tested in a conventional KPF6/EC:DEC electrolyte.31 In the KFSA/G1 electrolyte, the relative amount of carbon was much lower than in the KPF6/EC:DEC electrolyte, indicating less organic species were deposited in the KFSA/G1 electrolyte. Furthermore, the total atomic amount on the graphite surface in the highly concentrated KFSA/G1 electrolyte was ∼60% of that in the KPF6 one, suggesting that a relatively thin SEI layer was formed on the graphite electrode in the KFSA/G1 electrolyte.
Since both the K2Mn[Fe(CN)6] positive electrode and graphite negative electrode exhibited good electrochemical performance with high coulombic efficiency in 5.6 mol kg−1 KFSA/G3, we fabricated a K-ion full cell filled with the electrolyte, and its electrochemical performance was compared to that of the KFSA/G1 cell. Fig. 4a and b display the charge–discharge curves of graphite‖K2Mn[Fe(CN)6] full cells filled with 5.5 mol kg−1 KFSA/G1 +0.5 wt% vinylene carbonate (VC) and 5.6 mol kg−1 KFSA/G3 +0.5 wt% VC, respectively. We note that the addition of 0.5 wt% VC into electrolyte solution is effective to suppress the initial irreversible capacity of full cells (see Fig. S10†). The irreversible capacity of the full cell is larger than the expected one from the half cell results. The different electrochemical performance or SEI characteristics between half and full cells have been reported in several studies on Na-ion and K-ion batteries, and it has been explained by limited active Na/K content in the full cell or reaction between alkali metal and electrolyte in a half cell.31–34 The detail of the difference between half and full cells is currently under investigation and will be reported elsewhere. Although the irreversible capacity was observed, the G1 and G3 cells delivered reasonable initial discharge capacities of 86 and 79 mA h g−1, respectively (Fig. S11a†). In subsequent cycles, the G1 cell showed a significant decrease in discharge capacity, which became as low as 14 mA h g−1 after 100 cycles (Fig. 4a and S11b†). The capacity degradation would be due to irreversible reactions mainly caused by electrolyte decomposition because the cell exhibited low and unstable coulombic efficiency over 100 cycles (Fig. 4c). In the G1 cell, the large irreversible capacity of the positive electrode would induce overcharge of the negative electrode in repeated cycles as the cut-off voltage (not potential) is fixed (Fig. S12a and b†). The overcharge causes K metal plating, which further drops the coulombic efficiency as observed around the 10th and 50th cycle. In contrast, the G3 full cell showed a discharge capacity of 106 mA h g−1 after 100 cycles and exhibited considerably higher cycle performance than the G1 cell (Fig. 4b). It should be mentioned that the G3 cell exhibited a capacity increase, especially during the initial 30 cycles (Fig. 4b and S11b†). In the G3 cell, the positive electrode showed higher coulombic efficiency than the negative electrode at the initial cycle, but the order was contrary after the second cycle as is shown in the half cell data (Fig. S12c†). Thus, the negative electrode would not be fully charged at the initial cycle and charged to a deeper state of charge (SOC) in each cycle after the second cycle (Fig. S12d†). The SOC increase would induce the increase in capacity during cycling. Moreover, the G3 cell maintained high coulombic efficiency over 100 cycles (Fig. 4c). Thus, the use of a 5.6 mol kg−1 KFSA/G3 electrolyte with high oxidation stability enhances the cycling stability of high-voltage KIBs by avoiding electrolyte decomposition.
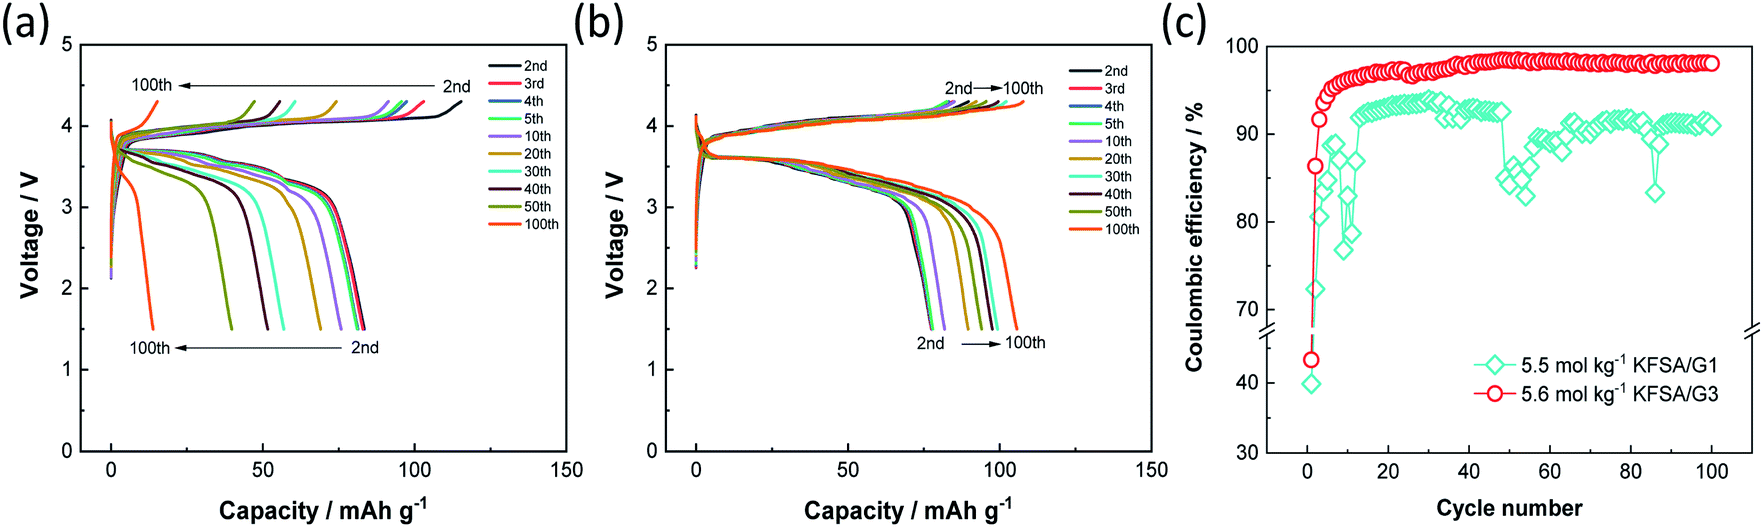 | ||
| Fig. 4 Charge–discharge curves of graphite‖K2Mn[Fe(CN)6] full cells filled with (a) 5.5 mol kg−1 KFSA/G1 +0.5 wt% vinylene carbonate (VC), and (b) 5.6 mol kg−1 KFSA/G3 +0.5 wt% VC. (c) Variations of their coulombic efficiencies over 100 cycles. | ||
Conclusions
This study reveals that the highly concentrated KFSA/G2 and KFSA/G3 electrolytes are promising for high-voltage KIBs. These electrolytes passivate the Al current collector at high potentials and have better oxidation stability than the G1 counterpart. Their high oxidation stability allows highly reversible operation of high-potential positive electrode materials such as K2Mn[Fe(CN)6]. This high oxidation stability is attributed to the strong interaction of K+ ions with long glymes. The KFSA/G2 and KFSA/G3 electrolytes facilitate higher cycling stability of 4 V-class potassium-ion batteries than the KFSA/G1 electrolyte.Conflicts of interest
There are no conflicts to declare.Acknowledgements
This study was partly funded by the MEXT program “ESICB” (No. JPMXP0112101003), the JST through the A-STEP program (No. JPMJTS1611), and JSPS KAKENHI Grant No. JP16K14103, JP16H04225, JP18K14327, and JP20J13077. The synchrotron radiation experiments were performed at the BL46XU of SPring-8 as the Priority Research Proposal (priority field: Industrial Application) with the approval of the Japan Synchrotron Radiation Research Institute (JASRI) (Proposal No. 2018B1613). The authors would like to thank Editage (http://www.editage.com) for English language editing. T. H. thanks the JSPS for the research fellowship.References
- T. Hosaka, K. Kubota, A. S. Hameed and S. Komaba, Chem. Rev., 2020, 120, 6358–6466 CAS.
- A. Eftekhari, Z. L. Jian and X. L. Ji, ACS Appl. Mater. Interfaces, 2017, 9, 4404–4419 CAS.
- J. Y. Hwang, S. T. Myung and Y. K. Sun, Adv. Funct. Mater., 2018, 28, 1802938 CrossRef.
- J. Liao, Q. Hu, Y. Yu, H. Wang, Z. Tang, Z. Wen and C. Chen, J. Mater. Chem. A, 2017, 5, 19017–19024 RSC.
- T. Hosaka, K. Kubota, H. Kojima and S. Komaba, Chem. Commun., 2018, 54, 8387–8390 RSC.
- Q. Zhang, J. F. Mao, W. K. Pang, T. Zheng, V. Sencadas, Y. Z. Chen, Y. J. Liu and Z. P. Guo, Adv. Energy Mater., 2018, 8, 1703288 CrossRef.
- H. Onuma, K. Kubota, S. Muratsubaki, T. Hosaka, R. Tatara, T. Yamamoto, K. Matsumoto, T. Nohira, R. Hagiwara and H. Oji, ACS Energy Lett., 2020, 5, 2849–2857 CrossRef CAS.
- M. Morita, T. Shibata, N. Yoshimoto and M. Ishikawa, Electrochim. Acta, 2002, 47, 2787–2793 CrossRef CAS.
- A. Konarov, H. J. Kim, H. Yashiro and S.-T. Myung, J. Mater. Chem. A, 2019, 7, 13012–13018 RSC.
- N. Xiao, W. D. McCulloch and Y. Wu, J. Am. Chem. Soc., 2017, 139, 9475–9478 CrossRef CAS.
- R. Zhang, J. Bao, Y. Wang and C.-F. Sun, Chem. Sci., 2018, 9, 6193–6198 RSC.
- N. Yoshinaga, S. Kumakura, K. Kubota, T. Horiba and S. Komaba, J. Electrochem. Soc., 2019, 166, A5430 CrossRef CAS.
- K. Yoshida, M. Nakamura, Y. Kazue, N. Tachikawa, S. Tsuzuki, S. Seki, K. Dokko and M. Watanabe, J. Am. Chem. Soc., 2011, 133, 13121–13129 CrossRef CAS.
- C. Zhang, K. Ueno, A. Yamazaki, K. Yoshida, H. Moon, T. Mandai, Y. Umebayashi, K. Dokko and M. Watanabe, J. Phys. Chem. B, 2014, 118, 5144–5153 CrossRef CAS.
- T. Mandai, K. Yoshida, S. Tsuzuki, R. Nozawa, H. Masu, K. Ueno, K. Dokko and M. Watanabe, J. Phys. Chem. B, 2015, 119, 1523–1534 CrossRef CAS.
- P. Geysens, V. S. Rangasamy, S. Thayumanasundaram, K. Robeyns, L. Van Meervelt, J.-P. Locquet, J. Fransaer and K. Binnemans, J. Phys. Chem. B, 2018, 122, 275–289 CrossRef CAS.
- W. A. Henderson, J. Phys. Chem. B, 2006, 110, 13177–13183 CrossRef CAS.
- K. Ueno, R. Tatara, S. Tsuzuki, S. Saito, H. Doi, K. Yoshida, T. Mandai, M. Matsugami, Y. Umebayashi, K. Dokko and M. Watanabe, Phys. Chem. Chem. Phys., 2015, 17, 8248–8257 RSC.
- R. Tatara, G. M. Leverick, S. Feng, S. Wan, S. Terada, K. Dokko, M. Watanabe and Y. Shao-Horn, J. Phys. Chem. C, 2018, 122, 18316–18328 CrossRef CAS.
- Y. Yamada, M. Yaegashi, T. Abe and A. Yamada, Chem. Commun., 2013, 49, 11194–11196 RSC.
- T. A. Pham, K. E. Kweon, A. Samanta, V. Lordi and J. E. Pask, J. Phys. Chem. C, 2017, 121, 21913–21920 CrossRef CAS.
- S. Seki, K. Takei, H. Miyashiro and M. Watanabe, J. Electrochem. Soc., 2011, 158, A769 CrossRef CAS.
- M. Metikoš-Huković and I. Milošev, J. Appl. Electrochem., 1992, 22, 448–455 CrossRef.
- X. Bie, K. Kubota, T. Hosaka, K. Chihara and S. Komaba, J. Mater. Chem. A, 2017, 5, 4325–4330 RSC.
- S. Komaba, T. Hasegawa, M. Dahbi and K. Kubota, Electrochem. Commun., 2015, 60, 172–175 CrossRef CAS.
- A. P. Cohn, N. Muralidharan, R. Carter, K. Share, L. Oakes and C. L. Pint, J. Mater. Chem. A, 2016, 4, 14954–14959 RSC.
- N. Yabuuchi, Y. Matsuura, T. Ishikawa, S. Kuze, J.-Y. Son, Y.-T. Cui, H. Oji and S. Komaba, ChemElectroChem, 2014, 1, 580–589 CrossRef.
- Y. Yamada, K. Furukawa, K. Sodeyama, K. Kikuchi, M. Yaegashi, Y. Tateyama and A. Yamada, J. Am. Chem. Soc., 2014, 136, 5039–5046 CrossRef CAS.
- Q. Zhang, J. Mao, W. K. Pang, T. Zheng, V. Sencadas, Y. Chen, Y. Liu and Z. Guo, Adv. Energy Mater., 2018, 8, 1703288 CrossRef.
- L. Deng, Y. Zhang, R. Wang, M. Feng, X. Niu, L. Tan and Y. Zhu, ACS Appl. Mater. Interfaces, 2019, 11, 22449–22456 CrossRef CAS.
- T. Hosaka, T. Matsuyama, K. Kubota, S. Yasuno and S. Komaba, ACS Appl. Mater. Interfaces, 2020, 12, 34873–34881 CrossRef CAS.
- Y. B. Niu, Y. X. Yin and Y. G. Guo, Small, 2019, 15, 1900233 CrossRef.
- G. Yan, D. Alves-Dalla-Corte, W. Yin, N. Madern, G. Gachot and J.-M. Tarascon, J. Electrochem. Soc., 2018, 165, A1222 CrossRef CAS.
- L. Madec, V. Gabaudan, G. Gachot, L. Stievano, L. Monconduit and H. Martinez, ACS Appl. Mater. Interfaces, 2018, 10, 34116–34122 CrossRef CAS.
Footnote |
| † Electronic supplementary information (ESI) available. See DOI: 10.1039/d0ta08851j |
| This journal is © The Royal Society of Chemistry 2020 |