 Open Access Article
Creative Commons Attribution 3.0 Unported Licence
Freestanding interconnected nanocluster textiles for efficient oxygen evolution reaction†
Shougo
Higashi
 *,
Takashi
Tachikawa
,
Keiichiro
Oh-ishi
,
Keisuke
Shigetoh
,
Kensuke
Takechi
and
Atsushi
Beniya

Toyota Central R&D Laboratories, Inc., 41-1 Nagakute, Aichi 480-1192, Japan. E-mail: shigashi@mosk.tytlabs.co.jp
First published on 24th September 2020
Abstract
Nanocatalysts have high surface area-to-volume ratios, which are beneficial for minimizing material usage and achieving high catalytic activity. However, preparing a catalyst layer that consists of nanoparticles, involves several costly steps and requires a well-controlled and safe production line. Herein, we report the fabrication of a free-standing support-free textile catalyst comprised of randomly oriented rutile IrO2 crystalline clusters with diameters in the range 1–3 nm, which are connected through dense crystalline domain boundaries. This textile catalyst can be prepared by combining two industrially established techniques, sputtering and electrospinning, which neither require an environmentally controlled costly synthesis, cleaning, and customized collecting processes for nanomaterials, nor highly engineered transferring processes to prepare the catalyst layer. By tuning the curvature of templated water-soluble polymer nanofibers, the highest mass activity and turnover frequency of the oxygen evolution reaction (OER) were achieved for non-doped or pure IrO2. The high OER activity was attributed to the presence of thermodynamically unstable surfaces, which hold large numbers of undercoordinated Ir atoms.
Introduction
Low-cost and efficient systems for the mass production of H2 are required as alternatives to fossil fuel-based systems.2 Proton exchange membrane (PEM) water electrolysis is a promising technique, since it can overcome most of the disadvantages of alkaline electrolysis4 and can directly produce high-pressure H2 gas (<2 MPa) from pure water.6 However, the acidity of the membrane surface, which comes into direct contact with the catalyst, limits the choices of catalysts to expensive noble metals such as Pt, RuO2, and IrO2. For large-scale H2 production, decreasing the amount of catalyst used and lowering the synthesis and processing costs is extremely important, especially for IrO2, which is the best catalyst in terms of both activity and stability in oxygen evolution reactions (OERs) under acidic conditions.8The mass loading of the catalyst, which directly affects the cost of the PEM electrolysis system, can be reduced without reducing the total catalyst surface area by downsizing the catalyst to the nanoscale, wherein numerous atoms are exposed on the surface relative to the mass.9,11 However, the fabrication of a catalyst layer consisting of powdery nanomaterials on a PEM is tedious, as it involves synthesis, repetitive collection and cleaning of the synthesized nanomaterials, and a decal process wherein the catalyst ink (a mixture of nanomaterials, organic solvent, and binder) is coated and dried on a chemically resistive sheet to avoid damaging the PEM via contact with organic solvents, followed by hot-pressing for transfer onto the PEM.13 These processes require specialist knowledge and skills in chemistry and engineering (Fig. 1a). Furthermore, nanomaterials must be processed on costly, environmentally controlled production lines, which are critical for large-scale production.16 Therefore, a simple, safe, and low-cost process for mass production on the nanoscale is urgently required.
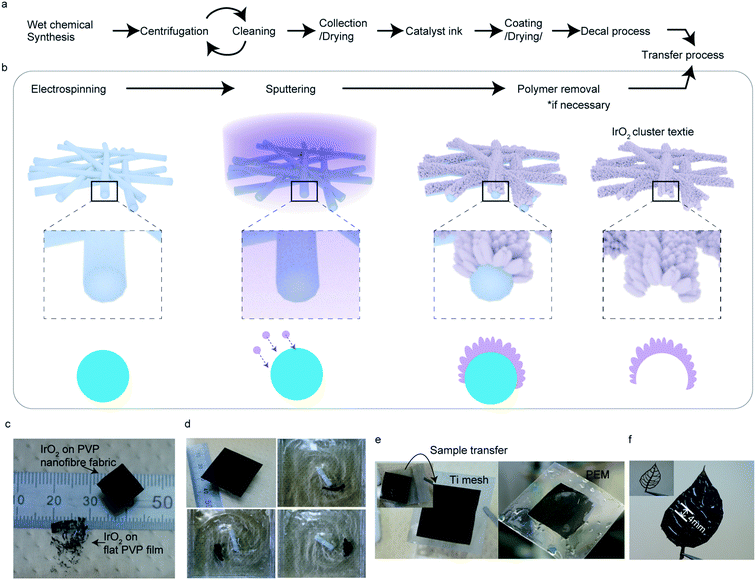 | ||
| Fig. 1 Fabrication of a freestanding interconnected nanocluster textile. A preparation process of the catalyst layer via conventional nanomaterial (a) and proposed nanocluster textile (b). The nano-curvature of the ultrafine polymer fiber textile surface was utilized to realize the gap opening between the nanoclusters and columns for a high surface area-to-volume ratio. (c) IrO2 formed on a PVP nanofiber textile and on flat film after immersion into water for PVP removal (see also ESI Fig. 6,† which exhibits a similar result in Pt film and Pt nanocluster textile). (d) IrO2 nanocluster textile being stirred at 200 rpm. (e and f) IrO2 scooped up from water using a Ti mesh and a proton exchange membrane (PEM, e) and a leaf-shaped mesh made of polyimide (f) for transferring. The catalyst textiles shown in (d) have dimensions of 30 × 30 mm2. | ||
Thin-film nanostructured catalysts, especially those prepared by physical vapor deposition (PVD) techniques such as sputtering, are attractive alternatives to nanomaterials, since they are processed in closed vacuum systems and can therefore lower the risk of worker exposure to nanomaterials. A high areal OER activity of ∼1.51–1.53 V @ 10 mA cm−2vs. reversible hydrogen electrode (RHE) in an acidic solution of 0.5 M H2SO4 was obtained for a 100 nm thick, flat IrOx/SrIrO2 thin-film catalyst prepared by pulsed laser deposition.17 PVD offers significantly better accuracy, compared to pulsed laser deposition, in terms of deposition and product reproducibility; however, the fabricated film must be transferred onto an appropriate substrate as a catalyst layer. Hence, the current challenge for the nanostructured film catalysts is to establish an industrially viable means of transferring the fabricated film.
This report presents a promising nanomaterial fabrication method that can yield a transferrable, freestanding, support-free textile composed of interconnected nanoclusters made of metals and metal oxides through a safe, dry process. The method we propose involves sputtering the catalyst onto the nano-curved surface of a water-soluble electro-spun polymer nanofiber textile to form arrays of catalyst nanoclusters connected to each other on the surface, which forms characteristic radially-grown columns further. The boundary between the columns increased as the diameter of the templated fiber decreased. In this study, we prepare the non-doped or pure IrO2 catalyst textile with this method and demonstrate a high-surface-area-to-volume ratio comparable to the cutting-edge powdery IrO2 nanoparticle based catalysts and the highest specific activity and turnover frequency (TOF) among the values noted for pure IrO2 catalysts; TOF quantifies how many molecules evolve per second for each site at a specific overpotential and it is the most intrinsic metric for catalysis.8 Furthermore, we investigate the catalytic active sites using transmission electron microscopy (TEM), X-ray photoelectron spectroscopy (XPS), and synchrotron radiation X-ray absorption spectroscopy (XAS) analyses, and thereby discover a strong correlation between the TOF and the number of surface-adsorbed hydroxyl species (OH*). Our high resolution TEM analyses and structure modelling reveal that the unprecedentedly high OER activity for IrO2 originated from the extended large surface area and the presence of numerous undercoordinated Ir atoms where OH is preferred to adsorb. Finally, we demonstrate meter scale production of nanostructured textile fabrication with our proposed method.
Experimental
Electrospinning
A solution of polyvinylpyrrolidone (PVP, Mw 1![[thin space (1/6-em)]](https://www.rsc.org/images/entities/char_2009.gif) 300
300![[thin space (1/6-em)]](https://www.rsc.org/images/entities/char_2009.gif) 000; Aldrich Chemical Company, Inc.) was dissolved in both methanol and mixtures of methanol and water at different concentrations. A 6 mL syringe with an inside tip diameter of 0.5 mm was filled with the prepared solution. A constant voltage of 1 kV cm−1 was applied between the tip and a metal foil collector, with an actual distance of 15 cm between them. The solution feed rate was maintained at 1 mL h−1.
000; Aldrich Chemical Company, Inc.) was dissolved in both methanol and mixtures of methanol and water at different concentrations. A 6 mL syringe with an inside tip diameter of 0.5 mm was filled with the prepared solution. A constant voltage of 1 kV cm−1 was applied between the tip and a metal foil collector, with an actual distance of 15 cm between them. The solution feed rate was maintained at 1 mL h−1.
The fiber diameter was tuned by adjusting the electric field, solution feeding rate, and concentration of the polymer and solvent.18 ESI Fig. 1† shows the SEM images of electro-spun mats prepared using 2, 4, 6, 8, 10, and 16 wt% PVP methanol solutions. At high PVP concentrations, thick fibers were observed, with an average diameter of 623 nm for 16 wt% solutions; the fibers became progressively thinner until a PVP concentration of 8 wt% without losing uniformity. Below concentrations of 8 wt%, the fiber became thin; however, a thicker portion appeared with decreasing concentration. At 2 wt%, large micron-sized beads were formed. Between the micron-sized beads, ultrafine fibers approximately 30 nm in diameter were formed. The fiber distributions for these conditions are also summarized in ESI Fig. 1.†
To create a PVP textile with smaller fibers, water was added to the methanol solutions. Using the mixture of methanol and water at different concentrations, the fabrication of textiles with thinner fibers and without beads were achieved (ESI Fig. 2†). We prepared PVP textiles having average diameters of 151, 216, 271, 482, and 623 nm as templates for the cluster textiles. Typical SEM images and fiber distributions for pristine PVP and IrO2 deposited PVP textiles are shown in ESI Fig. 3.†
Sputtering
The IrO2 catalyst textile was prepared by depositing Ir on the as-prepared electro-spun polymer textiles in a vacuum chamber at a base pressure of ∼1.5 × 10 −3 Pa by magnetron radiofrequency (RF) sputtering with a distance from the Ir target to substrate of 5 cm. During sputtering, the pressure was 10 Pa with 5% oxygen and Ar gas flow. Deposition rate was controlled to 0.1 nm s−1. The substrate temperature during deposition was below 50 °C. The Ir loading was calibrated using a quartz crystal microbalance and film thickness measurements using the cross-sectional image of the IrO2 formed on the Si wafer placed next to the electro-spun PVP fiber mat during sputter deposition. This was followed by density analyses of the IrO2 film formed on the Si wafer by X-ray reflectivity (XRR) measurements (ESI Fig. 4†).A 5 mm disk was punched out of the IrO2 catalyst textile and then immersed into water for PVP removal. The IrO2 textile was scooped up and transferred onto a square Ti plate in water, for use as the working electrode in electrochemical measurements. The samples characterized and investigated in this study were annealed at above 300 °C (300 to 450 °C) for 10 min on a hot plate in air to fully dry them and remove PVP since PVP, which is often used as a surface regulating polymer for nanoparticles synthesis, is known to strongly adsorbed onto the surface of catalyst and difficult to remove. Thermal oxidation or annealing in air above 200 °C is the most established method for the removal.19,20 NiO textile was prepared by depositing Ni by magnetron RF sputtering under 5 Pa with 5% oxygen and Ar gas flow with a deposition rate of 0.1 nm s−1.
Characterization
Field-emission scanning electron microscopy (FE-SEM) images were obtained using a S5500 FE-SEM (HITACHI High-Technologies). Transmission electron microscopy (TEM) images were acquired on a JEM 2000-F (JEOL) and JEM-ARM200F (JEOL) at an acceleration voltage of 200 kV. We noticed that long-term exposure to electron beams reduced the IrO2 to Ir (ESI Fig. 5†). Ir did not appear for the short time, about 3 min of electron beam exposure, necessary for acquiring the image. Powder X-ray diffraction was performed on an Ultima IV (Rigaku) with Cu Kα radiation. XPS profiles were obtained on a Quantera (PHI) using monochromatic Al Kα radiation at an electron take-off angle of 45° with a pass energy of 20 eV. XPS peak areas were calculated for Ir 4f in the range of 56−74 eV and normalized to be equal. The O 1s peak areas were then calculated and normalized using the respective factors from the Ir normalization for each sample. O 1s XPS spectra were deconvolved into three peaks as reported in the literature1,21,22 using Voigt function.23 The minimum values of error estimated by the least-squares method for the XPS spectra were explored at 529–531 eV for IrO2, 530–532 eV for OH, and 532–534 eV for adventitious species as has been done in the literatures.1,21,22 XRR was performed on an X'pert Pro MRD (Malvern Panalytical) with Cu Kα radiation. The specific surface areas of the IrO2 catalyst textile was determined by means of the Brunauer–Emmett–Teller method (BET) of krypton adsorption using Autosorb-1(Quantachrome).Electrochemical measurements
We used a coiled Pt wire as the counter electrode and a reversible hydrogen electrode (RHE) as the reference electrode. The Biologic VSP instrument was used for all of the electrochemical measurements. Impedance spectroscopy was performed at an open circuit voltage (OCV). To perform i–R correction, ohmic resistance was estimated by measuring impedance in which we read the value of impedance curve which crosses the real axis (typically the resistance is ∼1 ohm in our experimental setup). Capacitance was estimated by cyclic voltammetry performed between 0.95 V and 1.05 V at different scan rates of 10, 20, 40, 60, 80, and 100 mV s−1. Anodic and cathodic currents at these scan rates were read at 1.0 V. Capacitance correction was performed using Q = CV, where Q is the charge, C is the capacitance and V is the voltage. The mass-normalized activity was estimated using i–R and a capacitance-corrected current at 1.48 V compared to RHE and loaded Ir mass (with an overpotential of η = 0.25 V). The capacitance of the Ti substrate was negligibly small (∼0.035 mF cm−2).Synchrotron XAS measurements
XAS was conducted with fluorescence-transmission geometry at the BL11S2 line of the Aichi Synchrotron Radiation Center. XAS spectra for the 271 nm ID IrO2 textile (100 μg−Ir cm−2) placed on a 20 μm thick Ti foil were measured in the fluorescence mode. In the course of the measurements, XAS spectra for the Pt foil placed behind the sample were simultaneously obtained in the transmission mode and used to align the sample spectra to rule out any systematic energy drifts over the course of the measurements.The X-ray absorption near edge structure (XANES) and extended X-ray absorption fine structure (EXAFS) raw data were processed by the Athena program and an EXAFS analysis was performed using the Artemis program. First, the spectra were normalized to make the difference between the regression equation of pre-edge and post-edge equal to one at E = E0, where the regression equation for pre-edge (E < E0, E0 is the absorption edge determined as a maximum of the first derivative of the XANES spectrum) and post-edge (E > E0) were calculated. Linear equations and third order polynomials were used as regression equations for pre-edge and post-edge, respectively. In order to extract the EXAFS spectra, the background spectrum extracted from the spline fitting of the post-edge region was subtracted from the normalized spectra and multiplied by k3 to magnify the oscillations. A Fourier transform was performed in the range: k = 2.5–11 Å−1.3 In order to calculate the Ir–O bond length and coordination number for the IrO2 textile, the Fourier transform of the k3-weighted EXAFS spectra was fitted by a single-shell model where only the electron scattering from the nearest oxygen atoms was considered. We optimized four individual parameters (N: coordination number, ΔE0: energy shift, R: coordination distance, and σ: Debye–Waller parameter) to minimize the sum of the squares of the residuals between the experimental data and the model equation. The passive electron reduction factor S02 was 0.74 ± 0.15 for the IrO2 pellet and was set at 0.74 for the IrO2 textile sample.
XRR analysis
The amount of Ir in the IrO2 catalyst textiles was calculated from the thickness measured by SEM and the density estimated from the X-ray reflectivity (XRR) curve of the IrO2 films sputtered on bare Si substrates. The film density was estimated from the critical angle (αc), where the total external reflection of the X-rays showed a dip. The Snell–Descartes Law describes the total external critical angle of X-rays as follows:αc = arc![[thin space (1/6-em)]](https://www.rsc.org/images/entities/char_2009.gif) sin(n1/n2); sin(n1/n2); | (1) |
| n = 1 − δ − iβ; | (2) |
 | (3) |
 | (4) |
 | (5) |
ESI Fig. 4a† shows the XRR spectrum and fitting curve of the IrO2 film deposited on Si next to the catalyst textiles during the sputtering. ESI Fig. 4b† shows the corresponding SEM image for thickness measurements. The fitting curves were calculated by using Malvern Panalytical's software package. The calculated density was 4.1 ± 0.2 g cm−3, which is much smaller than that of single-crystalline IrO2 (11.4 g cm−3). The IrO2 surface roughness, IrO2/Si interface roughness, IrO2 thickness, and Si density were also required for the fitting parameters, considering multi-layer reflections.24–26 The IrO2 surface roughness and IrO2/Si interface roughness were derived from the intensity decay at higher angles due to diffuse scattering. The IrO2 thickness and Si density were fixed parameters, obtained from SEM measurements and literature, respectively.
Results and discussion
Material design and scheme of freestanding catalyst textile
Sputtering is a scalable technique widely used for thin-film fabrication in industry, especially for solar cells.27 By adjusting the parameters for sputtering, such as pressure, atmosphere, and distance from the target to substrate, a layer made of small clusters of deposited materials can be achieved, which is suitable for catalysis. However, to use the deposited layer as a catalyst, it must be transferred onto an appropriate substrate, which requires a certain durability. Thus, we used an electrospun, flexible, water-soluble, nanofiber textile as a sputtering substrate. By using the nanoscale curved surface of an electrospun fiber as a sputtering substrate, more spaces between the nanocluster columns were created, exposing more atoms on the flat substrate. Removing the substrate polymer nanofiber further exposed the surface, resulting in better material utilization suitable for catalysts (Fig. 1b).Fig. 1c shows the IrO2 catalyst textile prepared by sputtering Ir under a low-O2 atmosphere onto a polyvinylpyrrolidone (PVP) nanofiber textile with an average diameter of approximately 271 nm (prepared by electrospinning), floating on water and an IrO2 thin film. While an IrO2 thin film with the same mass loading of 100 μg−Ir cm−2 that was formed on a PVP drop-casted, flat film disintegrated when dipped into water, the IrO2 catalyst textile maintained its structure, even under vigorous stirring at 200 rpm (Fig. 1d and ESI Movie 1†). This durability allowed us simply to scoop it up and transfer it onto any desired substrate in water (Fig. 1e), which was beneficial for material characterization using various analytical methods. Although the catalyst textile was comprised of nanoclusters, it maintained its form over an approximately 4 mm gap between the veins of leaf-shaped polyimide (Fig. 1f), which was prepared to analyze the freestanding nature of the catalyst textile. The process, including electro-spinning and magnetron sputtering, required neither the costly environmentally controlled synthesis, cleaning, and collection processes usually necessary for nanomaterials nor highly engineered transfer processes to prepare the catalyst layer (Fig. 1a). Nanomaterials need special care in order to prevent exposure to the environment. Analysis, via TEM, of the rinsing water left after polymer fiber removal from the IrO2 catalyst textile failed to detect any IrO2 nanoparticles. Thus, the IrO2 nanoclusters, whose detailed morphology is given below, were well-attached to each other and formed a very stable structure.
Material characterization
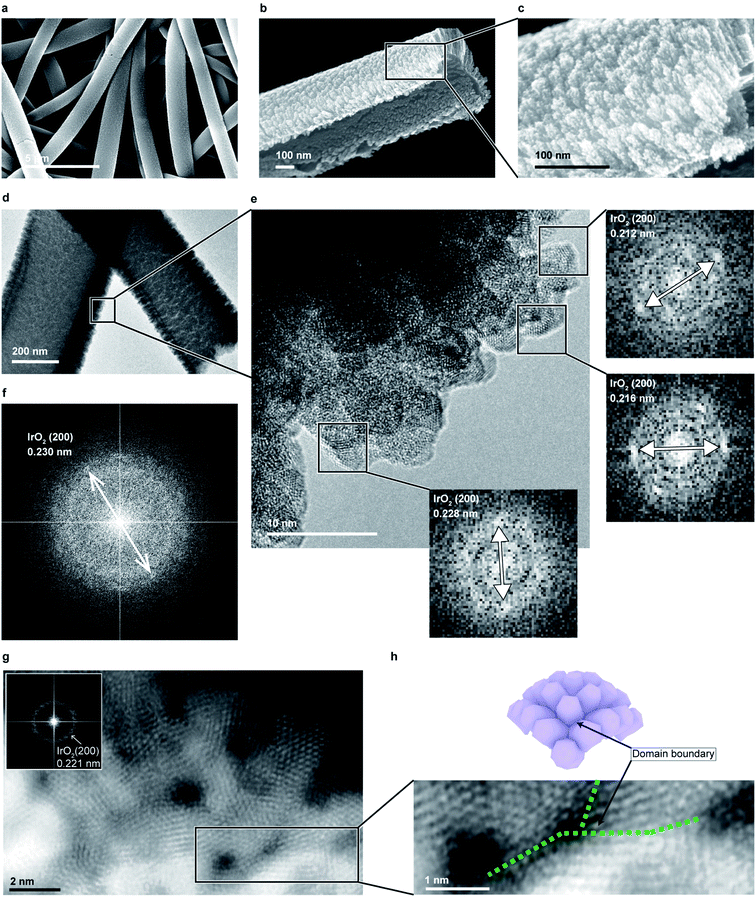
To confirm the formation of an intended nanocluster connected structure, the textile was analyzed by scanning electron microscopy (SEM, Fig. 2a–c). The presence of unique half-cylindrical interconnected fibers with an inner diameter (ID) of ∼270 nm were confirmed, and randomly-oriented, interconnected, rutile–IrO2 nanoclusters were observed on each half-cylindrical fiber surface (Fig. 2d–f). The clusters had diameters of ∼1–3 nm and were interconnected to form radially-grown columns (∼5 nm in diameter, ESI Fig. 7†), exposing large numbers of atoms on their surface, which is favorable for OER. To observe how the nanoclusters were interconnected as well as the detailed atomic structure of the surface, we prepared a low-mass-loading IrO2 catalyst textile (∼10 μg−Ir cm−2, see also Fig. 1b) and analyzed it via TEM (Fig. 2g). Each of the clusters was composed of rutile–IrO2, as also observed for the 100 μg−Ir cm−2 sample (ESI Fig. 8†); the clusters were connected through the domain boundary and were randomly-oriented, demonstrating interconnected nanoclusters with large surface area-to-volume ratios (Fig. 2h). A domain boundary was more clearly observed for the sample annealed at 450 °C for 10 min (ESI Fig. 9†). Similar interconnected cluster textiles were also achieved with pure metals such as Pt (ESI Fig. 10†) and Au (ESI Fig. 11†), and the technique proposed in this paper is scalable and applicable to any materials that can be sputter-deposited.Efficient electrochemical water splitting with IrO2 cluster textiles
The electrochemical properties and OER activities of the IrO2 catalyst textiles transferred onto a Ti substrate were characterized using a cell flooded with 0.5 M H2SO4 as an electrolyte with three electrodes (Fig. 3a, see Experimental). The optimal curvature for opening the gap between clusters for efficient OER was investigated by preparing five different IrO2 catalyst textiles with average IDs of 151, 216, 271, 482, and 623 nm using polymer textiles with different diameters (ESI Fig. 1 and 2†). Prior to the OER measurements, the capacitance of each sample was estimated by cyclic voltammetry cycles between 0.95 and 1.05 V vs. RHE, where the currents do not peak, at different scan rates of 10, 20, 40, 60, 80, and 100 mV s−1 (ESI Fig. 12†).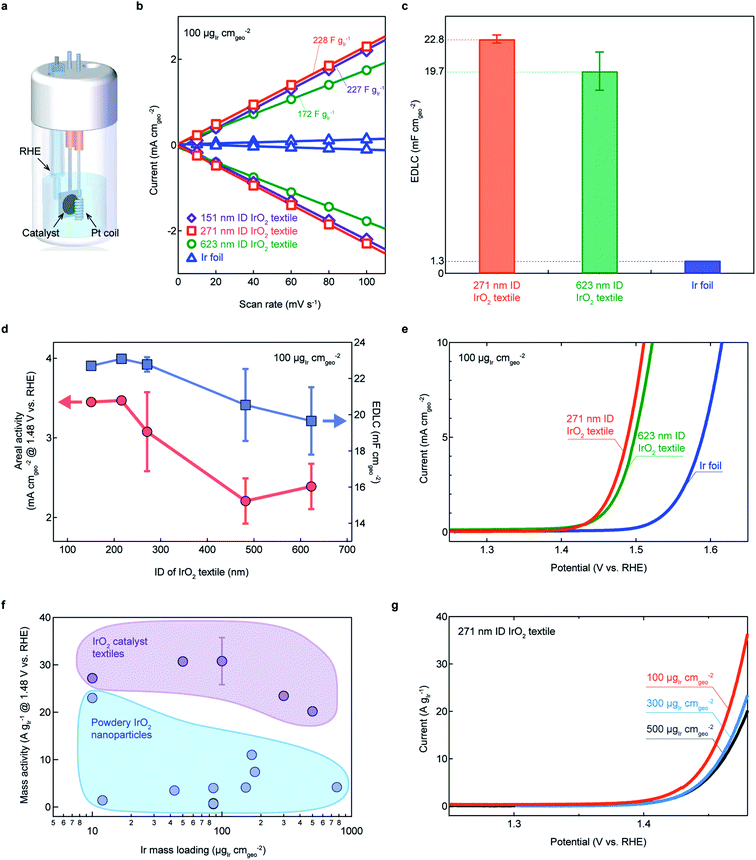 | ||
| Fig. 3 Electrochemical characterization of IrO2 catalyst textiles annealed at 300 °C. (a) Schematic representation of the flooded cell used for all electrochemical measurements, with a Pt coil as a counter electrode, and a working electrode comprising the Ti substrate with the catalyst layer to be investigated. (b) Cathodic and anodic charging currents measured at 1.0 V vs. RHE plotted as a function of scan rate. (c) Geometrical area-normalized capacitances estimated for each sample. (d) Areal activities and EDLCs with respect to the IrO2 textile fiber's inner diameter (IDs: 151, 218, 271, 482, and 623 nm) and the corresponding linear sweep voltammograms (LSVs) (e). (f) Mass activity of the prepared IrO2 textiles in this study and of powdery IrO2 reported in the literature for different mass loadings.1,3,5,7,10,12,14,15 These values are summarized in ESI Table 2.† (g) LSVs of the prepared IrO2 textiles of (f). EDLC values for all of the samples are shown in ESI Fig. 12.† The error bars in (c), (d), and (f) are determined by the standard deviation. | ||
Mass-normalized electric double-layer capacitor (EDLC) values of the textiles were all greater than 200 F g−Ir−1, except the values of average IDs of 623 nm textiles (Fig. 3b), having higher EDLC values than that of IrO2 prepared by a highly engineered wet chemical method (ESI Tables 1 and 2†). This was further confirmed by the BET measurement that the surface area of IrO2 textile was more than 1.6 times higher than the reported IrO2 nanocatalysts (ESI Fig. 13†). The areal EDLCs were approximately 20 times higher than those of commercial flat Ir foils (Fig. 3c). Interestingly, the EDLC values increased as the fiber ID decreased, and saturated for an ID of approximately 271 nm, suggesting that the curvature of the 271 nm-ID fiber was sufficient for opening the space between the nanocluster columns (Fig. 3d). Linear sweep voltammograms (LSVs) displayed that the areal OER activity also increased (Fig. 3e and ESI Fig. 14†). The high EDLC values demonstrated that textiles with interconnected nanoclusters and large surface area-to-volume ratios are potential alternatives to conventional powdery nanomaterials and non-transferable nanostructured films. High mass activities are a widely used metric for OER catalysis, which we defined as the current at 1.48 V normalized by the Ir mass loading. Superior high mass activities, compared to previously reported values, were achieved with the IrO2 cluster textiles over different mass loadings (Fig. 3f and g). The highest TOF of 0.159 s−1 @ 1.48 V was achieved for a 271 nm ID with 100 μg−Ir cm−2. This high TOF demonstrates the superiority of this proposed sample preparation method. The performances in this section were compared to data from the literature for pure IrO2 nanoparticles for which no scaffolding or alloying techniques were applied. ESI Tables 1 and 2† summarizes all the electrochemical values discussed herein. In terms of mass activity and specific activity, IrO2 textiles showed high values. These unprecedentedly high values motivated our investigation of the structure and electronic states of pure IrO2.
Origin of the high OER activity
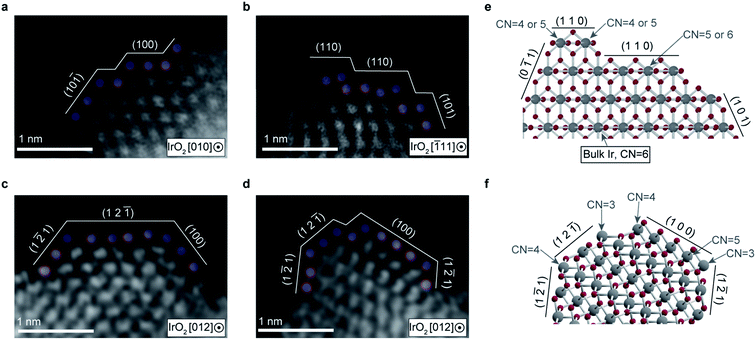
To determine the origin of the high TOF, we analyzed the atomic arrangement on the cluster surfaces with atomic resolution via high-angle annular dark-field scanning transmission electron microscopy (HAADF-STEM) (Fig. 4a–d). We observed fine steps and terraces with short widths on the cluster, as well as the presence of a large number of low coordinated (CN) Ir atoms, as schematically illustrated in Fig. 4e and f. The atomic arrangement of the topmost Ir atoms was locally distorted. The exposed surface planes holding undercoordinated Ir atoms were determined to be the (100), (12![[1 with combining macron]](https://www.rsc.org/images/entities/char_0031_0304.gif) ), and (1
), and (1![[2 with combining macron]](https://www.rsc.org/images/entities/char_0032_0304.gif) 1) planes, as ascertained from the atomic distances and arrangements. These planes are thermodynamically less stable than the most stable surface plane (110). A presence of low CN atoms in unstable surface planes (CN < 6 of bulk Ir atom) has been theoretically demonstrated,28 which is consistent with our STEM-HAADF observations. This could be an origin of high TOF, which we discuss further below.
1) planes, as ascertained from the atomic distances and arrangements. These planes are thermodynamically less stable than the most stable surface plane (110). A presence of low CN atoms in unstable surface planes (CN < 6 of bulk Ir atom) has been theoretically demonstrated,28 which is consistent with our STEM-HAADF observations. This could be an origin of high TOF, which we discuss further below.
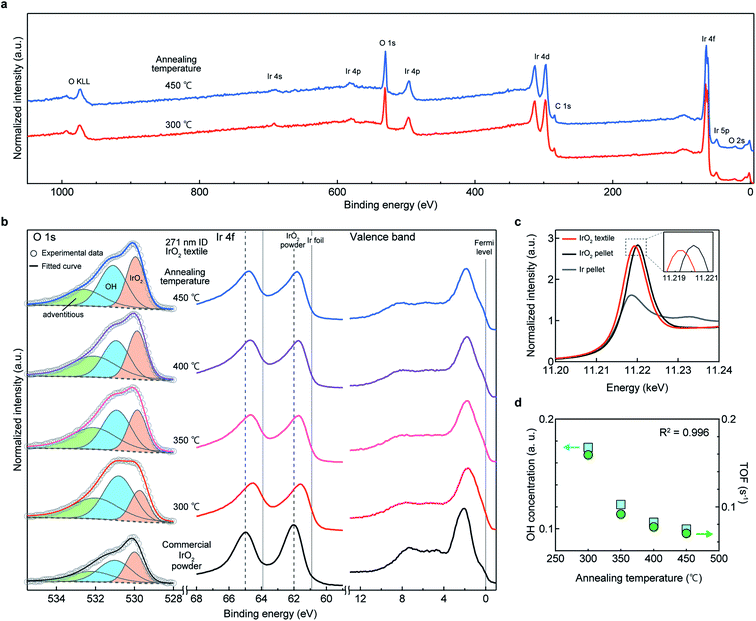
Surface chemical state and catalytic active sites
XPS analysis was performed to analyze the surface chemical state of the IrO2 textiles, in order to determine the origin of high TOF. Typical wide-range XPS profiles for the IrO2 catalyst textiles are shown in Fig. 5a, which confirm that there were no specific peaks, other than those for Ir and O, and the carbon 1s peak at 285 eV, which often appears in XPS.29 On the surface of the IrO2 catalyst textile, we obtained a stronger OH signal than that of commercial IrO2 (ref. 23) (Fig. 5b), indicating a high surface concentration of dissociative adsorption sites for atmospheric water, which enabled the spillover of H and OH. The Ir 4f peak for the IrO2 catalyst textile was located between the peaks for Ir foil and rutile-IrO2,1,21–23,30 suggesting that Ir was reduced (see also ESI Fig. 15†). Rutile IrO2 is metallic; thus, the tail of the peak for the IrO2 catalyst textile should cross the Fermi level.30 This was confirmed via observation. To investigate the chemical states further, we performed synchrotron X-ray absorption spectroscopy (XAS) (Fig. 5c and ESI Fig. 16†). The peak position of the white line and its intensity were between the peaks for Ir foil and commercial IrO2 powder, suggesting that Ir had reduced slightly, which is consistent with the XPS results. In ESI Fig. 16a and b,†k3-weighted X-ray absorption fine structures (XAFS) and the corresponding Fourier transform spectra are shown, respectively. Very similar XAFS results were obtained for the IrO2 catalyst textile and for commercial IrO2. Our analyses confirmed no significant difference in the local structure for the majority of the Ir atoms (ESI Table 3†).Upon annealing, the OH concentration decreased and oxidization of Ir occurred (ESI Fig. 15†). Notably, the TOF showed a trend similar to that of the OH concentration and an excellent R2 value of 0.996 was achieved (Fig. 5d and LSV curves for annealed samples are shown in ESI Fig. 17†). If the quality of the surface did not change upon heat treatment, the TOF would have stayed the same, but it decreased and exhibited a strong correlation to the OH concentration. This finding suggests that the higher the concentration of OH groups is, the higher is the TOF, and OH preferentially adsorbed on active sites.
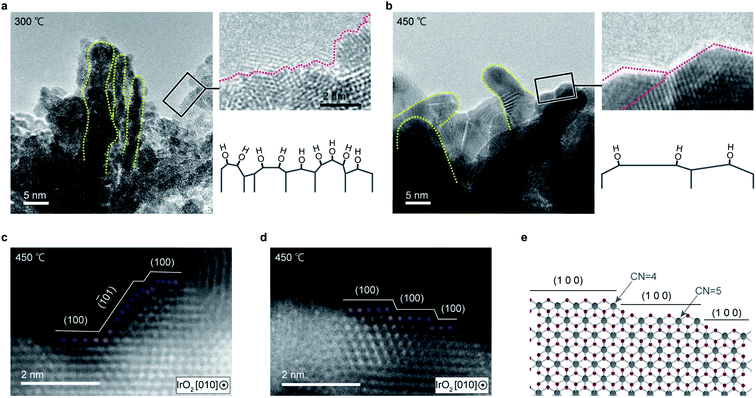
To identify these highly active sites, the cluster morphology was further analyzed via TEM. Fig. 6 compares the TEM images of IrO2 textiles annealed at different temperatures. Notably, although the heat treatment temperature was moderately low (around the Tammann temperature of ∼414 °C, which is a half of the melting point of IrO2 in the Kelvin scale, where the atoms acquire an sufficient energy to be mobile), cluster coarsening occurred due to greater atom mobility at high temperatures, and the number of edge sites at which the undercoordinated atoms were located decreased. Although a distortion was observed around the edge for the sample annealed at 450 °C, no unstable planes were observed, unlike the sample annealed at 300 °C.28 These results suggest that OH is preferentially adsorbed by the undercoordinated Ir atoms. The reason why catalysts which have high OER activity exhibit high OH concentration was not clear previously1,22,31 (ESI Fig. 18†), but our detailed high resolution TEM analyses revealed that the number of edge sites is correlated with the OH concentration. Accordingly, the overall high OER activity observed for the IrO2 textile is attributable to the large number of active sites due to the formation of few-nanometer clusters by sputtering and the presence of undercoordinated Ir atoms.
Stability is an important parameter for electrochemical catalysts8 and IrO2 is recognized as one of the most stable catalysts in acidic solution. We prepared IrO2 textiles with an ID of 271 nm and different mass loadings (100, 300, and 500 μg cm−2) and performed stability testing. The testing utilized LSV to measure the potential required to reach 10 mA cmgeo−2 or the areal activity, followed by a voltage measurement under a constant current of 10 mA cm−2 for 2 h, repeated four times (ESI Fig. 19a†). This consecutive measurement, which we refer here as LSV-CC, was employed to minimize the effect of O2 bubbles produced during OER, which can cover the catalyst surface and increase resistance. As a control sample, a flat rutile-IrO2 film deposited on a Ti plate was used32 and compared in ESI Fig. 19b.† Stable operation with a negligible overpotential increase of about 0.03 V over a 2 h time period was reported for the pure IrO2 catalyst.33 This stability was confirmed for both the IrO2 flat film and the catalyst textiles, but the IrO2 catalyst textiles demonstrated very high areal and mass activities. To be practically useful, OER catalysts should fall within the region surrounded by blue dashed lines34 (the overpotential should be below 0.35 V for the first and second LSV33) in ESI Fig. 19b.† The IrO2 catalyst textiles are within this useful region. In ESI Fig. 19c,† we also compared the stability of the IrO2 catalyst textiles to the stability of state-of-the art polyoxometalate electrocatalysts.35 The IrO2 textile displayed a similar or slightly better stability curve which indicate an improved stability was achieved. There was no significant difference between the catalysts before and after the OER stability test, but we observed a slight increase in S concentration for the catalyst after OER operation (ESI Fig. 20†). We note that the observation of S in the catalyst after the OER does not immediately means that S poisoned the catalyst surface because IrOx/SrIrO3 catalyst tested in 0.5 M H2SO4 has been reported to be stable,17 and further study is required to clarify the reason for catalyst activity degradation observed at stability test.
Meter-size large-scale nanocluster textiles for industrial applications
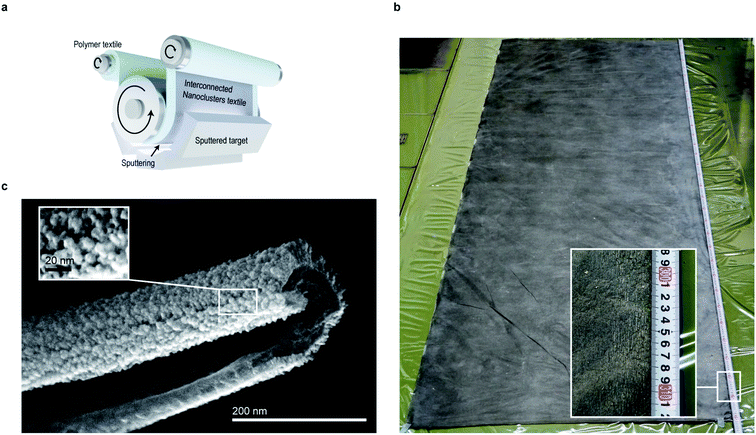
Finally, we discuss the scalability of our proposed method and the preparation of meter-size large-scale textiles, combining electrospinning and sputtering techniques for commercial scale applications.36 We have shown that 3 × 3 cm laboratory scale textile can be fabricated (Fig. 1), but it should be possible to fabricate larger textiles with electrospinning and sputtering techniques because meter-scale non-woven polymer textiles are often industrially fabricated by electrospinning and roll-based consecutive sputtering techniques for large area sputtering, as schematically illustrated in Fig. 7a, or using a chamber equipped with a large size target (one-batch process) is available. Thus, with an industrial-scale sputtering chamber, we fabricated a ∼1 × 3 m textile made of nickel oxide (Fig. 7b). Typical SEM images of nickel oxide textiles are also shown (Fig. 7c), which exhibit a similar structure to Pt, Au, and IrO2 nanocluster textiles, demonstrating the viability of this proposed fabrication method for commercial-scale practical applications.Conclusions
In this study, we demonstrated the fabrication of freestanding textiles made of interconnected IrO2 nanoclusters. Although the method we employed is simpler than that of conventional wet chemical synthesis, a superior OER activity was achieved for the IrO2 nanocluster textile. An important part of the process is exploiting the curvature of the nanofiber in order to expose a large number of atoms. We found that the small curvature provided by polymer nanofibers with a diameter of 271 nm, which can be easily accessed using a conventional electrospinning method, maximizes the exposed surface area. Based on detailed TEM observations and XPS surface chemical analyses, the higher OER activity, as compared to those of the IrO2 nanoparticles prepared via wet chemical methods, was attributed to the large surface area and the appearance of a thermodynamically less stable surface plane, which holds a large number of undercoordinated atoms on its surface. In the course of the investigation of origin of high activity, we also found that the lower the annealing temperature, the higher the catalytic activity in the temperature region of 300 to 450 °C. To investigate if this trend maintains below 300 °C, and further improvements in catalytic activity seen, a simple method that completely removes PVP, a templated polymer used for preparing IrO2 nanoclusters textile, from the catalyst surface other than heat treatment will be necessary.Large-scale production of nanomaterials at low costs was envisioned a decade ago. However, its implementation has been limited due to the alarming negative effects of powdery nanomaterials on the environment and human health, as well as the required complicated synthesis procedures. Nanocluster textiles constitute a new class of nanomaterials that are formed as single pieces and have the potential to serve as alternatives to conventional powdery nanomaterials; this is because various kinds of nanocluster textiles can be produced on a large scale using simple and well-established manufacturing techniques that enable a low-cost, safe, and clean fabrication, as we have shown in this report. In addition, the freestanding nature of these textiles facilitates sample characterization, as demonstrated in this study. We emphasize that this study focused on pure IrO2 for an OER catalyst because of its high stability against acidic conditions; however, the method proposed herein is not limited to pure IrO2 and various kinds of catalyst textiles made of nanoclusters can be easily prepared. We expect the proposed nanocluster textile fabrication method to boost the development of practical and efficient nanocatalysts, such as OER catalysts.
Conflicts of interest
There are no conflicts to declare.Acknowledgements
We thank H. Sato for designing the electrochemical cell and H. Kato and S. Takeda for offering technical assistance during the XAS measurements, and Y. Goto for BET measurements. We acknowledge T. Asaka for his insightful comments regarding the TEM image analysis. This work was supported by the Nanotechnology Platform Program of MEXT, grant number JPMXP09S19NI0034.Notes and references
- D. F. Abbott, D. Lebedev, K. Waltar, M. Povia, M. Nachtegaal, E. Fabbri, C. Copéret and T. J. Schmidt, Chem. Mater., 2016, 28, 6591–6604 Search PubMed.
- M. R. Shaner, H. A. Atwater, N. S. Lewis and E. W. McFarland, Energy Environ. Sci., 2016, 9, 2354–2371 Search PubMed.
- H. N. Nong, T. Reier, H.-S. Oh, M. Gliech, P. Paciok, T. H. T. Vu, D. Teschner, M. Heggen, V. Petkov, R. Schlögl, T. Jones and P. Strasser, Nat Catal, 2018, 1, 841–851 Search PubMed.
- M. Carmo, D. L. Fritz, J. Mergel and D. Stolten, Int. J. Hydrog. Energy, 2013, 38, 4901–4934 Search PubMed.
- F. Godínez-Salomón, L. Albiter, S. M. Alia, B. S. Pivovar, L. E. Camacho-Forero, P. B. Balbuena, R. Mendoza-Cruz, M. J. Arellano-Jimenez and C. P. Rhodes, ACS Catal., 2018, 8, 10498–10520 Search PubMed.
- K. H. J. Genovese, M. Paster and J. Turner, NREL/BK-6A1-46676, https://www.hydrogen.energy.gov/pdfs/46676.pdf, 2009 Search PubMed.
- X. Liang, L. Shi, Y. Liu, H. Chen, R. Si, W. Yan, Q. Zhang, G.-D. Li, L. Yang and X. Zou, Angew. Chem. Int. Ed., 2019, 58, 7631–7635 Search PubMed.
- J. Kibsgaard and I. Chorkendorff, Nat. Energy, 2019, 4, 430–433 Search PubMed.
- U. Heiz and U. Landman, Nanocatalysis, Springer, Berlin, 2007 Search PubMed.
- L. Yang, G. Yu, X. Ai, W. Yan, H. Duan, W. Chen, X. Li, T. Wang, C. Zhang, X. Huang, J.-S. Chen and X. Zou, Nat. Commun., 2018, 9, 5236 Search PubMed.
- A. Beniya and S. Higashi, Nat. Catal., 2019, 2, 590–602 Search PubMed.
- Y. Lee, J. Suntivich, K. J. May, E. E. Perry and Y. Shao-Horn, J. Phys. Chem. Lett., 2012, 3, 399–404 Search PubMed.
- S. Shahgaldi, I. Alaefour, G. Unsworth and X. Li, Int. J. Hydrog. Energy, 2017, 42, 11813–11822 Search PubMed.
- J. Chen, P. Cui, G. Zhao, K. Rui, M. Lao, Y. Chen, X. Zheng, Y. Jiang, H. Pan, S. X. Dou and W. Sun, Angew. Chem. Int. Ed., 2019, 58, 12540–12544 Search PubMed.
- B. M. Tackett, W. Sheng, S. Kattel, S. Yao, B. Yan, K. A. Kuttiyiel, Q. Wu and J. G. Chen, ACS Catal., 2018, 8, 2615–2621 Search PubMed.
- B. Fadeel, L. Farcal, B. Hardy, S. Vázquez-Campos, D. Hristozov, A. Marcomini, I. Lynch, E. Valsami-Jones, H. Alenius and K. Savolainen, Nat. Nanotechnol., 2018, 13, 537–543 Search PubMed.
- L. C. Seitz, C. F. Dickens, K. Nishio, Y. Hikita, J. Montoya, A. Doyle, C. Kirk, A. Vojvodic, H. Y. Hwang, J. K. Norskov and T. F. Jaramillo, Science, 2016, 353, 1011–1014 Search PubMed.
- Q. Yang, Z. Li, Y. Hong, Y. Zhao, S. Qiu, C. Wang and Y. Wei, J. Polym. Sci., Part B: Polym. Phys., 2004, 42, 3721–3726 Search PubMed.
- R. M. Rioux, H. Song, M. Grass, S. Habas, K. Niesz, J. D. Hoefelmeyer, P. Yang and G. A. Somorjai, Top. Catal., 2006, 39, 167–174 Search PubMed.
- M. Luo, Y. Hong, W. Yao, C. Huang, Q. Xu and Q. Wu, J. Mater. Chem. A, 2015, 3, 2770–2775 Search PubMed.
- T. Reier, D. Teschner, T. Lunkenbein, A. Bergmann, S. Selve, R. Kraehnert, R. Schlogl and P. Strasser, J. Electrochem. Soc., 2014, 161, F876–F882 Search PubMed.
- T. Reier, Z. Pawolek, S. Cherevko, M. Bruns, T. Jones, D. Teschner, S. Selve, A. Bergmann, H. N. Nong, R. Schlögl, K. J. J. Mayrhofer and P. Strasser, J. Am. Chem. Soc., 2015, 137, 13031–13040 Search PubMed.
- H. G. Sanchez Casalongue, M. L. Ng, S. Kaya, D. Friebel, H. Ogasawara and A. Nilsson, Angew. Chem. Int. Ed., 2014, 53, 7169–7172 Search PubMed.
- I. Kojima and B. Li, Rigaku J., 1999, 16, 31–42 Search PubMed.
- L. G. Parratt, Phys. Rev., 1954, 95, 359–369 Search PubMed.
- S. K. Sinha, E. B. Sirota, S. Garoff and H. B. Stanley, Phys. Rev. B, 1988, 38, 2297–2311 Search PubMed.
- J. Wang, S. Li, J. Cai, B. Shen, Y. Ren and G. Qin, J. Alloys Compd., 2013, 552, 418–422 Search PubMed.
- O. Matz and M. Calatayud, J. Phys. Chem. C, 2017, 121, 13135–13143 Search PubMed.
- T. L. Barr and S. Seal, J. Vac. Sci. Technol., A, 1995, 13, 1239–1246 Search PubMed.
- J. M. Kahk, C. G. Poll, F. E. Oropeza, J. M. Ablett, D. Céolin, J. P. Rueff, S. Agrestini, Y. Utsumi, K. D. Tsuei, Y. F. Liao, F. Borgatti, G. Panaccione, A. Regoutz, R. G. Egdell, B. J. Morgan, D. O. Scanlon and D. J. Payne, Phys. Rev. Lett., 2014, 112 Search PubMed.
- R. D. L. Smith, B. Sporinova, R. D. Fagan, S. Trudel and C. P. Berlinguette, Chem. Mater., 2014, 26, 1654–1659 Search PubMed.
- T. Tachikawa, A. Beniya, K. Shigetoh and S. Higashi, Catal. Lett., 2020, 150, 1976–1984 Search PubMed.
- C. C. L. McCrory, S. Jung, J. C. Peters and T. F. Jaramillo, J. Am. Chem. Soc., 2013, 135, 16977–16987 Search PubMed.
- J. Lim, D. Park, S. S. Jeon, C.-W. Roh, J. Choi, D. Yoon, M. Park, H. Jung and H. Lee, Adv. Funct. Mater., 2018, 28, 1704796 Search PubMed.
- M. Blasco-Ahicart, J. Soriano-López, J. J. Carbó, J. M. Poblet and J. R. Galan-Mascaros, Nat. Chem., 2018, 10, 24–30 Search PubMed.
- L. A. King, M. A. Hubert, C. Capuano, J. Manco, N. Danilovic, E. Valle, T. R. Hellstern, K. Ayers and T. F. Jaramillo, Nat. Nanotechnol., 2019, 14, 1071–1074 Search PubMed.
Footnote |
| † Electronic supplementary information (ESI) available: Supplementary Tables 1–4, supplementary Fig. 1–15 and supplementary references. See DOI: 10.1039/d0ta07707k |
| This journal is © The Royal Society of Chemistry 2020 |

