
 Open Access Article
 This Open Access Article is licensed under a
 Creative Commons Attribution 3.0 Unported Licence
Enhancing surface oxygen retention through theory-guided doping selection in Li1−xNiO2 for next-generation lithium-ion batteries†
Jianli
Cheng
 ab,
Linqin
Mu
c,
Chunyang
Wang
d,
Zhijie
Yang
c,
Huolin L.
Xin
d,
Feng
Lin
c and
Kristin A.
Persson
*ab
ab,
Linqin
Mu
c,
Chunyang
Wang
d,
Zhijie
Yang
c,
Huolin L.
Xin
d,
Feng
Lin
c and
Kristin A.
Persson
*ab
aDepartment of Materials Science and Engineering, University of California, Berkeley, CA 94720-1760, USA
bEnergy Storage and Distributed Resources Division, Lawrence Berkeley National Laboratory, Berkeley, CA 94720, USA. E-mail: kapersson@lbl.gov
cDepartment of Chemistry, Virginia Tech, Blacksburg, Virginia 24061, USA
dDepartment of Physics and Astronomy, University of California, Irvine, CA 92697, USA
First published on 23rd October 2020
Abstract
Layered lithium metal oxides have become the cathode of choice for state-of-the-art Li-ion batteries (LIBs), particularly those with high Ni content. However, the Ni-rich cathode materials suffer from extensive oxygen evolution, which contributes to the formation of surface rocksalt phases as well as thermal instability. Using first-principles calculations, we systematically evaluate the effectiveness of doping elements to enhance surface oxygen retention of Li1−xNiO2. The evaluation process includes (i) choosing the most stable surface facet from the perspective of equilibrium surface stability analysis of as-synthesized LiNiO2, (ii) determining the preferable atomic site and segregation behavior for each dopant, and (iii) evaluating the surface oxygen retention ability of doped-Li1−xNiO2 (0.25 ≤ x ≤ 1) compared to the pristine material. We also discuss and rationalize the ability of these elements to enhance surface oxygen retention based on local environment descriptors such as dopant–oxygen bond strength. Overall, W, Sb, Ta and Ti are predicted as the most promising surface dopants due to their strong oxygen bonds and robust surface segregation behavior. Finally, Sb-doped LiNiO2 is synthesized and shown to present a surface enrichment of Sb and a significantly improved electrochemical performance, comparing with pristine LiNiO2. This work provides a generic approach that can lead to the greatly enhanced stabilization of all high-energy cathode materials, particularly the high Ni and low Co oxides.
1 Introduction
Rechargeable lithium-ion batteries (LIBs) have become the ubiquitous power source for portable electronic devices, electric vehicles and grid electricity storage. Since its successful commercialization in 1990, LiCoO2 is the cathode of choice for the majority of commercial LIBs because of its relatively high theoretical capacity (∼270 mA h g−1), high operating voltage (∼3.6 V vs. Li+/Li) and superb energy content per unit volume.1 However, commercial LiCoO2 only exhibits about 60% of its theoretical capacity due to its low thermal stability and capacity fade at high states-of-charge (V > 4.35 V).2 In addition, the potential risks associated with the supply of Co due to geographical concentration of mining and refining3 have shifted the research focus to other layered transition metal oxide cathodes, specifically Li[Ni1−x−yCoxAly]O2 (NCA) and Li[Ni1−x−yCoxMny]O2 (NCM).4,5To increase specific discharge capacity and total residual lithium content, the fraction of Co, Mn and Al in NCA and NCM has been progressively replaced by Ni.6 LiNiO2, one end member of the NCA and NCM series, exhibits the highest theoretical capacity (275 mA h g−1) and same crystal structure with LiCoO2. However, widespread application of Ni-rich cathode materials is limited by their insufficient capacity retention and thermal stability.6,7 Li1−xNiO2 undergoes several reversible phase transitions during Li+ intercalation and deintercalation,8–10 whereof one, at high state-of-charge (V > 4.1 V), leads to a significant shrinkage of the material in the c-axis direction11 and hence incurs extensive structural damage from the repeated lattice contraction and expansion.12 The developed cracks expose fresh cathode surface area to the electrolyte, thus accelerating detrimental, parasitic reactions.13,14 Furthermore, higher Ni-content cathodes experience increased oxygen evolution, such that, for example, the amount of oxygen release was found to increase from 18.4% to 51.7% when Ni concentration was increased from 1/3 to 0.85.6 Surface oxygen loss also correlates with surface cation densification and phase transformation from the pristine rhombohedral phase into an ionically insulating rock salt phase.15 A thermal gravimetric analysis revealed that the phase transformation can occur at a lower temperature with increasing Ni content in NCMs.6 In addition, while we anticipate bulk cathode oxygen migration to be sluggish, it is possible for surface oxygen vacancies to migrate into the interior of the cathode particle; triggered by the outward diffusion of oxidized oxygen ion.16 Previous work has shown that the injection of surface oxygen vacancies into the bulk lattice of the cathode leads to severe structural degradation and cycling instability of Li-ion cathode materials.17 As a result, surface oxygen evolution not only jeopardizes the thermal stability and safety of the LIBs, but also deteriorates capacity retention.18–20 Therefore, improved stabilization of Ni-rich cathode surfaces is indispensable to achieve a highly stable and safe performance of future, high-energy-density LIBs.
A popular strategy to stabilize Ni-rich cathodes is by elemental doping. Depending on the selected dopant, the functionalities proposed to explain the improved cycling performance include:
(1) Reduced phase transitions and improved mechanical property: Na,21 K,22 Rb,23 Mg,24 Y,25 Al,26 Zr,27 Ga,28 B,29 Ti30
(2) Reduced cation mixing: Na,21 K,22 Rb,23 Zr,27 V31
(3) Decreased oxygen loss or increased thermal stability: W,32 Y,25 Sb,33 Ti,34 Zr,35
(4) Reduced acid-mediated parasitic reactions: Mo,36 W,32 F37.
Generally, the impact of dopants is challenging to de-convolute, as any addition to the active electrode material affect its operational performance in a multitude of ways at different length scales depending on how the dopant incorporates. Ionic conductivity, electronic state, redox compensation, bulk as well as surface phase transformation behavior and mechanical properties are all potentially influenced and inter-related. In this respect, first-principles modeling can provide a highly useful tool, as many such processes can be interrogated separately, as a function of dopant chemistry and site preference. For example, Liang et al. studied Al, Ga, Mg, Si, Ti, V and Zr doping effects on phase instability, Li–Ni exchange, Ni segregation, lattice distortion and oxygen evolution of Ni-rich LiNi1−2yCoyMnyO2 (y ≤ 0.1) cathode.38 They suggested a comprehensive mitigation strategy for Ni-rich layered cathodes is unlikely to be satisfied by a single dopant species and hence proposed a multicomponent-doping strategy to improve the electrochemical performance of NCMs. Similarly, Min et al. suggested Al doping to suppress oxygen evolution and Mg doping to prevent cation disordering in LiNi0.8Co0.1Mn0.1O2.39 In addition, oxygen evolution in LiNiO2 was found to be thermodynamically favorable but kinetically hindered in the bulk phase.40 However, under-coordinated surface regions are likely to facilitate oxygen kinetics, promote oxygen loss and result in the formation of surface densified phases.41
Recently, Shin et al.42 applied a high-throughput computational screening to guide the selection of the promising cation dopant to alleviate surface oxygen loss in Li-rich, Mn-rich cathode and identified Os, Sb, Ru, Ir and Ta as the top candidates.42 Ta was experimentally validated to improve electrochemical performance and oxygen retention. Following a similar procedure, in this work we systematically evaluate the effectiveness of doping elements to enhance surface oxygen retention of Li1−xNiO2, which shares many structural and electrochemical properties with Ni-rich NCA and NCM materials. Based on previously proposed dopants for Ni-rich layered oxide cathode materials, we select eight doping candidates: W6+, Sb5+, Ta5+, Ti4+, Y3+, Al3+, B3+ and Mg2+. The evaluation process includes (i) identifying the most stable surface facet of LiNiO2, (ii) determining the preferable atomic site and segregation behavior for each dopant, and (iii) evaluating the surface oxygen retention of doped-Li1−xNiO2 as compared to the pristine, un-doped state. The results of the screening process are presented together with an investigation and discussion of the dopant's impact on the local oxygen bonding environment and its relevance to macroscopic oxygen release. To validate the theoretical predictions, we choose Sb as the exemplary dopant and synthesize Sb-doped LiNiO2. We quantitatively determine Sb segregation behavior in Sb-doped LiNiO2 and investigate its influence on electrochemical performance compared with pristine LiNiO2. Our proposed evaluation process is poised to resolve some longstanding challenges in fundamental doping effects on battery materials.
2 Methods
2.1 Computational details
All density functional theory (DFT) electronic structure calculations were performed using the Vienna Ab initio Simulation Package (VASP),43,44 with the Projector Augmented Wave (PAW) potentials.45 The spin-polarized Generalized Gradient Approximation (GGA) parametrized by the Perdew–Burke–Ernzerhof (PBE)46 employing the on-site Coulomb interaction approach (GGA+U) was used for the exchange–correlation functional with U = 5.8 and 6.2 eV for Ti 3d and Ni 3d orbitals, respectively.47,48 The cutoff energy for the plane wave expansion was set to 500 eV with a k-point density of 64 Å−3 of reciprocal cell. All structures were optimized using a force convergence criterion of 0.03 eV Å−1 and an electronic self-consistency convergence criterion of less than 10−6 eV. To determine the surface stability and the most dominant surface facet, we select six different surface facets: (104), (110), (100) for nonpolar surfaces and (003), (101), (012) for polar surfaces, based on previous theoretical and experimental studies.29,49,50 The nonpolar surfaces correspond to the type 1 surface according to Tasker's classification scheme51 with overall zero charge for each plane. The polar surfaces consist of a stacking sequence of charged planes with a nonzero net dipole moment. Thus, to avoid an artificial electric field across the slabs, we adopt the symmetric slab models with two identical surfaces. All slab structures were terminated by a 15 Å vacuum interval to prevent spurious surface interactions resulting from the periodic boundary condition.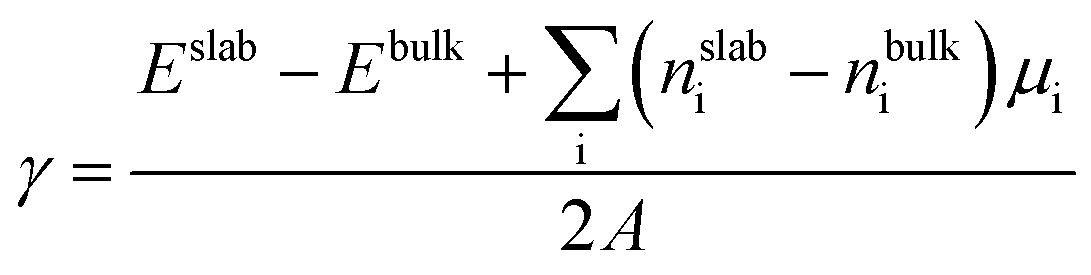 | (1) |
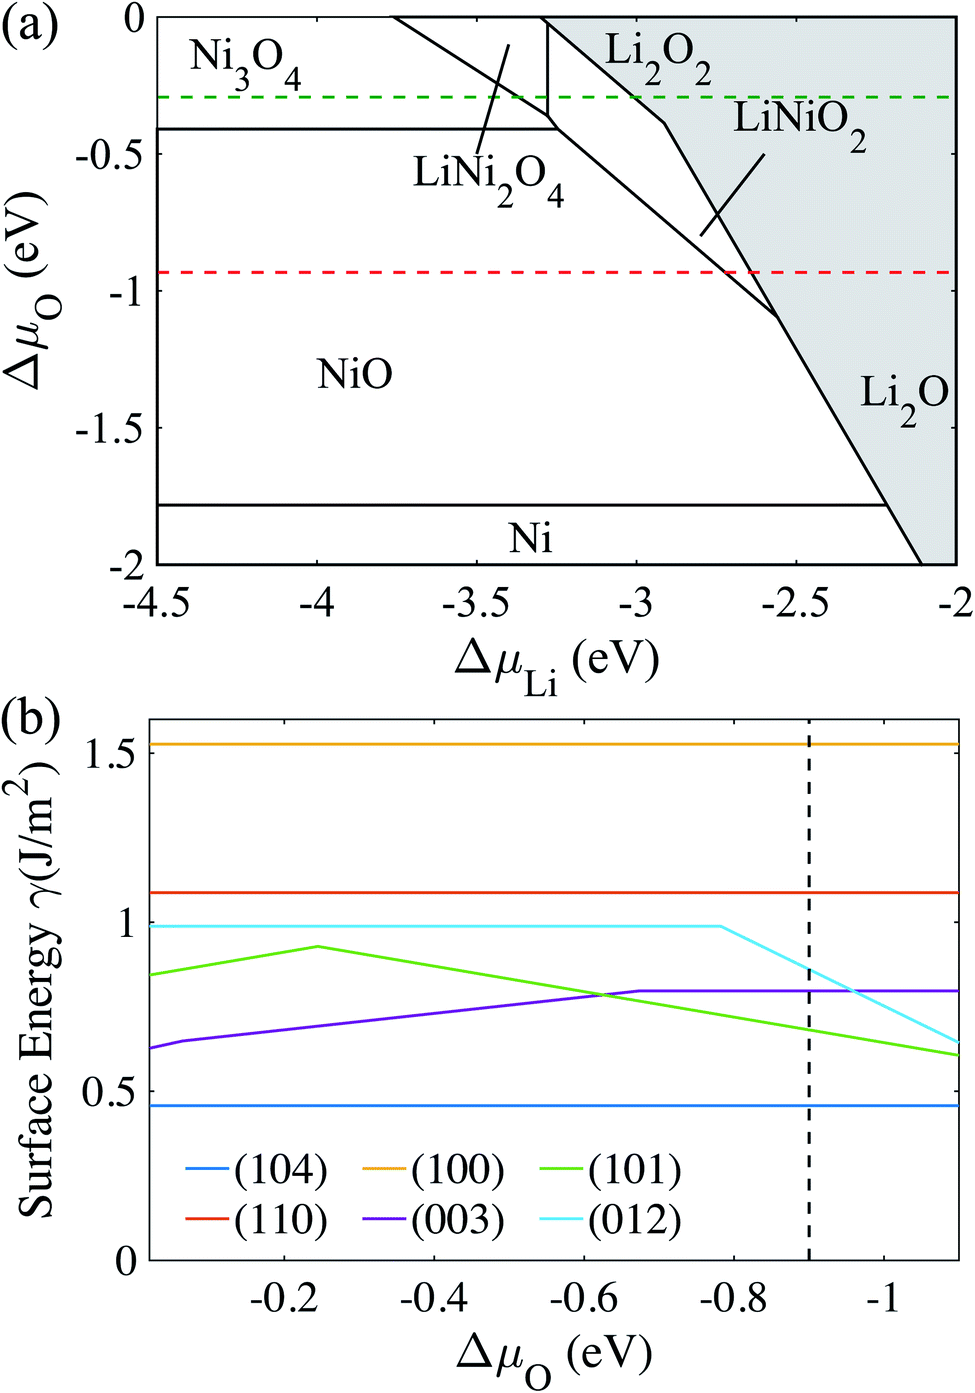 | ||
| Fig. 1 (a) Phase diagram of Li–Ni–O system as a function of changes in Li and O chemical potentials showing the stability region of bulk LiNiO2. The red dashed line represents a synthesis environment at 600 °C and p(O2) = 1 atm. The green dashed line represents an electrochemical testing environment at 30 °C and p(O2) = 0.2 atm. (b) Surface energy of LiNiO2 of six low-index surfaces as a function of oxygen chemical potential. The black dashed line corresponds to ΔμO at 600 °C and p(O2) = 1 atm. | ||
| ΔENi–Lif = EslabNi − EslabLi + μNi − μLi | (2) |
| ΔE = Eslabi − Eslabc | (3) |
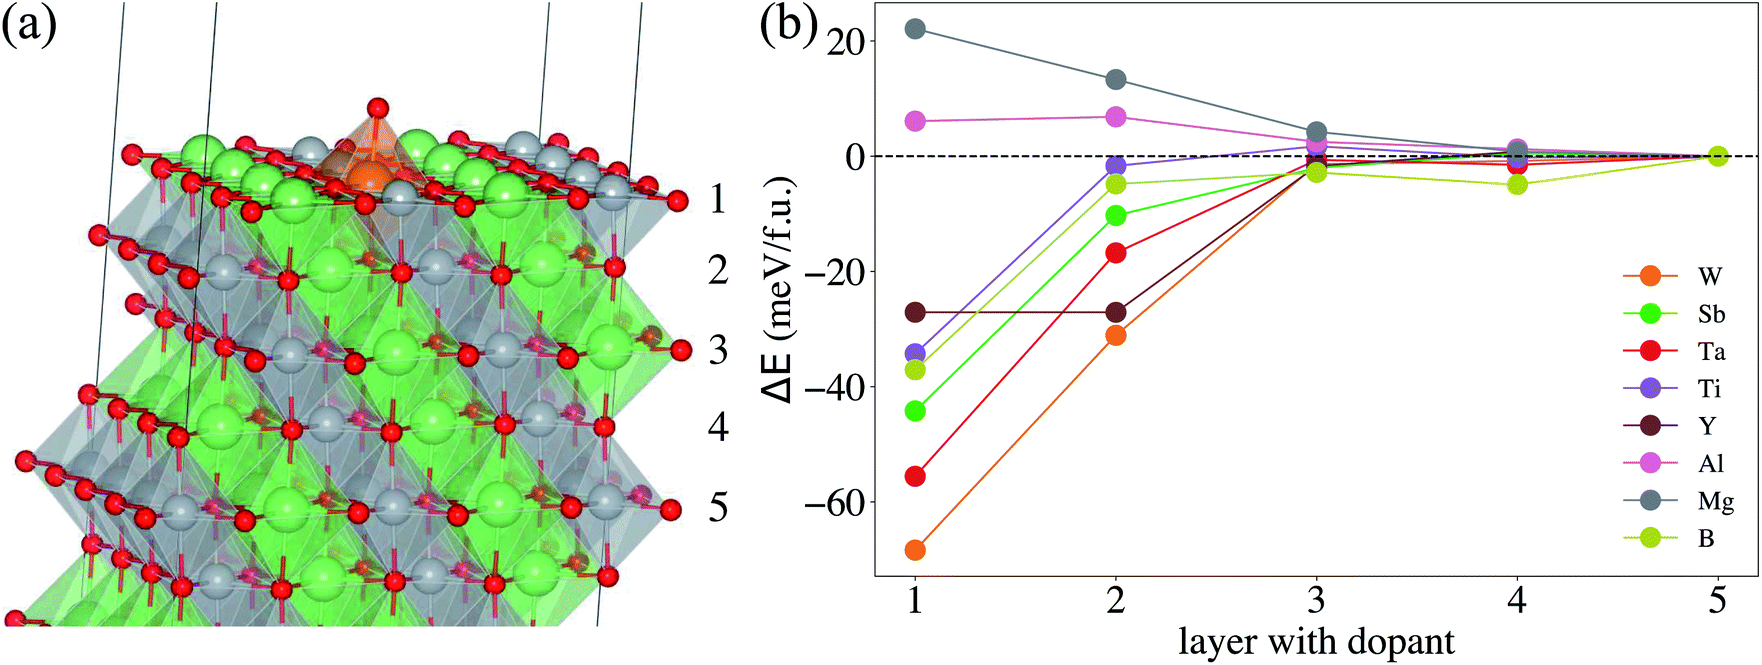 | ||
| Fig. 2 (a) A slab model of a doped-LiNiO2 (104) facet. The orange atom represents the doping element and substitutes one Ni atom in the 1st, 2nd, 3rd, 4th, and 5th layer. An oxygen atom is added on the 1st layer (color code: green for Li atom, grey for Ni atom, red for O atom and orange for dopant). (b) The total energy difference (ΔE) between the dopant in the ith layer and 5th layer as a function of the dopant position in doped-LiNiO2. | ||
The configuration of the dopant in the center layer corresponds to a dilute dopant substituted in the bulk LiNiO2. Thus, ΔE captures the segregation preference, as a function of the dopant position in LiNiO2. To compare ΔE to competing thermodynamic drivers towards chemical homogeneity, we estimate the temperature, above which entropic effects dominate:
ΔG = ΔH − TΔS = ΔH + TNkB(xM![[thin space (1/6-em)]](https://www.rsc.org/images/entities/char_2009.gif) lnxM + xNilnxNi) = 0 lnxM + xNilnxNi) = 0 | (4) |
 | (5) |
2.2 Experimental details
LiNiO2. We prepared the transition metal solution using 0.1 mol NiSO4·6H2O dissolved in 100 mL DI water. The base solution and the transition metal solution were simultaneously pumped into the starting solution at a rate around 2 mL min−1 with the continuous stir at 55 °C under N2 protection. The pH value in the reaction solution was maintained around 11.0 ± 0.2 by carefully tuning the pumping rate of base solution. The precipitate (i.e., hydroxide precursor) was aged for three hours, collected, washed, and filtered with DI water and IPA. Then, the hydroxide precursor was obtained after dried in vacuum oven overnight at 105 °C. Finally, we thoroughly mixed LiOH with the hydroxide precursor at the ratio of 1
:1 and calcined it at 460 °C for 2 h and then at 675 °C for 6 h with oxygen following (1 L min−1) to obtain the final product.
Sb-doped LiNiO2 (2% Sb). We first prepared the transition metal solution using 0.098 mol NiSO4·6H2O dissolved in 100 mL DI water. The base solution and the transition metal solution were simultaneously pumped into the starting solution at a rate around 2 mL min−1 with continuous stirring at 55 °C under N2 protection. The pH value in the reaction solution was maintained around 11.0 ± 0.2 by carefully tuning the pumping rate of the base solution. The SbCl3 powder (0.002 mol) was poured into the reaction after the transition metal solution was ran out. The precipitate (i.e., hydroxide precursor) was aged for three hours, collected, washed, and filtered with DI water and IPA. Then, the hydroxide precursor was obtained after dried in vacuum oven overnight at 105 °C. Finally, we thoroughly mixed LiOH with the hydroxide precursor at the ratio of 1
:1.06 and calcined it at 460 °C for 2 h and then at 675 °C for 6 h with oxygen following (1 L min−1) to obtain the final product.
Sb-doped LiNiO2 (1% Sb). The synthesis protocol was the same as the Sb-doped LiNiO2 (2% Sb), except for the use of 0.099 mol NiSO4·6H2O for the transition metal solution and 0.001 mol SbCl3 powder.
:7 in weight plus 2% VC as the additive) as the electrolyte, and Whatman glass fibers as the separator. The coin cells were evaluated on a Wuhan LANHE battery testing system at room temperature (23 °C).
3 Results and discussion
3.1 Computational prediction
To determine the chemical potential limits of bulk LiNiO2 stability, we use formation energies from the Materials Project database, as of January 2019.48Fig. 1a shows the as-obtained phase diagram of Li–Ni–O as a function of the chemical potentials of lithium μLi and oxygen μO, where Li metal (ELi) is chosen as reference state and hence ΔμLi = μLi − ELi, and ΔμLi is directly proportional to the Li|Li+ voltage. ΔμO is a function of pressure and temperature. The red dashed line at ΔμO = −0.93 eV in Fig. 1a represents an equilibrium synthesis environment of LiNiO2 at 600 °C and p(O2) = 1 atm (ref. 52) and the green dashed line at ΔμO = −0.29 eV represents an electrochemical testing environment at 30 °C and p(O2) = 0.2 atm. Hence we can approximate synthesis and electrochemical testing conditions in terms of ΔμO. The methodology of the ΔμO calculation from temperature and pressure is described in the ESI.† As illustrated in Fig. 1a, the LiNiO2 phase is found to be thermodynamically stable for −1.10 < ΔμO < −0.02 eV, −3.28 < ΔμLi < −2.56 eV. Under oxidizing conditions, the conversion to the spinel Ni3O4 and cation-mixed spinel LiNi2O4 defines the lower limit of ΔμLi (upper limit voltage against Li/Li+). Overlithiation results in the formation of Li2O in reducing environments and Li2O2 under oxidizing conditions, defining the upper limit of ΔμLi (lower limit voltage against Li/Li+).We determine the majority surface(s) of LiNiO2 by exploring different surface facets and their respective surface energies (γ), as a function of termination. Fig. 1b shows the calculated γ represented as the lowest energy for six surface facets as a function of ΔμO, where the relevant range of ΔμO is obtained from the stability range of LiNiO2 (see Fig. 1a). We find that the (104) facet exhibits the lowest γ for the entire range of ΔμO, thus presents – by far – the most stable surface facet, which is in agreement with previous studies.29,49 The black dashed line in Fig. 1b corresponds to an equilibrium synthesis environment of LiNiO2 with (104) as the dominant surface facet. Therefore, in the following slab models and surface dopant investigation, we choose (104) surface facet to represent the Li1−xNiO2 surface chemistry and structure.
To determine the preferable surface dopant location in LiNiO2, as a function of dopant species, we calculate the doping formation energy difference (ΔENi–Lif) between doping at the surface Ni- vs. the surface Li-site. Fig. S2a† shows that for all the considered dopants, ΔENi–Lif is negative for the entire range of ΔμLi, which implies that the candidate doping elements prefer to occupy the Ni-site. The occupations of Ni sites by Sb, Ti, Al and Mg in LiNiO2 also agree well with the experimental results.33,60,61 Graphing ΔENi–Lif of each dopant against its corresponding ionic radius (see Fig. S2b†) clearly shows that a dopant with ionic radius similar to that of Ni3+ tends to exhibit more negative ΔENi–Lif and hence more favorably occupy the Ni-site. Next, we analyze the dopant segregation behavior in doped-LiNiO2 by calculating the total energy difference (ΔE) between the configurations of the dopant in the ith layer and in the center layer (see Fig. 2b). We find that W, Sb, Ta, Ti, Y, and B exhibit a strong tendency to segregate to the surface region, while Mg prefers to reside in the bulk. In addition, as observed in Fig. 2b, ΔE quickly converges to zero for all the dopants as a function of distance from the surface, which indicates that our models properly differentiate between the surface and bulk regions.
Using eqn (4) we estimate the lowest |ΔE| that overcomes the entropic term towards chemical homogeneity. LiNiO2 synthesis temperature is around 600 °C,52 which corresponds to |ΔE| = ΔH = 7 meV per f.u. This implies that |ΔE| should be higher than 7 meV per f.u. to ensure that dopant surface segregation is thermodynamically driven at the relevant synthesis temperature. For example, a surface segregation energy of 20 meV per f.u. requires a synthesis temperature over 2500 K to thermodynamically drive homogeneous distribution. Therefore, we conclude that |ΔE| is sufficient to drive surface dopant segregation behavior for W, Sb, Ta, Ti, Y, and B. Mg and Al both prefer the bulk but Al exhibits such a weak preference that we expect Al to uniformly distribute at relevant synthesis temperatures. Weigel et al. reported that in cation-doped Ni-rich NCM cathodes, the layer near the surface tends to be slightly richer in dopants than that of the bulk,62 which corresponds well with the segregation phenomena of most of our considered dopants. Moreover, in Mg/Ti co-doped LiNiO2, Ti exhibits a surface enrichment, whereas Mg distributes homogeneously.60 Our calculations provide thermodynamic rationale for the observed homogeneous bulk Mg distribution. Furthermore, previous experimental work also supports the expectation of homogeneous distribution of Al doping in LiNiO2.63
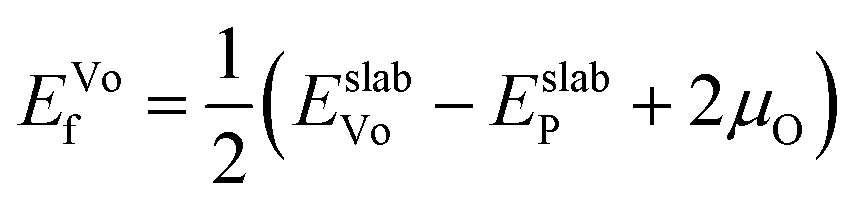
After identifying (104) as the most stable surface facet, the Ni-site as the preferable dopant location and relevant dopant segregation behaviors, we examine the correlation between surface oxygen evolution and state of charge by incrementally removing Li from pristine- and doped-LiNiO2. Fig. S3† depicts the delithiated Li1−xNiO2 slab structures with (104) surface facet, following the most stable Li decorations in bulk Li1−xNiO2 as obtained in ref. 55. The oxygen release energy (EVof) at each delithiated state was calculated following eqn (5) as described in Section 2 and is presented in Fig. 3a. As expected from previous work,42EVof decreases rapidly upon delithiation: for fully lithiated LiNiO2, the averaged EVof is 1.27 eV; when 75% Li is deintercalated, the averaged EVof becomes 0.15 eV, i.e., oxygen release becomes much more favorable at high charge state. Moreover, oxygen evolution is further enhanced at higher temperatures and higher states of charge (e.g., x ≥ 0.75).64–66 It is worth pointing out that the calculated oxygen release energy presented here is based on an air environment, with T = 30 °C and p(O2) = 0.2 atm. At an elevated temperature of 200 °C, the averaged EVof reduces to −0.05 eV, i.e., oxygen is predicted to spontaneously release from the surface for pristine Li0.25NiO2 and lower Li contents. This is consistent with the observed oxygen evolution related weight loss as measured by thermogravimetry around 200 °C in Li1−xNiO2 (x ≥ 0.8).64
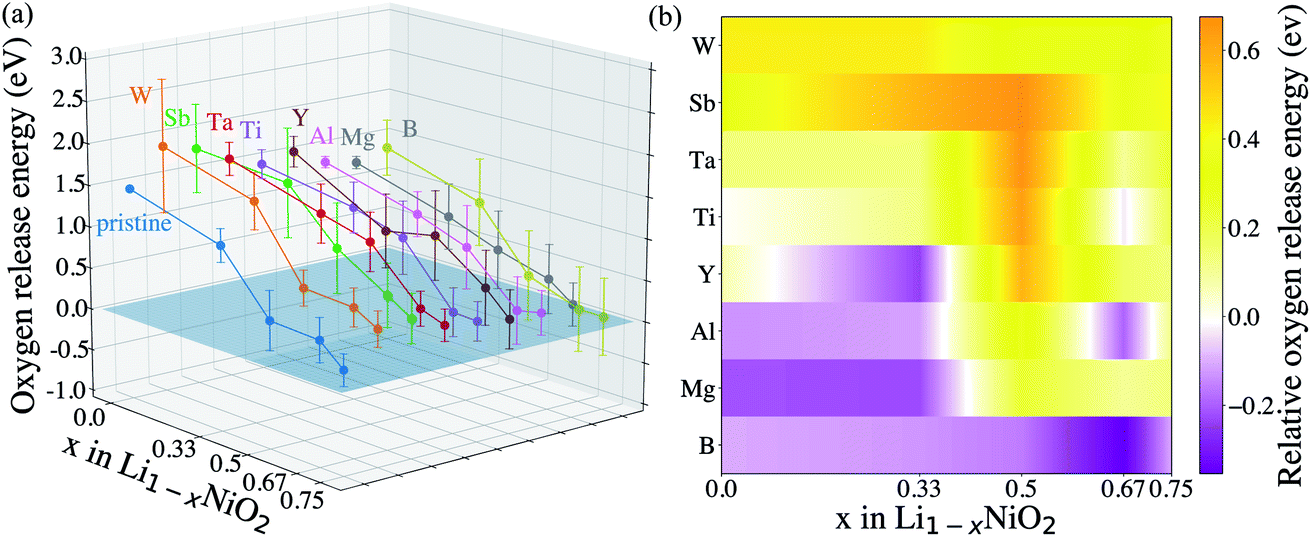 | ||
| Fig. 3 (a) Oxygen release energy as a function of Li content of the pristine- and doped-LiNiO2, based on an air environment, with T = 30 °C and p(O2) = 0.2 atm. (b) The relative surface oxygen release energies of doped LiNiO2 with respect to the pristine phase. An orange color indicates an improved oxygen retention, while a purple color indicates a reduced oxygen retention as compared to the pristine phase. | ||
To analyze the impact of surface dopants in Li1−xNiO2, we compare EVof for doped-LiNiO2 with that of the pristine, un-doped material. Fig. 3 shows that W, Sb, Ta and Ti effectively increase EVof as compared to pristine-Li1−xNiO2. For example, at 75% Li extraction, the averaged EVof of W-, Sb-, Ta- and Ti-doped Li0.25NiO2 are 0.53, 0.56, 0.40 and 0.35 eV, respectively. On the other hand, the averaged EVof of surface B-doped Li0.25NiO2 is calculated at 0.05 eV, which indicates that surface boron actually stimulates surface oxygen evolution and therefore is expected to deteriorate the thermal stability of Li1−xNiO2, as related to surface oxygen loss. To better illustrate the dopant effectiveness against surface oxygen loss, we calculate the relative oxygen release energy (ΔEVof) following the procedure in Section 2. Fig. 3b shows that W-, Sb-, Ta- and Ti-doped Li1−xNiO2 exhibit higher EVof values than pristine-Li1−xNiO2 for all Li content (e.g. states of charge), which implies that W, Sb, Ta, and Ti are all expected to enhance surface oxygen retention of Li1−xNiO2, with W and Sb are predicted to be the most promising dopants. Interestingly, Ta was recently theoretically predicted and experimentally validated to alleviate oxygen evolution from Li-excess, Mn-rich layered cathode materials.42 In addition, Ti has been found to improve the oxygen stability at the surface of Ti-doped LiNi0.8Mn0.1Co0.1O2 and improve its electrochemical performance.34
Finally, we attempt to elucidate the chemical and structural features that give rise to these dopants' effectiveness (or lack thereof) towards mitigating surface oxygen loss. In this context, a common misconception is to equate a bulk Gibbs free energy of oxide formation with the ability to limit oxygen loss. For example, it is often thought that Al2O3 would strongly retain oxygen because the Gibbs free energy of the oxidation reaction Al + O2 → Al2O3 is one of the lowest found in the Ellingham diagrams.67 However, the Al oxidation reaction is not just a measure of the cohesive energy between Al3+ and O2− in the corundum structure; it's main contribution is the actual oxidation, e.g. that Al is an extremely electropositive metal. In Li-ion cathodes, Al (and similarly electropositive elements) stay firmly oxidized, and hence this contribution it not relevant. Similarly, we do not expect any global structural features (e.g. the cohesive energy of the corundum structure) to play a significant role here, as the dopant and the oxygen are not arranged in their preferred long-range structural arrangement. Hence, we turn to local chemical descriptors such as the chemical bonding between the dopant and the oxygen and perform a quantitative calculation of the bond strength. Fig. 4 shows the calculated projected crystal orbital Hamiltonian population (pCOHP) plots for Sb–O, Ta–O, Ti–O and B–O interactions for doped LiNiO2, which are averaged over all the surface dopant–oxygen contacts up to 3.0 Å in length. Bonding (stabilizing) contributions to the electronic band structure are represented by positive –pCOHP, whereas antibonding ones are represented by negative –pCOHP. From the pCOHP illustrated in Fig. 4 we find that Sb–O, Ta–O and Ti–O interactions are mostly bonding while the B–O bonding is characterized by massive antibonding interactions. Thus, the bond strength of Sb–O, Ta–O and Ti–O pairs are interpreted as significantly stronger than that of B–O. To obtain a more quantitative estimate of the bond strength, we integrate pCOHP (ICOHP) over the relevant energy range of −20 eV to 0. Fig. 5a shows the variance of ICOHP as a function of doping elements, along with their corresponding averaged EVof values of fully lithiated LiNiO2. We find a clear correlation between higher EVof and a larger –ICOHP value, which implies that a stronger dopant–oxygen bond leads to a better surface oxygen retention. Fig. 5a also illustrates a dopant with a higher oxidation state, such as W6+, generally exhibit stronger dopant–oxygen bond (higher –ICOHP) and better oxygen retention ability (higher EVof) than dopants of lower oxidation states, such as Mg2+. This trend can be rationalized by the change of electrostatic interaction between dopant and oxygen, as W6+ is expected to exhibit a stronger electrostatic interaction with oxygen. Similarly, we expect other dopants with high oxidation states, such as Mo6+ and Nb5+, as promising candidates for alleviating surface oxygen loss from LiNiO2. Indeed, both Mo6+ and Nb5+ have been confirmed to form a strong dopant–oxygen bond and reduce oxygen evolution in Li-rich layered cathode materials.68,69 Further insight into the nature of the dopant–oxygen bonding is provided by an electron localization function (ELF) analysis, as shown in Fig. 5b. The green regions between the Sb and O atoms correspond to shared electrons, which signifies strong electron hybridization and increased covalency. On the other hand, the Mg-doped surface layer displays weak hybridization and covalency between the Mg and oxygen ions. Furthermore, Sb5+ exhibits a stronger electrostatic bond with oxygen as compared with the lower-valent Mg2+. Therefore, a higher valence, as well as a higher degree of electrons sharing and covalency between Sb and O leads to a stronger Sb–O bond and mitigation of the surface oxygen evolution. Similar oxygen retention due to electron hybridization was also reported in Os-doped Li2MnO3 structures.42
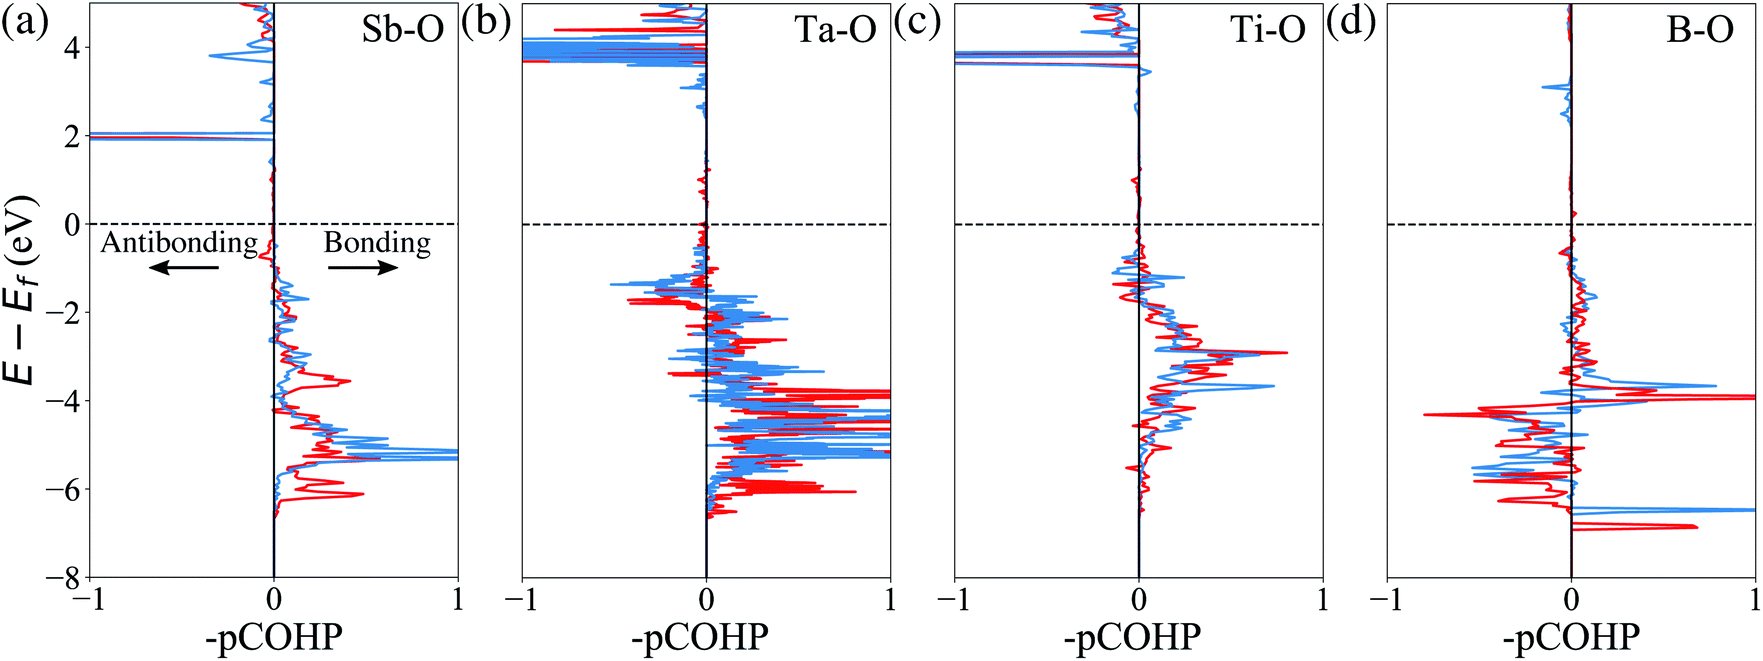 | ||
| Fig. 4 Calculated pCOHP of (a) Sb–O, (b) Ta–O, (c) Ti–O, and (d) B–O chemical bonds as reconstructed from electronic wavefunctions. A horizontal dashed line represents the Fermi level Ef, which is set to the valence band maximum (VBM). Blue and red curves represent spin-up and spin-down, respectively. | ||
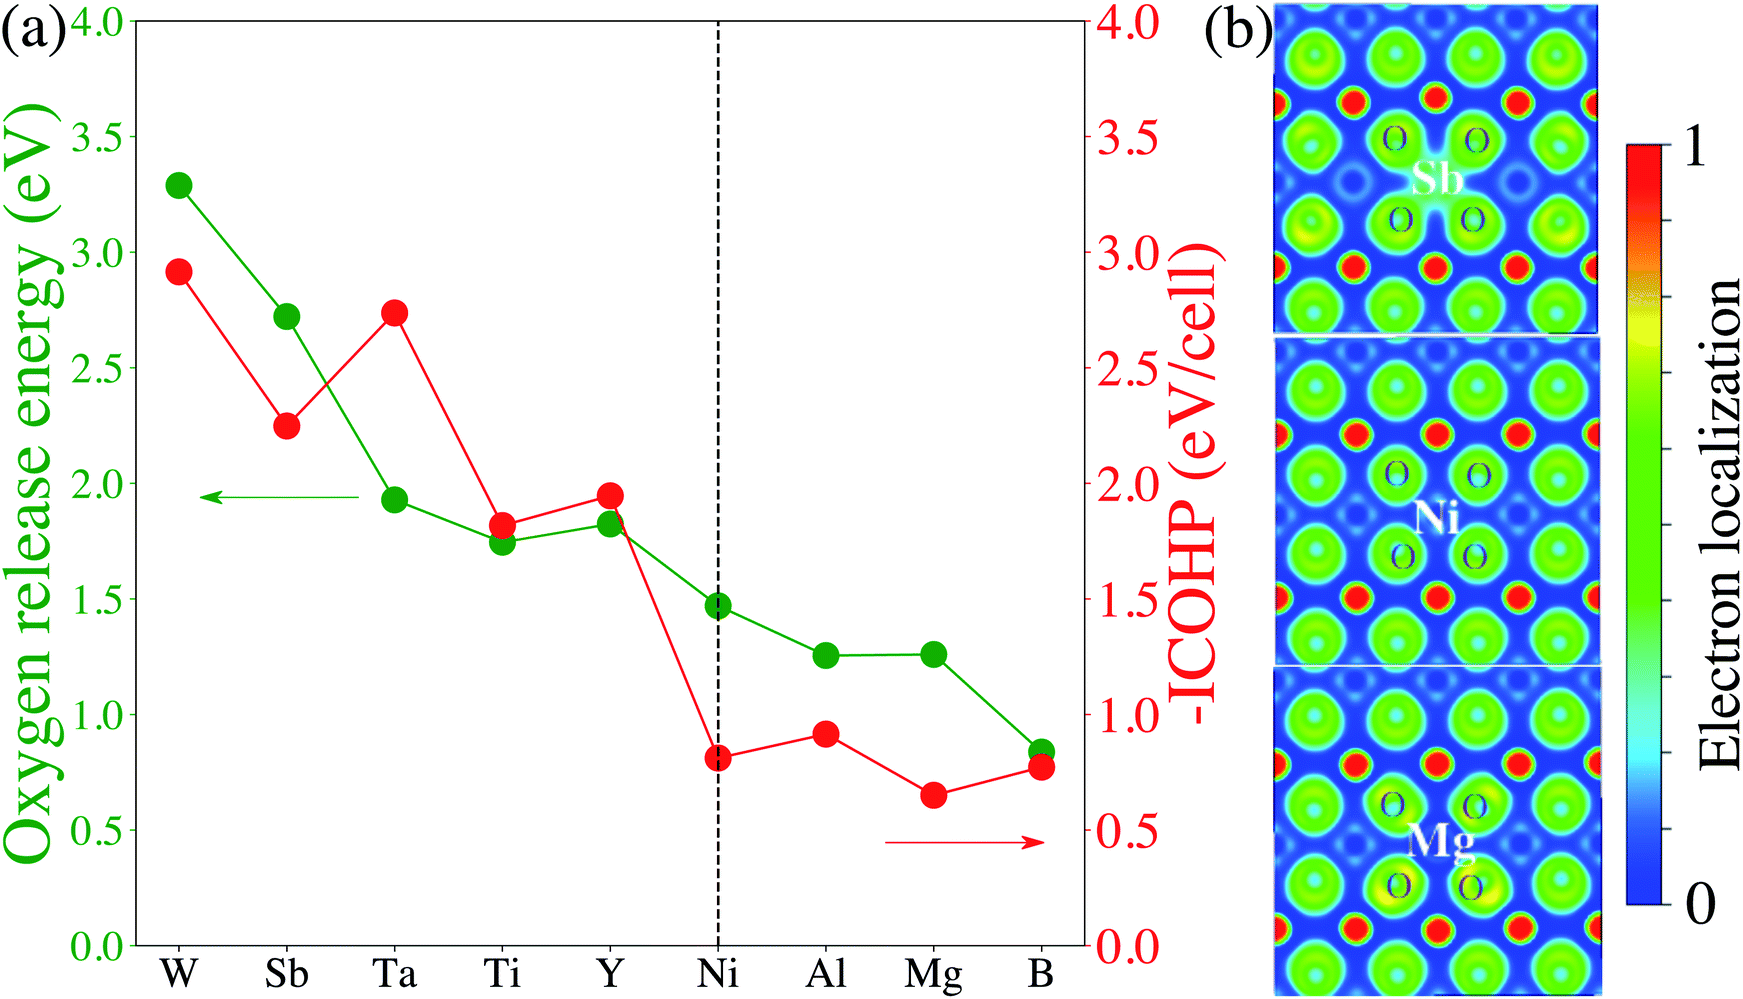 | ||
| Fig. 5 (a) Averaged oxygen release energy of pristine- and doped-LiNiO2 and –ICOHP values of dopant–oxygen pairs as a function of doping elements. The calculation is based on fully lithiated LiNiO2. The perpendicular dashed line represents the values for pristine LiNiO2. (b) 2D electron localization function contour plots for the surface slices of Sb-, pristine-, and Mg-doped LiNiO2. | ||
To summarize, we rationalize the effectiveness of W, Sb, Ta, and Ti to enhance surface oxygen retention of Li1−xNiO2, which is attributed to their stronger local bonding interactions with oxygen, as compared to the pristine Ni–O pair. Conversely, Al and Mg were not found to improve oxygen retention, while B was expected to deteriorate the surface oxygen loss in Li1−xNiO2. From a broader perspective, bonding descriptors based on the local oxygen chemical and structural environment are found to capture the ability to mitigate surface oxygen loss. Interestingly, similar conclusions were recently presented for two Na-ion cathodes, where local surface undercoordination due to different cation distributions resulted in different oxygen loss characteristics.70
3.2 Experimental validation
Among the four recommended dopants, we choose Sb as an exemplary dopant and validate our theoretical predictions by experimental synthesis, structural characterization and electrochemical tests. We synthesize pristine LiNiO2 and Sb-doped LiNiO2 through a simple co-precipitation method (see Section 2). The inductively coupled plasma mass spectrometry (ICP-MS) confirm that the dopant concentrations are in good agreement with the desired compositions (1% and 2% in the atomic ratio). Fig. 6a presents an atomic resolution HAADF STEM image of 2% Sb-doped LiNiO2 obtained along [100] zone axis. The results show that the Sb-doped LiNiO2 has a perfect layered structure (space group R![[3 with combining macron]](https://www.rsc.org/images/entities/char_0033_0304.gif) m) with alternating transition metal layer and Li layer. EDS maps and quantitative analysis (see Fig. 6b and S3†) show that Sb is inclined to enrich to the particle surface with an average content of ∼4.5 at%, while it has a relatively uniform distribution in the bulk with an average content of 3.3 at%. The surface enrichment of Sb confirms the theoretical prediction of Sb segregation behavior in Fig. 2. In addition, it should be noted that there is a discrepancy between the Sb concentration obtained from ICP-MS and the value given by EDS measurement. We attribute the difference to the following two factors: (1) our EDS system's energy axis is slightly off calibration, which could give rise to the difference. (2) We also acknowledge there could be composition inhomogeneity from particle to particle. However, the discrepancy doesn't affect the conclusion that Sb has a higher concentration in the particle surface.
m) with alternating transition metal layer and Li layer. EDS maps and quantitative analysis (see Fig. 6b and S3†) show that Sb is inclined to enrich to the particle surface with an average content of ∼4.5 at%, while it has a relatively uniform distribution in the bulk with an average content of 3.3 at%. The surface enrichment of Sb confirms the theoretical prediction of Sb segregation behavior in Fig. 2. In addition, it should be noted that there is a discrepancy between the Sb concentration obtained from ICP-MS and the value given by EDS measurement. We attribute the difference to the following two factors: (1) our EDS system's energy axis is slightly off calibration, which could give rise to the difference. (2) We also acknowledge there could be composition inhomogeneity from particle to particle. However, the discrepancy doesn't affect the conclusion that Sb has a higher concentration in the particle surface.
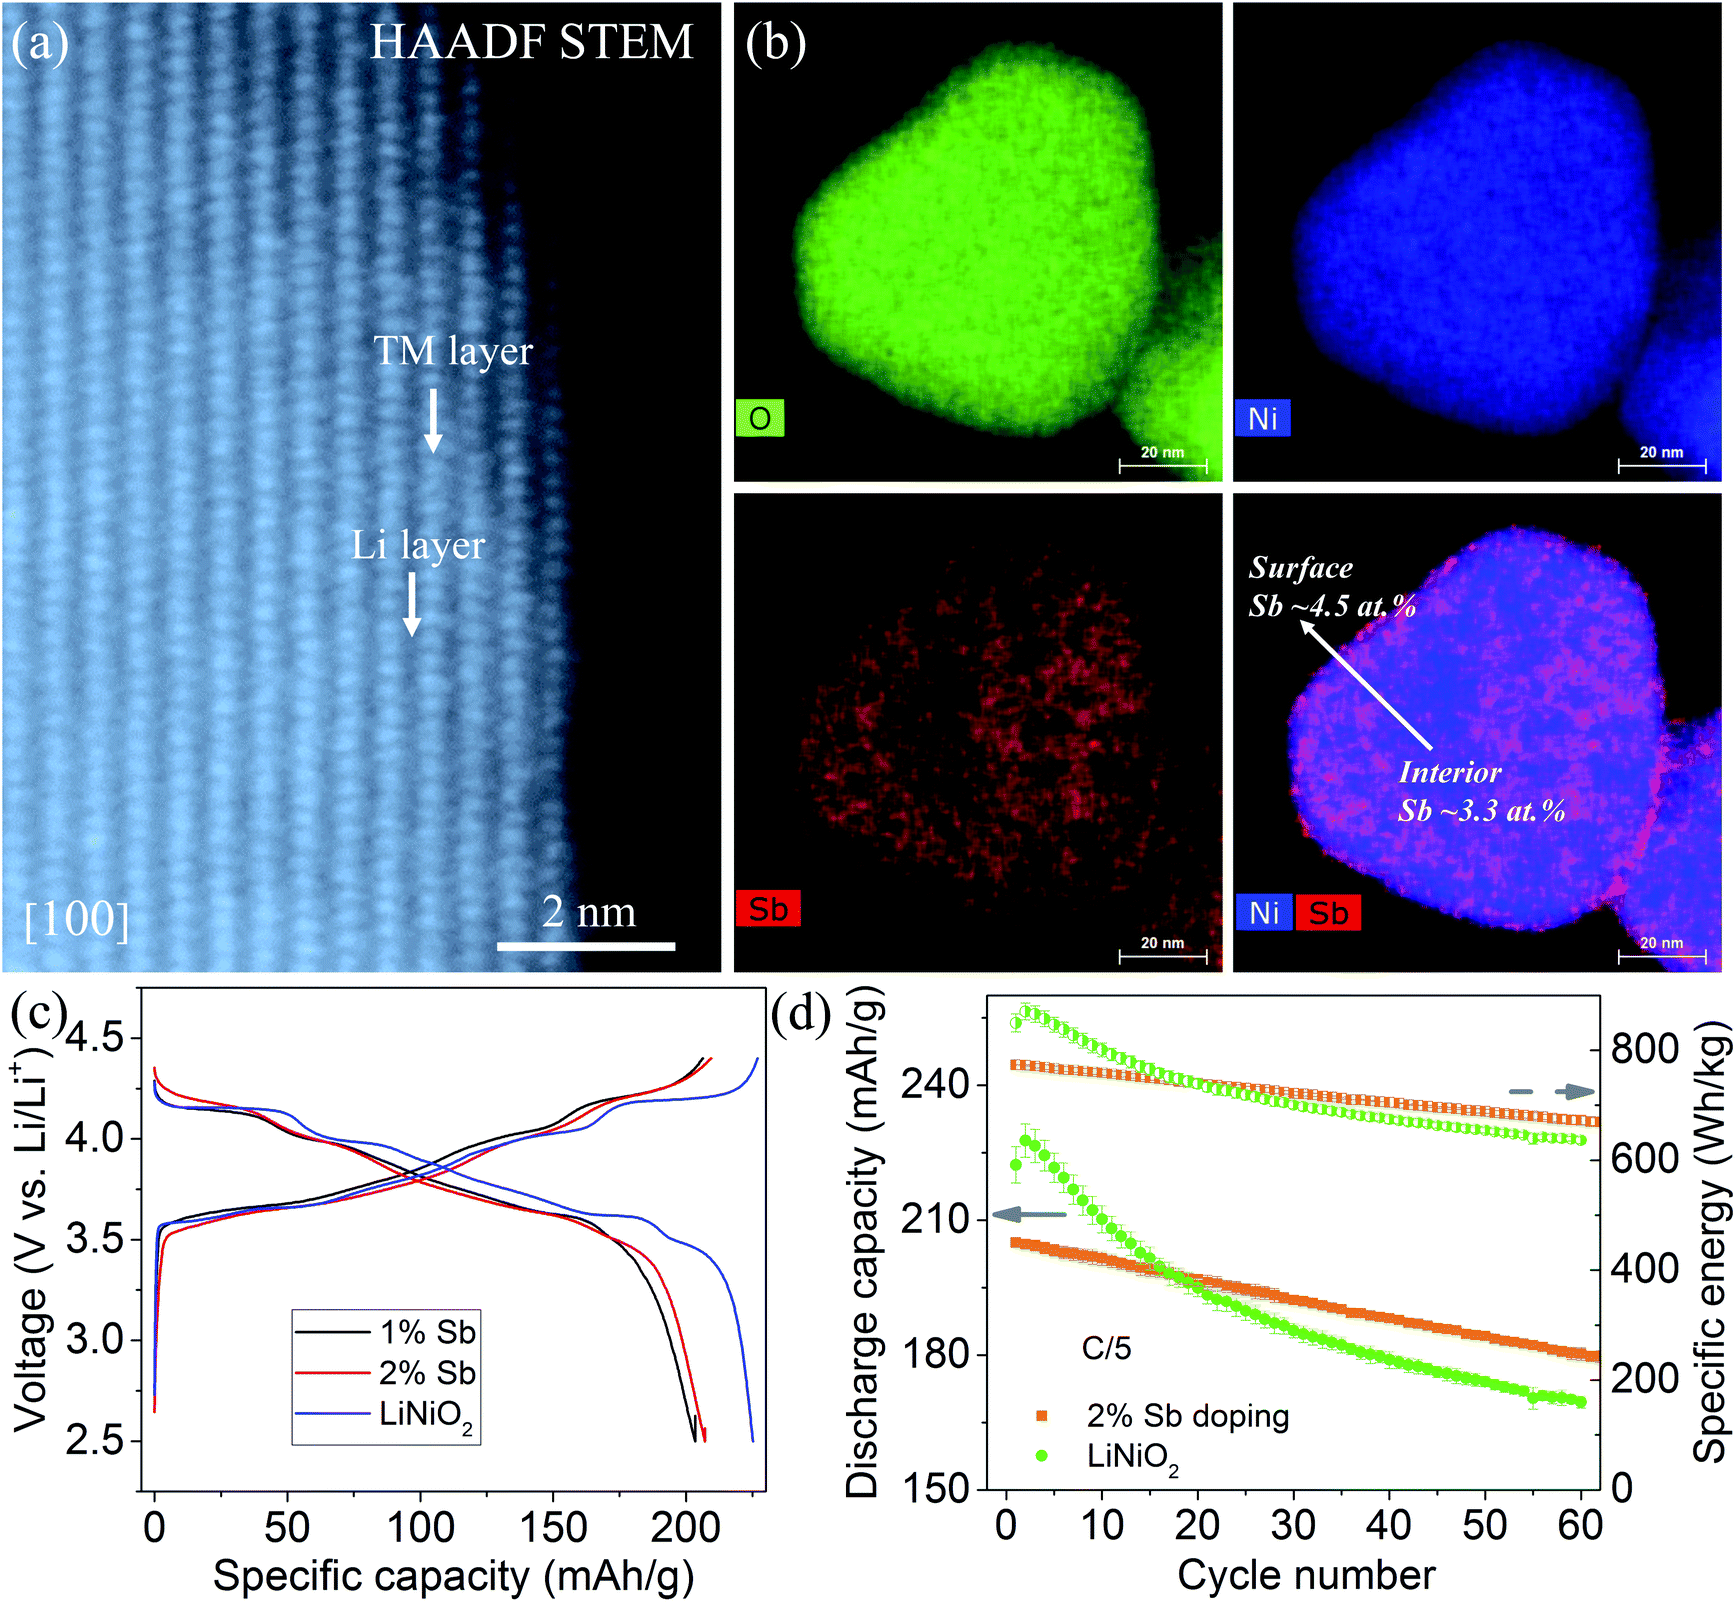 | ||
| Fig. 6 (a) Atomic resolution high-angle annular dark-field transmission electron microscopy (HAADF STEM) image of a 2% Sb-doped LiNiO2 along [100] zone axis. The transition metal (TM) layer and Li layer are indicated in the Rm lattice. (b) EDS maps of O, Ni, Sb as well as the overlapped map of Sb and Ni of typical Sb-doped LiNiO2 primary particle. Surface segregation of Sb is identified as the average ratio of Sb/(Sb + Ni) increased from 3.3 to 4.5 at% from the interior to the surface. (c) Second charge/discharge profiles of the cells containing the cathodes of LiNiO2, 1% Sb-doped LiNiO2, and 2% Sb-doped LiNiO2 at C/10 within 2.5–4.4 V vs. Li/Li+. (d) Discharge capacity and specific energy as a function of the cycle number of the cells containing the cathodes of LiNiO2 and 2% Sb-doped LiNiO2 at C/5 within 2.5–4.4 V vs. Li/Li+. The error bars in (d) are created based on the repeated measurements. | ||
The electrochemical performance of the pristine and Sb-doped LiNiO2 are evaluated in galvanostatic mode, see Fig. 6c and d. Dopants usually decrease the reversible capacity of the LiNiO2 cathode because of a lower nickel concentration.60,61,71 The reversible capacity of ∼200 mA h g−1 both for the 1% and 2% Sb-doped LiNiO2 is slightly lower than that of the pure LiNiO2 of ∼225 mA h g−1 at C/10 within 2.5–4.4 V vs. Li/Li+ (see Fig. 6c). By comparing the charge/discharge profiles, the 2% Sb-doped LiNiO2 delivers slightly smoother curves. It is well accepted that many dopants inhibit the multiple phase transformations, resulting in less step-like voltage profiles.60,71–73 In addition, the 2% Sb-doped LiNiO2 shows the capacity and energy retention of ∼87.8% and 86.6% after 60 cycles at C/5, respectively (see Fig. 6d). On the other hand, pristine LiNiO2 has retention of 74.7% and 76.6% for discharge capacity and specific energy after 60 cycles, respectively, although it displays the higher initial values of both. We believe there is still a large space to improve the electrochemical performance of Sb-doped LiNiO2 through optimizing the synthesis conditions. The improved electrochemical performance of Sb-doped LiNiO2 is expected from our theoretical prediction and may be attributed to the mitigated surface oxygen loss as a result of Sb doping.
4 Conclusions
Using first-principles calculations, we systematically evaluate the effectiveness of a select set of doping elements to enhance surface oxygen retention of Li1−xNiO2. Based on dopants that have been previously proposed to improve the cycling performance of Ni-rich layered oxide cathode materials, we choose eight candidates: W6+, Sb5+, Ta5+, Ti4+, Y3+, Al3+, B3+ and Mg2+. The evaluation process includes choosing the most stable surface facet from surface stability analysis of LiNiO2, determining the preferable atomic site and segregation behavior for each dopant, and evaluating the surface oxygen retention of doped-Li1−xNiO2 as compared to the pristine material. The following observations and conclusions are made:(1) All considered dopants preferably locate at the Ni-site in fully lithiated LiNiO2. W, Sb, Ta, Ti, Y and B exhibit a strong tendency to segregate to the surface region, while Mg prefers to reside in the bulk. Al tends to uniformly distribute from the surface to the bulk.
(2) Bonding descriptors based on the local oxygen chemical and structural environment, such as degree of electron hybridization, are found to correlate strongly with surface oxygen retention.
(3) W, Sb, Ta, and Ti are identified as the most promising dopants to mitigate surface oxygen evolution of Li1−xNiO2, and all four cations were found to display a higher degree of electron hybridization between the dopant and oxygen, as compared to the pristine Ni–O bond.
Finally, we explore Sb as an exemplary dopant and synthesize Sb-doped LiNiO2 to validate our theoretical predictions. We found that 2% Sb-doped LiNiO2 indeed exhibits a surface enrichment of Sb and improved electrochemical performance, as compared with pristine LiNiO2. Hence, inclusion of Sb to mitigate oxygen evolution in high-voltage, particularly Ni-rich layered cathodes is a promising direction warranting further exploration. Our work also highlights the effectiveness of a collaborated in silico and experimental approach in material design and discovery.
Conflicts of interest
There are no conflicts to declare.Acknowledgements
This work was supported by the U.S. Department of Energy's Office of Energy Efficiency and Renewable Energy (EERE) under the Award Number: DE-EE0008444. The research was performed using computational resources sponsored by the Department of Energy's Office of Energy Efficiency and Renewable Energy and located at the National Renewable Energy Laboratory.Notes and references
- N. Nitta, F. Wu, J. T. Lee and G. Yushin, Mater. Today, 2015, 18, 252–264 CrossRef CAS.
- Q. Liu, X. Su, D. Lei, Y. Qin, J. Wen, F. Guo, Y. A. Wu, Y. Rong, R. Kou, X. Xiao, F. Aguesse, J. Bareño, Y. Ren, W. Lu and Y. Li, Nat. Energy, 2018, 3, 936–943 CrossRef CAS.
- E. A. Olivetti, G. Ceder, G. G. Gaustad and X. Fu, Lithium-Ion Battery Supply Chain Considerations: Analysis of Potential Bottlenecks in Critical Metals, Joule, 2017, 1, 229–243 CrossRef.
- S.-T. Myung, F. Maglia, K.-J. Park, C. S. Yoon, P. Lamp, S.-J. Kim and Y.-K. Sun, ACS Energy Lett., 2017, 2, 196–223 CrossRef CAS.
- D. Andre, S. J. Kim, P. Lamp, S. F. Lux, F. Maglia, O. Paschos and B. Stiaszny, Future generations of cathode materials: an automotive industry perspective, J. Mater. Chem. A, 2015, 3, 6709–6732 RSC.
- H.-J. Noh, S. Youn, C. S. Yoon and Y.-K. Sun, J. Power Sources, 2013, 233, 121–130 CrossRef CAS.
- J. H. Kim, H. H. Ryu, S. J. Kim, C. S. Yoon and Y. K. Sun, ACS Appl. Mater. Interfaces, 2019, 11, 30936–30942 CrossRef CAS.
- C. Delmas, J. P. Pérès, A. Rougier, A. Demourgues, F. Weill, A. Chadwick, M. Broussely, F. Perton, P. Biensan and P. Willmann, J. Power Sources, 1997, 68, 120–125 CrossRef CAS.
- H. Arai, S. Okada, H. Ohtsuka, M. Ichimura and J. Yamaki, Solid State Ionics, 1995, 80, 261–269 CrossRef CAS.
- W. Li, J. N. Reimers and J. R. Dahn, Solid State Ionics, 1993, 67, 123–130 CrossRef CAS.
- H. Li, N. Zhang, J. Li and J. R. Dahn, J. Electrochem. Soc., 2018, 165, A2985–A2993 CrossRef CAS.
- C. S. Yoon, D.-W. Jun, S.-T. Myung and Y.-K. Sun, ACS Energy Lett., 2017, 2, 1150–1155 CrossRef CAS.
- K. Edström, T. Gustafsson and J. O. Thomas, Electrochim. Acta, 2004, 50, 397–403 CrossRef.
- D. H. Jang and S. M. Oh, J. Electrochem. Soc., 1997, 144, 3342–3348 CrossRef CAS.
- S.-K. Jung, H. Gwon, J. Hong, K.-Y. Park, D.-H. Seo, H. Kim, J. Hyun, W. Yang and K. Kang, Adv. Energy Mater., 2014, 4, 1300787 CrossRef.
- P. Yan, J. Zheng, Z. K. Tang, A. Devaraj, G. Chen, K. Amine, J. G. Zhang, L. M. Liu and C. Wang, Nat. Nanotechnol., 2019, 14, 602–608 CrossRef CAS.
- E. Hu, X. Yu, R. Lin, X. Bi, J. Lu, S. Bak, K. W. Nam, H. L. Xin, C. Jaye, D. A. Fischer, K. Amine and X. Q. Yang, Nat. Energy, 2018, 3, 690–698 CrossRef CAS.
- S. Hwang, W. Chang, S. M. Kim, D. Su, D. H. Kim, J. Y. Lee, K. Y. Chung and E. A. Stach, Chem. Mater., 2014, 26, 1084–1092 CrossRef CAS.
- S. Sharifi-Asl, J. Lu, K. Amine and R. Shahbazian-Yassar, Adv. Energy Mater., 2019, 9, 1900551 CrossRef.
- J. Cheng, E. Sivonxay and K. A. Persson, ACS Appl. Mater. Interfaces, 2020, 12, 35748–35756 CrossRef CAS.
- H. Xie, K. Du, G. Hu, Z. Peng and Y. Cao, J. Phys. Chem. C, 2016, 120, 3235–3241 CrossRef CAS.
- Z. Yang, X. Guo, W. Xiang, W. Hua, J. Zhang, F. He, K. Wang, Y. Xiao and B. Zhong, J. Alloys Compd., 2017, 699, 358–365 CrossRef CAS.
- Z. Zhang, D. Chen and C. Chang, RSC Adv., 2017, 7, 51721–51728 RSC.
- C. Pouillerie, L. Croguennec, P. Biensan, P. Willmann and C. Delmas, J. Electrochem. Soc., 2000, 147, 2061–2069 CrossRef CAS.
- M. Zhang, H. Zhao, M. Tan, J. Liu, Y. Hu, S. Liu, X. Shu, H. Li, Q. Ran, J. Cai and X. Liu, J. Alloys Compd., 2019, 774, 82–92 CrossRef CAS.
- T. Ohzuku, A. Ueda and M. Kouguchi, J. Electrochem. Soc., 1995, 142, 4033–4039 CrossRef CAS.
- D. Wang, X. Li, Z. Wang, H. Guo, Y. Xu, Y. Fan and J. Ru, Electrochim. Acta, 2016, 188, 48–56 CrossRef CAS.
- Y. Nishida, K. Nakane and T. Satoh, J. Power Sources, 1997, 68, 561–564 CrossRef CAS.
- K.-J. Park, H.-G. Jung, L.-Y. Kuo, P. Kaghazchi, C. S. Yoon and Y.-K. Sun, Adv. Energy Mater., 2018, 8, 1801202 CrossRef.
- R. Du, Y. Bi, W. Yang, Z. Peng, M. Liu, Y. Liu, B. Wu, B. Yang, F. Ding and D. Wang, Ceram. Int., 2015, 41, 7133–7139 CrossRef CAS.
- H. Zhu, T. Xie, Z. Chen, L. Li, M. Xu, W. Wang, Y. Lai and J. Li, Electrochim. Acta, 2014, 135, 77–85 CrossRef CAS.
- U. H. Kim, D. W. Jun, K. J. Park, Q. Zhang, P. Kaghazchi, D. Aurbach, D. T. Major, G. Goobes, M. Dixit, N. Leifer, C. M. Wang, P. Yan, D. Ahn, K. H. Kim, C. S. Yoon and Y. K. Sun, Energy Environ. Sci., 2018, 11, 1271–1279 RSC.
- P. Cui, Z. Jia, L. Li and T. He, J. Phys. Chem. Solids, 2011, 72, 899–903 CrossRef CAS.
- J. D. Steiner, H. Cheng, J. Walsh, Y. Zhang, B. Zydlewski, L. Mu, Z. Xu, M. M. Rahman, H. Sun, F. M. Michel, C.-J. Sun, D. Nordlund, W. Luo, J.-C. Zheng, H. L. Xin and F. Lin, ACS Appl. Mater. Interfaces, 2019, 11, 37885–37891 CrossRef CAS.
- Y. Kim, Phys. Chem. Chem. Phys., 2019, 21, 12505–12517 RSC.
- O. Breuer, A. Chakraborty, J. Liu, T. Kravchuk, L. Burstein, J. Grinblat, Y. Kauffman, A. Gladkih, P. Nayak, M. Tsubery, A. I. Frenkel, M. Talianker, D. T. Major, B. Markovsky and D. Aurbach, ACS Appl. Mater. Interfaces, 2018, 10, 29608–29621 CrossRef CAS.
- P. Yue, Z. Wang, H. Guo, X. Xiong and X. Li, Electrochim. Acta, 2013, 92, 1–8 CrossRef CAS.
- C. Liang, F. Kong, R. C. Longo, C. Zhang, Y. Nie, Y. Zheng and K. Cho, J. Mater. Chem. A, 2017, 5, 25303–25313 RSC.
- K. Min, S.-W. Seo, Y. Y. Song, H. S. Lee and E. Cho, Phys. Chem. Chem. Phys., 2017, 19, 1762–1769 RSC.
- F. Kong, C. Liang, L. Wang, Y. Zheng, S. Perananthan, R. C. Longo, J. P. Ferraris, M. Kim and K. Cho, Adv. Energy Mater., 2019, 9, 1802586 CrossRef.
- P. Xiao, T. Shi, W. Huang and G. Ceder, ACS Energy Lett., 2019, 4, 811–818 CrossRef CAS.
- Y. Shin, W. H. Kan, M. Aykol, J. K. Papp, B. D. McCloskey, G. Chen and K. A. Persson, Nat. Commun., 2018, 9, 4597 CrossRef.
- G. Kresse and J. Furthmüller, Comput. Mater. Sci., 1996, 6, 15–50 CrossRef CAS.
- G. Kresse and J. Furthmüller, Phys. Rev. B: Condens. Matter Mater. Phys., 1996, 54, 11169–11186 CrossRef CAS.
- G. Kresse and D. Joubert, Phys. Rev. B: Condens. Matter Mater. Phys., 1999, 59, 1758–1775 CrossRef CAS.
- J. P. Perdew, K. Burke and M. Ernzerhof, Phys. Rev. Lett., 1996, 77, 3865–3868 CrossRef CAS.
- J. Cheng, J. Luo and K. Yang, ACS Appl. Mater. Interfaces, 2017, 9, 7682–7690 CrossRef CAS.
- A. Jain, S. P. Ong, G. Hautier, W. Chen, W. D. Richards, S. Dacek, S. Cholia, D. Gunter, D. Skinner, G. Ceder and K. A. Persson, Commentary: The Materials Project: A Materials Genome Approach to Accelerating Materials Innovation, APL Mater., 2013, 1, 011002 CrossRef.
- E. Cho, S.-W. Seo and K. Min, ACS Appl. Mater. Interfaces, 2017, 9, 33257–33266 CrossRef CAS.
- J. Zhu and G. Chen, J. Mater. Chem. A, 2019, 7, 5463–5474 RSC.
- P. W. Tasker, J. Phys. C: Solid State Phys., 1979, 12, 4977–4984 CrossRef CAS.
- A. W. Moses, H. G. G. Flores, J.-G. Kim and M. A. Langell, Appl. Surf. Sci., 2007, 253, 4782–4791 CrossRef CAS.
- J. Osorio-Guillen, S. Lany, S. V. Barabash and A. Zunger, Phys. Rev. Lett., 2006, 96, 107203 CrossRef CAS.
- M. E. Arroyo y de Dompablo, C. Marianetti, A. Van der Ven and G. Ceder, Phys. Rev. B: Condens. Matter Mater. Phys., 2001, 63, 144107 CrossRef.
- M. E. Arroyo y de Dompablo, A. Van der Ven and G. Ceder, Phys. Rev. B: Condens. Matter Mater. Phys., 2002, 66, 64112 CrossRef.
- L. Wang, T. Maxisch and G. Ceder, Phys. Rev. B: Condens. Matter Mater. Phys., 2006, 73, 195107 CrossRef.
- S. Maintz, V. L. Deringer, A. L. Tchougréeff and R. Dronskowski, J. Comput. Chem., 2016, 37, 1030–1035 CrossRef CAS.
- A. Lücke, U. Gerstmann, T. D. Kühne and W. G. Schmidt, J. Comput. Chem., 2017, 38, 2276–2282 CrossRef.
- T. Hughbanks and R. Hoffmann, J. Am. Chem. Soc., 1983, 105, 3528–3537 CrossRef CAS.
- L. Mu, R. Zhang, W. H. Kan, Y. Zhang, L. Li, C. Kuai, B. Zydlewski, M. M. Rahman, C. J. Sun, S. Sainio, M. Avdeev, D. Nordlund, H. L. Xin and F. Lin, Chem. Mater., 2019, 31, 9769–9776 CrossRef CAS.
- H. Li, A. Liu, N. Zhang, Y. Wang, S. Yin, H. Wu and J. R. Dahn, Chem. Mater., 2019, 31, 7574–7583 CrossRef CAS.
- T. Weigel, F. Schipper, E. M. Erickson, F. A. Susai, B. Markovsky and D. Aurbach, ACS Energy Lett., 2019, 4, 508–516 CrossRef CAS.
- Z. Liu, H. Zhen, Y. Kim and C. Liang, J. Power Sources, 2011, 196, 10201–10206 CrossRef CAS.
- H. Arai, S. Okada, Y. Sakurai and J.-i. Yamaki, Solid State Ionics, 1998, 109, 295–302 CrossRef CAS.
- J. R. Dahn, E. W. Fuller, M. Obrovac and U. von Sacken, Solid State Ionics, 1994, 69, 265–270 CrossRef CAS.
- M. Guilmard, L. Croguennec, D. Denux and C. Delmas, Chem. Mater., 2003, 15, 4476–4483 CrossRef CAS.
- H. J. T. Ellingham, J. Soc. Chem. Ind., 1944, 63, 125–160 CrossRef CAS.
- J. H. Park, J. Lim, J. Yoon, K. S. Park, J. Gim, J. Song, H. Park, D. Im, M. Park, D. Ahn, Y. Paik and J. Kim, Dalton Trans., 2012, 41, 3053–3059 RSC.
- X. Li, H. Xin, Y. Liu, D. Li, X. Yuan and X. Qin, RSC Adv., 2015, 5, 45351–45358 RSC.
- R. A. House, U. Maitra, L. Jin, J. G. Lozano, J. W. Somerville, N. H. Rees, A. J. Naylor, L. C. Duda, F. Massel, A. V. Chadwick, S. Ramos, D. M. Pickup, D. E. McNally, X. Lu, T. Schmitt, M. R. Roberts and P. G. Bruce, Chem. Mater., 2019, 31, 3293–3300 CrossRef.
- L. Mu, W. H. Kan, C. Kuai, Z. Yang, L. Li, C. J. Sun, S. Sainio, M. Avdeev, D. Nordlund and F. Lin, ACS Appl. Mater. Interfaces, 2020, 12, 12874–12882 CrossRef.
- L. Croguennec, E. Suard, P. Willmann and C. Delmas, Chem. Mater., 2002, 14, 2149–2157 CrossRef CAS.
- H. Li, M. Cormier, N. Zhang, J. Inglis, J. Li and J. R. Dahn, J. Electrochem. Soc., 2019, 166, A429–A439 CrossRef CAS.
Footnote |
| † Electronic supplementary information (ESI) available. See DOI: 10.1039/d0ta07706b |
| This journal is © The Royal Society of Chemistry 2020 |