 Open Access Article
Polyiodide solid-state dye-sensitized solar cell produced from a standard liquid I−/I3− electrolyte†
Ellie
Tanaka
 and
Neil
Robertson
 *
*
School of Chemistry, The University of Edinburgh, David Brewster Road, Edinburgh EH9 3FJ, UK. E-mail: Neil.Robertson@ed.ac.uk
First published on 15th September 2020
Abstract
Solid-state dye-sensitized solar cells were obtained by drying a standard I−/I3− liquid-electrolyte cell in ambient conditions. Slow evaporation of the organic solvent allows the formation of a polyiodide (In−, n ≥ 3) network that bridges the counter electrode and dye/TiO2 layer. The unsealed polyiodide solar cell (Ply-I DSSC) with 5T dye reaches a maximum of 5.2% peak power conversion efficiency (peak PCE), similar to the precursor liquid-state solar cell (Liq-I DSSC) of maximum PCE = 5.7%. Once the performance of the Ply-I DSSCs reaches a stabilization (stb.) point (maximum stb. PCE 5.0%), no loss in performance is displayed under dark storage in ambient air without any encapsulation for a period of around 10 months.
Introduction
Photovoltaic cells consisting of a dye-sensitized wide band gap semiconductor have been researched for more than 50 years, dating back to reports in the 1960s.1,2 High performance dye-sensitized solar cells (DSSC) over 7% power conversion efficiency (PCE) were first reported by O'Regan and Grätzel in 1991.3 Their device design included a mesoporous TiO2 layer and an I−/I3− electrolyte. The slow recombination kinetics of the I−/I3− electrolyte makes it a favourable choice in DSSCs.4 However, the volatile nature of the organic solvent in the I−/I3− electrolyte has been said to trigger a drop in performance, lowering the reliability of this cell architecture. Thus, efforts have moved towards replacing the I−/I3− electrolyte with a solid or quasi-solid hole transport material, by methods such as spin-coating, heating, or gelation.5–11 Deposition of solid hole conductors in DSSCs has often faced challenges such as incomplete coverage of the thick mesoporous TiO2 network or the additional cost of the gelator.11–14 In 2012, Freitag et al. reported a “zombie” cell architecture solid-state DSSC where they slowly dried the copper complex electrolyte of a liquid-state DSSC until it transformed into a solid hole conductor.15 The present record efficiencies for solid-state DSSCs (PCE = 10.7–11.7%) have been achieved using this method.16,17 Meanwhile, some groups have reported the use of solid electrolytes in DSSCs.18–20 The term “solid electrolyte” would often refer to solid ionic conductors, but could be used interchangeably with the terms “hole transport material” or “hole conductor” in cases where the ion motion and hole hopping happen simultaneously.According to Freitag et al., the key to successfully achieving an efficient solid-state hole conductor with the “zombie” method relates to the amorphous state of the material.15 This raises the question of what would happen with the conventional I−/I3− electrolyte under a similar evaporation process. In fact, iodide species at high concentration are known to go through a Grotthuss mechanism as described below:10,21,22
| I3− + I− → I− − I2 … I− → I− … I2 − I− → I− + I3− | (1) |
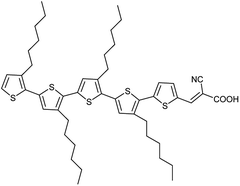
In this study, we report a solid-state DSSC that is fabricated by the “zombie” method (i.e. slow drying of the injected liquid electrolyte), except that the original electrolyte is a standard I−/I3− electrolyte. We found that the liquid I−/I3− electrolyte (Liq-I) turns into a solid polyiodide hole transport material (Ply-I) by simply exposing the Liq-I to ambient air. Our liquid-state I−/I3− DSSC (Liq-I DSSC) has an architecture of FTO/compact-TiO2 (c-TiO2)/mesoporous-TiO2 (m-TiO2)/dye/Ply-I/Pt/FTO, where the anode and cathode are fixed to each other by sealing the edges with UV-curing glue without an additional spacer. Although the basic architecture follows that by Cao et al.,26 this is the first report of a working glued DSSC employing an I−/I3− electrolyte and Pt counter electrode, to the best of our knowledge. The organic 5T dye (Fig. 1)27 was selected as the sensitizer for the following reasons: (1) the optimal film thickness (8 μm) is smaller than for other dyes such as N719 (20 μm),28 greatly reducing the materials cost and cell fabrication time; (2) it revealed superior performance to other dyes tested in the solid-state DSSC structure adopted in this study; (3) its performance-cost ratio has been reported to be high.29
The unsealed DSSCs reached a maximum peak PCE of 5.2% (average 4.9%) and stabilized (stb.) PCE of 5.0% (average 3.6%). This indicates that our solid-state polyiodide DSSC (Ply-I DSSC) can reach a PCE almost as high as the corresponding precursor Liq-I DSSC (maximum peak PCE 5.7%, average 5.1%) and display excellent stability without leakage problems, with no loss in performance for a period around 10 months once a stabilization point is reached. This low-cost, simple, and versatile technique may expand the possibilities of forthcoming DSSC architectures.
Methods
Materials preparation
Reagents were purchased from Merck and used without further purification, unless otherwise specified. 5T dye was synthesized according to the literature.27 1,2-Dimethyl-3-propylimidazolium iodide (DMPII) was purchased from Solaronix and used without further purification. LiI was purchased from Fisher Scientific and used without further purification.Fabrication of dye-sensitized solar cells (DSSCs)
![[thin space (1/6-em)]](https://www.rsc.org/images/entities/char_2009.gif) :
:![[thin space (1/6-em)]](https://www.rsc.org/images/entities/char_2009.gif) 3 (v/v) with 0.4 mM chenodeoxycholic acid.
3 (v/v) with 0.4 mM chenodeoxycholic acid.
Variations of the above procedures involving different dyes and spacers are detailed in the ESI.†
Characterization methods
UV-Vis absorption was recorded on a V-670 (Jasco) spectrophotometer. Each sample was placed and sealed between two pieces of microscope glass (=cell). The reference was a blank cell without any sample inside. Photocurrent–voltage (J–V) curves were recorded on an Autolab potentiostat (Metrohm) with class AAA SLB300A solar simulator (Sciencetech) as the light source. The light intensity was calibrated to AM1.5G using a silicon reference cell. The active area of the solar cell was fixed with a black metal mask, either with a circular aperture of 0.126 cm2 (d = 4 mm) or a square aperture of 0.0625 cm2 (2.5 mm × 2.5 mm). The frequency-modulated electrochemical impedance was recorded with a similar setup to that of the J–V measurements. The frequency range was set to 100 kHz to 100 mHz with an AC voltage amplitude of 10 mV. The measurements were performed at open circuit voltage under 1 sun illumination. The plots were fitted using the ZView (Scribner Associates) software. Incident photon-to-current conversion efficiency (IPCE) was recorded with a Bentham PVE300 EQE/IQE system in DC mode. The incident light was calibrated with a reference silicon photodiode within the range of 300–1000 nm. Raman spectra were recorded on an inVia Renishaw micro Raman spectrometer. Fourier-transform infrared (FT-IR) spectra were recorded on a Shimadzu IRSpirit FT-IR spectrophotometer at attenuated total reflection mode. Focused ion beam scanning electron microscopy (FIB-SEM) images were taken on a Zeiss Crossbeam 550 FIB-SEM. The sample was sputtered with platinum prior to the measurement and the cross-section was captured at a 36° angle. Energy dispersive X-ray spectroscopy analysis was performed on an X-Max 150 EDS detector (Oxford Instruments) with a detector size of 150 mm2.Results and discussion
Performance and stability of Ply-I DSSC
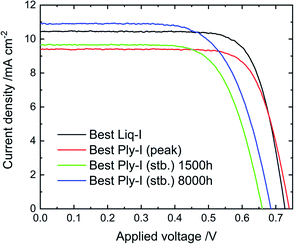
According to our trials, Ply-I DSSCs can be fabricated with a wide choice of components such as different dyes (e.g. N719, SQ2, 5T, D149) and spacers (e.g. thermal polymer spacer, UV-curing glue) (Fig. S1†). The results indicate that the basic effect can be widely adapted to such variations. Although none of the dyes above have been optimised, the relatively high performance achieved with 5T dye could be related to properties such as relatively thin film thickness and efficient light harvesting. Detailed study was focused on the architecture FTO/c-TiO2/m-TiO2/5T-dye/Ply-I/Pt with which the highest PCEs were achieved. To simplify device fabrication, the electrodes were attached without a spacer but by applying UV-curing glue along the edges of the assembly. Fig. 2 shows J–V curves of the Liq-I DSSC with the best PCE (Cell 1), Ply-I DSSC with the best “peak PCE” (Ply-I (peak)) (Cell 1), Ply-I DSSC with the best “stabilized PCE” (Ply-I (stb.)) (Cell 2) at 1500 h and best Ply-I (stb.) DSSC (Cell 2) at 8000 h. The overall photovoltaic parameters (short-circuit photocurrent density (JSC), open-circuit voltage (VOC), fill factor (ff) and PCE) of the Liq-I DSSC, Ply-I (peak) DSSC and Ply-I (stb.) DSSC are summarized in Table 1 and Fig. S2.† The J–V curves of the best Ply-I (stb.) DSSC measured with a 0.0625 cm2 aperture at 0 h (Liq-I), Ply-I (peak), 1500 h and 8000 h can be found in the ESI (Fig. S3).† With a 0.0625 cm2 aperture, the best Ply-I (peak) DSSC achieved JSC = 10.8 mA cm−2, VOC = 0.70 V, ff = 0.71 and PCE = 5.3%. The best Ply-I (stb.) DSSC achieved JSC = 10.3 mA cm−2, VOC = 0.63 V, ff = 0.69 and PCE = 4.5% after 1500 h, and JSC = 11.3 mA cm−2, VOC = 0.66 V, ff = 0.67 and PCE = 5.0% after 8000 h. In general, the performance trends by comparing the two masks were analogous to what has previously been reported by Ito et al.30 In summary, slightly higher PCE and more consistent results are obtained with the 0.0625 cm2 aperture, while results with larger active area will be obtained with the 0.126 cm2 aperture. The two masks were used in this study to validate the obtained results. Once the DSSCs are unsealed, the photovoltaic parameters evolve as depicted in Fig. 3 (stability-test protocol ISOS-D-1).31 Once unsealed, the solid-state characteristics (i.e. shrinkage of excess electrolyte, S-shape observed in J–V curve) will start to appear after a few days, however the performance tends to fluctuate for each point of measurement within the first several hundred hours counting from T = 0. The Ply-I DSSCs will eventually reach a stabilization point where the DSSC performance becomes stable. We note that the timeline above is approximate and the evolution speed towards Ply-I (stb.) differs from cell to cell. Clearer descriptions are expected to be provided once the best protocol is fully optimized.| J SC/mA cm−2 | V OC/V | ff | PCE (%) | |
|---|---|---|---|---|
| a Liq-I average: from the performance of individual cells before unsealing. Ply-I (peak) average: from the best performance of individual cells within the non-stabilized region; from the point the cell has started to show Ply-I characteristics such as S-shape J–V curve and darkening of the electrolyte, and before reaching the stabilized performance. The approximate time range was between 24 to several hundred hours. Ply (stb.) average: from the best performance of individual cells within the stabilized region, typically from 48 to 750 h (the value for the best cell was taken from the measurement at 8000 h). | ||||
| Liq-I best | 10.4 | 0.73 | 0.75 | 5.7 |
| Liq-I average | (9.7 ± 1.2) | (0.71 ± 0.02) | (0.73 ± 0.04) | (5.1 ± 0.8) |
| Ply-I (peak) | 9.38 | 0.74 | 0.75 | 5.2 |
| Ply-I (peak) average | (9.3 ± 1.4) | (0.73 ± 0.01) | (0.71 ± 0.04) | (4.9 ± 0.6) |
| Ply-I (stb.) 1500 h | 9.69 | 0.66 | 0.69 | 4.4 |
| Ply-I (stb.) 8000 h | 10.9 | 0.69 | 0.66 | 5.0 |
| Ply-I (stb.) averagea | (8.5 ± 1.7) | (0.68 ± 0.04) | (0.63 ± 0.07) | (3.6 ± 0.7) |
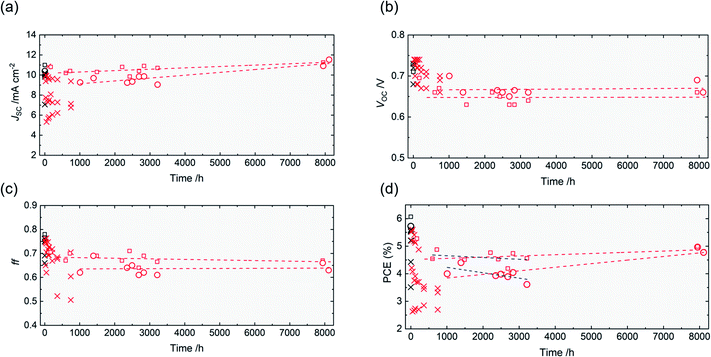 | ||
| Fig. 3 (a)–(d) Evolution of the photovoltaic parameters of Ply-I DSSCs for ∼8000 h. The performance of the best Ply-I (stb.) DSSC was tracked for 8000 h, while the other cells were tracked for 750 h. Black plots: sealed Liq-I DSSCs. Red plots: unsealed Ply-I DSSCs. Crosses indicate individual DSSCs measured with an aperture of 0.126 cm2. Black open circles indicate the best Liq-I DSSC, measured with an aperture of 0.126 cm2. Red open circles indicate the long-term evolution of the best Ply-I (stb.) DSSC, measured with an aperture of 0.126 cm2. Red open squares indicate the long-term evolution of the same DSSC (with the best stb. PCE), measured with an aperture of 0.0625 cm2. The red dashed lines are the linear fitting of the red squares and circles in the stabilized region from 1000 h to 8000 h, presented as a guide to the eye. The blue dashed lines in Fig. 3(d) are the linear fittings of the red circles and red squares in the stabilized region up to 3200 h. | ||
In general, a decrease in ff and JSC contribute to an eventual drop in PCE. The VOC, however, initially rises and only drops slightly thereafter in most cases. The Ply-I DSSC with the highest stb. PCE was tracked further for 3–4 months, revealing excellent stability (Fig. 3). During this period (T = 1000–3200 h), the unsealed DSSC exhibited PCE values in the range of 4.0 ± 0.2% with a 0.126 cm2 aperture and 4.6 ± 0.2% with a 0.0625 cm2 aperture. The lifetime of the cell was estimated by linearly fitting the plots, returning T80 (time until 20% PCE drop from T = 0 h in Fig. 3(d))31 as 4516 h and 14![[thin space (1/6-em)]](https://www.rsc.org/images/entities/char_2009.gif) 544 h with apertures of 0.126 cm2 and 0.0625 cm2, respectively. The TS80 (time until 20% PCE drop from the stabilized onset in Fig. 3(d); T = 1008 h for 0.126 cm2 and T = 600 h for 0.0625 cm2) values were 4315 h and 14
544 h with apertures of 0.126 cm2 and 0.0625 cm2, respectively. The TS80 (time until 20% PCE drop from the stabilized onset in Fig. 3(d); T = 1008 h for 0.126 cm2 and T = 600 h for 0.0625 cm2) values were 4315 h and 14![[thin space (1/6-em)]](https://www.rsc.org/images/entities/char_2009.gif) 344 h, respectively. The calculations are explained in detail in the ESI (Fig. S4†). TS80 in the optimum case (=14
344 h, respectively. The calculations are explained in detail in the ESI (Fig. S4†). TS80 in the optimum case (=14![[thin space (1/6-em)]](https://www.rsc.org/images/entities/char_2009.gif) 344 h) indicates a lifetime of 1.6 years counting from T = 600 h in Fig. 3(d). In other words, the fitted curves suggest that 0.196% PCE (0.126 cm2) or 0.065% PCE (0.0625 cm2) in absolute values is lost every 1000 h. To validate our estimation, the same unsealed Ply-I DSSC was measured after another several months, revealing no loss in performance for the entire 9–10 months, or ∼7000 h, counting from T = 1008 h. In Fig. 3(a) and (d), the JSC and PCE appear to have improved during the dark storage for 5000 h. We are not certain at this point if the improvement is within the deviation error, or if the dark storage has any effect to improve the device performance. For reference, the performance after a week (the last plot, 8112 h) shows a slight decrease in performance, but still higher than the previous plots. Although the results may not represent real-life operational stability, such a long shelf lifetime is rarely reported in DSSCs to the best of our knowledge. The corrosiveness of I−/I3−, one of the main issues of concern for a Liq-I DSSC,4,5 appears to be less of a problem in the Ply-I DSSC.
344 h) indicates a lifetime of 1.6 years counting from T = 600 h in Fig. 3(d). In other words, the fitted curves suggest that 0.196% PCE (0.126 cm2) or 0.065% PCE (0.0625 cm2) in absolute values is lost every 1000 h. To validate our estimation, the same unsealed Ply-I DSSC was measured after another several months, revealing no loss in performance for the entire 9–10 months, or ∼7000 h, counting from T = 1008 h. In Fig. 3(a) and (d), the JSC and PCE appear to have improved during the dark storage for 5000 h. We are not certain at this point if the improvement is within the deviation error, or if the dark storage has any effect to improve the device performance. For reference, the performance after a week (the last plot, 8112 h) shows a slight decrease in performance, but still higher than the previous plots. Although the results may not represent real-life operational stability, such a long shelf lifetime is rarely reported in DSSCs to the best of our knowledge. The corrosiveness of I−/I3−, one of the main issues of concern for a Liq-I DSSC,4,5 appears to be less of a problem in the Ply-I DSSC.
Photo-response of Ply-I
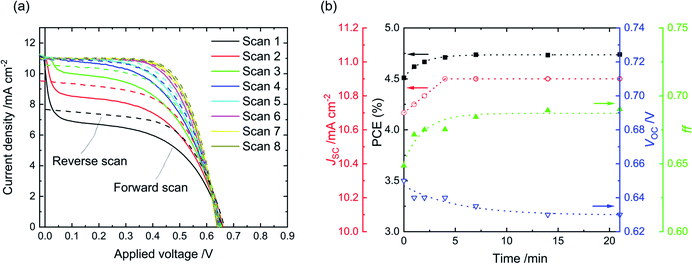
The forward J–V scan of a Ply-I DSSC stored in the dark depicts a characteristic S-shape, which gradually disappears upon light soaking (Fig. 4(a)). Each J–V curve in Fig. 4(a) is scanned in the order JSC → VOC → JSC, revealing the dynamic J–V response to light. The dynamics appears to be purely photo-responsive and not bias-related (Fig. S5†). Similar S-shape J–V dynamics have been observed in organic solar cells, where the authors attributed the light soaking effect to the reduction of charge transport resistance in the TiOx electron transport layer.32 In our case, the S-shape profile is likely to come from the Ply-I layer. The drop from peak current to steady-state current can be explained by the imbalance between the number of photogenerated charges from the sensitized-TiO2 and mobile charges in the mass transport limited Ply-I.33The transient J–V behaviour of the Ply-I DSSC was tracked for 20 min under continuous light soaking as shown in Fig. 4(b) (stability-test protocol ISOS-L-1).31 The JSC, ff and PCE rise whereas the VOC declines, with all parameters reaching an equilibrium after 5–10 min illumination. Interestingly, the initial S-shape was more noticeable when a smaller mask (e.g. 0.0625 cm2) was used as an aperture. In addition, when the mask was lifted after several minutes of irradiation, a silhouette of the masked area appeared on the surface of the active area, covering the area where the aperture had been. (Fig. S6†). Once formed, the silhouette is observable for ca. half an hour. The dynamic J–V characteristics and darkening of the illuminated area resonate with each other. The darkening may be related to partial photooxidation of the iodide species.4 Acceleration in oxidation and release of charges in response to light would enhance charge transport, thus increasing the current and ff.
IPCE was recorded to investigate the monochromatic response of Ply-I (Fig. 5(a)). The IPCE exceeds 70% around 500 nm. The dip around 360 nm overlaps with the optical absorption peak of the Ply-I (Fig. 5(b)), suggesting that light absorption by the Ply-I might be one of the causes of the slightly lower current in the Ply-I DSSC. We note that Ply-I itself acts as a DSSC light absorber, albeit very inefficiently with JSC = 80 μA cm−2 and VOC = 0.24 V (Fig. S7†). The much higher and broader absorption by Ply-I is coherent with its darker colour compared to Liq-I. The optical gaps were calculated as 2.64 eV for Liq-I and 2.39 eV for Ply-I. The corresponding Tauc plots are shown in Fig. S8.† The broadening of the main IPCE peak towards longer wavelengths in the case of Ply-I DSSC could be due to some interface modification between the TiO2 and Ply-I.
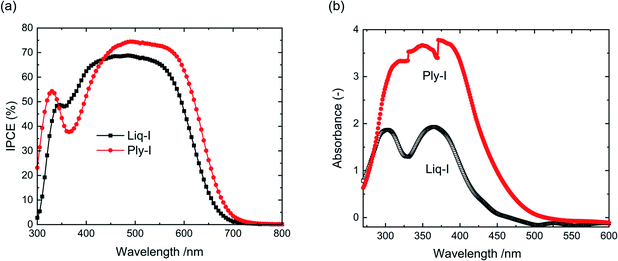 | ||
| Fig. 5 (a) IPCE curve of Liq-I DSSC and Ply-I DSSC. (b) UV-Vis absorption spectra of Liq-I and Ply-I. | ||
Formation of Ply-I
Ply-I is sparsely soluble in water and soluble in organic solvents such as ethanol and acetone. The layer is amorphous as confirmed by XRD (Fig. S9†), which is consistent with the solar cell characteristics we have described.15The Raman spectra of Liq-I and Ply-I in Fig. 6(a) both show a sharp peak at 112 cm−1 and a shoulder at 115 cm−2. The former corresponds to I3− (ref. 10 and 34) and the latter to I2−˙.35 Ply-I has a prominent additional peak at 149 cm−1, which can be assigned to I5−.10,24,36,37 Neither of the samples have signs of free-standing molecular I2 (∼180 cm−1), but the small peak at 174 cm−1 found in Ply-I suggests the existence of adsorbed iodine.38 The absence of molecular I2 in the Ply-I indicates that most of the I2 has been consumed to form higher order polyiodides. The Liq-I components are DMPII, LiI, I2, tBP and MeCN (Fig. S10(a)†). The creation of polyiodide from iodide species is further investigated in Fig. 6(b), where the two characteristic peaks at 112 cm−1 and 149 cm−1 appear with, and only with, the combination of DMPII + I2 and LiI + I2 (the Raman spectra of tBP and MeCN are shown in Fig. S10(b)†).
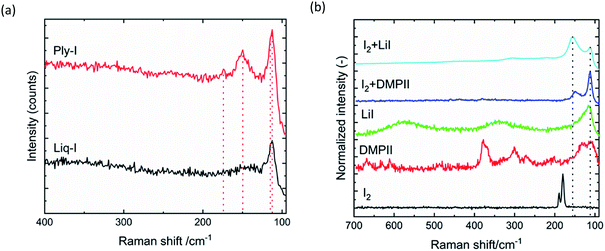 | ||
| Fig. 6 (a) Raman spectra of Ply-I and Liq-I. (b) Raman spectra of LiI + I2, DMPII + I2, LiI, DMPII and I2 solid samples. | ||
We would like to note that the peak at 149 cm−1 is more intense for I2 + LiI than for I2 + DMPII. This suggests that LiI is more likely to facilitate the intermolecular bonding of the iodide species, probably due to the Li+ being small.
The visual appearance is also different; I2 + LiI develops an intense dark brown colour compared to I2 + DMPII. The intense colour is likely to correspond to the formation of higher order polyiodides. As the colour gradually fades away, the Raman peaks associated with polyiodides also diminish, indicating that I2 dissociates from the structure by evaporating into the air (Fig. S11†).
We investigated the formation of Ply-I in further detail by placing drops of I2/MeCN, LiI + I2/MeCN and Liq-I on a glass slide as shown in Video S1.† The concentrations were identical as in a normal electrolyte. The I2/MeCN displays a yellow orange colour, which evaporates after a couple of minutes. LiI + I2/MeCN dramatically changes from yellow brown to dark brown over a minute, followed by disappearance of the colour. White LiI crystals remain in the end. The Liq-I slightly darkens over a minute from yellow to orange and maintains its colour thereafter. We summarize our observation as follows.
(1) As the MeCN evaporates, the I−, I3− and I2 react to form higher order polyiodides (intensification of brown colour). (2) Without the tBP, the polyiodides are not stable and decompose into LiI (or DMPII) and I2. The I2 will eventually sublime. (3) In the presence of tBP, the polyiodide is stable for weeks. It is possible that the tBP acts as a Lewis base and forms a complex with the LiI (or DMPII) or I2 to fix the polyiodide network.24,39
To note, the above observations were identical in the dark. This indicates that the polyiodide can form without the presence of light.
Is Ply-I solvent-free?
The IR spectra in Fig. 7 can give further indications on the properties of Ply-I. A full assignment of the peaks can be found in the Table S2.† The absence of the –C![[triple bond, length as m-dash]](https://www.rsc.org/images/entities/char_e002.gif) N peak at 2250 cm−1 in the Ply-I spectrum indicates that Ply-I is free of MeCN. The peak appears in the Liq-I spectrum. Traces peaks of MeCN are also identified in the DMPIII + I2 and LiI + I2, due to the preparation of these samples taking place just before the IR measurement. On the other hand, a broad distinctive peak at 3200–3600 cm−1 is seen in Ply-I, DMPII + I2 and LiI + I2. The peak can be assigned to the –OH stretching in water molecules. The water was likely adsorbed from the air during the measurement, as DMPII and LiI are both hygroscopic. In fact, the DMPII and LiI spectra in Fig. 7(b) show only the peaks assigned to water. However, additional peaks associated to C–H bonding appear especially when DMPII is reacted with I2 (Fig. 7(a)). These new peaks are reflected in the Ply-I. The appearance of new peaks by simply mixing the raw ingredients may be an indication that the water uptake is lower in the Ply-I compared to the raw DMPII and LiI. Although solid conclusions cannot be drawn at this point due to the lack of quantitative interpretation, the stability of the Ply-I indicates its low sensitivity to atmospheric moisture. The Ply-I cells differ from aqueous I−/I3− DSSCs in which the I−/I3− species are dissolved in water.40,41
N peak at 2250 cm−1 in the Ply-I spectrum indicates that Ply-I is free of MeCN. The peak appears in the Liq-I spectrum. Traces peaks of MeCN are also identified in the DMPIII + I2 and LiI + I2, due to the preparation of these samples taking place just before the IR measurement. On the other hand, a broad distinctive peak at 3200–3600 cm−1 is seen in Ply-I, DMPII + I2 and LiI + I2. The peak can be assigned to the –OH stretching in water molecules. The water was likely adsorbed from the air during the measurement, as DMPII and LiI are both hygroscopic. In fact, the DMPII and LiI spectra in Fig. 7(b) show only the peaks assigned to water. However, additional peaks associated to C–H bonding appear especially when DMPII is reacted with I2 (Fig. 7(a)). These new peaks are reflected in the Ply-I. The appearance of new peaks by simply mixing the raw ingredients may be an indication that the water uptake is lower in the Ply-I compared to the raw DMPII and LiI. Although solid conclusions cannot be drawn at this point due to the lack of quantitative interpretation, the stability of the Ply-I indicates its low sensitivity to atmospheric moisture. The Ply-I cells differ from aqueous I−/I3− DSSCs in which the I−/I3− species are dissolved in water.40,41
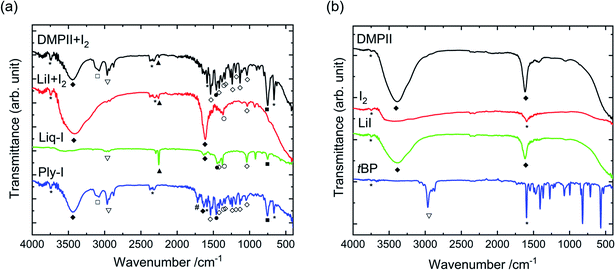 | ||
| Fig. 7 IR spectra of (a) DMPII + I2, LiI + I2, Liq-I, Ply-I and (b) DMPII, I2, LiI, and tBP. The peak assignments are listed in Table S2.† For the samples DMPII + I2 and LiI + I2, 0.6 M DMPII (or 0.1 M LiI) and 0.05 M I2 in MeCN was placed on the IR instrument and dried on place before the measurement. | ||
Ply-I network in the DSSC
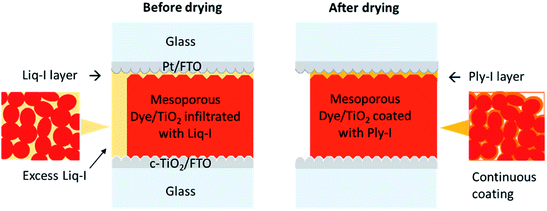
The cross-section FIB-SEM image of an opened Ply-I DSSC is shown in Fig. S12.† Iodine is observed throughout from the top surface to the vicinity of the FTO layer in the energy dispersive X-ray spectroscopy image. The image confirms that the Ply-I is evenly distributed in the sensitized-TiO2 mesoporous network to allow optimal performance. From the above finding, we propose the schematic architecture of Liq-I and Ply-I DSSC as in Fig. 8. In addition to the suggested model by Cao et al.,26 we observe a recognisable thin layer of Liq-I or Ply-I between the counter electrode and dye-sensitized TiO2 (Fig. S13(a)†). J–V measurements of an assembled cell before injecting the electrolyte revealed that the Pt/FTO electrode and sensitized TiO2 are in weak but negligible contact, indicating the existence of a narrow gap (Fig. S13(b)†). The Liq-I (or Ply-I) can infiltrate this gap and prevent electrical shunting during the operation of the cell. Our result appears to be different from the outcomes in previous studies; the fact that the Pt cathode worked in the spacer-free architecture might be related to the softer pressure applied to the electrodes during the assembly of the cell.26,33Another fact that needs to be considered is why Ply-I DSSCs are functional while the normal belief is that I−/I3− liquid-state DSSCs will stop operating once the electrolyte has dried out. The difference, we believe, should be related to the controllability of the electrolyte drying process (i.e. route and speed).
Uncontrolled drying will often cause the electrolyte to dry out in a manner whereby the solid species would not remain between the cathode and the sensitized-TiO2 to bridge the charges. For instance, the Liq-I injection hole should be placed in an appropriate position such that the solvent is drawn towards the active area, letting the solid species cover the mesoporous network instead of going to the edges of the glass. In our case, the hole was positioned near the boundary of the active area. If the excess Liq-I species, initially located outside the active area, accumulate on top of the mesoporous network during the drying process then this may prevent the generation of voids caused by the shrinkage of the Liq-I to a minimum. An example of a DSSC before and after drying is shown in Fig. S13(c).† The drying speed may also matter. Accelerated drying of the Liq-I by heating at 50 °C or simply leaving it exposed to ambient air results in a gel with a dark yellow colour that resembles the Ply-I. However, Raman spectra revealed that less higher-order polyiodides are present in these gels (Fig. S14†). Accelerated drying also tends to initiate unwanted aggregation, cracks or voids, increasing the number of grain boundaries or discontinuous interfaces that would contribute to higher charge transport resistance. Within the mesoporous TiO2 film, a thin continuous amorphous coating of Ply-I should suffice for efficient charge transport by the Grotthuss mechanism. Slow drying is likely to facilitate the formation of such a layer, analogous to the findings by Freitag et al.15
Charge transport properties in the Ply-I DSSC
The mechanism of the Ply-I DSSC was further investigated by electrochemical impedance spectroscopy. Fig. 9 shows the Nyquist plots at 1 sun for the Liq-I DSSC, Ply-I (peak) DSSC and Ply-I (stb.) DSSC. The Bode phase and magnitude plots are described in Fig. S15.† There are two noticeable semicircles in the Nyquist plots, where the one at higher frequencies (Z′ ∼ 20–30 Ω) (Region 1) is associated with the Pt/Ply-I (or Pt/Liq-I) interface, while the one at lower frequencies (Z′ > 30 Ω) (Region 2) is associated with the TiO2/Ply-I (or TiO2/Liq-I) interface. No distinct semicircles assignable to the RC element of the Ply-I (or Nernst-diffusion of the Liq-I) (Region 3) were identified in the plotted curves. The absence of this region in the Nyquist plot has been reported for a glue-based Cu+/Cu2+ electrolyte DSSC, where the authors related the phenomenon to the reduced thickness of the electrolyte layer compared to a DSSC using a μm-thick spacer.26 We assume that the same theory can be applied to our glue-based Liq-I DSSCs and Ply-I DSSCs. The phenomenon demonstrates the efficient charge transport and regeneration in Ply-I.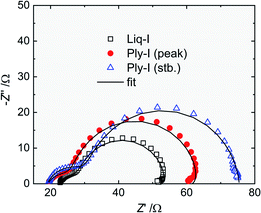 | ||
| Fig. 9 Nyquist plots of the Liq-I DSSC and Ply-I DSSC under 1 sun illumination. The solid lines are the fitted curves using the equivalent circuit in Fig. S16.† | ||
Based on our observations, the plots were fitted using the equivalent circuit shown in Fig. S16.† The model was constructed based on a simplified circuit proposed by Cao et al.42 For the Liq-I DSSC and Ply-I (peak) DSSC, an additional LRrec2 element was placed in parallel with the RrecCμ element to match the inductive loop observed at the tail of the Nyquist plots (<∼1 Hz). Appearance of this loop in a solar cell at forward bias and low frequency is an indication of an additional recombination pathway from the TiO2 to the other layers.43 In our case, this could be the recombination between the dye/TiO2 and Pt cathode, as supported by the very weak photocurrent arising in the DSSC in the absence of the electrolyte (Fig. S13†). It is interesting to note, however, that the inductive behaviour disappears once the Ply-I DSSC is stabilized. This suggests that some modification of the interfaces has occurred through the evolvement from Liq-I to Ply-I.
The values from the fitting are summarized in Table 2. The rise in RPt from Liq-I to Ply-I may be due to the slightly poorer attachment of Ply-I to the Pt/FTO counter electrode due to pinholes created during the evaporation of the solvent. Extra resistance at this interface can slow the dye regeneration thus lower the ff and JSC. Optimising the drying process (e.g. speed) should improve these parameters. The electron lifetime (τe) of the TiO2 conduction band electrons was estimated from the fitted Rrec and Cμ values, i.e. τe = Rrec × Cμ. The electron lifetime extends from Liq-I to Ply-I, mainly due to the rise in Rrec. The trend explains the increase in VOC from Liq-I to Ply-I (peak). The slight VOC drop to Ply-I (stb.), however, suggests that either the TiO2 conduction band edge or the HOMO of the Ply-I (or redox potential of Liq-I) has shifted towards lowering the VOC. It is likely that the potential of Ply-I has shifted towards higher energy due to the stronger intermolecular interactions in the solid-state. This is supported by the narrower optical gap observed for Ply-I compared to Liq-I as described earlier. In summary, the increase in RPt leads to lower JSC and ff, while the extended electron lifetime and change in energy alignment lead to small fluctuations of the VOC, keeping it a rather constant value overall.
| Liq-I | Ply-I (peak) | Ply-I (stb.) | |
|---|---|---|---|
| R Pt [Ω] | 6.65 | 7.90 | 12.1 |
| C Pt [μF] | 13.0 | 12.0 | 7.21 |
| R rec [Ω] | 25.0 | 36.6 | 44.3 |
| C μ [μF] | 173 | 184 | 182 |
| τ e [ms] | 4.32 | 6.73 | 8.06 |
Conclusions
In this study, we challenged the common belief that a standard I−/I3− DSSC will stop operating once the electrolyte has “dried out.” Solid-state DSSCs with good efficiency and excellent stability were obtained when the electrolyte solvent of a I−/I3− cell was slowly evaporated in a controlled manner. The as-prepared solid hole conductor (Ply-I) was confirmed to have different properties from the liquid electrolyte (Liq-I) such as higher optical absorption, dynamic photo-responsive J–V characteristics, and higher order polyiodides in the structure. From the dark-storage stability tests, the Ply-I DSSC was found to have no loss in performance for a period up to 10 months totally unsealed, suggesting that it may operate for a sufficiently long time in real-life conditions with proper encapsulation. The Ply-I DSSC with 5T dye can reach a maximum peak PCE = 5.2% and stabilized PCE = 5.0%, close to the corresponding standard Liq-I DSSC with maximum PCE = 5.7%, but with higher stability. Although the protocol to achieve high performance Ply-I cells with good reproducibility is yet to be optimized, the simplicity of the materials and methods used to obtain these cells, along with the peculiar characteristics they display should provoke high scientific interest. Studies on further device optimization and comprehension of the operation mechanism may lead the DSSC field to new horizons. Some important future directions include investigation on the optimal amount of iodine in the precursor Liq-I, as well as to conclude whether the adsorbed water from the air has any influence on the performance of the Ply-I DSSC.Conflicts of interest
There are no conflicts to declare.Acknowledgements
The authors acknowledge the Centre for Plastic Electronics (CPE) access to their IPCE facility. The authors thank Dr M. Planells for providing the 5T dye and Dr A. Gromov for providing access to the Raman spectroscopy instrument. The authors acknowledge the use of the FIB-SEM bought with the EPSRC grant EP/P030564/1 and Dr Thomas Glen for help with the image acquisition. ET thanks S. Hunter and Dr H. Benjamin for the assistance and helpful discussions for some of the work presented in the study. ET acknowledges JASSO for a PhD studentship. Finally, the authors are grateful to the reviewers for their insights and discussions on the original manuscript.References
- H. Gerischer, M. E. Michel-Beyerle, F. Rebentrost and H. Tributsch, Electrochim. Acta, 1968, 13, 1509–1515 CrossRef CAS.
- H. Tsubomura, M. Matsumura, Y. Nomura and T. Amamiya, Nature, 1976, 261, 402–403 CrossRef CAS.
- B. O'Regan and M. Grätzel, Nature, 1991, 353, 737–740 CrossRef.
- G. Boschloo and A. Hagfeldt, Acc. Chem. Res., 2009, 42, 1819–1826 CrossRef CAS.
- J. Wu, Z. Lan, J. Lin, M. Huang, Y. Huang, L. Fan and G. Luo, Chem. Rev., 2015, 115, 2136–2173 CrossRef CAS.
- L. Schmidt-mende, U. Bach, R. Humphry-baker, T. Horiuchi, H. Miura, S. Ito, S. Uchida and M. Grätzel, Adv. Mater., 2005, 17, 813–815 CrossRef CAS.
- N. Kato, S. Moribe, M. Shiozawa, R. Suzuki, K. Higuchi, A. Suzuki, M. Sreenivasu, K. Tsuchimoto, K. Tatematsu, K. Mizumoto, S. Doi and T. Toyoda, J. Mater. Chem. A, 2018, 6, 22508–22512 RSC.
- P. Liu, B. Xu, K. M. Karlsson, J. Zhang, N. Vlachopoulos, G. Boschloo, L. Sun and L. Kloo, J. Mater. Chem. A, 2015, 3, 4420–4427 RSC.
- S.-H. Park, J. Lim, I. Y. Song, J.-R. Lee and T. Park, Adv. Energy Mater., 2014, 4, 1300489 CrossRef.
- W. Kubo, K. Murakoshi, T. Kitamura, S. Yoshida, M. Haruki, K. Hanabusa, H. Shirai, Y. Wada and S. Yanagida, J. Phys. Chem. B, 2001, 105, 12809–12815 CrossRef CAS.
- J. T. Park, W. S. Chi, D. K. Roh, S. H. Ahn and J. H. Kim, Adv. Funct. Mater., 2013, 23, 26–33 CrossRef CAS.
- J. E. Kroeze, N. Hirata, L. Schmidt-mende, C. Orizu, S. D. Ogier, K. Carr, M. Grätzel and J. R. Durrant, Adv. Funct. Mater., 2006, 16, 1832–1838 CrossRef CAS.
- L. Schmidt-Mende and M. Grätzel, Thin Solid Films, 2006, 500, 296–301 CrossRef CAS.
- Z. Huo, L. Wang, L. Tao, Y. Ding, J. Yi, A. Alsaedi, T. Hayat and S. Dai, J. Power Sources, 2017, 359, 80–87 CrossRef CAS.
- M. Freitag, Q. Daniel, M. Pazoki, K. Sveinbjörnsson, J. Zhang, L. Sun, A. Hagfeldt and G. Boschloo, Energy Environ. Sci., 2015, 8, 2634–2637 RSC.
- W. Zhang, Y. Wu, H. W. Bahng, Y. Cao, C. Yi, Y. Saygili, J. Luo, Y. Liu, L. Kavan, J. E. Moser, A. Hagfeldt, H. Tian, S. M. Zakeeruddin, W.-H. Zhu and M. Grätzel, Energy Environ. Sci., 2018, 11, 1779–1787 RSC.
- H. Michaels, M. Rinderle, R. Freitag, I. Benesperi, T. Edvinsson, R. Socher, A. Gagliardi and M. Freitag, Chem. Sci., 2020, 11, 2895–2906 RSC.
- T. He, Y. F. Wang and J. H. Zeng, ACS Appl. Mater. Interfaces, 2015, 7, 21381–21390 CrossRef CAS.
- J. V. Vaghasiya, K. K. Sonigara, J. Prasad, T. Beuvier, A. Gibaud and S. S. Soni, J. Mater. Chem. A, 2017, 5, 5373–5382 RSC.
- P. Liu, J. M. Gardner and L. Kloo, Chem. Commun., 2015, 51, 14660–14662 RSC.
- N. Agmon, Chem. Phys. Lett., 1995, 244, 456–462 CrossRef CAS.
- N. Papageorgiou, Y. Athanassov, M. Armand, P. Bonhôte, H. Pettersson, A. Azam and M. Grätzel, J. Electrochem. Soc., 1996, 143, 3099–3108 CrossRef CAS.
- M. A. Petit, A. H. Soum, M. Leclerc and R. E. Prud'Homme, J. Polym. Sci., 1987, 25, 423–433 CrossRef CAS.
- H. Yu, L. Yan, Y. He, H. Meng and W. Huang, Chem. Commun., 2017, 53, 432–435 RSC.
- P. Tomasz, M. Ernst, D. Zimmer, P. Macchi and N. Casati, Angew. Chem., Int. Ed., 2019, 58, 6625–6629 CrossRef.
- Y. Cao, Y. Liu, M. Zakeeruddin, A. Hagfeldt and M. Grätzel, Joule, 2018, 2, 1108–1117 CrossRef CAS.
- M. Planells, A. Abate, H. J. Snaith and N. Robertson, ACS Appl. Mater. Interfaces, 2014, 6, 17226–17235 CrossRef CAS.
- S. Ito, T. N. Murakami, P. Comte, P. Liska, C. Grätzel, M. K. Nazeeruddin and M. Grätzel, Thin Solid Films, 2008, 516, 4613–4619 CrossRef CAS.
- E. Tanaka, H. Michaels, M. Freitag and N. Robertson, J. Mater. Chem. A, 2020, 8, 1279–1287 RSC.
- S. Ito, M. K. Nazeeruddin, P. Liska, P. Comte, R. Charvet, P. Péchy, M. Jirousek, A. Kay, S. M. Zakeeruddin and M. Grätzel, Prog. Photovoltaics, 2006, 14, 589–601 CAS.
- M. V. Khenkin, E. A. Katz, A. Abate, G. Bardizza, J. J. Berry, C. Brabec, F. Brunetti, V. Bulović, Q. Burlingame, A. Di Carlo, R. Cheacharoen, Y.-B. Cheng, A. Colsmann, S. Cros, K. Domanski, M. Dusza, C. J. Fell, S. R. Forrest, Y. Galagan, D. Di Girolamo, M. Grätzel, A. Hagfeldt, E. von Hauff, H. Hoppe, J. Kettle, H. Köbler, M. S. Leite, S. Liu, Y.-L. Loo, J. M. Luther, C. Q. Ma, M. Madsen, M. Manceau, M. Matheron, M. McGehee, R. Meitzner, M. K. Nazeeruddin, A. F. Nogueira, Ç. Odabaşı, A. Osherov, N.-G. Park, M. O. Reese, F. De Rossi, M. Saliba, U. S. Schubert, H. J. Snaith, S. D. Stranks, W. Tress, P. A. Troshin, V. Turkovic, S. Veenstra, I. Visoly-Fisher, A. Walsh, T. Watson, H. Xie, R. Yıldırım, S. M. Zakeeruddin, K. Zhu and M. Lira-Cantu, Nat. Energy, 2020, 5, 35–49 CrossRef.
- B. Ecker, H.-J. Egelhaaf, R. Steim, J. Parisi and E. von Hauf, J. Phys. Chem. C, 2012, 116, 16333–16337 CrossRef CAS.
- R. García-Rodríguez, R. Jiang, E. J. Canto-Aguilar, G. Oskam and G. Boschloo, Phys. Chem. Chem. Phys., 2017, 19, 32132–32142 RSC.
- I. Jerman, V. Jovanovski, A. Š. Vuk, S. B. Hočevar, M. Gaberšček, A. Jesih and B. Orel, Electrochim. Acta, 2008, 53, 2281–2288 CrossRef CAS.
- G. N. R. Tripathi, R. H. Schuler and R. W. Fessenden, Chem. Phys. Lett., 1985, 113, 563–568 CrossRef CAS.
- K. R. Loos and A. C. Jones, J. Phys. Chem., 1974, 78, 2306–2307 CrossRef CAS.
- D. Tristant, P. Puech and I. C. Gerber, Phys. Chem. Chem. Phys., 2015, 17, 30045–30051 RSC.
- M. A. Tadayyoni, P. Gao and M. J. Weaver, J. Electroanal. Chem., 1986, 198, 125–136 CrossRef CAS.
- S. Wang, Z. Huang, X. Wang, Y. Li, M. Günther, S. Valenzuela, P. Parikh, A. Cabreros, W. Xiong and Y. S. Meng, J. Am. Chem. Soc., 2018, 140, 16720–16730 CrossRef CAS.
- C. Law, S. C. Pathirana, X. Li, A. Y. Anderson, P. R. F. Barnes, A. Listorti, T. H. Ghaddar and B. C. O'Regan, Adv. Mater., 2010, 22, 4505–4509 CrossRef CAS.
- F. Bella, L. Porcarelli, D. Mantione, C. Gerbaldi, C. Barolo, M. Grätzel and D. Mecerreyes, Chem. Sci., 2020, 11, 1485–1493 RSC.
- Y. Cao, Y. Saygili, A. Ummadisingu, J. Teuscher, J. Luo, N. Pellet, F. Giordano, S. M. Zakeeruddin, J.-E. Moser, M. Freitag, A. Hagfeldt and M. Grätzel, Nat. Commun., 2017, 8, 15390 CrossRef.
- I. Mora-Seró, J. Bisquert, F. Fabregat-Santiago, G. Garcia-Belmonte, G. Zoppi, K. Durose, Y. Proskuryakov, I. Oja, A. Belaidi, T. Dittrich, R. Tena-Zaera, A. Katty, C. Lévy-Clément, V. Barrioz and S. J. C. Irvine, Nano Lett., 2006, 6, 640–650 CrossRef.
Footnote |
| † Electronic supplementary information (ESI) available: Cell fabrication procedures; JV-curves; cell statistics; transient and light-soaking effects; XRD, Raman of polyiodide and precursors; FIB-SEM of cell; EIS. See DOI: 10.1039/d0ta07377f |
| This journal is © The Royal Society of Chemistry 2020 |

