 Open Access Article
Creative Commons Attribution 3.0 Unported Licence
Bayesian-optimization-guided experimental search of NASICON-type solid electrolytes for all-solid-state Li-ion batteries†
Maho
Harada
a,
Hayami
Takeda
 *ab,
Shinya
Suzuki
c,
Koki
Nakano
 ad,
Naoto
Tanibata
 ab,
Masanobu
Nakayama
 *abcde,
Masayuki
Karasuyama
 cef and
Ichiro
Takeuchi
 ceg
ceg
aDepartment of Advanced Ceramics, Nagoya Institute of Technology, Gokiso, Showa, Nagoya, Aichi 466-8555, Japan. E-mail: h.takeda.209@nitech.jp; masanobu@nitech.ac.jp; Tel: +81-52-735-5189
bUnit of Elements Strategy Initiative for Catalysts & Batteries (ESICB), Kyoto University, Katsura, Saikyo-ku, Kyoto 615-8520, Japan
cDepartment of Computer Science, Nagoya Institute of Technology, Gokiso-cho, Showa-ku, Nagoya, Aichi 466-8555, Japan
dDepartment of Frontier Materials, Nagoya Institute of Technology, Gokiso, Showa, Nagoya, Aichi 466-8555, Japan
eMaDiS/CMi2, National Institute for Materials Science (NIMS), 1-2-1, Sengen, Tsukuba, Ibaraki 305-0047, Japan
fJapan Science and Technology Agency, PRESTO, 4-1-8 Honcho, Kawaguchi, Saitama 332-0012, Japan
gRIKEN Center for Advanced Intelligence Project, 1-4-1 Nihonbashi, Chuo-ku, Tokyo 103-0027, Japan
First published on 23rd July 2020
Abstract
Divalent- or trivalent-metal-oxide-doped NASICON-type LiZr2(PO4)3 (LZP) is an attractive oxide-based solid electrolyte for all-solid-state Li-ion batteries owing to its high Li-ion conductivity and stable charge–discharge cycling. Using an extensive experimental approach, the composition of CaO- and Y2O3-co-doped Li-rich NASICON-type LZP of the composition Li1+x+2yZr2−x−yYxCay(PO4)3 (0 ≦ x ≦ 0.376, 0≦ y ≦ 0.376) was optimized. A number of 49 compositions were synthesized and their crystal structures, relative density of the sintered material, and Li-ion conductivity characterized. The co-doped compositions had a higher Li-ion conductivity than those doped with CaO or Y2O3 alone. Furthermore, diffraction studies revealed that two phases and an impurity phase existed depending on the composition. Adding CaO significantly changed the relative density of the sintered material. Thus, to identify compositional dependencies among the Li-ion conductivity, phase stability, and relative density was complicated, and intuitively searching for the best composition was difficult. As a proof-of-concept, the collected data were used to demonstrate that the Bayesian optimization (BO) significantly improved the experimental search for the best oxide-based electrolyte composition. Multi-objective BO (MOBO), which considers more than two target performances, was also carried out. It was validated that the BO-guided experimental search determined more rapidly the best composition compared to conventional trial-and-error approaches employed in the materials industry.
Introduction
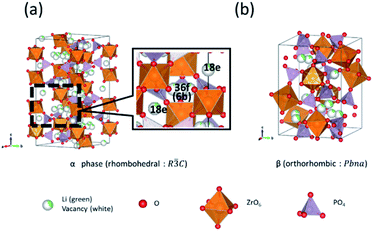
With the increasing popularity of electric vehicles, batteries with improved energy density and safety are required.1,2 Liquid electrolytes are commonly used in Li-ion batteries. However, their flammability poses safety concerns, and replacements with non-flammable solid electrolytes to fabricate all-solid-state Li-ion batteries are urgently needed for improving safety and increasing energy density.3,4 Solid electrolytes have lower ionic conductivities than liquid electrolytes; to address this, methods to prepare solid electrolyte materials with high ionic conductivities are actively explored.5–7Recently, NASICON-type oxide-based solid electrolytes attracted considerable interest due to their high Li-ion conductivity.8,9 Li1.3Al0.3Ti1.7(PO4)3 (LATP), prepared based on LiTi2(PO4)3 (LTP),10,11 is a well-known NASICON-type solid electrolyte that builds on the advantages of LTP, such as high conductivity and stability under ambient conditions.12 However, materials based on LTP suffer from instability associated with the contact of the Li metal at the negative electrode because of the Ti3+/Ti4+ redox reaction.13 Recently, the NASICON-type LiZr2(PO4)3 (LZP)14–16 displayed a wide potential window that can withstand up to 5.5 V during contact with the negative Li metal electrodes. LZP has four crystal phases at different temperatures, α-, α′-, β-, and β′-phases.17–21 The α- and β-phase appear when the sintering temperature is higher and lower than 1100 °C, respectively. During the cooling process, the α-phase changes to the α′-phase at 40 °C (Fig. 1(a)), and the β-phase changes to the β′-phase at 300 °C (Fig. 1(b)). Among these four crystal phase types with stoichiometric composition, the α-phase exhibits the highest total Li-ion conductivity of 1.63 × 10⁻⁶ S cm−1 at room temperature.22–24 Li ions in the α-phase diffuse between the 36f sites (periphery of the 6b site), and between the stable site and the 18e metastable site, according to literature (Fig. 1(a)).25
The replacement of the Zr4+ ions of LZP with lower valent cations, such as Ca2+ or Y3+, led to the formation of interstitial Li ions, which improved the Li-ion conductivity.26–28 Among the Ca-doped Li1+2xZr2−xCax(PO4)3 solid-solutions synthesized using solid-state reactions, Li1.2Zr1.9Ca0.1(PO4)3 showed the highest total Li-ion conductivity of 4.9 × 10⁻⁵ S cm−1 at room temperature.29 Similarly, among the LZP families, the Y-doped compositions of Li1+xZr2−xYx(PO4)3 (0.1 ≦ x ≦ 0.2) prepared by spark plasma sintering (SPS) displayed the highest total Li-ion conductivity of 7.1 × 10⁻⁵ S cm−1 at room temperature.17,30 Recently, we ascribed the higher Li-ion conductivity of Li-rich NASICON-type electrolytes to a pushing-out mechanism based on ab initio molecular dynamics (AIMD), which involves the coulombic-repulsion-driven pushing of the Li ions by interstitial Li ions, triggering a cascading Li-ion push-out.31,32 However, it was also reported that the Li-ion conductivity decreases in compositions comprising larger ratios of Ca (x ≧ 0.2 in Li1+2xZr2−xCax(PO4)3),29,31 which is caused by the trapping of the Li ions around Ca2+ due to coulombic attraction between the two defects, the interstitial Li (Lii) and doped Ca (CaZr) ions. Similar composition-dependent ion conduction behaviour was also reported for Y-doped compounds. Therefore, several factors affect the Li-ion conductivity in the Li-rich NASICON-type compounds, which suggest the existence of higher Li-ion conductivity in Ca/Y co-doped compounds of Li1+2x+yCaxYyZr2−x−y(PO4)3 compositions.
In this study, optimizations to determine the composition with the highest Li-ion conductivity among the co-doped Li1+x+2yZr2−x−yYxCay(PO4)3 compositions (0 ≦ x ≦ 0.376, 0 ≦ y ≦ 0.376) were carried out. A total of 49 compositions, with the Ca and Y ratios divided at equal intervals, were synthesized, and their Li-ion conductivities evaluated. In addition, as a proof-of-concept study the suitability of the Bayesian optimization (BO) approach33–37 to efficiently explore the optimal composition was demonstrated. BO allows more efficient sampling than the conventional random sampling approach and enables the accelerated determination of the optimized composition. A faster, more robust composition optimization for Li-ion conducting materials will be possible in future by validating the BO approach in this study. While several studies used BO to determine optimal compositions using experimental data,37–40 these studies did not involve Li-ion conductors. In addition, we performed multi-objective Bayesian optimization (MOBO) to optimize more than one function in this study.
Methods
A total of 49 compositions of Li1+x+2yZr2−x−yYxCay(PO4)3 (0 ≦ x ≦ 0.376, 0 ≦ y ≦ 0.376) were prepared using a conventional solid-state reaction.25 Li2CO3 (Kojundo Chemical Laboratory Co., Ltd.), ZrO2 (Kishida Chemicals Co., Ltd.), CaCO3 (Kishida Chemicals Co., Ltd.), Y2O3 (Kojundo Chemical Laboratory Co., Ltd.), and NH4H2PO4 (Wako Pure Chemical Industries, Ltd.) were used as starting materials. Stoichiometric amounts of the starting materials were mixed in an agate mortar and pressed into a pellet. The pellet was heated in air at 1100 °C for 24 h, after preliminary treatment at 200 °C and 800 °C for 6 h, respectively. The obtained samples were crushed and pelletized under uniaxial pressing at 127 MPa. The pellets were sintered in air at 1200 °C for 18 h, and powder XRD patterns were measured for phase identifications of the obtained sintered samples. A significant decrease in sample weight (>2 wt%) was noted at 1250 °C, which indicated the vaporization of Li2O and P2O5 components. Since vaporization caused poor experimental reproducibility, the sintering temperature was decreased to 1200 °C, where a significant sample weight reduction was not observed. The sintered pellets were polished with emery paper, and gold was sputtered on the pellets for use as electrodes. The electrical conductivity measurements at 30, 60, and 90 °C were carried out using a complex AC impedance technique at frequencies ranging from 1 Hz to 1 MHz.41 The activation energy of the lithium conductivity was estimated from Arrhenius plots of measured Li-ion conductivity.We conducted BO to search for the composition that showed the best ion conductivity properties among the experimentally evaluated samples. The conductivities at 30, 60, and 90 °C and the activation energies were selected as variables, and the compositions x and y were considered as descriptors (explanatory variables) in Li1+x+2yZr2−x−yYxCay(PO4)3 (0 ≦ x ≦ 0.376, 0 ≦ y ≦ 0.376) for BO. The random and the BO search were performed 1000 times each, and the average numbers of observations required to reach the optimal solution were compared. A GP model is embedded in the present BO method, and the expected improvement (EI) strategy was chosen to obtain the acquisition function.
Results and discussion
Phase identification
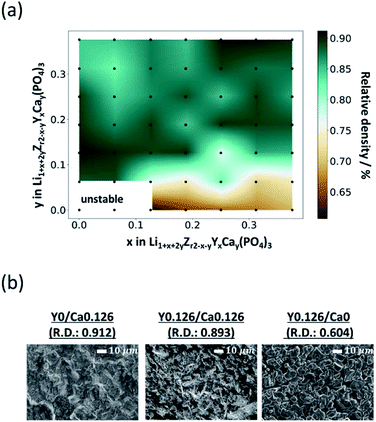
Among the 49 sintered pellets with different compositions obtained after heating at 1200 °C for 18 h, the compositions of LiZr2(PO4)3 and Li1.062Y0.062Zr1.938(PO4)3 (referred to as Y0/Ca0 and Y0.062/Ca0) were not mechanically stable due to insufficient densification. Thus, 47 sintered pellets are further discussed.The relative densities, which is the ratio of the bulk density to the theoretical density of the sintered pellets at room temperature, are shown in Fig. 2(a). The relative density was less than 80% for most of the compositions with y ≦ 0.062 in Li1+xZr2−xYx(PO4)3. Fig. 2(b) shows the SEM images of the sintered pellets with the compositions Y0/Ca0.126, Y0.126/Ca0.126, and Y0.126/Ca0. The Ca-containing compounds Y0/Ca0.126 and Y0.126/Ca0.126 displayed unclear grain boundary images, indicating that the neck growth process progressed sufficiently. The relative densities of these two compositions were about 90%. On the other hand, the grain boundary and void images were clearly visible for the sample that did not contain Ca (Y0.126/Ca0), and the relative density was only 60.4%, which indicates that Ca has a sintering-aid effect.
Fig. 3 displays the results of X-ray diffraction (XRD) crystal structure identifications for each pellet composition. Although all samples were sintered at the heating condition described in literature for forming α-phases,25 it was observed that β-phases formed depending on the composition. For example, α- and β-phases were formed for the Y0.062/Ca0.062 and Y0.312/Ca0.188 compositions, respectively, as displayed in Fig. 3(a) and (b). The phase ratios of the prepared samples were investigated using XRD pattern analyses using the PDXL software,42 as shown in Fig. 3(c). The yttrium-rich compositions with y > 0.2 in Li1+x+2yZr2−x−yYxCay(PO4)3 tended to form β-phases, whereas α-phase structures appeared in the composition regions of x > y and y < 0.2.
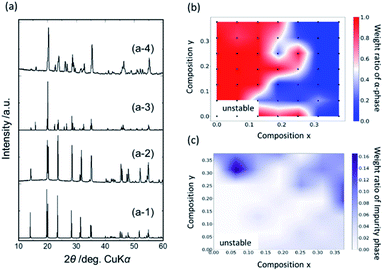 | ||
| Fig. 3 XRD profiles for selected compositions (a-2) Y0.062/Ca0.062 and (a-4) Y0.312/Ca0.188. Calculated XRD profiles for reported crystal structures of α- and β-phase are also shown in profiles (a-1)16 and (a-3).20 Heat map of (b) weight ratio of α-phase and (c) impurity phases for synthesized Li1+x+2yZr2−x−yYxCay(PO4)3. | ||
Fig. 3(c) shows the ratio of the impurity phases that corresponded to neither an α- nor a β-phase and which was estimated using the reference intensity ratio (RIR) method.43 Most impurity phases are ascribed to YPO4 and Li3PO4 for the Y- and Ca-rich composition regions, respectively. Further, the impurity phases were mainly observed for highly doped compositions, indicating the solubility limit of Ca and/or Y ions, and the formation of these impurity phases caused a reduction of the ionic conductivity. Small amounts of impurity phases appeared even in the low-doping concentration regions, when the composition was at the border of the α- or β-phase region.
Conductivity analysis
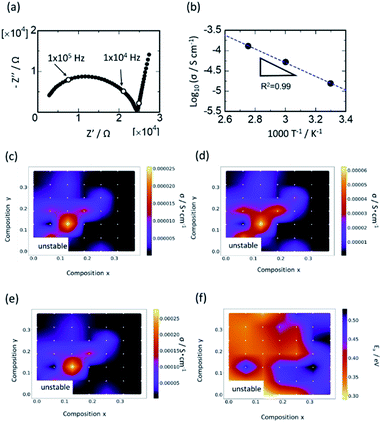
Typical complex AC impedance plots at 30 °C for the composition Y0.062/Ca0.062 are shown in Fig. 4(a). A slightly distorted single semicircle curvature was observed in the higher frequency range and low-frequency spike, which was almost vertical against the real part impedance axis. The low-frequency spike corresponds to capacitance at the interface between the electrolyte and irreversible (gold) electrode. The capacitance for the high-frequency semicircle ranged from 10−11 to 10−10 F, which corresponds to the capacitance for bulk and/or grain boundary resistance. The distorted shape observed for all compositions in the high-frequency semicircle might indicate the presence of both bulk and grain boundary resistances. Nevertheless, it was difficult to distinguish the grain and grain boundary derived resistances due to the overlapping of the two semicircles. Therefore, for subsequent analyses, the total resistances (sum of bulk and grain boundary resistances) were evaluated by applying the least-squares method to the semicircles. Fig. 4(b) shows the Arrhenius plots of the total ionic conductivity of Y0.062/Ca0.062. The semicircles in the impedance plots and the linear function in the Arrhenius plots fitted well in the entire composition range of this study. For example, R2, the coefficient of determination for the linear fit in the Arrhenius plots, was less than 0.98, indicating that reasonable fitting was performed.Fig. 4(c) summarizes the ionic conductivity of Li at 30, 60, and 90 °C and the activation energies for each composition are plotted as 2-dimensional heatmaps. The composition with the highest conductivity was Li1.378Zr1.748Y0.126Ca0.126(PO4)3 (Y0.126/Ca0.126) at all temperatures. The conductivity of the composition Y0.126/Ca0.126 at 30 °C was 2.6 × 10⁻⁵ S cm−1, which was ∼4.5 times higher than that of the composition Y0/Ca0.126 and ∼20 times higher than that of the composition Ca0/Y0.126, which corresponded to the highest conductivity among singly doped Ca- and Y-samples, respectively. Thus, co-doping is an attractive strategy to improve ionic conductivity performance, despite the need for exploring a vast search space. The grain-boundary resistance may significantly decrease not only by optimizing the composition, but also by improving the sintering process, using techniques such as cold isostatic pressing (CIP) or hot isostatic pressing (HIP). The heatmap of the activation energy shows a strong correlation with the compositional trend of conductivity except for singly Y-doped compositions. Further, the activation energies for singly Y-doped compositions were relatively small despite the low Li-ion conductivity due to the poor sintering ability in the absence of Ca doping. This may be related to the reported low trapping effect of Y ions in LZP compared to that of Ca ions for the formation of the α-phase. The large grain boundary-derived resistance arising from the poor sintering ability lowers the total Li-ion conductivity, while the migration energies in the bulk or the interface between the grains may be reduced by Y doping and α-phase formation. Accordingly, the variation in the total ionic conductivity is rather complicated due to multiple factors affecting ion conduction behaviour, such as phase stability, trapping effect of doped ions, and sintering ability. This limits the fundamental understanding of the conductivity behaviour and makes its optimization difficult.
Prediction of optimal composition ratio by Bayesian optimization approach
As mentioned in the introduction section, we undertook a verification of the BO approach to demonstrate the efficient optimization of the experimental observations in this study. The BO and random search were performed 1000 times each, and the compositions x and y were the only descriptors used in the Gaussian process (GP) regression.Here, an overview of the sample selection via BO and the EI strategy for the examination of material properties is provided. BO allows more efficient sampling than the conventional random sampling approach and enables the accelerated determination of the optimized composition. The accumulated data obtained from each iteration of experiments were used to train the GP models for improving the prediction of the conductivity or activation energy as a function of the descriptors, which were the compositions x and y. Thereafter, the composition to be evaluated next was determined by two factors. One is the ‘exploitation’ for selecting a composition with a high-expectation value (in this study, high conductivity or low activation energy), and the other is ‘exploration’, which selects a composition with large dispersion from the GP-based prediction of unknown data. The ‘exploitation’ and ‘exploration’ are then leveraged based on the appropriate hyper-parameter setting when selecting the next unknown sampling points (the hyper-parameter settings are updated at each sampling step in this study). Repeating the above samplings, the BO is expected to find the best sampling point by smaller sampling points than random search. Hence, a faster composition optimization for Li-ion conductivity performance will be possible by validating the BO approach in this study.
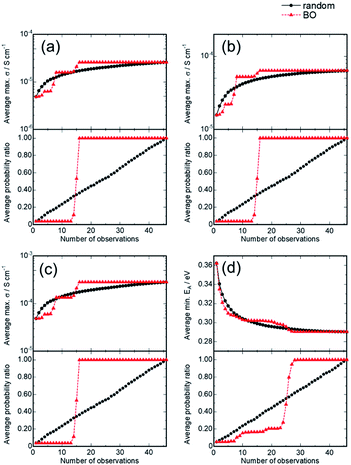
Fig. 5(a) and (b) show the variation in the average for the best properties (conductivities or activation energy) among the observed samples and the discovery probability of the optimized composition x and y, respectively, as a function of the number of experiments (observations).
This statistical analysis suggested that the BO could find the optimal solution after 16 experiments with a failure rate of <0.1% since 16 BO trials always found the best composition for all 1000 BO runs. These results suggest that the BO can determine the optimal solution in about one third the number of times than those required for the random search. Similarly, for ionic conductivities at 60 and 90 °C and the activation energy, BO successfully and efficiently optimized the composition, in contrast to random searching. In addition, a sudden increase in the discovery rate was noticed after exploration schemes, indicating that the BO scheme can be significantly improved by using additional descriptors that correlate to the targeted properties. In addition, the transfer learning technique is beneficial when one develops related compounds, such as Na-ion conductors with NASICON-type structures, as described in our previous study.34 The initial exploration steps in the BO often contain hyper-parameter tuning for BO or GP, so that the succeeding hyper-parameter sets for the related samples may accelerate the searching efficiency.
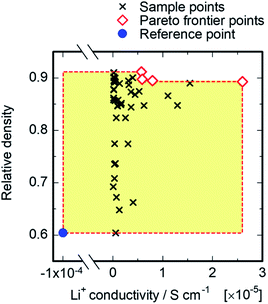
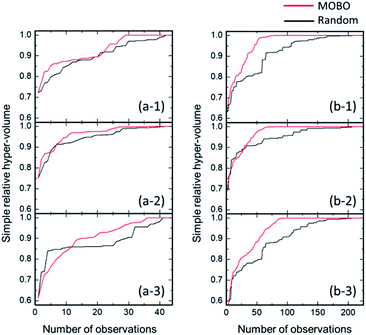
MOBO was attempted next to optimize mechanical and ion conduction performances. In this optimization, the optimal point is not uniquely defined because of the possible trade-off relation among multiple target properties. Instead, most of the algorithms explore the ‘Pareto frontier’ of the objective functions, which is defined as a set of points that cannot be improved without sacrificing any other properties. We referred to the relative density for mechanical properties and ionic conductivity at 30 °C, and the Pareto frontier of both properties were searched. A total of 4 compositions corresponding to the Pareto frontier were explored, as shown in Fig. 6. Neither the relative density nor the conductivity of the four red points in Fig. 6 can be improved without decreasing the other property. For the acquisition function of MOBO, we used an extension of EI44 that evaluates the expected increase of the Pareto hyper-volume, which is defined as the volume of the area under the Pareto frontier, shown as the yellow shaded region in Fig. 6. The panels on the left of Fig. 7 present the MOBO process as a function of the observation numbers. We studied the progress of MOBO to the ‘simple relative hyper-volume’, which represents the normalized area or volume consisting of Pareto frontiers (see details in the ref. 44). Exploring the Pareto frontier revealed that the MOBO search is more efficient than the random approach, even when considering a sample space as small as 47. However, the search space is relatively small in the present MOBO verification, and a further efficiency improvement is expected for the system with larger numbers of candidate-composition combinations. To confirm such a possibility, the search space was extended by increasing the composition combinations from 47 to 225 samples using the Gaussian interpolation of ionic conductivity with artificial noise modifications. The panels on the right of Fig. 7 compare the averaged MOBO performance with the random search and indicate that the optimization efficiency was largely improved for a larger search space. Further, the increase of the sample space from 47 to 225 compositions enhanced the efficiency, and only 89 trials guaranteed a 100% MOBO search, while 213 trials were required for the random search. For comparison purpose, the other multi objective optimization approach based on the non-dominated sorting genetic algorithm II (NSGA-II)45 was performed and a better optimization performance for the present MOBO approach confirmed, as shown in ESI Fig. S1.† Increasing the number of dopants and/or adding processing parameters for the optimization largely expands the search space, however, it often increases the costs and R&D resources. In this context BO minimizes costs in search for the best material. Also, a 3-point MOBO search was conducted, where 3 compositions are simultaneously evaluated in each MOBO iteration. The results presented in ESI Fig. S2† indicated no significant difference between single- and 3-point MOBO. This allows a flexible experimental plan that can utilize available facilities and resources without sacrificing time and cost efficiency.
Conclusions
In this study, we comprehensively evaluated Li-ion conductivity and the bulk and grain boundary contributions of Li1+x+2yZr2−x−yYxCay(PO4)3 (0 ≦ x ≦ 0.376, 0 ≦ y ≦ 0.376) to optimize the compositions x and y. The results revealed that the highest total ion conductivity of 2.60 × 10⁻⁵ S cm−1 at room temperature, including the bulk and grain boundary conduction, was observed for x = 0.126 and y = 0.126. Several factors may contribute to the Li-ion conductivity, such as phase stability of the α- or β-phase, impurity phase formation, and trapping effect of the aliovalent Ca2+ and Y3+ doping cations with respect to the migrating Li ions. Further, we confirmed that the sintering-aid effect of CaO doping might reduce grain boundary resistance. These results indicated that the compositional dependence of Li-ion conductivity is rather complicated, which makes the conventional search for the optimal composition relying on experience and intuition highly challenging.To reduce the number of experiments required for the comprehensive evaluation of the 47 compositions, we demonstrated the suitability of the BO approach for the optimal composition search. We compared the number of experimental observations, and for the BO process the optimal solution was determined with a failure rate < 0.1% compared to that for the random search. These results confirmed that BO predicts the optimal composition using only about one third the number of experiments, which indicated that BO with solely the compositions x and y as the descriptors was able to efficiently predict the total conductivity. In addition, the efficiency of the MOBO approach for the Pareto frontier search of the present data was demonstrated. Unfortunately, the number of experimental observations (47 points) was insufficient for improving the search efficiency. However, MOBO is more effective as the search space becomes larger, such as for compounds with three dopants. In summary, the validity of BO and related techniques for composition optimization was confirmed in this paper.
Author contributions
M. H., H. T., and M. N. conceived and directed the project. M. H. and H. T. conducted experimental synthesis and property measurements. M. H., S. S., K. N., M. K., and I. T. performed Bayesian optimizations. The manuscript was written through contributions of all authors. All authors have given approval to the final version of the manuscript.Conflicts of interest
There are no conflicts to declare.Acknowledgements
This work was partially supported by a Grant-in-Aid for Scientific Research (No. 16H06538, 17H00758, 18H01707, 19H05815 and 20H02436) from the Ministry of Education Culture, Sports, Science and Technology, Japan (MEXT); ‘Elements Strategy Initiative to Form Core Research Center’ from MEXT; the ‘Materials Research by Information Integration’ Initiative (MI2I) project of the ‘Support Program for Starting Up Innovation Hub’ from the Japan Science and Technology Agency (JST); by JST CREST (JPMJCR1502); by JST PRESTO (JPMJPR15N2); and by the RIKEN Center for Advanced Intelligence Project. English language editing was performed by Editage (http://www.editage.com).Notes and references
- R. Van Noorden, Nature, 2014, 507, 26–28 CrossRef CAS PubMed.
- B. Dunn, H. Kamath and J.-M. Tarascon, Science, 2011, 334, 928–935 CrossRef CAS PubMed.
- J. B. Goodenough, J. Solid State Electrochem., 2012, 16, 2019–2029 CrossRef CAS.
- J. B. Goodenough and Y. Kim, Chem. Mater., 2010, 22, 587–603 CrossRef CAS.
- N. Tanibata, Y. Kondo, S. Yamada, M. Maeda, H. Takeda, M. Nakayama, T. Asaka, A. Kitajou and S. Okada, Sci. Rep., 2018, 8, 6–12 CrossRef PubMed.
- M. Nakayama, K. Kanamori, K. Nakano, R. Jalem, I. Takeuchi and H. Yamasaki, Chem. Rec., 2019, 19, 771–778 CrossRef CAS.
- H. Takeda, K. Nakano, N. Tanibata and M. Nakayama, Sci. Technol. Adv. Mater., 2020, 21, 131–138 CrossRef PubMed.
- N. Anantharamulu, K. Koteswara Rao, G. Rambabu, B. Vijaya Kumar, V. Radha and M. Vithal, J. Mater. Sci., 2011, 46, 2821–2837 CrossRef CAS.
- A. Manthiram, X. Yu and S. Wang, Nat. Rev. Mater., 2017, 2, 16103 CrossRef CAS.
- T. Hupfer, E. C. Bucharsky, K. G. Schell, A. Senyshyn, M. Monchak, M. J. Hoffmann and H. Ehrenberg, Solid State Ionics, 2016, 288, 235–239 CrossRef CAS.
- P. Knauth, Solid State Ionics, 2009, 180, 911–916 CrossRef CAS.
- K. Arbi, J. M. Rojo and J. Sanz, J. Eur. Ceram. Soc., 2007, 27, 4215–4218 CrossRef CAS.
- S. Patoux and C. Masquelier, Chem. Mater., 2002, 14, 5057–5068 CrossRef CAS.
- H. Xie, J. B. Goodenough and Y. Li, J. Power Sources, 2011, 196, 7760–7762 CrossRef CAS.
- Y. Li, W. Zhou, X. Chen, X. Lü, Z. Cui, S. Xin, L. Xue, Q. Jia and J. B. Goodenough, Proc. Natl. Acad. Sci. U. S. A., 2016, 113, 13313–13317 CrossRef CAS PubMed.
- S. Xin, Y. You, S. Wang, H. C. Gao, Y. X. Yin and Y. G. Guo, ACS Energy Lett., 2017, 2, 1385–1394 CrossRef CAS.
- H. Xu, S. Wang, H. Wilson, F. Zhao and A. Manthiram, Chem. Mater., 2017, 29, 7206–7212 CrossRef CAS.
- M. Catti, S. Stramare and R. Ibberson, Solid State Ionics, 1999, 123, 173–180 CrossRef CAS.
- M. Catti, A. Comotti and S. Di Blas, Chem. Mater., 2003, 2, 1628–1632 CrossRef.
- M. Catti, N. Morgante and R. M. Ibberson, J. Solid State Chem., 2000, 152, 340–347 CrossRef CAS.
- K. Nakano, Y. Noda, N. Tanibata, M. Nakayama, K. Kajihara and K. Kanamura, RSC Adv., 2019, 9, 12590–12595 RSC.
- H. El-Shinawi, A. Regoutz, D. J. Payne, E. J. Cussen and S. A. Corr, J. Mater. Chem. A, 2018, 6, 5296–5303 RSC.
- S. Kumar and P. Balaya, Solid State Ionics, 2016, 296, 1–6 CrossRef CAS.
- Y. Lai, Z. Sun, L. Jiang, X. Hao, M. Jia, L. Wang and F. Liu, Ceram. Int., 2019, 45, 11068–11072 CrossRef CAS.
- Y. Noda, K. Nakano, H. Takeda, M. Kotobuki, L. Lu and M. Nakayama, Chem. Mater., 2017, 29, 8983–8991 CrossRef CAS.
- H. Xie, Y. Li and J. B. Goodenough, RSC Adv., 2011, 1, 1728 RSC.
- Y. Li, M. Liu, K. Liu and C.-A. Wang, J. Power Sources, 2013, 240, 50–53 CrossRef CAS.
- K. Nakano, Y. Noda, N. Tanibata, H. Takeda, M. Nakayama, R. Kobayashi and I. Takeuchi, APL Mater., 2020, 8, 041112 CrossRef.
- H. Xie, Y. Li and J. B. Goodenough, RSC Adv., 2011, 1, 1728–1731 RSC.
- Y. Li, M. Liu, K. Liu and C. A. Wang, J. Power Sources, 2013, 240, 50–53 CrossRef CAS.
- Y. Noda, K. Nakano, M. Otake, R. Kobayashi, M. Kotobuki, L. Lu and M. Nakayama, APL Mater., 2018, 6, 060702 CrossRef.
- Y. Zhu, X. He and Y. Mo, ACS Appl. Mater. Interfaces, 2015, 7, 23685–23693 CrossRef CAS PubMed.
- M. Nakayama, K. Kanamori, K. Nakano, R. Jalem, I. Takeuchi and H. Yamasaki, Chem. Rec., 2019, 19, 771–778 CrossRef CAS.
- R. Jalem, K. Kanamori, I. Takeuchi, M. Nakayama, H. Yamasaki and T. Saito, Sci. Rep., 2018, 8, 1–10 CrossRef CAS PubMed.
- M. Sumita, R. Tamura, K. Homma, C. Kaneta and K. Tsuda, Bull. Chem. Soc. Jpn., 2019, 92, 1100–1106 CrossRef CAS.
- P. V. Balachandran, B. Kowalski, A. Sehirlioglu and T. Lookman, Nat. Commun., 2018, 9, 1688 CrossRef PubMed.
- E. Brochu, V. M. Cora and N. de Freitas, arXiv preprint arXiv:1012.2599, 2010.
- F. Ren, L. Ward, T. Williams, K. J. Laws, C. Wolverton, J. Hattrick-Simpers and A. Mehta, Sci. Adv., 2018, 4, eaaq1566 CrossRef PubMed.
- A. O. Oliynyk, E. Antono, T. D. Sparks, L. Ghadbeigi, M. W. Gaultois, B. Meredig and A. Mar, Chem. Mater., 2016, 28, 7324–7331 CrossRef CAS.
- P. Raccuglia, K. C. Elbert, P. D. F. Adler, C. Falk, M. B. Wenny, A. Mollo, M. Zeller, S. A. Friedler, J. Schrier and A. J. Norquist, Nature, 2016, 533, 73–76 CrossRef CAS PubMed.
- N. Tanibata, R. Morimoto, K. Nishikawa, H. Takeda and M. Nakayama, Anal. Chem., 2020, 92, 3499–3502 CrossRef CAS PubMed.
- PDXL: integrated X-ray powder diffraction software, Rigaku Global Website Search PubMed.
- F. H. Chung and R. W. Scott, J. Appl. Crystallogr., 1973, 6, 225–230 CrossRef CAS.
- M. T. M. Emmerich, K. C. Giannakoglou and B. Naujoks, IEEE Trans. Evol. Comput., 2006, 10, 421–439 Search PubMed.
- K. Deb, A. Pratap, S. Agarwal and T. Meyarivan, IEEE Trans. Evol. Comput., 2002, 6, 182–197 CrossRef.
Footnote |
| † Electronic supplementary information (ESI) available. See DOI: 10.1039/d0ta04441e |
| This journal is © The Royal Society of Chemistry 2020 |

