
 Open Access Article
 This Open Access Article is licensed under a
 Creative Commons Attribution 3.0 Unported Licence
Multiple diffusion pathways in LixNi0.77Co0.14Al0.09O2 (NCA) Li-ion battery cathodes†
Thomas E.
Ashton
 *a,
Peter J.
Baker
b,
Dustin
Bauer
a,
Alexandra R.
Groves
a,
Carlos
Sotelo-Vazquez
a,
Takashi
Kamiyama
c,
Takeshi
Matsukawa
d,
Kenji M.
Kojima
ef and
Jawwad A.
Darr
a
*a,
Peter J.
Baker
b,
Dustin
Bauer
a,
Alexandra R.
Groves
a,
Carlos
Sotelo-Vazquez
a,
Takashi
Kamiyama
c,
Takeshi
Matsukawa
d,
Kenji M.
Kojima
ef and
Jawwad A.
Darr
a
aDepartment of Chemistry, University College London, 20 Gordon Street, Bloomsbury, London, WC1H 0AJ, UK. E-mail: t.ashton@ucl.ac.uk
bISIS Pulsed Neutron and Muon Source, STFC Rutherford Appleton Laboratory, Harwell Science and Innovation Campus, Didcot, Oxfordshire, OX11 0QX, UK
cMaterials & Life Science Division, J-PARC Center, Tokai, Ibaraki 319-1195, Japan
dFrontier Research Center for Applied Atomic Sciences, Ibaraki University, 162-1, Shirakata, Tokai, Ibaraki 319-1106, Japan
eCentre for Molecular and Materials Science, TRIUMF, 4004 Wesbrook Mall, Vancouver, B.C. V6T 2A3, Canada
fStewart Blusson Quantum Matter Institute, University of British Columbia, 2355 East Mall, Vancouver, B.C. V6T 1Z4, Canada
First published on 18th May 2020
Abstract
Experimental evidence for the presence of two computationally theorised diffusion pathways, namely the oxygen dumbbell hop (ODH) and tetrahedral site hop (TSH), has been given for the first time by muon spin relaxation (µSR) on sub-stoichiometric LixNi0.77Co0.14Al0.09O2. µSR has proven to be a powerful tool that is able to discriminate between diffusion pathways that occur on different timescales on a local level, where bulk electrochemical techniques cannot. Whereas the estimated values of DLi at lithium concentrations of 0.87 and 0.71 were found to be on the order of 10−11 by electrochemical impedance spectroscopy, contributions to diffusion from ODH and TSH were determined to be on the order of 10−11 and 10−10 cm2 s−1, and a factor of four decrease in Ea for both samples, in excellent agreement with theoretical calculations on related compounds. Rietveld refinement of both X-ray and neutron diffraction data was also used to interrogate the local structure of the materials where no contribution from Li+/Ni2+ cation mixing was observed.
Introduction
As the global energy demand continues to rise, increased effort is directed towards the efficient harvesting (particularly from renewables), utilisation and storage of electrical energy to meet the needs of an increasingly urbanised global population and to alleviate the effects of climate change.1,2 Towards the latter goal, the electrification of transport to move away from fossil fuels and linking this to smart charging grids will need development. Commercial rechargeable Lithium Ion Batteries (LIBs) with high energy densities are thus of interest in this regard,3 most notably those with LiCoO2 type layered metal oxide cathodes.4,5 Such layered materials can be doped to improve performance characteristics, e.g. rate capability, operating voltage and structural/thermal stability.Recently, layered, nickel rich LiNi1−xMxO2 materials have been developed as inexpensive and more sustainable high-energy cathodes for secondary Li ion batteries (where x ≥ 0.2 and M is a substituent transition metal or combination of metals). Pure LiNiO2 has shown poor performance as a cathode due to anti-site defects, where Ni2+ species locate in Li 3a sites in the crystal structure and hamper Li+ diffusion.6 Improvement in performance was shown by substituting up to 20 at% Ni for Co, reducing the Li+/Ni2+ cationic disorder and reducing oxygen loss at high states-of-charge and improving safety.7 Further stabilisation strategies include the co-substitution of nickel with cobalt and another third element to form a ternary lithium containing metal oxide (LiNixCoyMzO2, where x + y + z = 1). Where M = Mn, this is known as the widely researched “NMC” family of materials.
Specifically, Al substituted materials such as LiNi0.80Co0.15Al0.05O2 (NCA) are of increasing of interest for commercial battery applications due to its stable operating voltage of 3.8 V versus Li/Li+ and observed gravimetric capacity between 175 and 200 mA h g−1.8 Inclusion of Al in the host structure leads to higher thermal stability and increased electrochemical properties.9–14 Although the macroscopic electrochemical behaviour of NCA has been scrutinised in detail, the fundamental processes governing the operation of these materials is not well understood. Arguably, the most important of these processes remains the diffusion of lithium through the host insertion electrode, as lithium diffusion is ultimately responsible for cell operation. Many complementary techniques have been used to probe the diffusion mechanics; electrochemical (cyclic voltammetry,15 titration techniques16–18 and impedance spectroscopy19), physical (nuclear magnetic resonance20 and muon spin relaxation21–23) and computational methods,24–26 each with their own associated benefits and limitations.
Muon spin relaxation (µSR) has previously been employed to investigate Li+ diffusion in many LIB materials including cathodes and solid-state electrolytes.21–23,27–31 As µSR is a local probe technique, atomic scale diffusion can be probed as a local average within the material. This allows the measurement of diffusion processes independent from contributions to diffusion encountered in bulk measurements, for instance intercalation-based processes arising from grain boundary and/or surface interactions. The cathode materials that have been investigated to date include sub-stoichiometric LixCoO2 and LiNi⅓Mn⅓Co⅓O2 (NMC-111).29,32 Values for the lithium diffusion rate (DLi) determined by µSR in Li0.73CoO2 and Li0.53CoO2 of 7(±2) × 10−10 and 2.5(±0.8) × 10−10 cm2 s−1, respectively, were comparable to values calculated from first principles.24 However, these first principles calculations suggested that decreasing lithium concentration could also promote a second Li+ diffusion pathway (which has not been observed experimentally, to date). In these materials only one contribution to Li+ diffusion was shown and assumed a single mechanism with an activation energy ≈ 100 meV.33 In comparison, previous bulk electrochemical studies using GITT on commercial NCA shows a DLi of 10−10 cm s−1 and activation energies ≈ 260 eV.34 It is important to note that computational calculations and experimental methods have regularly overestimated Ea of Li+ diffusion when compared to local µSR measurements.21,23 All of these studies have been based on a single contribution to Li+ diffusion, however computational investigations on the parent material LiCoO2 suggest two possible diffusion routes, namely the Oxygen Dumbbell Hop (ODH) and Tetrahedral Site Hop (TSH).24 A representation of the two mechanisms can be seen in Fig. 1(a).
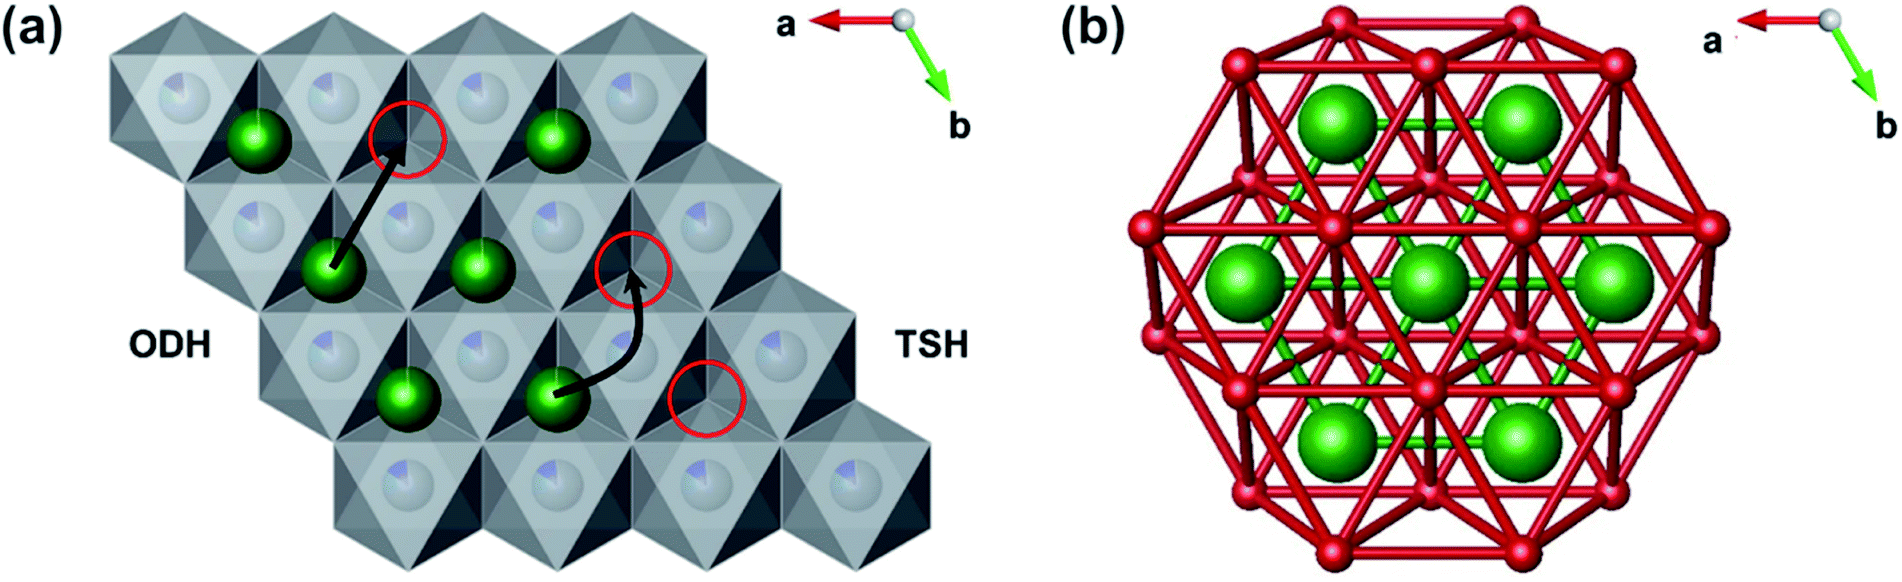 | ||
| Fig. 1 (a) Diagram showing the octahedral dumbbell hop (ODH) and tetrahedral site hop (TSH) mechanisms in LiCoO2, with Li atoms (green), MO6 polyhedra (grey) and vacancies (red). (b) Diagram showing all possible oxygen dumbbells (red) and their interaction with the ODH lithium diffusion paths (green) in the LiO6 slab. | ||
The ODH mechanism proceeds when a lithium migrates into an isolated vacancy (red circle), where the minimum energy path requires a lithium ion to pass between a dumbbell of two oxygen ions. Alternatively, the TSH mechanism occurs if the lithium ion can hop into a site that is part of a divacancy by passing through the tetrahedral site between the original position and the two vacant sites. The same mechanisms have also been calculated in silico to occur in LixNi0.5Mn0.3Co0.2O2, and suggest that metal site substitution of Co for other metals (such as Mn and Ni) can lead to a lowering of the activation energy of diffusion (120 meV) versus the analogous LiCoO2 (210 meV).35,36 The decrease in activation energy has been rationalised by two contributions: (i) weaker repulsive Li+–Ni2+ interactions compared to Li+–Co3+; (ii) a larger c lattice parameter. The relationship between the Ea calculated for ODH and TSH consistently adhere to ETSHa ≈ ¼ × EOSHa.
Herein, the lithium diffusion mechanics in lithium deficient NCA were investigated by bulk electrochemical impedance spectroscopy (EIS) and local µSR measurements. The µSR behaviour has provided the first experimental evidence for the presence of two distinct lithium diffusion mechanisms in NCA cathode materials.
Results and discussion
Structural characterisation
Sub-stoichiometric LinNixCoyAlzO2 particles were prepared by solid-state synthesis, described in the Experimental section. The syntheses yielded fine black powders which were characterised by Powder X-ray Diffraction (PXRD). The crystal structures of the NCA materials were analysed by subsequent Rietveld refinement of the PXRD data shown in Fig. 2. A single rhombohedral phase, typical of LiCoO2-type layered materials (space group: R![[3 with combining macron]](https://www.rsc.org/images/entities/char_0033_0304.gif) m), was observed in both cases and showed good agreement with the expected profile from an NCA reference pattern (ICSD no. 257247).37 Lattice parameter values showed <0.5% difference compared to the reference structure (Δref): a = 2.8739 Å (Δref = 0.0071), b = 2.8739 Å (Δref = 0.0071) and c = 14.1937 Å (Δref = 0.0031) for Li0.87NCA, and a = 2.8712 Å (Δref = 0.0071), b = 2.8712 Å (Δref = 0.0071) and c = 14.1902 Å (Δref = −0.0003) for Li0.71NCA. The transition metal stoichiometry of both samples was found to be LinNi0.77Co0.14Al0.09O2 using X-ray Fluorescence Spectroscopy (XRF).
m), was observed in both cases and showed good agreement with the expected profile from an NCA reference pattern (ICSD no. 257247).37 Lattice parameter values showed <0.5% difference compared to the reference structure (Δref): a = 2.8739 Å (Δref = 0.0071), b = 2.8739 Å (Δref = 0.0071) and c = 14.1937 Å (Δref = 0.0031) for Li0.87NCA, and a = 2.8712 Å (Δref = 0.0071), b = 2.8712 Å (Δref = 0.0071) and c = 14.1902 Å (Δref = −0.0003) for Li0.71NCA. The transition metal stoichiometry of both samples was found to be LinNi0.77Co0.14Al0.09O2 using X-ray Fluorescence Spectroscopy (XRF).
 | ||
| Fig. 2 (a) Rietveld refinement of Powder X-ray Diffraction (PXRD) patterns collected for Li0.87NCA (red) and Li0.71NCA (blue) showing single phase rhombohedral Rm (ICSD no. 257247). Lattice parameters and refinement values can be found in the ESI (Table 1†). (b) Zoomed area of the PXRD data in (a) between 19.5 and 20.5° 2θ showing the fit to the (104) reflection. | ||
Li+/Ni2+ cation mixing is a prevalent cause in disrupting Li+ diffusion in layered transition metal oxides and was thus investigated by Neutron Powder Diffraction (NPD) and subsequent Rietveld refinement, for both samples. Firstly, the fits were constrained to adhere to (Liγ−δNiδ)3b(LiδNi0.77Co0.14Al0.09)3aO2 (Table 1); g is the occupancy of the atoms, γ is the estimated Li+ concentration from NPD and δ is the measure of atoms participating in cation mixing and B is the Debye–Waller factor (attenuation of neutron radiation by thermally induced motion of the atoms). The metals composition was fixed at the values obtained from XRF for each sample.
| Atom | Site | g | x | y | z | B(iso) |
|---|---|---|---|---|---|---|
| Li1 | 3b | γ − δ | 0 | 0 | ½ | ≈1 |
| Ni1 | 3b | δ | 0 | 0 | ½ | B(Li1) |
| Ni2 | 3a | 0.77 − δ | 0 | 0 | 0 | ≈0.3 |
| Co2 | 3a | 0.14 | 0 | 0 | 0 | B(Ni2) |
| Al2 | 3a | 0.09 | 0 | 0 | 0 | B(Ni2) |
| Li2 | 3a | δ | 0 | 0 | 0 | B(Ni2) |
| O1 | 6c | 1 | 0 | 0 | ≈0.259 | ≈1 |
During the initial fitting, the model could not converge with a positive value of δ for either sample suggesting no detectable Li+/Ni2+ cation mixing was present in either sample. Fixing δ to 0 allowed the model to converge and a good fit to lattice parameters taken from a rhombohedral Rm (ICSD no. 257247) reference structure was obtained (Fig. 3) for both Li0.87NCA (Rwp = 2.66, Re = 0.564, RF = 2.58) and Li0.71NCA (Rwp = 3.09, Re = 0.624, RF = 2.79). The Li+ concentration in each sample was estimated to be Li0.87NCA γ = 0.8704(11) and Li0.71NCA γ = 0.7080(12). A full table of calculated parameters can be found in the ESI.†
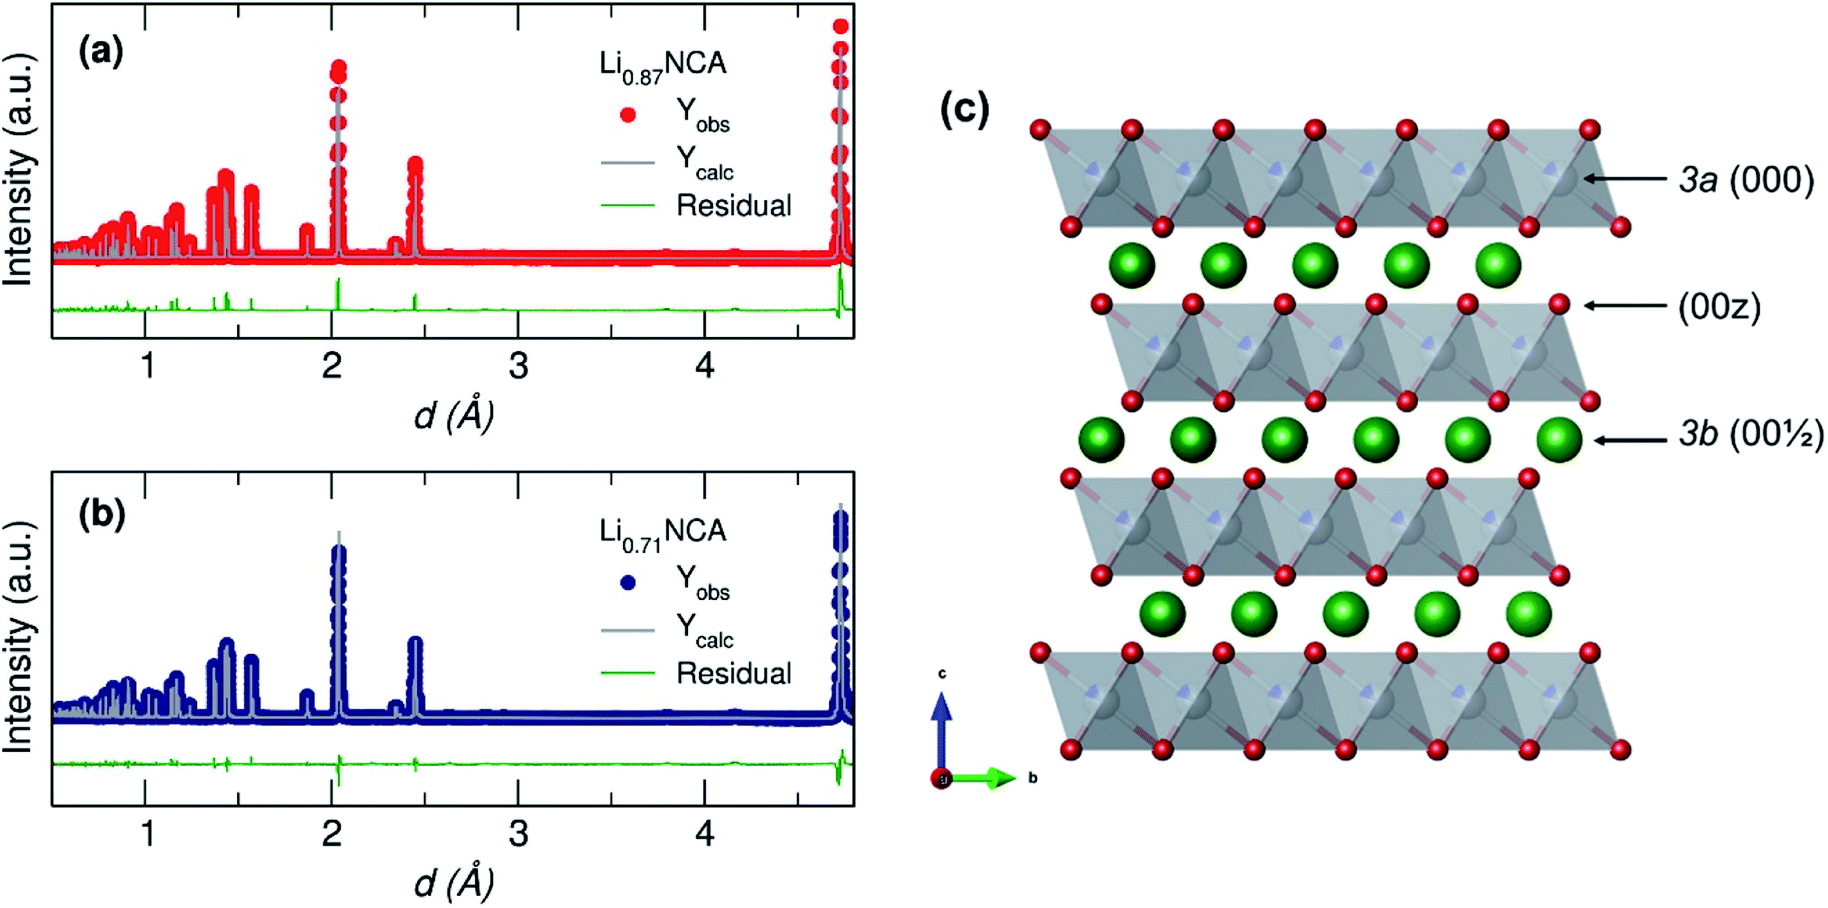 | ||
| Fig. 3 Rietveld refinement of NPD collected for (a) Li0.87NCA and (b) Li0.71NCA showing a good fit in both cases to the model described in Table 1 based on standard data for NCA (space group Rm; ICSD coll. code: 257247). (c) Crystal structure of NCA showing the three main crystallographic sites of interest (000, 00z and 001/2) where Li atoms are green, MO6 polyhedra are grey and O atoms are red. | ||
The Li+ concentration was fixed at the determined values for each sample and further fitting was carried out to estimate the lattice parameters, summarized in Table 2 with the PXRD values for comparison. The calculated lattice volumes marginally decreased by <0.1% with decreasing Li+ content, in good agreement with previous crystallographic studies of NCA and NMC based materials.38–41 No significant difference in Li–Li distance was observed between Li0.87NCA (Δref = 0.0055 Å) and Li0.71NCA (Δref = 0.0048 Å) and was thus not expected to significantly contribute to any difference in Li+ diffusion kinetics.
| NPD | PXRD | |||||||||
|---|---|---|---|---|---|---|---|---|---|---|
| a (Å) | b (Å) | c (Å) | V (Å3) | Li–Li (Å) | a (Å) | b (Å) | c (Å) | V (Å3) | Li–Li (Å) | |
| Li0.87NCA | 2.8697 | 2.8697 | 14.1878 | 101.1867 | 2.8697 | 2.8739 | 2.8739 | 14.1937 | 101.5242 | 2.8739 |
| Li0.71NCA | 2.8689 | 2.8689 | 14.1829 | 101.0935 | 2.8689 | 2.8712 | 2.8712 | 14.1902 | 101.3085 | 2.8712 |
The particle sizes of Li0.87NCA and Li0.71NCA were investigated further by scanning electron microscopy (SEM), seen in Fig. 4(a) and (b) respectively. The average particle size was calculated to be 3.4 µm (σ = 0.32 µm) for Li0.87NCA, while a bimodal distribution was observed for Li0.71NCA corresponding to average particle sizes of 2.4 µm (σ = 0.65 µm) and 0.73 µm (σ = 0.12 µm) for Li0.71NCA.
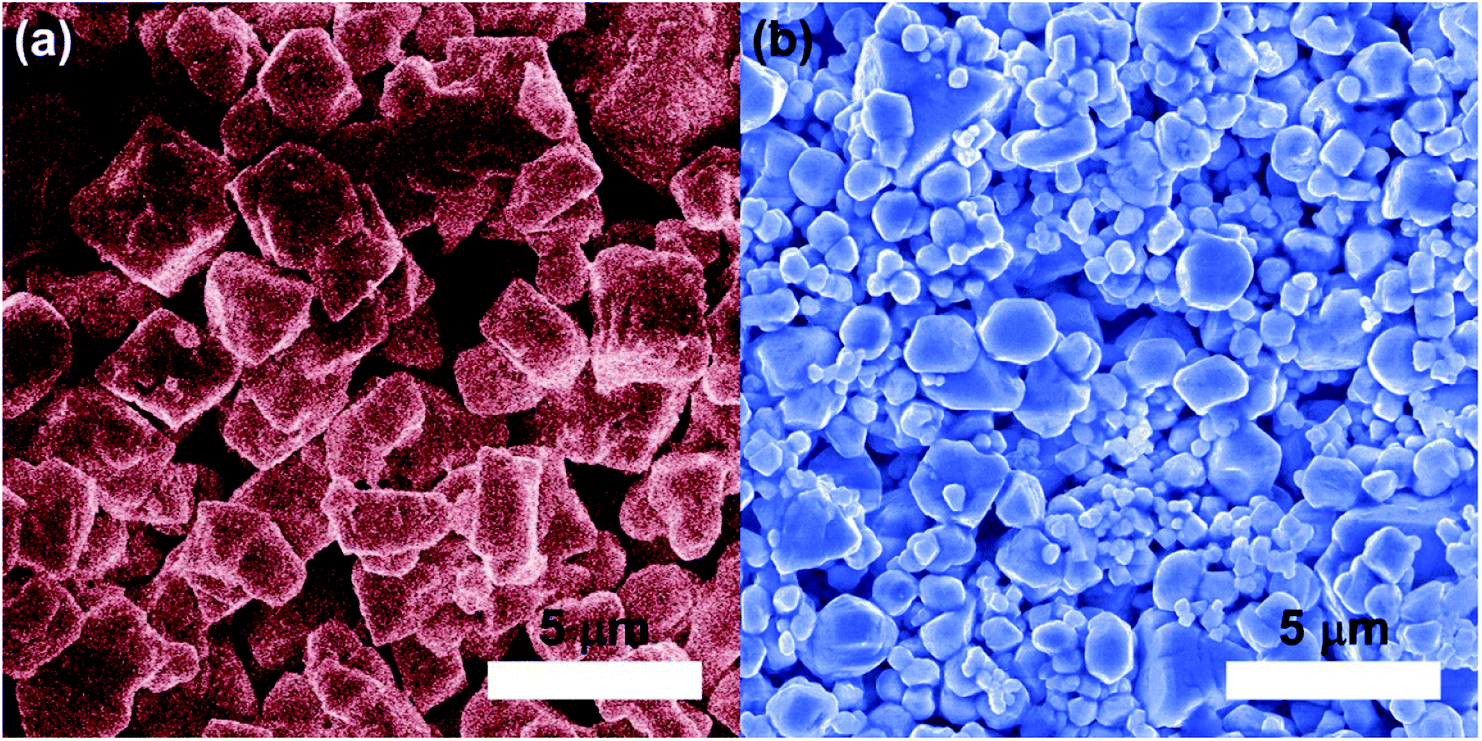 | ||
| Fig. 4 Scanning electron micrographs of (a) Li0.87NCA and (b) Li0.71NCA. | ||
Bulk diffusion in LixNCA (electrochemical characterisation)
Electrochemical impedance spectroscopy (EIS) was employed to investigate the bulk lithium diffusion in the lithium deficient NCA samples. Fig. 5(a) shows Nyquist plots (real versus imaginary impedance) for Li0.87NCA and Li0.71NCA before and after electrochemical cycling at a C/20 rate for 20 cycles. After cycling, both samples showed one semi-circle due to charge transfer resistance (Rct) at the electrode surface, followed by a tail due to resistance from ionic transport (Warburg impedance).42 After cycling, a second impedance contribution appeared due to the formation of a solid-electrolyte interphase (RSEI) on the NCA particles, as described in previous reports on layered Li-ion cathodes.43Rct values of 51 and 59 Ω were extracted for Li0.87NCA and Li0.71NCA, respectively, by fitting a modified Randles cell model (see ESI†) to the data before electrochemical cycling.44 These Rct values were largely preserved after cycling and the additional RSEI contributions were calculated as 51 and 54 Ω for Li0.87NCA and Li0.71NCA, respectively.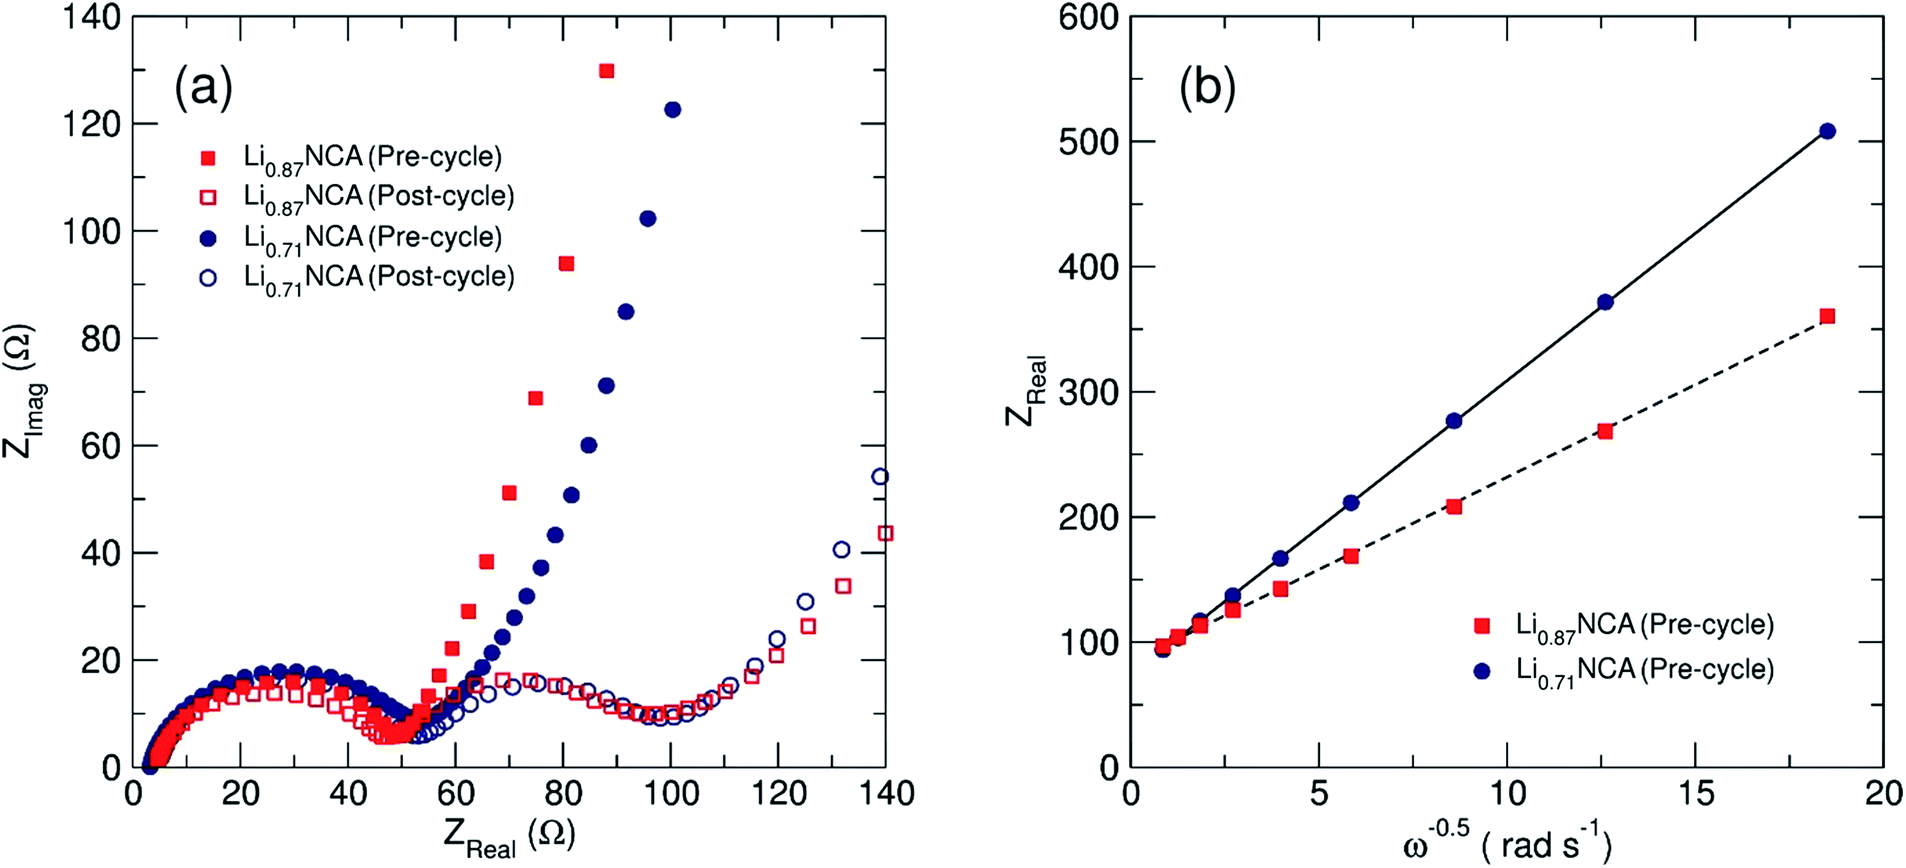 | ||
| Fig. 5 Electrochemical impedance spectroscopy (EIS) results for Li0.87NCA and Li0.71NCA. (a) The Nyquist plot pre- and post-cycling, showing the evolution of a second resistance contribution, and (b) the Warburg plot used to calculate DLi of Li0.87NCA and Li0.71NCA. | ||
Fig. 5(b) shows the Warburg plot for the two samples, where the gradient of the line is equal to the Warburg coefficient for the material (σw). DLi for Li0.87NCA and Li0.71NCA were subsequently estimated using eqn (1), where: R is the gas constant, T is the temperature (298 K), A is the electrode area, F is the Faraday constant and C is the concentration of charge carriers.
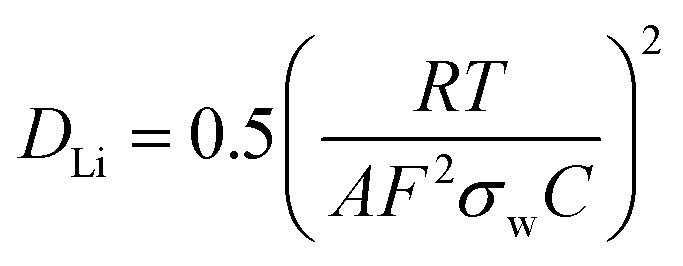 | (1) |
Values of DLi were estimated as 3 × 10⁻¹¹ cm2 s−1 for Li0.87NCA and 1 × 10⁻¹¹ cm2 s−1 Li0.71NCA, in excellent agreement with previous EIS studies on NCA at similar Li+ concentrations (DLi = 4 × 10⁻¹¹ for [Li+] = 0.75).19
Local diffusion in LixNCA (µSR)
To investigate the diffusion mechanics on a local scale, µSR measurements were made from 150 to 400 K at 10 K intervals. At each temperature, three measurements were made at longitudinal magnetic field strengths (BLF) of 0 (zero-field), 5 and 10 G to sequentially decouple the muon relaxation from nuclear magnetic fields within the samples (Fig. 6(a)). As BLF increases, there is a decrease in the relaxation of the muon decay asymmetry suggesting that the decoupling was effective at the magnitude of applied fields chosen. At all values of BLF the slow relaxation of the data is indicative of the diffusion mediated perturbation of muon spin polarization from 6Li and 7Li.21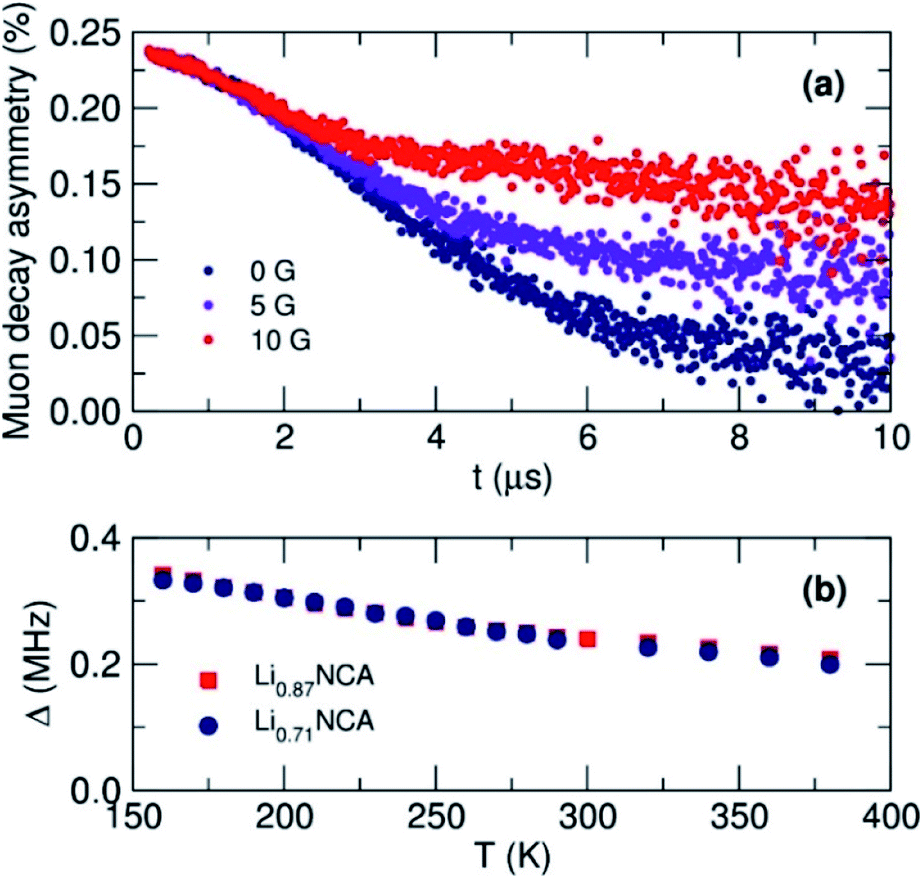 | ||
| Fig. 6 (a) Raw muon asymmetry data collected at 300 K for Li0.87NCA with an applied longitudinal field of 0, 5 and 10 G. (b) The estimated values for the field distribution width (Δ) as a function of temperature for Li0.87NCA and Li0.71NCA. | ||
Data from all three fields at a given temperature were fit simultaneously to a modified Kubo–Toyabe relaxation model to describe the dynamic diffusion processes multiplied by a Gaussian relaxation function to account for temperature independent fluctuations in Li+ diffusion, and a constant background component.45Fig. 6(b) shows the extracted values for the local field distribution width (Δ). A gentle decrease in Δ was observed due to the motional narrowing of the magnetic environment the muon experiences, similarly observed in other µSR diffusion experiments. Importantly no unexpected magnetic behaviour that would affect the calculated values of the muon relaxation fluctuation rate (ν) which can be seen in Fig. 7(a), were observed.
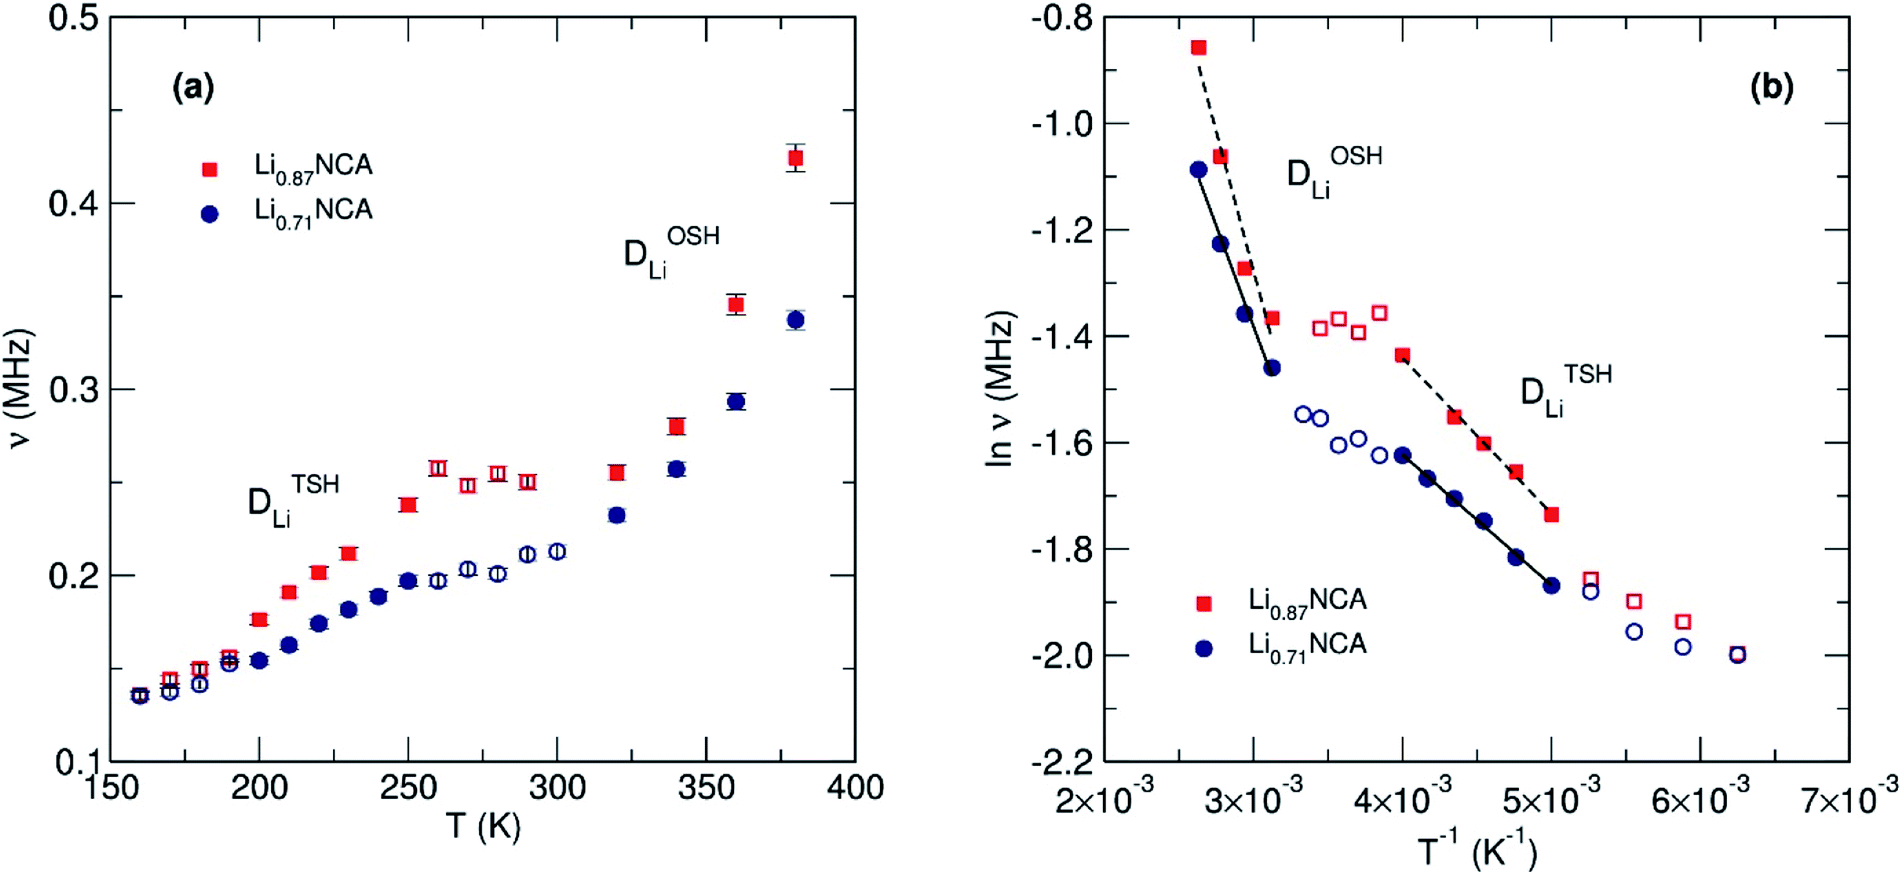 | ||
| Fig. 7 (a) Fluctuation rate (ν) versus temperature for Li0.87NCA and Li0.71NCA showing two responses from Li+ diffusion and (b) Arrhenius plot of the fluctuation rate versus reciprocal temperature allowing calculation of Ea and DLi. | ||
Both Li0.87NCA and Li0.71NCA display two contributions to the fluctuation rate in the low T range (160 to 260 K) and high T range (340 to 380 K). Although these observations cannot be explicitly assigned to their particular processes by µSR alone, two energy barriers have been predicted by the previously discussed theoretical work: a more rapid TSH mechanism and a less rapid ODH mechanism.24 Therefore, the lower T contribution was assigned to DTSHLi and higher T to DODHLi.
As temperature increases the thermal equilibration and eventual homogeneity of Li+ vacancies lead to a continual reduction in diffusion via TSH, due to the dilution of divacancies, and eventual dominance of the ODH pathway. Upon review of similar muon experiments on isostructural materials (e.g. LiCoO2, LiCrO2 and LiNiO2) a contribution at low T may also be present, although much weaker in magnitude.28,33 Previous studies have found that the inclusion of Al into LiNi0.5Co0.5O2 increases the Li+ diffusion coefficient of the host material.46 We therefore suggest this increase occurs by promoting the more facile TSH mechanism, leading to the exaggerated contribution observed by µSR versus other materials.
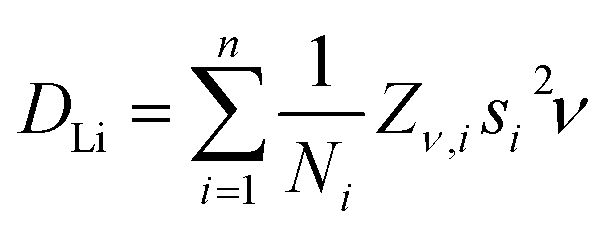
The lithium diffusion coefficients (DLi) for both TSH and ODH can be calculated with eqn (2), where Ni is the number of accessible Li+ sites in the ith path, Zν,i is the vacancy fraction of the destination sites, si is the jump distance between Li+ sites, and ν is the fluctuation rate at each temperature.47 For ODH, si is equal to the a lattice parameter calculated from NPD (2.87 Å) and for TSH it is equal to a × √3 (4.97 Å).
 | (2) |
The DODHLi and DTSHLi were calculated to be 3 × 10⁻¹¹ and 3 × 10⁻¹⁰ cm2 s−1, respectively, for Li0.87NCA, and 3 × 10⁻¹¹ and 2 × 10⁻¹⁰ cm2 s−1, respectively, for Li0.71NCA at 300 K. The values of DLi estimated from µSR agree with the values of DLi estimated using EIS and are further supported by first principles calculations.
Fig. 7(b) shows the Arrhenius plots for the muon hopping, giving rise to an EODHa of 90 ± 13 and 65 ± 6 meV and ETSHa of 25 ± 1 and 21 ± 1 meV for Li0.87NCA and Li0.71NCA, respectively. We observe that the activation energies for both hopping mechanisms are lower in Li0.71NCA, likely due to less Li–Li repulsion. The Ea for TSH in both cases agrees well with values proposed for a divacancy mechanism in LiCoO2 from PBE-SP calculations where values were as low as 15 meV.48 The results obtained for the activation energies (Ea) for Li+ diffusion for OSH and TSH were also close to previous computational studies, with respect to ETSHa ≈ ¼ × EOSHa.
Conclusions
For the first time experimental evidence has been provided for the presence of two distinct diffusion pathways (ODH and TSH) operating in a layered intercalation cathode, NCA. Potential local structure contributions to multiple observed diffusion pathways (such as cation mixing and impurity phases) were ruled out using PXRD and NPD, and possible magnetic effects eliminated by scrutiny of Δ by µSR.Table 3 shows a summary of the values obtained from EIS and µSR. While both techniques are in good agreement with respect to estimated DLi, bulk techniques have been unable to distinguish between individual diffusion pathways highlighting the use of µSR as a powerful tool to understand technologically important/relevant materials. These results obtained from µSR are also in good agreement with values obtained from first principles calculations on LiCoO2.
| Sample | D Li (cm2 s−1) | E a (meV) | ||
|---|---|---|---|---|
| EIS | µSR | DFT24 | µSR | |
| Li0.87NCA | 3 × 10⁻¹¹ | ODH: 3 × 10⁻¹¹ | ODH: 10−11 | ODH: 90 ± 13 |
| TSH: 3 × 10⁻¹⁰ | TSH: 25 ± 1 | |||
| Li0.71NCA | 1 × 10⁻¹¹ | ODH: 3 × 10⁻¹¹ | TSH: 10−10 | ODH: 65 ± 6 |
| TSH: 2 × 10⁻¹⁰ | TSH: 21 ± 1 | |||
It has also been experimentally demonstrated that the TSH mechanism requires a lower Ea and operates at a faster rate compared to the ODH mechanism. This is of much importance to energy materials research, as manipulation of layered cathode materials' structures to promote divacancies will lead to more facile diffusion, and ultimately more efficient battery operation. These experiments suggest that this may be achieved by cationic substitution with elements that promote the TSH mechanism, such as Al.
Experimental
Preparation of lithium nickel cobalt aluminium oxide (NCA)
Samples of LixNi0.8Co0.15Al0.05O2 were prepared via solid-state based methods. All raw materials were purchased from Sigma Aldrich (Dorset, UK) unless stated otherwise. Solid state synthesis was carried out by placing 3.15 g (99.9%) of Ni(NO3)2·6H2O, 0.59 g (99.9%), of Co(NO3)3·6H2O, 0.25 g (99.9%) of Al(NO3)3·9H2O and 0.97 g (99.9%) LiOH in to a glass beaker. 30 mL of isopropanol was added to the mixture and the resulting brown slurry was mixed using a high shear mixer (IKA Ultra-Turrax T25) for 5 min at 10![[thin space (1/6-em)]](https://www.rsc.org/images/entities/char_2009.gif) 000 rpm to give a homogenous mixture. The mixture was transferred to a ceramic crucible and placed in a box furnace for 30 min at 75 °C to evaporate the isopropanol. The temperature was then ramped at 10 °C min−1 to 850 °C and held for 5 h, yielding a black solid material. After heat treatment, potential LiOH or Li2O impurities were removed by washing with 0.05 M acetic acid (1 × 30 mL), water (3 × 30 mL) and isopropanol (1 × 30 mL) by centrifugation and dried in a vacuum oven overnight at 60 °C giving rise to sample Li0.87NCA. Li0.71NCA was produced by using an identical methodology using 4 g of nanoparticle precursor (see ESI†) in place of the nitrate precursors.
000 rpm to give a homogenous mixture. The mixture was transferred to a ceramic crucible and placed in a box furnace for 30 min at 75 °C to evaporate the isopropanol. The temperature was then ramped at 10 °C min−1 to 850 °C and held for 5 h, yielding a black solid material. After heat treatment, potential LiOH or Li2O impurities were removed by washing with 0.05 M acetic acid (1 × 30 mL), water (3 × 30 mL) and isopropanol (1 × 30 mL) by centrifugation and dried in a vacuum oven overnight at 60 °C giving rise to sample Li0.87NCA. Li0.71NCA was produced by using an identical methodology using 4 g of nanoparticle precursor (see ESI†) in place of the nitrate precursors.
Physical characterisation
Powder X-ray Diffraction (PXRD) patterns were collected using a STOE Stadi P diffractometer (Mo Kα1 radiation, λ = 0.70932 Å) in transmission geometry equipped with a germanium (111) monochromator and a DECTRIS Mythen 1K silicon strip detector (Dectris, Baden, Switzerland). An yttria (Y2O3) standard was used to estimate instrumental peak broadening. Datasets were collected over the 2θ range of 2 to 40° with a step size of 0.5° and a count time of 20 s per step. Rietveld refinement was performed using the FullProf™ software package.49 Neutron powder diffraction (NPD) was carried out on the iMATERIA diffractometer at J-PARC in Tokai, Japan.50 The data was analysed by Rietveld refinement using the Z-Rietveld software package.51,52Scanning Electron Microscopy (SEM) was performed using a JEOL JSM-6700F microscope. To minimise charging samples were deposited on copper foil tape, mounted on aluminium stubs, after dispersion in methanol (99.9%, Sigma Aldrich, Dorset, UK) and ultrasonication in a XUBA3 Ultrasonic Bath (Grant Instruments, Cambridge, UK) for 5 minutes. Image analysis was carried out using ImageJ software, calculating the average size over 200 particles for each sample.
X-ray fluorescence (XRF) spectroscopy was performed on the synthesised powders using an Epsilon 4 spectrometer (Malvern Panalytical, Malvern, UK). A nominal <2% total relative error applies to the observed values.
Electrochemical characterisation
Electrodes were prepared by mixing of the active material (LixNCA) with binder (polyvinylidene fluoride, PVDF, PI-KEM, Staffordshire, UK) and conductive carbon black (Super P, Alfa Aesar, Heysham, UK) in a ratio of 80:10:10 wt%. A 10 wt% solution of PVDF in N-methyl-2-pyrrolidone, NMP (Sigma Aldrich, Dorset, UK) was prepared using a magnetic stirrer and then mixed by hand with the conductive carbon and the active material. Further NMP (2.5 mL) was added to give a viscous slurry. The slurry was ball-milled at 800 rpm for 1 h before being cast on 15 µm thick aluminium foil (PI-KEM, Staffordshire, UK). The electrode sheets were dried on a hotplate at ca. 150 °C for 20 min.
All half-cell testing of the NCA materials were performed in CR2032 coin cells at room temperature on a Gamry Instruments Interface 1000 Galvanostat/Potentiostat (SciMed, Cheshire, UK). All cells were assembled in an Ar-filled glovebox with O2 and H2O < 0.5 ppm. GF/B glass microfiber filters (Whatman, Buckinghamshire, UK) were used as separators and drenched in electrolyte of 1 M LiPF6 in 1:1 wt% ethylene carbonate/diethyl methyl carbonate (BASF, Ludwigshafen, Germany). Lithium metal foil 15.6 mm diameter, 0.45 mm thick (PI-KEM, Staffordshire, UK) was used as a counter electrode. Potentiostatic EIS was carried out from 1 to 106 Hz at 10 mV AC RMS and 0 V DC versus open circuit voltage.
Muon spin relaxation (µSR)
Muon spin relaxation experiments were performed at STFC ISIS Neutron and Muon Source, Didcot, UK. Approximately 3 g of powdered samples of Li0.87NCA and Li0.71NCA were packed into recessed titanium samples holders, covered with a titanium window and secured with a titanium bezel. The titanium holder provides a simple background signal from muons which are not implanted into the sample and is easily subtracted from the data. The sample holder was placed into the muon spectrometer (EMU) and evacuated to <1 × 10⁻⁶ mbar. The instrument was cooled to a temperature of 160 K and the instrument asymmetry was measured using a transverse magnetic field of 20 G. Measurements were taken every 10 K up to 380 K with longitudinal at fields of 0, 5 and 10 G. Data collected at each temperature for the three applied magnetic fields were fit simultaneously using the WiMDA software.53Conflicts of interest
There are no conflicts to declare.Note added after first publication
This article replaces the version published on 28th May 2020, which contained errors in the Fig. 4 and Fig. 5 captions.Acknowledgements
Muon experiments at the ISIS Neutron and Muon Source were supported by beamtime allocation RB1810738 from the Science and Technology Facilities Council.54 Neutron experiments at the J-PARC Materials & Life Science Division were supported by beamtime allocation 2018B0196. JAD, ARG and TEA would like to thank the EPSRC grant EP/R023662/1, Joint University Industry Consortium for Energy (Materials) and Devices Hub (JUICED), for support.References
- UNFCCC, Conference of the Parties (COP), Paris Clim. Chang. Conf. - Novemb. 2015, COP 21, FCCC/CP/2015/L.9/Rev.1 Search PubMed.
- H. S. Baker, R. J. Millar, D. J. Karoly, U. Beyerle, B. P. Guillod, D. Mitchell, H. Shiogama, S. Sparrow, T. Woollings and M. R. Allen, Nat. Clim. Change, 2018, 8, 604–608 CrossRef.
- J.-M. Tarascon, Philos. Trans. R. Soc., A, 2010, 368, 3227–3241 CrossRef PubMed.
- K. Mizushima, P. C. Jones, P. J. Wiseman and J. B. Goodenough, Mater. Res. Bull., 1980, 15, 783–789 CrossRef.
- N. Nitta, F. Wu, J. T. Lee and G. Yushin, Mater. Today, 2015, 18, 252–264 CrossRef.
- A. Rougier, P. Gravereau and C. Delmas, J. Electrochem. Soc., 1996, 143, 1168 CrossRef.
- T. Ohzuku, A. Ueda, M. Nagayama, Y. Iwakoshi and H. Komori, Electrochim. Acta, 1993, 38, 1159–1167 CrossRef.
- C. Vogler, B. Löffler, W. Weirather, M. Wohlfahrt-Mehrens and J. Garche, Ionics, 2002, 8, 92–99 CrossRef.
- J. Dahn, E. Fuller, M. Obrovac and U. Vonsacken, Solid State Ionics, 1994, 69, 265–270 CrossRef.
- T. Ohzuku, J. Electrochem. Soc., 1995, 142, 4033 CrossRef.
- H. Arai and Y. Sakurai, J. Power Sources, 1999, 81–82, 401–405 CrossRef.
- S. Albrecht, J. Kümpers, M. Kruft, S. Malcus, C. Vogler, M. Wahl and M. Wohlfahrt-Mehrens, J. Power Sources, 2003, 119–121, 178–183 CrossRef.
- C. H. Chen, J. Liu, M. E. Stoll, G. Henriksen, D. R. Vissers and K. Amine, J. Power Sources, 2004, 128, 278–285 CrossRef.
- R. Kostecki, J. Lei, F. McLarnon, J. Shim and K. Striebel, J. Electrochem. Soc., 2006, 153, A669 CrossRef.
- R. S. Nicholson and I. Shain, Anal. Chem., 1964, 36, 706–723 CrossRef.
- H. Xia, L. Lu and G. Ceder, J. Power Sources, 2006, 159, 1422–1427 CrossRef.
- P. P. Prosini, M. Lisi, D. Zane and M. Pasquali, Solid State Ionics, 2002, 148, 45–51 CrossRef.
- W. Weppner, J. Electrochem. Soc., 1977, 124, 1569 CrossRef.
- R. Amin, D. B. Ravnsbaek and Y.-M. Chiang, J. Electrochem. Soc., 2015, 162, A1163–A1169 CrossRef.
- F. Qi, C. Rier, R. Böhmer, W. Franke and P. Heitjans, Phys. Rev. B: Condens. Matter Mater. Phys., 2005, 72, 104301 CrossRef.
- T. E. Ashton, J. V. Laveda, D. A. MacLaren, P. J. Baker, A. Porch, M. O. Jones and S. A. Corr, J. Mater. Chem. A, 2014, 2, 6238–6245 RSC.
- M. Amores, T. E. Ashton, P. J. Baker, E. J. Cussen and S. A. Corr, J. Mater. Chem. A, 2016, 4, 1729–1736 RSC.
- I. D. Johnson, T. E. Ashton, E. Blagovidova, G. J. Smales, M. Lübke, P. J. Baker, S. A. Corr and J. A. Darr, Sci. Rep., 2018, 8, 4114 CrossRef PubMed.
- A. Van der Ven, Electrochem. Solid-State Lett., 1999, 3, 301 CrossRef.
- D. A. Tompsett and M. S. Islam, Chem. Mater., 2013, 25, 2515–2526 CrossRef.
- A. Urban, D.-H. Seo and G. Ceder, npj Comput. Mater., 2016, 2, 16002 CrossRef.
- J. Sugiyama, H. Nozaki, M. Harada, K. Kamazawa, O. Ofer, M. Månsson, J. H. Brewer, E. J. Ansaldo, K. H. Chow, Y. Ikedo, Y. Miyake, K. Ohishi, I. Watanabe, G. Kobayashi and R. Kanno, Phys. Rev. B: Condens. Matter Mater. Phys., 2011, 84, 054430 CrossRef.
- J. Sugiyama, Y. Ikedo, K. Mukai, H. Nozaki, M. Månsson, O. Ofer, M. Harada, K. Kamazawa, Y. Miyake, J. H. Brewer, E. J. Ansaldo, K. H. Chow, I. Watanabe and T. Ohzuku, Phys. Rev. B: Condens. Matter Mater. Phys., 2010, 82, 224412 CrossRef.
- J. Sugiyama, K. Mukai, Y. Ikedo, H. Nozaki, M. Månsson and I. Watanabe, Phys. Rev. Lett., 2009, 103, 147601 CrossRef PubMed.
- J. Sugiyama, Y. Ikedo, K. Mukai, H. Nozaki, M. Månsson, O. Ofer, M. Harada, K. Kamazawa, Y. Miyake, J. H. Brewer, E. J. Ansaldo, K. H. Chow, I. Watanabe and T. Ohzuku, Phys. Rev. B: Condens. Matter Mater. Phys., 2010, 82, 224412 CrossRef.
- J. Sugiyama, H. Nozaki, M. Harada, K. Kamazawa, Y. Ikedo, Y. Miyake, O. Ofer, M. Månsson, E. J. Ansaldo, K. H. Chow, G. Kobayashi and R. Kanno, Phys. Rev. B: Condens. Matter Mater. Phys., 2012, 85, 054111 CrossRef.
- J. Sugiyama, K. Mukai, M. Harada, H. Nozaki, K. Miwa, T. Shiotsuki, Y. Shindo, S. R. Giblin and J. S. Lord, Phys. Chem. Chem. Phys., 2013, 15, 10402 RSC.
- M. Månsson, H. Nozaki, J. M. Wikberg, K. Prša, Y. Sassa, M. Dahbi, K. Kamazawa, K. Sedlak, I. Watanabe and J. Sugiyama, J. Phys.: Conf. Ser., 2014, 551, 012037 CrossRef.
- M. A. Cabañero, N. Boaretto, M. Röder, J. Müller, J. Kallo and A. Latz, J. Electrochem. Soc., 2018, 165, A847–A855 CrossRef.
- M. Dixit, M. Kosa, O. S. Lavi, B. Markovsky, D. Aurbach and D. T. Major, Phys. Chem. Chem. Phys., 2016, 18, 6799–6812 RSC.
- S. P. Ong, V. L. Chevrier, G. Hautier, A. Jain, C. Moore, S. Kim, X. Ma and G. Ceder, Energy Environ. Sci., 2011, 4, 3680 RSC.
- N. M. Trease, I. D. Seymour, M. D. Radin, H. Liu, H. Liu, S. Hy, N. Chernova, P. Parikh, A. Devaraj, K. M. Wiaderek, P. J. Chupas, K. W. Chapman, M. S. Whittingham, Y. S. Meng, A. Van der Van and C. P. Grey, Chem. Mater., 2016, 28, 8170–8180 CrossRef CAS.
- L. de Biasi, A. O. Kondrakov, H. Geßwein, T. Brezesinski, P. Hartmann and J. Janek, J. Phys. Chem. C, 2017, 121, 26163–26171 CrossRef.
- R. Koerver, W. Zhang, L. de Biasi, S. Schweidler, A. O. Kondrakov, S. Kolling, T. Brezesinski, P. Hartmann, W. G. Zeier and J. Janek, Energy Environ. Sci., 2018, 11, 2142–2158 RSC.
- A. O. Kondrakov, A. Schmidt, J. Xu, H. Geßwein, R. Mönig, P. Hartmann, H. Sommer, T. Brezesinski and J. Janek, J. Phys. Chem. C, 2017, 121, 3286–3294 CrossRef CAS.
- R. Robert and P. Novak, J. Electrochem. Soc., 2015, 162, A1823–A1828 CrossRef CAS.
- A. J. Bard and L. R. Faulkner, Electrochemical Methods: Fundamentals and Applications, John Wiley & Sons, Inc., 2nd edn, 2001 Search PubMed.
- M. Itagaki, N. Kobari, S. Yotsuda, K. Watanabe, S. Kinoshita and M. Ue, J. Power Sources, 2005, 148, 78–84 CrossRef.
- A. Matasso, D. Wong, D. Wetz and F. Liu, J. Electrochem. Soc., 2015, 162, A885–A891 CrossRef.
- R. S. Hayano, Y. J. Uemura, J. Imazato, N. Nishida, T. Yamazaki and R. Kubo, Phys. Rev. B: Condens. Matter Mater. Phys., 1979, 20, 850–859 CrossRef.
- S. Castro-García, A. Castro-Couceiro, M. A. Señarís-Rodríguez, F. Soulette and C. Julien, Solid State Ionics, 2003, 156(1–2), 15–26 CrossRef.
- R. Borg and G. Dienes, An introduction to solid state diffusion, Elsevier, Burlington, MA, 1st edn, 2012 Search PubMed.
- A. Moradabadi and P. Kaghazchi, Phys. Chem. Chem. Phys., 2015, 17, 22917–22922 RSC.
- J. Rodríguez-Carvajal, Phys. B, 1993, 192, 55–69 CrossRef.
- T. Ishigaki, A. Hoshikawa, M. Yonemura, T. Morishima, T. Kamiyama, R. Oishi, K. Aizawa, T. Sakuma, Y. Tomota, M. Arai, M. Hayashi, K. Ebata, Y. Takano, K. Komatsuzaki, H. Asano, Y. Takano and T. Kasao, Nucl. Instrum. Methods Phys. Res., Sect. A, 2009, 600(1), 89–191 CrossRef.
- R. Oishi, M. Yonemura, Y. Nishimaki, S. Torii, A. Hoshikawa, T. Ishigaki, T. Morishima, K. Mori and T. Kamiyama, Nucl. Instrum. Methods Phys. Res., Sect. A, 2009, 600(1), 94–96 CrossRef CAS.
- R. Oishi-Tomiyasu, M. Yonemura, T. Morishima, A. Hoshikawa, S. Torii, T. Ishigaki and T. Kamiyama, J. Appl. Crystallogr., 2012, 45, 299–308 CrossRef CAS.
- F. L. Pratt, Phys. B, 2000, 289–290, 710–714 CrossRef.
- T. E. Ashton, J. A. Darr and P. J. Baker, STFC ISIS Neutron Muon Source DOI:10.5286/ISIS.E.RB1810738.
Footnote |
| † Electronic supplementary information (ESI) available. See DOI: 10.1039/d0ta03809a |
| This journal is © The Royal Society of Chemistry 2020 |