DOI:
10.1039/D0TA02247K
(Paper)
J. Mater. Chem. A, 2020,
8, 11948-11957
Assessing the limitations of transparent conducting oxides as thermoelectrics†
Received
25th February 2020
, Accepted 19th March 2020
First published on 19th March 2020
Abstract
Thermoelectrics are a promising technology for converting heat into renewable electricity. Currently, however, most of the best thermoelectrics are based on toxic and/or rare materials such as PbTe and Bi2Te3, limiting their practical applications. Transparent conducting oxides (TCOs) are well understood and widely used commercially, so if they could be made into thermoelectrics, they could be rapidly and prolifically deployed. TCOs have been tested for their thermoelectric capabilities, however their performance is far below that needed for industrial deployment. Here we use hybrid density functional theory to screen four TCOs: BaSnO3, CdO, SnO2 and ZnO for thermoelectric efficiency and analyse the limitations of TCOs as thermoelectrics. We demonstrate that the dominant factor limiting these materials is the lattice thermal conductivity, and more specifically very long phonon mean free paths up to the order 10 μm, making them strong candidates for nanostructuring to increase performance. Based on these insights we critically discuss materials design principles for increasing the ZT of the conducting oxides.
1 Introduction
Despite the primary global energy consumption of around 160 PW h this decade1,2 and the numerous negative effects this will bring,3 an estimated 50% of all generated energy is wasted as heat.4 One fifth of this wasted heat is theoretically recoverable,4 and that recovery could reduce the effects of global heating in at least three ways: reducing energy consumption, generating emissions-free electricity and reducing the local increase of temperatures in urban areas caused in part by anthropogenic waste heat (the urban heat island effect)5 by utilising some of said heat. Thermoelectrics, materials which transform heat into electricity (or vice versa), are promising candidates for this task.
The efficiency of a thermoelectric material is quantified by the dimensionless figure of merit, ZT:
| |  | (1) |
where
α is the Seebeck coefficient,
σ is electrical conductivity,
T is the absolute temperature and
κe and
κl are the electronic and lattice contributions to the thermal conductivity,
κ, respectively. The Seebeck coefficient quantifies the Seebeck effect,
6 the thermal diffusion of charge carriers from the hot to the cold end of a material, which results in a potential difference if there is an imbalance of electrons and their positive counterparts, holes. A high Seebeck coefficient requires a low number of poorly mobile charge carriers:
| | 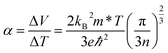 | (2) |
where
V is the voltage,
kB is the Boltzmann constant,
m* is the charge carrier effective mass,
e is the charge of an electron,
ℏ is the reduced Planck's constant and
n is the charge carrier concentration. However, a high electrical conductivity requires large numbers of highly mobile charge carriers:
| |  | (3) |
where
μ is the charge carrier mobility and
τ is the charge carrier lifetime. Furthermore, charge carriers conduct heat as well as electricity, so a high electrical conductivity implies a high electronic component of the thermal conductivity:
7where
L is the Lorenz number. While this will decrease
ZT, thermoelectric design commonly employs the phonon-glass electron-crystal (PGEC) concept,
8 where the electronic thermal conductivity is allowed to be high in the interests of a high electrical conductivity, and instead the lattice thermal conductivity is minimised. The lattice thermal conductivity is carried by phonons, the quanta of lattice vibrations, which is commonly minimised in complex structures where there are not long paths of similar atoms along which phonons can easily conduct.
While not a property intrinsic to a material, temperature is also an important factor in thermoelectric efficiency, as the ZT (eqn (1)) and Seebeck coefficient (eqn (2)) are both proportional to temperature. In addition, in semiconductors, higher temperatures excite more charge carriers, which can then conduct electricity, causing electrical conductivity to increase. There are also increased lattice vibrations, which impede the phonons that are conducting heat, reducing the lattice thermal conductivity. Therefore, and as evidenced by the data in Table 1, ZT tends to be higher at high temperatures. Furthermore, whilst waste heat at temperatures above 573 K makes up only 5.3% of the total across all temperatures, 17.4% of the theoretically recoverable energy came from these temperatures in 2014,4 due to the steeper temperature gradients granting a higher Carnot efficiency.15,16 This means that the recoverable energy from high temperature sources is much more concentrated than low temperature sources: for comparison, 31.3% of waste heat was from sources in the range 373–573 K, providing 62.7% of the theoretically recoverable energy, so while 3.6 times more heat can be recovered from sources in the lower temperature range, almost 6 times as much material would be required to access all the extra sources.4 Oxide thermoelectrics,17 with their high temperature stability (Table 2), are well placed to take advantage of these factors.
Table 1 Some ZT ≥ 2 materials, representing the most efficient thermoelectrics so far discovered. All but AgPb18SbTe20 are p-type
| Material |
T (K) |
ZT
|
| AgPb18SbTe20 (ref. 9) (n-type) |
800 |
2.2 |
| PbTe–SrTe10 |
915 |
2.2 |
| PbTe0.86Se0.07S0.07:Na11 |
825 |
2.0 |
| SnSe12 |
923 |
2.6 |
| Pb0.7S0.3:K13 |
923 |
2.2 |
| PbTe0.8Se0.2:MgTe14 |
820 |
2.2 |
Table 2 Melting or decomposition temperatures of BaSnO3, CdO, SnO2 and ZnO
Transparent conducting oxides (TCOs) are a class of oxides that could be especially interesting. Unlike many oxides, they are electrically conductive, one of the qualities required for efficient thermoelectric materials. Furthermore, unlike many high efficiency thermoelectrics (Table 1), there are many TCOs which do not contain toxic elements such as Pb, which has lead to them being able to be used pervasively in the consumer market, especially in touchscreen and photovoltaic devices. Because of this they are extremely well understood, and could have an accelerated route to widespread deployment if they were able to be made into efficient thermoelectrics. TCOs have previously been studied experimentally for thermoelectric applications, especially ZnO, commonly in the form of Al doped ZnO (AZO),21 which has so far achieved a ZT of over 0.1 at 300 K,22 and if codoped with Ga it can reach 0.65 at 1000 K23 (the record ZT for a singly doped TCO is 0.45 at 1273 K for In1.8Ge0.2O3).24 Although many experimental studies have tried various means of raising the thermoelectric efficiency of AZO, including changing synthesis conditions,22,25–27 microstructure,28 temperature and magnetic field,29 doping23,30–35 and nanostructure;36 a study of the limitations of TCOs as thermoelectrics has not, to the authors' knowledge, been conducted. Here we screen the TCOs BaSnO3, CdO, SnO2 and ZnO for thermoelectric applications in order to assess their efficiencies, the limitations thereof and how those might be overcome for conducting oxides in general.
2 Computational methodology
The Vienna Ab initio Simulation Package (VASP)37–40 density functional theory (DFT) code with the projector augmented-wave (PAW) method41 was used when calculating the structural and electronic properties of the TCOs. Convergence testing was done and an ENCUT of 450 eV was chosen for all the materials. The k-point meshes are listed in Table 3. The structures were relaxed with the Perdew–Burke–Ernzerhof42 (PBE) for solids43 (PBEsol) functional, as it calculates accurate solid structures while remaining computationally inexpensive.44–46
Table 3 The converged k-point meshes used for most the calculations here, the denser meshes used in BoltzTraP calculations, the supercells used for the second and third order force constant calculations in Phono3py, the number of VASP calculations required to calculate the third order force constants and the q-point mesh sampled in Phono3py for BaSnO3, CdO, SnO2 and ZnO
| Material |
BaSnO3 |
CdO |
SnO2 |
ZnO |
|
k-Point mesh |
5 × 5 × 5 |
6 × 6 × 6 |
3 × 3 × 5 |
5 × 5 × 3 |
| Dense k-points |
25 × 25 × 25 |
30 × 30 × 30 |
23 × 23 × 35 |
40 × 40 × 21 |
| Supercell—2nd |
6 × 6 × 6 |
6 × 6 × 6 |
4 × 4 × 6 |
5 × 5 × 4 |
| Supercell—3nd |
4 × 4 × 4 |
4 × 4 × 4 |
2 × 2 × 4 |
3 × 3 × 2 |
| Calculations—3nd |
1476 |
442 |
1433 |
2696 |
|
q-Point mesh |
36 × 36 × 36 |
40 × 40 × 40 |
30 × 30 × 45 |
40 × 40 × 21 |
In order to calculate electronic transport properties, an electronic band structure and density of states (DoS) were calculated. To get accurate electronic properties, hybrid DFT with Hartree–Fock (HF) exchange47,48 was used. These hybrid functionals yield more accurate electronic structures compared to generalised gradient approximation (GGA) functionals such as PBEsol, which tend to underestimate bandgaps.49–64 Here, PBE0 is used for BaSnO3 and SnO2 and Heyd–Scuseria–Ernzerhof (HSE) functionals65 were used for CdO (with 25% HF) and ZnO (with 37.5% HF) as these have been shown to work well for these TCOs.58,66–69 The band structure and DoS were then plotted with the sumo package,70 and the Boltzmann transport properties (BoltzTraP)71 package was used to obtain the electrical conductivity, Seebeck coefficient and electronic thermal conductivity under the relaxation time approximation (RTA), where charge carriers are assumed to return to their ground states in a linear fashion with a lifetime of 1 × 10⁻¹⁴ s.
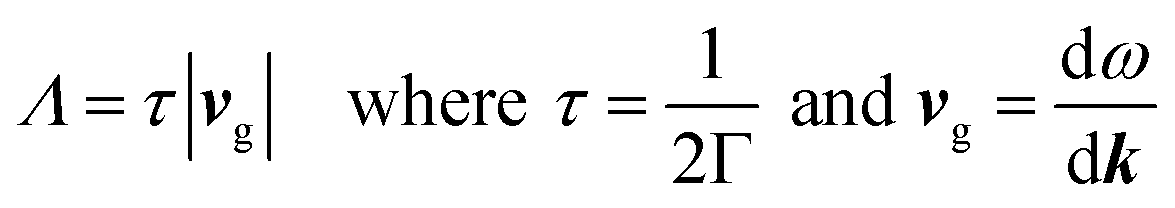
The Phonopy72 and Phono3py73 codes were used to calculate the vibrational properties of the TCOs. These work under the RTA like BoltzTraP, specifically under the single-mode relaxation time flavour, where each phonon mode is treated as if all the others are at equilibrium. The non-analytical correction74 was also included, which takes into account the charges on the ions to raise the frequency of the longitudinal optic modes around the Γ point (compare ESI Fig. S3 and S4†). Phonopy and Phono3py use the supercell approach, where small displacements are created in the lattice (0.01 Å in Phonopy and 0.03 Å in Phono3py), and the forces in response to these displacements are calculated in VASP, in which the PBEsol functional was used as this has been shown to be accurate but relatively cheap for lattice dynamics calculations.75 Phonopy uses these to calculate second order force constants, and these were used to find supercell sizes which balanced visual convergence and computational efficiency (Table 3 and ESI Fig. S3†) to use as Phono3py inputs. Phono3py uses a much greater number of displacements to calculate the third order force constants, which can be used to calculate phonon interaction properties such as lattice thermal conductivities and the imaginary component of the self-energies per mode and per q-point. The Phono3py calculations were also completed without the RTA at 300 and 1000 K, and with and without symmetrisation of force constants, which should not result in a significant deviations in lattice thermal conductivity if the calculations are appropriate. The lattice thermal conductivities were converged against q-point mesh to ensure accurate calculations (q-points are the equivalent of k-points used in phonon calculations, q = 2πk). From the imaginary self-energies, the phonon lifetimes can be calculated, and from these and the group velocities, mean free paths can also be obtained:
| |  | (5) |
where
Λ is the phonon mean free path,
τ is the phonon lifetime,
vg is the phonon group velocity, Γ is the imaginary component of the phonon self-energy and
ω is the phonon frequency. This allows lattice thermal conductivity and its origin to be probed. Finally, an inbuilt Phono3py function was used under the RTA which limits the lifetimes of the phonons to that corresponding to a specific mean free path, here 20 nm. From this, the effects of nanostructuring on the lattice thermal conductivity of the TCOs was investigated.
3 Results
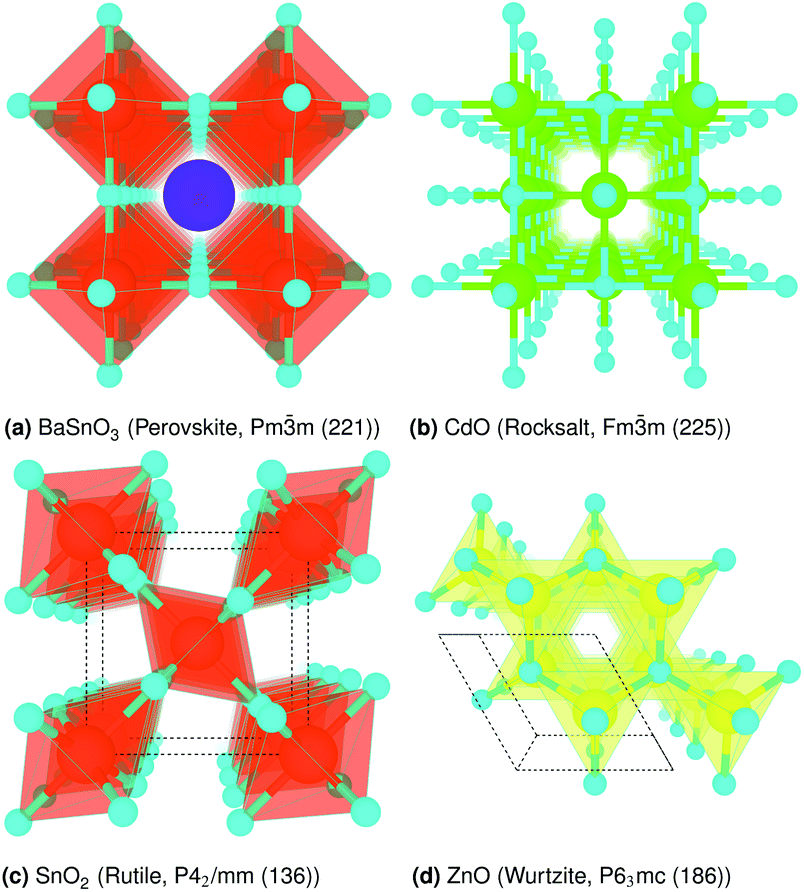
The crystal structures are shown in Fig. 1. BaSnO3 has a perovskite structure, space group Pm![[3 with combining macron]](https://www.rsc.org/images/entities/char_0033_0304.gif) m (221), consisting of cubic cell of side 4.13 Å with a corner sharing SnO6 octahedron at (0, 0, 0) and a Ba atom at
m (221), consisting of cubic cell of side 4.13 Å with a corner sharing SnO6 octahedron at (0, 0, 0) and a Ba atom at  . CdO crystallises in the rocksalt structure, space group Fmm (225), two face-centred cubic lattices of side 4.71 Å offset by a half cell along one axis. SnO2 has the rutile structure, space group P42/mm (136), consisting of a tetragonal cell with a and b sides of 4.77 Å and c of 3.22 Å with distorted SnO6 octahedra at (0, 0, 0) and
  , with axial bonds of 2.072 Å which form edge-sharing chains along the c axis; and equatorial bonds of 2.066 Å, which are corner-sharing in the ab planes. ZnO has the wurtzite structure, space group P63mc (186), a hexagonal cell with a and b side lengths of 3.24 Å separated 120° perpendicular to the c direction of 5.22 Å; the atoms are arranged as corner sharing ZnO4 tetrahedra of bond length 1.979 Å at
  and
and  . As BaSnO3 is ternary, its more complex structure would be expected to have a reduced lattice thermal conductivity compared to the binary oxides, and hence higher ZT. Of the rest, ZnO is hexagonal, which has only twelve symmetry operations and so might be expected to have the lowest lattice thermal conductivity and hence highest ZT, followed by the tetragonal SnO2 with 16 symmetry operations and cubic CdO with 48. All the structures relaxed to within 1% of their experimental lattice parameters77–80 (ESI Table S1†).
 |
| | Fig. 1 Crystal structure of (a) BaSnO3, (b) CdO, (c) SnO2 and (d) ZnO, drawn with VESTA.76 O is cyan, Ba purple, Sn orange, Cd lime and Zn yellow. The unit cell is drawn on (dotted lines). | |
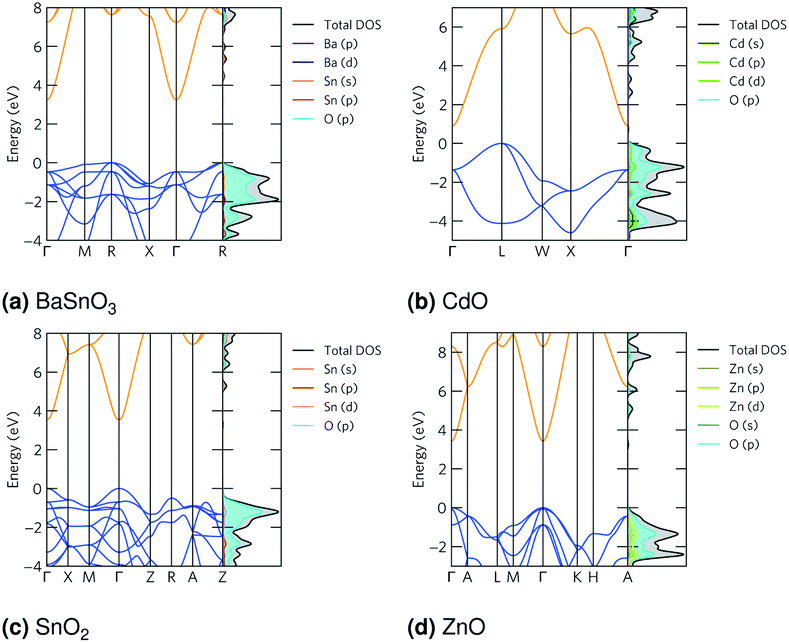
The band structures are shown in Fig. 2. The curvature, or dispersion, of the bands indicates the mobility of charge carriers in those bands:
| |  | (6) |
where

is the curvature of the electron bands, calculated with sumo
70 by using parabolic band fitting. All the conduction band minima (CBMs) are highly disperse, in line with previous calculations.
58,66,67,81 The electron effective masses calculated from this are in the range 0.16–0.26
me (
Table 4), which are low and therefore show a high n-type mobility in all the TCOs, so when doped they will have a high n-type conductivity, but a limited Seebeck coefficient. All give bandgaps in good agreement with experiment (
Table 5).
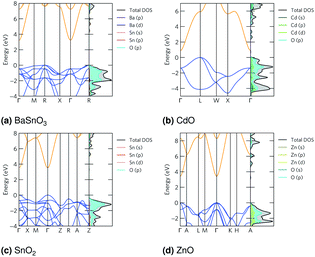 |
| | Fig. 2 The band structures, plotted with sumo70 and using the Bradley–Cracknell formalism for k-point path nomenclature,91 for (a) BaSnO3, (b) CdO, (c) SnO2 and (d) ZnO. The valence band is blue and the conduction band orange, they are normalised so the valence band maximum is at 0 eV. Expanded versions of the DoSs are available in ESI Fig. S1.† | |
Table 4 Electron effective masses at the conduction band minimum and hole effective masses at the valence band maximum of BaSnO3, CdO, SnO2 and ZnO relative to the rest mass of an electron (me), evaluated by sumo70 using parabolic band fitting
|
m (me) |
BaSnO3 |
CdO |
SnO2 |
ZnO |

|
0.201 (Γ) |
0.161 (Γ) |
0.192 (Γ) |
0.259 (Γ) |

|
8.757 (M) |
0.344 (L) |
1.269 (Γ) |
0.307 (Γ) |
Table 5 Indirect, direct, optical and experimental bandgaps of BaSnO3, CdO, SnO2 and ZnO, given in eV, calculated with sumo70
The densities of states (DoSs) show the valence band maxima (VBMs) are dominated by O p states with some metal d and p states, particularly in CdO and ZnO. The CBMs are composed mainly of Sn, Cd or Zn s states, depending on the material, along with some O states at the CBM, particularly in CdO and ZnO. These are shown in Fig. 2, and expanded versions are in ESI Fig. S1.†
The Seebeck coefficient, electrical conductivity and electronic thermal conductivities, calculated using BoltzTraP, do not vary greatly between the TCOs (ESI Fig. S2†). The optimal ZT is often found around 1 × 10¹⁹ to 1 × 10²⁰, carriers per cm3,92 so in this work the properties are compared at 1 × 10¹⁹ carrier cm−3, the lowest and therefore most achievable dopant concentration in that range. While BoltzTraP calculates the transport properties at various temperatures by artificially altering the Fermi level, and so gives no indication if these results are feasible, all these TCOs have been experimentally demonstrated to be n-type dopable above this level.58,66,81,93–97 BaSnO3, SnO2 and ZnO all have relatively low Seebeck coefficients in the region of −100 to 300 μV K−1, while CdO's are only around −50 to 250 μV K−1. For all of them, the electrical conductivities and electronic thermal conductivities are about 100 S cm−1 and 0.1 W m−1 K−1 respectively.
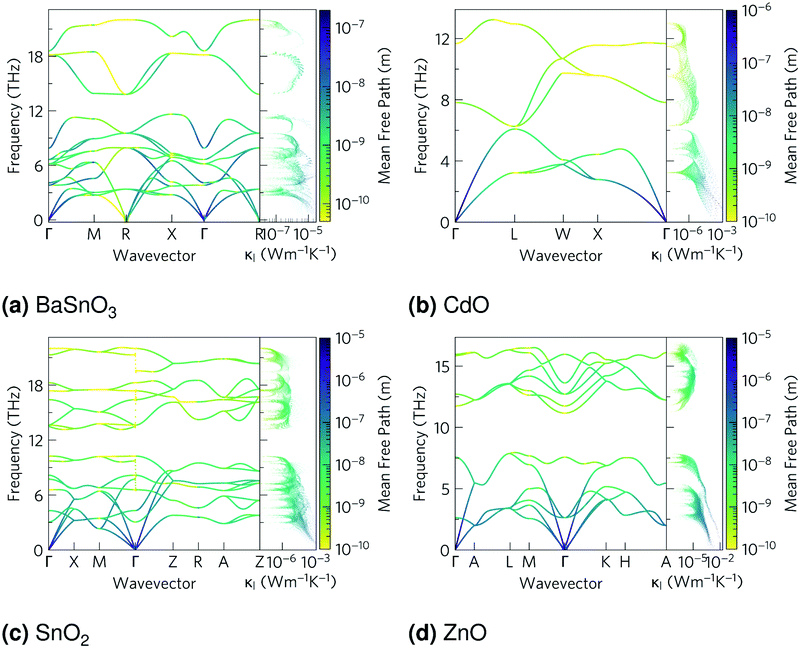
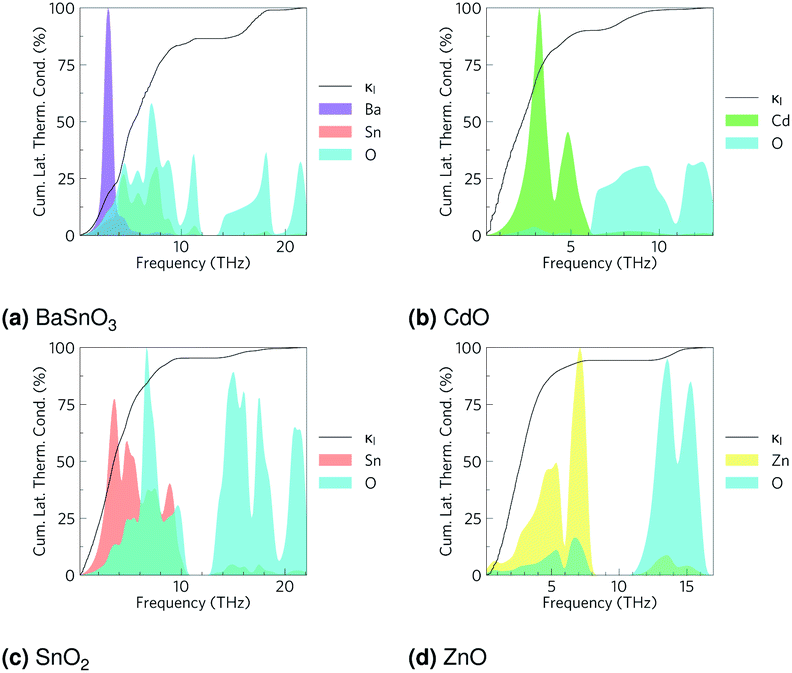
The phonon band structures (Fig. 3, ESI Fig. S3†), calculated using Phonopy, show high dispersion as expected for such simple structures, and are therefore expected to have high lattice thermal conductivity due to a high phonon group velocity (eqn (5)). As the lattice thermal conductivity has been simulated, its origin can be analysed from the data from Phono3py. As well as the phonon band structures, Fig. 3 shows the mean free path projected on the colour axis and the contribution to the lattice thermal conductivity per mode per q-point on the right of each subfigure. As previously mentioned, the group velocity is high for all of them (see also ESI Fig. S5†), but we can also see the greatest mean free paths (purple) occur in the acoustic modes, and this is where the greatest contribution to the lattice thermal conductivity can be seen. One would expect the low frequency modes to be dominated by the heaviest atoms, and Fig. 4 shows that this is indeed the case for CdO, SnO2 and ZnO, where over 60% of thermal conductivity comes from the modes below 5 THz, which are dominated by the metal cations. The relation in BaSnO3 is less straightforward. ∼25% of the thermal conductivity comes from below 4 THz in modes dominated by Ba, but the following ∼60% comes from modes composed of a roughly equal mixture of Sn and O states. Overall though, one may consider reducing the phonon mean free path of the low frequency, metal dominated modes to be an effective place to start when optimising these materials.
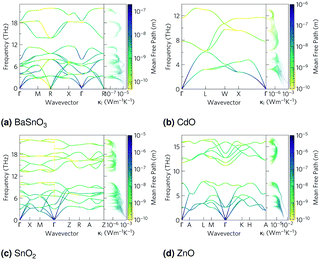 |
| | Fig. 3 The phonon dispersion relations for (a) BaSnO3, (b) CdO, (c) SnO2 and (d) ZnO, plotted using the Bradley–Cracknell formalism for q-point path nomenclature,91 from which group velocity can be inferred from the band gradients. Mean free path at 1000 K is projected on the colour axis, where yellow indicates high scattering and purple indicates high mean free path. Lattice thermal conductivity (κl) per mode per q-point at 1000 K plotted on the right of each subfigure, sharing the frequency axis with the phonon band structure. | |
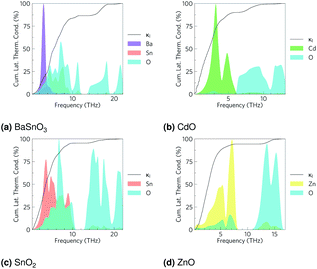 |
| | Fig. 4 Cumulative lattice thermal conductivity against frequency at 1000 K in black, with the phonon density of states in arbitrary units overlaid for (a) BaSnO3, (b) CdO, (c) SnO2 and (d) ZnO. | |
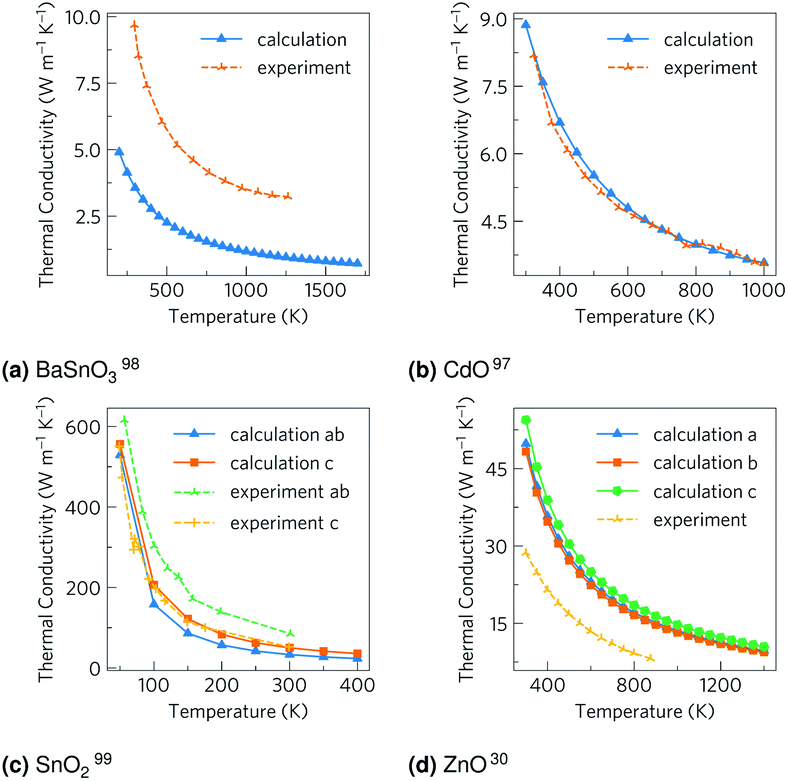
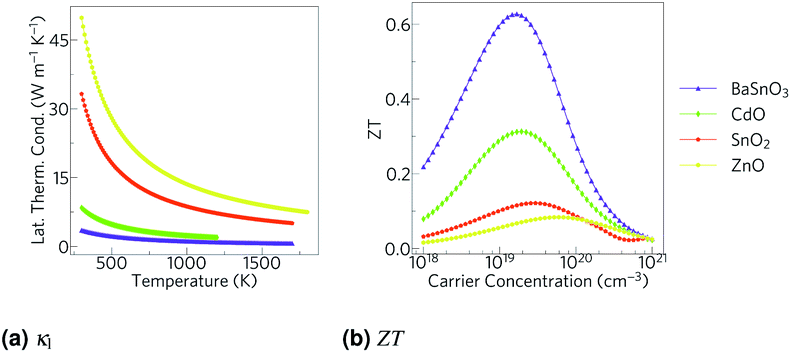
The total thermal conductivities against temperature are shown in Fig. 5. The CdO results are in excellent agreement with experiment,98 although the other values vary somewhat. The carrier concentrations in the experiments for BaSnO3 (ref. 99) and ZnO31 were not reported, so the arbitrary value of 1 × 10¹⁸ carriers cm−3 used here could help explain some the discrepancy, although the differences are out of the range of the effect of modulating the electron concentration, so there are certainly other factors at play. It should be noted the experimental measurements on CdO, BaSnO3 and ZnO were taken on powdered samples rather than single crystals as with SnO2, which would scatter phonons at the ‘grain’ boundaries, reducing the thermal conductivity and averaging anisotropic conduction. Nevertheless, when comparing our unsymmetrised RTA results with those computed without RTA and those where the force constants have been symmetrised, we found the agreement to be excellent (ESI Fig. S6†).
 |
| | Fig. 5 The thermal conductivities calculated here and from experiment for (a) BaSnO3, (b) CdO, (c) SnO2 and (d) ZnO. For the calculations, CdO and SnO2 use the experimental carrier concentrations of 4.2 × 10¹⁹ carriers per cm3 and 1 × 10¹⁷ carriers per cm3 respectively, while BaSnO3 and ZnO use the arbitrary value of 1 × 10¹⁸ carriers per cm3 as experimental data were not available. A comparison of computational methods can be seen in ESI Fig. S6.† | |
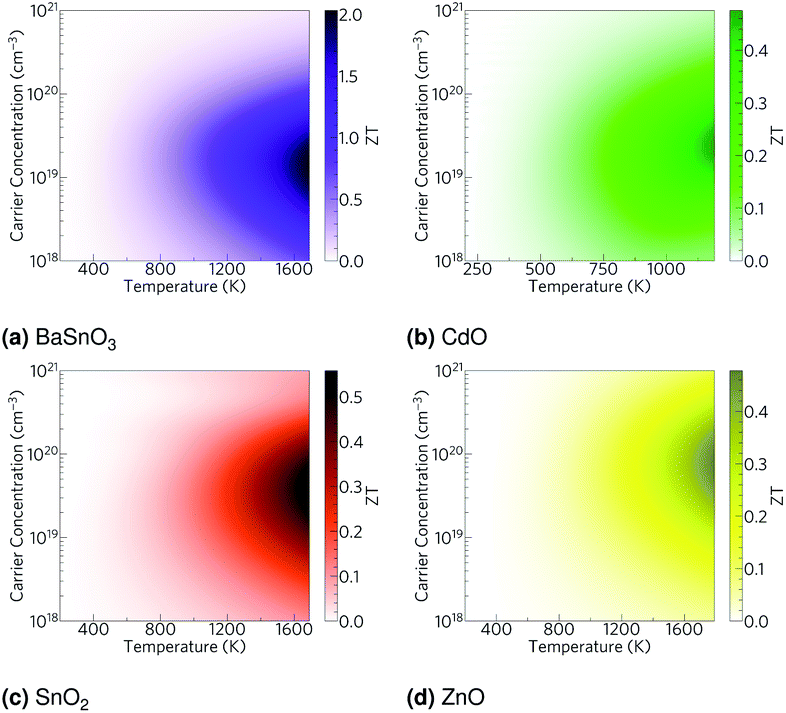
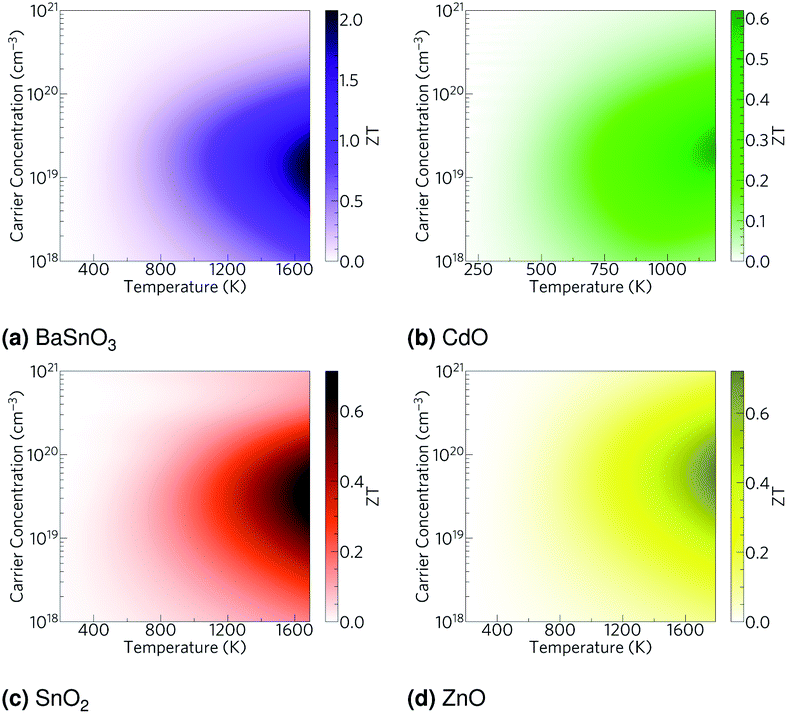
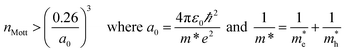
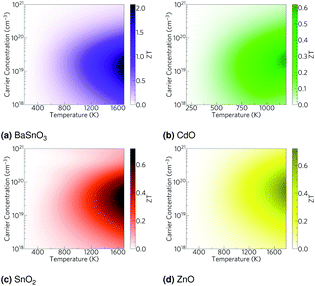
Using the lattice thermal conductivity from Phono3py and the electronic transport properties from BoltzTraP, the ZT was calculated. Maximum ZTs occur at high doping concentrations of ∼1 × 10¹⁹ carriers per cm3 for BaSnO3, ∼2 × 10¹⁹ carriers per cm3 for CdO, ∼3 × 10¹⁹ carriers per cm3 for SnO2 and ∼8 × 10¹⁹ carriers per cm3 for ZnO. In order for a material to be an efficient thermoelectric, it must also be a degenerate conductor, i.e. display metal-like conduction, which occurs for carrier concentrations above the Mott criterion, nMott:61,100,101
| |  | (7) |
where
a0 is the effective Bohr radius and
ε0 is the static dielectric constant, the sum of the ionic and high frequency components,
εion and
ε∞, respectively. All the TCOs reach their highest
ZTs above their Mott criteria (
Table 6), and all have previously been shown to be highly dopable,
58,66,81,93–97 so all can feasibly achieve their maximum
ZT. Nevertheless, the maximum
ZTs are not high, even at temperatures close to their melting or decomposition points (
Table 2), CdO, SnO
2 and ZnO have
ZTs of around 0.5. BaSnO
3 approaches a
ZT of 2, but only at very high temperatures of around 1700 K (
Fig. 6).
Table 6 Ionic (εion) and high frequency (ε∞) contributions to the relative static dielectric constant, ε0, the effective Bohr radius, a0 and the Mott criterion, nMott, the carrier concentration above which the material becomes a degenerate conductor, calculated from eqn (7), for BaSnO3, CdO, SnO2 and ZnO
| Material |
BaSnO3 |
CdO |
SnO2 |
ZnO |
|
ε
ion
|
15.4 |
11.6 |
7.6 |
4.7 |
|
ε
∞
|
3.4 |
4.3 |
2.5 |
2.8 |
|
ε
0
|
18.8 |
15.9 |
10.1 |
7.5 |
|
a
0 (m) |
5.06 × 10⁻⁹ |
7.67 × 10⁻⁹ |
3.20 × 10⁻⁹ |
2.83 × 10⁻⁹ |
|
n
Mott (cm−3) |
1.35 × 10¹⁷ |
3.89 × 10¹⁶ |
5.34 × 10¹⁷ |
7.79 × 10¹⁷ |
 |
| | Fig. 6 Heat maps of the ZT against carrier concentration and temperature for (a) BaSnO3, (b) CdO, (c) SnO2 and (d) ZnO. The values are averaged over crystal orientation for SnO2 and ZnO as any real devices would need to be heavily nanostructured. | |
4 Discussion
All the materials studied here have broadly comparable Seebeck coefficients, electrical conductivities and electronic thermal conductivities (Table 7). They have neither the combined high Seebeck coefficient and high electrical conductivity of AgPb18SbTe20 nor the low thermal conductivity of SnSe. Electrical conductivity is easily increased by doping, increasing carrier concentration at the cost of Seebeck coefficient, but a much more interesting way is band engineering. Alloying Mg3Sb2 with Mg3Bi2 barely reduces the Seebeck coefficient, despite an increase in the curvature of the bands,102 probably due to an increased number of bands at the conduction band minimum, resulting in a higher density of states there and hence raising the Seebeck coefficient nearly as much as it is lowered by the lower effective mass. That said, in the TCOs the CBMs are several eV lower than the rest of the conduction bands, so band engineering in the same way as the Mg3(Sb,Bi)2 system is almost certainly impossible.
Table 7 Seebeck coefficient, α, electrical conductivity, σ, electronic and lattice contributions to the thermal conductivity, κe and κl and ZT for BaSnO3, CdO, SnO2 and ZnO studied here and approximate quantities for SnSe12 and AgPb18SbTe20.9 Only the total thermal conductivity was available for AgPb18SbTe20. All quantities are at 800 K. The TCOs' and SnSe's carrier concentrations are 1 × 10¹⁹ carriers per cm3 and AgPb18SbTe20's is 2.15 × 10¹⁹ carriers per cm3
| Material |
α (μV K−1) |
σ (S cm−1) |
κ
e (W m−1 K−1) |
κ
l (W m−1 K−1) |
ZT
|
| BaSnO3 |
−230 |
127 |
0.188 |
1.43 |
0.348 |
| CdO |
−204 |
150 |
0.234 |
2.97 |
0.169 |
| SnO2 |
−243 |
159 |
0.198 |
13.0 |
0.0628 |
| ZnO |
−203 |
95.2 |
0.143 |
17.4 |
0.0402 |
| SnSe (ref. 12) |
350 |
100 |
0.05 |
0.3 |
1.9 |
| AgPb18SbTe20 (ref. 9) |
−370 |
200 |
1.1 |
2.1 |
This leaves reducing the lattice thermal conductivity as the only option for improving the TCOs' thermoelectric efficiency. This is the quantity that varies most between the TCOs and hence is the determining factor in the relative magnitude of their ZTs (Fig. 7). This demonstrates that the power factor, as is sometimes used as an alternative screening metric for ZT when the lattice thermal conductivity has not been measured or calculated, is not a sufficient measure of the thermoelectric efficiency of these materials. As we predicted, the ternary BaSnO3 has the lowest lattice thermal conductivity, likely due to its comparative structural complexity. As it has two cations, we also considered the effect of BaSn–SnBa antisite pairs, but found the energy too high for a significant proportion of defects to be present (ESI Table S2†). In the binary systems, symmetry was not a good predictor of the lattice thermal conductivities of the remaining TCOs as was proposed. The high lattice thermal conductivity of ZnO can be at least partially explained by the relatively small mass difference between Zn and O, which would mean phonons can more easily transfer between the atoms. Similar reasoning cannot be applied to CdO and SnO2, perhaps because the effect of the small 6.3 amu mass difference between Cd and Sn, as opposed to the almost 50 amu difference between Zn and Cd, is small compared to other effects such as that of the bonding.
 |
| | Fig. 7 (a) The lattice thermal conductivity, κl, against temperature and (b) the ZT calculated from Phono3py and BoltzTraP against carrier concentration for BaSnO3, CdO, SnO2 and ZnO at 1000 K. | |
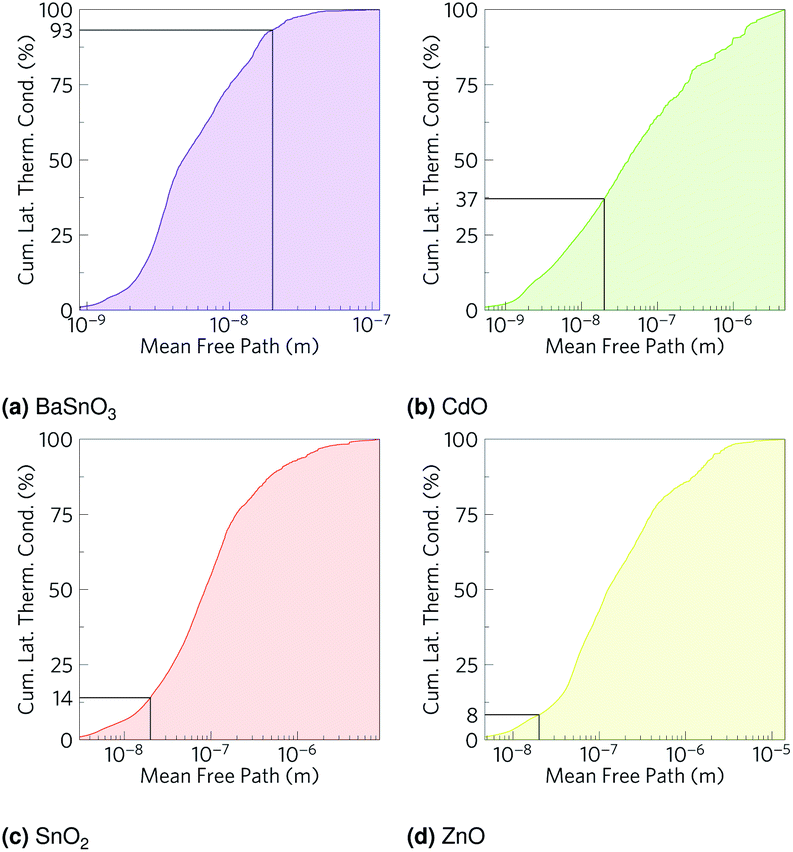
As we have calculated the lattice thermal conductivity ab initio, we have been further able to analyse its origin and hence how it can be minimised. The highest contributions to the lattice thermal conductivity occur in the metal-dominated acoustic modes, where the mean free paths are long, and the materials with the longest mean free paths are the ones with highest lattice thermal conductivities. While the low frequency modes being metal dominated may suggest changing the cations would be the optimal way to reduce the lattice thermal conductivity, this is not necessarily true, as the strength of the bonds also contributes to the lattice thermal conductivity. The fact that in BaSnO3 and SnO2 there are significant amounts of O in the low frequency modes suggests that altering the anions could also alter the characteristics of the low frequency modes, one would imagine especially if the anion were heavy and hence would vibrate at a relatively low frequency. One way reduce the mean free paths is to chemically alter the material, e.g. by ion mutation, where, for example, a 2+ ion could be replaced with 50% each of a 1+ and 3+ ion. If these ions are different sizes, the mass variation could cause more phonon scattering.103 Alternatively, a commonly used physical method is nanostructuring, physically blocking long mean free path phonons with grain boundaries. To get an indication of how effective this might be in the TCOs, the cumulative lattice thermal conductivity was plotted against mean free path (Fig. 8). Hsu et al.9 nanostructured AgPb18SbTe20 down to 20–30 nm to restrict phonon mean free paths and hence reduce the lattice thermal conductivity and increase ZT from ∼0.5 (ref. 104) to 2.2. At 1000 K, whilst only about 7% of the lattice thermal conductivity in BaSnO3 is from phonons which have mean free paths greater than 20 nm, CdO has 63% of its lattice thermal conductivity from phonons above this threshold, SnO2 has 86% and ZnO has 92% from phonons greater than 20 nm (Fig. 8). This suggests that nanostructuring may have a significant effect on the lattice thermal conductivity of CdO and especially SnO2 and ZnO, although it would also be expected to negatively effect the electrical conductivity and alter other properties as well, and it would likely preclude the TCOs from being transparent thermoelectrics due to grain boundaries scattering light. It has previously been reported, however, that boundaries can affect lattice thermal conductivity more than electrical conductivity,105 so considering only the influence on lattice thermal conductivity is not completely unfounded. Mean free path as a cause of low lattice thermal conductivity makes sense in the context of the rest of the results: BaSnO3 is the only ternary studied here, and the complexity arising from this means its mean free paths are shorter, which leads to a lower thermal conductivity and hence higher ZT. In2O3 is an example of another complex-structured TCO, which has 40 atoms per cell as opposed to the 2–6 in the materials studied here. It has the highest singly doped ZT for a TCO of 0.45 at 1273 K, attributed in part to thermal conductivities lower than the experimental results referenced here.24,99 A further example of structural complexity increasing ZT is dual Ga and Al doped ZnO,23 which achieved a ZT of 0.65, the highest for a TCO. Here, the maximum n-type ZT for single-crystal ZnO is 0.077 at 1000 K, which Ohtaki et al. improved by over eight times by co-doping.
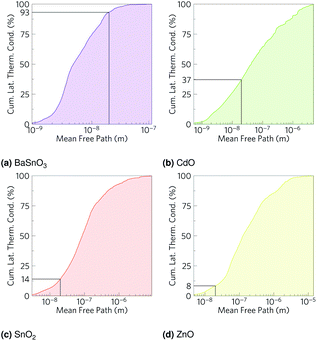 |
| | Fig. 8 Cumulative lattice thermal conductivity against phonon mean free path for (a) BaSnO3, (b) CdO, (c) SnO2 and (d) ZnO at 1000 K. The percentage of phonons of mean free path less than 20 nm is marked on. | |
By reducing the phonon lifetimes of long mean free path phonons so the mean free path is limited to a maximum of 20 nm, the level of nanostructuring achieved by Hsu et al.,9 the effect of nanostructuring on each material studied here is predicted. Note this is assuming all the other properties of the materials remain the same, which is unrealistic. It furthermore assumes that the actual interactions of the dopants are negligible, although as is clear from the dually Ga and Al doped ZnO these interactions can cause significant ZT enhancements. Nevertheless, this should give an indication of the relative effects. Under this approximation, shown in Fig. 9, BaSnO3 remains the highest efficiency thermoelectric with a barely increased ZT of 2, but due to their significant phonon mean free paths, CdO, SnO2 and ZnO increase in ZT, with the ZT of ZnO more than doubling (Table 8). Overall, BaSnO3 shows promise as a high temperature thermoelectric, reaching a ZT of 2 at 1700 K even without nanostructuring, and the naturally low mean free paths make it anyway pointless to nanostructure. Of the remainder, CdO shows least promise due to the dual factors of its relatively low decomposition temperature and relatively short mean free paths, reaching an approximated nanostructured ZT of about 0.6 at 1200 K. With their long mean free paths, SnO2 and ZnO show a greater effectiveness of nanostructuring, reaching ZTs of around 0.7 at temperatures around 1700 K, although at a given temperature they have lower ZTs than CdO. It must be stressed that these are rough approximations, omitting the effects of nanostructuring and specific dopants or combinations thereof on electronic properties, but it does help explain the significant improvements that have been made experimentally in ZnO by nanostructuring, and proposes nanostructuring SnO2 may be similarly effective.
 |
| | Fig. 9 Heat maps of the ZT against carrier concentration and temperature, excluding the phonons of mean free path greater than 20 nm to approximate the effect of nanostructuring, for (a) BaSnO3, (b) CdO, (c) SnO2 and (d) ZnO. | |
Table 8 The lattice thermal conductivity of the single crystal, κl, the ratio of phonons with mean free paths less than 20 nm and the lattice thermal conductivity with the mean free paths of these phonons limited to 20 nm, κl,nano. Then, the maximum single crystal ZT calculated here, ZTmax, the ZT with the mean free path limited lattice thermal conductivity, ZTmax,nano, and the enhancement factor of nanostructuring at 1000 K. These are computed for each of BaSnO3, CdO, SnO2 and ZnO, using as reference the study of Hsu et al.9
| Material |
BaSnO3 |
CdO |
SnO2 |
ZnO |
|
κ
l (W m−1 K−1) |
1.18 |
2.35 |
9.29 |
15.0 |
| Phonons ≤ 20 nm (%) |
92 |
38 |
17 |
8 |
|
κ
l,nano (W m−1 K−1) |
1.08 |
1.51 |
4.90 |
6.22 |
|
ZT
max
|
0.62 |
0.31 |
0.13 |
0.077 |
|
ZT
max,nano
|
0.65 |
0.45 |
0.21 |
0.17 |
| Enhancement factor (%) |
105 |
145 |
162 |
221 |
As mean free paths not only predict the thermal conductivity, and therefore ZT of these TCOs, but also determine to what extent they can be improved by nanostructuring, this research shows that the only way we can truly tell which oxides will be the most effective targets for thermoelectric materials is by fully simulating the phononic interactions, in order to predict the mean free paths.
5 Conclusions
Here we have used hybrid density functional theory and GGA lattice dynamics to analyse the origin of the thermoelectric performance of four TCOs: BaSnO3, CdO, SnO2 and ZnO. We have found that phonon mean free path is the defining factor in the thermoelectric efficiency of these materials, and that nanostructuring could offer significant improvements to those materials with the longest mean free paths. Due to its naturally low mean free paths, BaSnO3 has been predicted to be able to exceed a ZT of 2 at 1700 K, regardless of nanostructuring. Despite unremarkable ZTs reaching only about 0.5 at 1700 K without nanostructuring, as large portions of SnO2 and ZnO's lattice thermal conductivities come from long mean free path phonons, these values could potentially be increased to 0.7 with large degrees of nanostructuring. We have shown that a thorough theoretical analysis of the lattice thermal conductivity is necessary to understand how to optimise conducting oxides for thermoelectric applications.
Conflicts of interest
There are no conflicts to declare.
Acknowledgements
We are grateful to the UK Materials and Molecular Modelling Hub for computational resources, which is partially funded by EPSRC (EP/P020194/1) and to UCL for the provision of the Legion (Legion@UCL), Myriad (Myriad@UCL) and Grace (Grace@UCL) supercomputers. Via our membership of the UK's HEC Materials Chemistry Consortium, which is funded by EPSRC (EP/L000202, EP/R029431), this work used the ARCHER UK National Supercomputing Service (http://www.archer.ac.uk). AMG acknowledges Diamond Light Source for the co-sponsorship of a studentship on the EPSRC Centre for Doctoral Training in Molecular Modelling and Materials Science (EP/L015862/1). DOS acknowledges support from the EPSRC (EP/N01572X/1). DOS acknowledges membership of the Materials Design Network.
References
- S. Kan, B. Chen and G. Chen, Appl. Energy, 2019, 250, 1235 CrossRef.
-
U. Soytaş, R. Sarı, Routledge Handbook of Energy Economics, Routledge, 2019 Search PubMed.
- C. Mora, D. Spirandelli, E. C. Franklin, J. Lynham, M. B. Kantar, W. Miles, C. Z. Smith, K. Freel, J. Moy, L. V. Louis, E. W. Barba, K. Bettinger, A. G. Frazier, J. F. Colburn IX, N. Hanasaki, E. Hawkins, Y. Hirabayashi, W. Knorr, C. M. Little, K. Emanuel, J. Sheffield, J. A. Patz and C. L. Hunter, Nat. Clim. Change, 2018, 8, 1062 CrossRef CAS.
- A. Firth, B. Zhang and A. Yang, Appl. Energy, 2019, 235, 1314 CrossRef.
- R. D. Bornstein, J. Appl. Meteorol., 1968, 7, 575 CrossRef.
-
T. J. Seebeck, in Abhandlungen der Königlich Preussischen Akademie der Wissenschaften, Deutsche Akademie der Wissenschaften zu Berlin, Berlin, 1st edn, 1825, pp. 265–373 Search PubMed.
- R. Franz and G. Wiedemann, Ann. Phys., 1853, 165, 497 CrossRef.
-
G. A. Slack, in CRC Handbook of Thermoelectrics, ed. D. M. Rowe, CRC Press, Boca Raton, 1st edn, 1995, ch. 34, pp. 407–440 Search PubMed.
- K. F. Hsu, S. Loo, F. Guo, W. Chen, J. S. Dyck, C. Uher, T. Hogan, E. K. Polychroniadis and M. G. Kanatzidis, Science, 2004, 303, 818 CrossRef CAS PubMed.
- K. Biswas, J. He, I. D. Blum, C.-I. Wu, T. P. Hogan, D. N. Seidman, V. P. Dravid and M. G. Kanatzidis, Nature, 2012, 489, 414 CrossRef CAS PubMed.
- R. J. Korkosz, T. C. Chasapis, S.-h. Lo, J. W. Doak, Y. J. Kim, C.-I. Wu, E. Hatzikraniotis, T. P. Hogan, D. N. Seidman, C. Wolverton, V. P. Dravid and M. G. Kanatzidis, J. Am. Chem. Soc., 2014, 136, 3225 CrossRef CAS PubMed.
- L.-D. Zhao, S.-H. Lo, Y. Zhang, H. Sun, G. Tan, C. Uher, C. Wolverton, V. P. Dravid and M. G. Kanatzidis, Nature, 2014, 508, 373 CrossRef CAS PubMed.
- H. J. Wu, L.-D. Zhao, F. S. Zheng, D. Wu, Y. L. Pei, X. Tong, M. G. Kanatzidis and J. Q. He, Nat. Commun., 2014, 5, 4515 CrossRef CAS PubMed.
- T. Fu, X. Yue, H. Wu, C. Fu, T. Zhu, X. Liu, L. Hu, P. Ying, J. He and X. Zhao, Journal of Materiomics, 2016, 2, 141 CrossRef.
-
S. Carnot, Réflexions sur la Puissance Motrice du Feu et sur les Machines Propres à Développer Cette Puissance, Bachelier, 1824 Search PubMed.
-
S. Carnot and W. Thompson, Reflections on the Motive Power of Heat, John Wiley & Sons, 1897 Search PubMed.
- K. Koumoto, I. Terasaki and R. Funahashi, MRS Bull., 2006, 31, 206 CrossRef CAS.
- G. Wagner and H. Binder, Z. Anorg. Allg. Chem., 1958, 297, 328 CrossRef CAS.
- F. Sibieude, M. Ducarroir, A. Tofighi and J. Ambriz, Int. J. Hydrogen Energy, 1982, 7, 79 CrossRef CAS.
-
CRC Handbook of Chemistry and Physics, ed. J. R. Rumble Jr, D. R. Lide and T. J. Bruno, CRC Press, 98th edn, 2017 Search PubMed.
- M. Ohtaki, T. Tsubota, K. Eguchi and H. Arai, J. Appl. Phys., 1996, 79, 1816 CrossRef CAS.
- J. Loureiro, N. Neves, R. Barros, T. Mateus, R. Santos, S. Filonovich, S. Reparaz, C. M. Sotomayor-Torres, F. Wyczisk, L. Divay, R. Martins and I. Ferreira, J. Mater. Chem. A, 2014, 2, 6649 RSC.
- M. Ohtaki, K. Araki and K. Yamamoto, J. Electron. Mater., 2009, 38, 1234 CrossRef CAS.
- D. Bérardan, E. Guilmeau, A. Maignan and B. Raveau, Solid State Commun., 2008, 146, 97 CrossRef.
- L. Li, L. Fang, X. M. Chen, J. Liu, F. F. Yang, Q. J. Li, G. B. Liu and S. J. Feng, Phys. E, 2008, 41, 169 CrossRef CAS.
- D. Bérardan, C. Byl and N. Dragoe, J. Am. Ceram. Soc., 2010, 93, 2352 CrossRef.
- P. Mele, S. Saini, H. Honda, K. Matsumoto, K. Miyazaki, H. Hagino and A. Ichinose, Appl. Phys. Lett., 2013, 102, 253903 CrossRef.
- L. Han, N. Van Nong, L. T. Hung, T. Holgate, N. Pryds, M. Ohtaki and S. Linderoth, J. Alloys Compd., 2013, 555, 291 CrossRef CAS.
- L. Li, L. Fang, X. J. Zhou, Z. Y. Liu, L. Zhao and S. Jiang, J. Electron Spectrosc. Relat. Phenom., 2009, 173, 7 CrossRef CAS.
- T. Tsubota, M. Ohtaki, K. Eguchi and H. Arai, J. Mater. Chem., 1997, 7, 85 RSC.
- K. Cai, E. Müller, C. Drašar and A. Mrotzek, Mater. Sci. Eng., B, 2003, 104, 45 CrossRef.
- H. Cheng, X. J. Xu, H. H. Hng and J. Ma, Ceram. Int., 2009, 35, 3067 CrossRef CAS.
- N. Ma, J.-F. Li, B. P. Zhang, Y. H. Lin, L. R. Ren and G. F. Chen, J. Phys. Chem. Solids, 2010, 71, 1344 CrossRef CAS.
- X. Qu, W. Wang, S. Lv and D. Jia, Solid State Commun., 2011, 151, 332 CrossRef CAS.
- P. Fan, Y.-z. Li, Z.-h. Zheng, Q.-y. Lin, J.-t. Luo, G.-x. Liang, M.-q. Zhang and M.-c. Chen, Appl. Surf. Sci., 2013, 284, 145 CrossRef CAS.
- P. Jood, R. J. Mehta, Y. Zhang, G. Peleckis, X. Wang, R. W. Siegel, T. Borca-Tasciuc, S. X. Dou and G. Ramanath, Nano Lett., 2011, 11, 4337 CrossRef CAS PubMed.
- G. Kresse and J. Hafner, Phys. Rev. B: Condens. Matter Mater. Phys., 1993, 48, 13115 CrossRef CAS PubMed.
- G. Kresse and J. Hafner, Phys. Rev. B: Condens. Matter Mater. Phys., 1993, 47, 558 CrossRef CAS PubMed.
- G. Kresse and J. Hafner, J. Phys.: Condens. Matter, 1994, 6, 8245 CrossRef CAS.
- G. Kresse and J. Furthmüller, Comput. Mater. Sci., 1996, 6, 15 CrossRef CAS.
- P. E. Blöchl, Phys. Rev. B: Condens. Matter Mater. Phys., 1994, 50, 17953 CrossRef PubMed.
- J. P. Perdew, K. Burke and M. Ernzerhof, Phys. Rev. Lett., 1996, 77, 3865 CrossRef CAS PubMed.
- J. P. Perdew, A. Ruzsinszky, G. I. Csonka, O. A. Vydrov, G. E. Scuseria, L. A. Constantin, X. Zhou and K. Burke, Phys. Rev. Lett., 2008, 100, 136406 CrossRef PubMed.
- G. M. D. Nguimdo and D. P. Joubert, Eur. Phys. J. B, 2015, 88, 113 CrossRef.
- M. De La Pierre, R. Orlando, L. Maschio, K. Doll, P. Ugliengo and R. Dovesi, J. Comput. Chem., 2011, 32, 1775 CrossRef CAS PubMed.
- L. He, F. Liu, G. Hautier, M. J. T. Oliveira, M. A. Marques, F. D. Vila, J. J. Rehr, G.-M. Rignanese and A. Zhou, Phys. Rev. B: Condens. Matter Mater. Phys., 2014, 89, 064305 CrossRef.
- D. R. Hartree, Math. Proc. Cambridge Philos. Soc., 1928, 24, 89 CrossRef CAS.
- V. Fock, Z. Phys. A, 1930, 61, 126 Search PubMed.
- J. Heyd and G. E. Scuseria, J. Chem. Phys., 2004, 121, 1187 CrossRef CAS PubMed.
- J. Heyd, J. E. Peralta, G. E. Scuseria and R. L. Martin, J. Chem. Phys., 2005, 123, 174101 CrossRef PubMed.
- S. Chen, X. G. Gong, A. Walsh and S.-H. Wei, Appl. Phys. Lett., 2009, 94, 041903 CrossRef.
- B. G. Janesko, T. M. Henderson and G. E. Scuseria, Phys. Chem. Chem. Phys., 2009, 11, 443 RSC.
- D. O. Scanlon, B. J. Morgan, G. W. Watson and A. Walsh, Phys. Rev. Lett., 2009, 103, 096405 CrossRef.
- A. Stroppa and G. Kresse, Phys. Rev. B: Condens. Matter Mater. Phys., 2009, 79, 201201 CrossRef.
- J. P. Allen, D. O. Scanlon and G. W. Watson, Phys. Rev. B: Condens. Matter Mater. Phys., 2010, 81, 161103 CrossRef.
- F. Oba, M. Choi, A. Togo, A. Seko and I. Tanaka, J. Phys.: Condens. Matter, 2010, 22, 384211 CrossRef PubMed.
- A. Stroppa and S. Picozzi, Phys. Chem. Chem. Phys., 2010, 12, 5405 RSC.
- M. Burbano, D. O. Scanlon and G. W. Watson, J. Am. Chem. Soc., 2011, 133, 15065 CrossRef CAS PubMed.
- P. Deák, B. Aradi and T. Frauenheim, Phys. Rev. B: Condens. Matter Mater. Phys., 2011, 83, 155207 CrossRef.
- A. B. Kehoe, D. O. Scanlon and G. W. Watson, Phys. Rev. B: Condens. Matter Mater. Phys., 2011, 83, 233202 CrossRef.
- D. O. Scanlon, A. B. Kehoe, G. W. Watson, M. O. Jones, W. I. F. David, D. J. Payne, R. G. Egdell, P. P. Edwards and A. Walsh, Phys. Rev. Lett., 2011, 107, 246402 CrossRef PubMed.
- D. O. Scanlon and G. W. Watson, J. Mater. Chem., 2011, 21, 3655 RSC.
- A. Walsh, S. Chen, S.-H. Wei and X.-G. Gong, Adv. Energy Mater., 2012, 2, 400 CrossRef CAS.
- D. Fritsch, B. J. Morgan and A. Walsh, Nanoscale Res. Lett., 2017, 12, 19 CrossRef.
- J. Heyd, G. E. Scuseria and M. Ernzerhof, J. Chem. Phys., 2003, 118, 8207 CrossRef CAS.
- D. O. Scanlon, Phys. Rev. B: Condens. Matter Mater. Phys., 2013, 87, 161201 CrossRef.
- D. O. Scanlon and G. W. Watson, J. Mater. Chem., 2012, 22, 25236 RSC.
- A. M. Ganose and D. O. Scanlon, J. Mater. Chem. C, 2016, 4, 1467 RSC.
- F. Oba, A. Togo, I. Tanaka, J. Paier and G. Kresse, Phys. Rev. B: Condens. Matter Mater. Phys., 2008, 77, 245202 CrossRef.
- A. M. Ganose, A. J. Jackson and D. O. Scanlon, J. Open Source Softw., 2018, 3, 717 CrossRef.
- G. K. H. Madsen and D. J. Singh, Comput. Phys. Commun., 2006, 175, 67 CrossRef CAS.
- A. Togo and I. Tanaka, Scr. Mater., 2015, 108, 1 CrossRef CAS.
- A. Togo, L. Chaput and I. Tanaka, Phys. Rev. B: Condens. Matter Mater. Phys., 2015, 91, 094306 CrossRef.
- X. Gonze, J.-C. Charlier, D. C. Allan and M. P. Teter, Phys. Rev. B: Condens. Matter Mater. Phys., 1994, 50, 13035 CrossRef CAS PubMed.
- J. M. Skelton, D. Tiana, S. C. Parker, A. Togo, I. Tanaka and A. Walsh, J. Chem. Phys., 2015, 143, 064710 CrossRef PubMed.
- K. Momma and F. Izumi, J. Appl. Crystallogr., 2011, 44, 1272 CrossRef CAS.
- G. A. Geguzina and V. P. Sakhnenko, Crystallogr. Rep., 2004, 49, 15 CrossRef CAS.
- H. Singh and B. Dayal, Solid State Commun., 1969, 7, 725 CrossRef CAS.
- R. L. Clendenen and H. G. Drickamer, J. Chem. Phys., 1966, 44, 4223 CrossRef CAS.
- R. R. Reeber, J. Appl. Phys., 1970, 41, 5063 CrossRef CAS.
- S. C. Dixon, S. Sathasivam, B. A. D. Williamson, D. O. Scanlon, C. J. Carmalt and I. P. Parkin, J. Mater. Chem. C, 2017, 5, 7585 RSC.
- G. Larramona, C. Gutiérrez, I. Pereira, M. R. Nunes and F. M. da Costa, J. Chem. Soc., Faraday Trans. 1, 1989, 85, 907 RSC.
- H. Mizoguchi, H. W. Eng and P. M. Woodward, Inorg. Chem., 2004, 43, 1667 CrossRef CAS PubMed.
- W. Zhang, J. Tang and J. Ye, J. Mater. Res., 2007, 22, 1859 CrossRef CAS.
- I. N. Demchenko, J. D. Denlinger, M. Chernyshova, K. M. Yu, D. T. Speaks, P. Olalde-Velasco, O. Hemmers, W. Walukiewicz, A. Derkachova and K. Lawniczak-Jablonska, Phys. Rev. B: Condens. Matter Mater. Phys., 2010, 82, 075107 CrossRef.
- M. Nagasawa and S. Shionoya, Phys. Lett., 1966, 22, 409 CrossRef CAS.
- D. Fröhlich, R. Kenklies and R. Helbig, Phys. Rev. Lett., 1978, 41, 1750 CrossRef.
- K. Reimann and M. Steube, Solid State Commun., 1998, 105, 649 CrossRef CAS.
- M. Feneberg, C. Lidig, K. Lange, R. Goldhahn, M. D. Neumann, N. Esser, O. Bierwagen, M. E. White, M. Y. Tsai and J. S. Speck, Appl. Phys. Lett., 2014, 104, 231106 CrossRef.
- W. Y. Liang and A. D. Yoffe, Phys. Rev. Lett., 1968, 20, 59 CrossRef CAS.
-
C. Bradley and A. Cracknell, The Mathematical Theory of Symmetry in Solids: Representation Theory for Point Groups and Space Groups, Oxford University Press, 2009 Search PubMed.
- G. J. Snyder and E. S. Toberer, Nat. Mater., 2008, 7, 105 CrossRef CAS PubMed.
- A. K. Singh, A. Janotti, M. Scheffler and C. G. Van de Walle, Phys. Rev. Lett., 2008, 101, 055502 CrossRef.
- P. Ágoston, C. Körber, A. Klein, M. J. Puska, R. M. Nieminen and K. Albe, J. Appl. Phys., 2010, 108, 053511 CrossRef.
- A. Janotti and C. G. Van de Walle, Phys. Rev. B: Condens. Matter Mater. Phys., 2007, 76, 165202 CrossRef.
- J. E. N. Swallow, B. A. D. Williamson, T. J. Whittles, M. Birkett, T. J. Featherstone, N. Peng, A. Abbott, M. Farnworth, K. J. Cheetham, P. Warren, D. O. Scanlon, V. R. Dhanak and T. D. Veal, Adv. Funct. Mater., 2018, 28, 1701900 CrossRef.
- M. J. Powell, B. A. D. Williamson, S.-Y. Baek, J. Manzi, D. B. Potter, D. O. Scanlon and C. J. Carmalt, Chem. Sci., 2018, 9, 7968 RSC.
- L. Li, S. Liang, S. Li, J. Wang, S. Wang, G. Dong and G. Fu, Nanotechnology, 2014, 25, 425402 CrossRef PubMed.
- T. Maekawa, K. Kurosaki and S. Yamanaka, J. Alloys Compd., 2006, 416, 214 CrossRef CAS.
- N. Mott, Rev. Mod. Phys., 1968, 40, 677 CrossRef CAS.
- P. P. Edwards and M. J. Sienko, Phys. Rev. B: Condens. Matter Mater. Phys., 1978, 17, 2575 CrossRef CAS.
- J. Zhang and B. B. Iversen, J. Appl. Phys., 2019, 126, 085104 CrossRef.
- T. Shibuya, J. M. Skelton, A. J. Jackson, K. Yasuoka, A. Togo, I. Tanaka and A. Walsh, APL Mater., 2016, 4, 104809 CrossRef.
- Y.-L. Pei and Y. Liu, J. Alloys Compd., 2012, 514, 40 CrossRef CAS.
- M. S. Dresselhaus, G. Chen, M. Y. Tang, R. G. Yang, H. Lee, D. Z. Wang, Z. F. Ren, J.-P. Fleurial and P. Gogna, Adv. Mater., 2007, 19, 1043 CrossRef CAS.
Footnotes |
| † Electronic supplementary information (ESI) available. See DOI: 10.1039/d0ta02247k |
| ‡ Lawrence Berkeley National Laboratory, Energy Technologies, Area, 1 Cyclotron Road, Berkeley, CA 94720, USA. |
|
| This journal is © The Royal Society of Chemistry 2020 |
Click here to see how this site uses Cookies. View our privacy policy here. 
 Open Access Article
 This Open Access Article is licensed under a
  ab,
Alex M.
Ganose‡
ab,
Alex M.
Ganose‡
 . CdO crystallises in the rocksalt structure, space group Fm
 , with axial bonds of 2.072 Å which form edge-sharing chains along the c axis; and equatorial bonds of 2.066 Å, which are corner-sharing in the ab planes. ZnO has the wurtzite structure, space group P63mc (186), a hexagonal cell with a and b side lengths of 3.24 Å separated 120° perpendicular to the c direction of 5.22 Å; the atoms are arranged as corner sharing ZnO4 tetrahedra of bond length 1.979 Å at
  and
and  . As BaSnO3 is ternary, its more complex structure would be expected to have a reduced lattice thermal conductivity compared to the binary oxides, and hence higher ZT. Of the rest, ZnO is hexagonal, which has only twelve symmetry operations and so might be expected to have the lowest lattice thermal conductivity and hence highest ZT, followed by the tetragonal SnO2 with 16 symmetry operations and cubic CdO with 48. All the structures relaxed to within 1% of their experimental lattice parameters77–80 (ESI Table S1†).
 is the curvature of the electron bands, calculated with sumo70 by using parabolic band fitting. All the conduction band minima (CBMs) are highly disperse, in line with previous calculations.58,66,67,81 The electron effective masses calculated from this are in the range 0.16–0.26me (Table 4), which are low and therefore show a high n-type mobility in all the TCOs, so when doped they will have a high n-type conductivity, but a limited Seebeck coefficient. All give bandgaps in good agreement with experiment (Table 5).