 Open Access Article
Creative Commons Attribution 3.0 Unported Licence
Identifying Raman modes of Sb2Se3 and their symmetries using angle-resolved polarised Raman spectra†
Nicole
Fleck‡
 a,
Theodore D. C.
Hobson‡
 a,
Christopher N.
Savory
 b,
John
Buckeridge
 c,
Tim D.
Veal
 a,
Maria R.
Correia
d,
David O.
Scanlon
 be,
Ken
Durose
a and
Frank
Jäckel
 *a
*a
aStephenson Institute for Renewable Energy and Department of Physics, University of Liverpool, Peach Street, Liverpool L69 7ZF, UK. E-mail: fjaeckel@liverpool.ac.uk
bUniversity College London, Department of Chemistry and Thomas Young Centre, 20 Gordon Street, London WC1H 0AJ, UK
cSchool of Engineering, London South Bank University, London SE1 0AA, UK
dDepartamento de Física and i3N, Universidade de Aveiro, 3810-193 Aveiro, Portugal
eDiamond Light Source Ltd., Diamond House, Harwell Science and Innovation Campus, Didcot, OX11 0DE, UK
First published on 15th April 2020
Abstract
The physical properties of antimony selenide (Sb2Se3) are highly anisotropic. Angle-resolved polarised Raman spectroscopy was employed to characterise oriented crystals and used in conjunction with group theory structural analysis to assign vibrational symmetries to the peaks observed in the Raman spectra. The phonon energies were corroborated via density functional theory (DFT) calculations. Furthermore, a straightforward method is proposed to verify the desirable (001) plane orientation of film growth for device applications via minimisation of the 155 cm−1 peak in the Raman spectrum.
Introduction
Antimony selenide (Sb2Se3) is an anisotropic semiconductor with a room temperature band gap of 1.18 eV.1 It is currently a highly attractive candidate for low-cost, large volume photovoltaic electricity generation.2 Indeed, single junction power conversion efficiencies have reached 9.2%3 from 2.1%4 in only 6 years. Pushing the solar cell efficiency to over 10% would make Sb2Se3 viable for industrial scale up. It is also of interest for water splitting, as a superconductor and as a thermoelectric material.5–7 Nevertheless the state of knowledge of its fundamental properties has been slow to develop.Sb2Se3 has an orthorhombic structure under atmospheric pressure and belongs to the Pbnm space group and D2h point group (Schoenflies notation) with lattice parameters a = d100 = 11.6311 Å, b = d010 = 11.7808 Å, c = d001 = 3.9767 Å.8 The structure is comprised of 1D nanoribbons coordinated via van der Waals interactions.9 The three main crystal planes are shown in Fig. 1. The Pbnm space group nomenclature is used in this paper, meaning the [001] direction is parallel to the ribbon growth direction. Both Pbnm and Pnma space groups can be found in the discussion of Sb2Se3 which may lead to confusion (Pnma convention aligns the [010] direction with the ribbon axis).
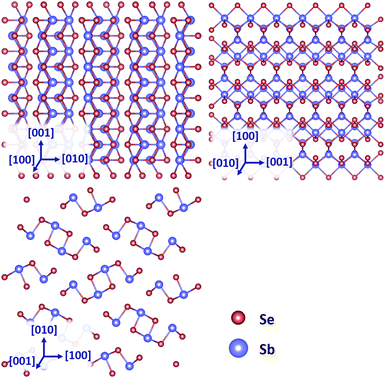 | ||
| Fig. 1 Schematic of (100), (010) and (001) crystal planes of Sb2Se3. Images generated using Vesta software.10 | ||
Raman spectroscopy is a fast and usually non-destructive technique which can be used to characterise Sb2Se3 and its impurity phases.11 While gaps in the literature remain, some recent analysis of Sb2Se3via Raman spectroscopy has furthered the current understanding of this material. In 2018, Shongalova et al. resolved an issue of misinterpretation of one of the peaks in the analysis of previous Raman spectra.11 While much of the literature indexed the peak at 250 cm−1 as characteristic of Sb2Se3, it was found to be an antimony oxide (α-Sb2O3) peak. This occurred mainly due to sample degradation under high laser power during measurement but these peaks are indistinguishable from Sb2O312,13 or elemental selenium14 impurities already present in the sample from the growth/synthesis. The following year, the process of comprehensively indexing the Raman active vibrational modes of Sb2Se3 was begun by Vidal-Fuentes et al.15 including a low temperature study. However, due to the small size of the crystallite analysed, its orientation could not be determined and the symmetries of the vibrations could not be assigned fully.
Raman mode symmetries describe the nature of the vibrations in a material. Sb2Se3 is known to be isostructural to Sb2S3 which has 60 zone centre phonons of symmetry Γ = 10Ag + 5B1g + 10B2g + 5B3g + 5Au + 10B1u + 5B2u + 10B3u. Both A and B modes are non-degenerate with A modes showing symmetric behaviour and B modes being anti-symmetric. The subscript g indicates the mode is symmetric under inversion while u indicates it is anti-symmetric. In Sb2Se3, the Au modes are silent and the Bu modes are IR-active. The set of Raman active modes have the following symmetries predicted by group theory: Γ = 10Ag + 5B1g + 10B2g + 5B3g.
Angle-resolved polarised Raman spectroscopy has been used in the literature to assign vibrational symmetries to phonon modes, for example in ZnO, NbSe3, MoTe2 and BaTiO3 crystals.16–19 For anisotropic crystals, birefringence has an impact on the scattering of polarised light described by Kranert et al.20 However, this effect is negligible for highly absorbing materials such as Sb2Se3 hence the more straightforward approach described in the results continues to hold.
Optimum Sb2Se3 solar cell device performance is currently achieved by growing the ribbons perpendicularly to the contacting layers i.e. preferential growth in the [001] direction.21 Angle-resolved polarised Raman spectroscopy has been used to determine the orientation and variation thereof across polycrystalline, thin film absorber, CuInSe2.22 The same approach could be used to identify the orientation of Sb2Se3 thin films and even identify the variation from grain to grain which may significantly affect device performance. Vidal-Fuentes et al. also proposed this, however it has not been realised to date.15 In this way rapid determination of the dominant orientation of films of Sb2Se3 would streamline the fabrication and characterisation process.
In this study, a combined experimental, group theory and density functional theory (DFT) approach is presented to comprehensively measure and identify the Raman bands in Sb2Se3. This study differs from earlier work in that the experiments are for a set of oriented (100), (010) and (001) crystallographic surfaces which has enabled the symmetry of the vibrational modes to be assigned reliably for the first time. Furthermore, DFT calculations were used to determine the Raman active phonon mode energies of Sb2Se3 and these corroborated the experimental results as well as suggesting additional vibrational modes. The results are expected to have relevance to both the basic science and technological communities.
Experimental and computational details
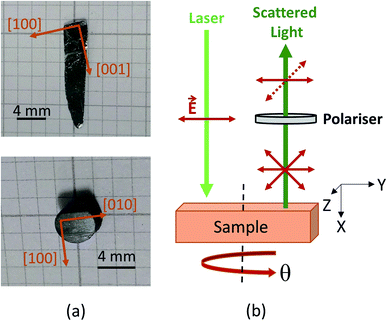
Sb2Se3 crystals were prepared via the Bridgman technique using a single-zone vertical furnace. The details can be found in the ESI (ESI Section I†). Crystals were grown up to 4 mm in diameter and 1 cm in length. The crystals demonstrated bright cleavage planes extending over their full width and displayed narrow X-ray diffraction (XRD) peaks (see Table S1†). The crystals could be easily manually cleaved to expose the (010) plane and reveal reflective facets.8 This is consistent with the expectation that the weakest van der Waals interactions lie along the [010] axis.23 Straight, parallel lines observed using optical microscopy on the surface of the cleaved planes (see Fig. S1†) result from cleavage steps and are expected to run parallel to the 1D nanoribbons ([001] axis), as this is the axis with the most strongly bound layers. These were used as guides to orient the crystal optically on a goniometer and cut to reveal the (100) and (001) planes without the need for Laue equipment.The cleaved (010) plane and cut (001) plane can be seen in Fig. 2a. Cutting the (001) plane was found to be most challenging as it was mechanically less stable than the other orientations. Crystals of this orientation were therefore mounted in epoxy to prevent unwanted cleaving during polish/storage. The surfaces of the cut (100) and (001) plane crystals were polished with 0.3 μm alumina particles in de-ionised water. The cleaved (010) faces did not require polishing. To verify the surface orientations of the crystals, XRD (θ–2θ scan) was performed using a Rigaku Smartlab diffractometer in parallel beam geometry using a monochromated Cu-Kα1 X-ray source.
Angle-resolved polarised Raman spectroscopy (backscattering geometry) was used to assign the vibrational symmetries to the Raman modes. The setup is shown in Fig. 2b. Linearly polarised light impinges on the sample. The scattered light is passed through a polariser oriented either parallel (solid arrow) or perpendicular (dashed arrow) to the polarisation of the incident beam. The geometry can be described in Porto notation24 where Z(XX)![[Z with combining macron]](https://www.rsc.org/images/entities/i_char_005a_0304.gif) implies the photons are incident in the Z-direction and directly backscattered light (
implies the photons are incident in the Z-direction and directly backscattered light (![[Z with combining macron]](https://www.rsc.org/images/entities/i_char_005a_0304.gif) ) is detected. The labels in parenthesis indicate the incident beam polarisation is in the X-direction and X-polarised light is detected (parallel polariser geometry). The crossed polariser geometry, Z(XY)
) is detected. The labels in parenthesis indicate the incident beam polarisation is in the X-direction and X-polarised light is detected (parallel polariser geometry). The crossed polariser geometry, Z(XY)![[Z with combining macron]](https://www.rsc.org/images/entities/i_char_005a_0304.gif) was used also.
was used also.
The crystals were rotated in the polarisation plane being studied while the Raman peak intensities were monitored. The sample angle (θ) was varied between 0° and 180° in 10° increments and a spectrum was acquired at each yielding 19 spectra in each dataset. A dataset was taken for each of the three crystal planes in both parallel and perpendicular polariser configurations. A total of 114 spectra were recorded.
Room temperature Raman spectroscopy was carried out using a Renishaw in-Via microscope with a 532 nm laser. The maximum laser power (at the sample) was limited to 0.1 mW with maximum power density of 3.2 kW cm−2 to prevent sample damage. No degradation effects (peak at 250 cm−1 or higher) were observed in any of the spectra acquired. The power density at which oxidation occurs varies across studies11,15 and was observed to vary even for different crystal planes. Analysis of this behaviour requires further work and is beyond the scope of this study but may be dependent on the wavelength of the illuminating laser and/or surface termination of the sample. A low-pass filter with a cut off at 100 cm−1 relative to the laser excitation wavelength was used. The scan time was 30 s with 20 accumulations for each spectrum. A silicon reference sample was used to calibrate the instrument and the Raman peak at 520 cm−1 had a FWHM of 4.3 cm−1. A 1800 lines per mm grating was employed and the error in position of the fitted peaks was estimated to be ±1 cm−1. Calibration spectra with the polariser in place were taken before and after the crystal rotational measurements and a consistent upward drift of ∼1 cm−1 was noted between the first and final measurement.
Lorentzian peaks were fitted to the spectra in each dataset using a global fitting method. Values for the peak positions, FWHM and peak intensities were extracted by a self-consistent fitting methodology using the “global fit” feature of the Origin 2019 software. A linear background was subtracted from all spectra before fitting. Seed values for peak position, FWHM and peak intensity were input with the positions and FWHM set as shared parameters. For each equivalent peak across the spectra, a single value of position and FWHM was calculated per dataset (i.e. 19 spectra) while the peak intensity was allowed to vary from spectrum to spectrum. The peak position values were not constrained to a given range during the fitting. Constraining the parameters would force consistency across the datasets. The positions were kept as shared parameters within a dataset but free to vary between datasets. The resulting values were compared across datasets to determine the accuracy and reliability of the fitting procedure.
Group theory calculations were performed to evaluate the sample angle dependence of the intensities of the Raman active modes. These dependences were calculated using a matrix method for both the parallel and perpendicular polariser geometry. The full description can be found in ESI Section II† and the outcomes are described in the results.
Periodic DFT calculations provided theoretical prediction of the Raman vibrational energies using scalar relativistic potentials within the Vienna Ab initio Simulation Package (VASP).25–28 The Perdew–Burke–Ernzerhof generalised gradient approximation (GGA) exchange-correlation functional revised for solids (PBEsol)29,30 was used for both structural relaxation and phonon supercell calculations. Interactions between the valence and core electrons were described via the projector augmented wave method.31 The Phonopy32 package was used to generate twenty 2 × 4 × 2 (320 atom) finite displacement supercells from the PBEsol relaxed structure to obtain the phonon frequencies of Sb2Se3. In all calculations, the total energy was converged to within 1 ×10⁻⁸ eV and the forces per atom were converged to within 1 ×10⁻⁴ eV Å−1. A plane wave cut off of 500 eV was used throughout and a Γ-centred k-point mesh of 2 × 2 × 2 was used for the supercell calculations. Plotting of the phonon dispersion curve was performed through the use of the sumo package.33
Previous computational studies on Sb2Se3 have either used the PBE or HSE06 functionals (with or without dispersion corrections) to describe its structural properties.34–36 PBEsol optimises the structure to within 0.5% of experimental values for the a and c lattice parameters while underestimating the b parameter by just over 2%. While HSE06 gives an optimised geometry to within 2% of experiment,37 PBEsol is much more cost effective for the large supercells required to converge the phonon frequencies. PBEsol has also shown improved performance over PBE in the calculation of vibrational properties in other chalcogenide materials.38,39 While electronic structure calculations of Sb2Se3 have been conducted by numerous groups and calculation of the phonon dispersion has also been reported,40,41 tabulation of predicted phonon mode energies via DFT calculations and comparison to experimental data has not been published to date.
Results
Fig. 3 shows XRD patterns of the cut (100) and (001) and cleaved (010) crystal planes. In all cases, the first structure-factor-allowed reflection is present followed by the higher order peaks. This confirms that the use of the cleaving method to identify the (010) plane and cutting relative to the [001] axis is a reliable means of orienting Sb2Se3 on its orthorhombic faces. This method may also be successful for other van der Waals crystals.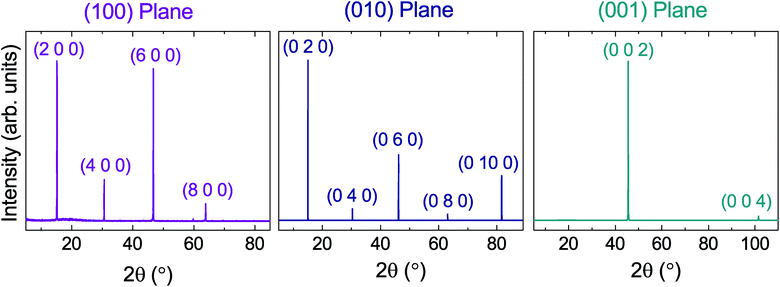 | ||
| Fig. 3 XRD patterns of the cut (100), cleaved (010) and cut (001) Sb2Se3 crystal planes showing the fundamental and higher order peaks and thus confirming the crystal orientations. | ||
A summary of the results of group theory analysis is presented in Table 1. The constants A–F represent Raman tensor elements. The Raman peak intensity variation, with respect to sample rotation (I–θ), of each vibrational mode (Ag, B1g, B2g and B3g) was determined. This peak intensity variation depends on the crystal plane being analysed (I100, I010 or I001) and whether the polariser was parallel or perpendicular to the incident laser polarisation (I∥ or I⊥). In the parallel polariser geometry, all Ag mode intensities in each of the three crystal planes have a periodicity of 180°. The Bg mode intensities will repeat after 90° due to their 2θ dependence. In perpendicular polariser geometry, both Ag and Bg modes have 90° periodicity, however, Ag modes show sine-like behaviour and Bg modes show cosine-like behaviour. Ag and Bg modes can therefore easily be distinguished in both polariser orientations. In this way, knowing the crystal plane as well as the expected peak intensity variation of the individual Raman peaks allows their symmetries to be identified.
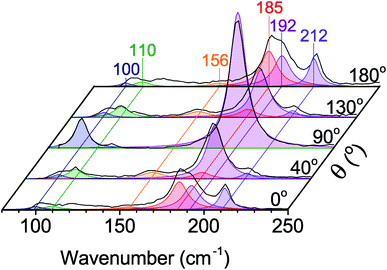
Fig. 4 shows an example (the (100) plane, parallel polariser) of the angle-resolved datasets collected and the fitting procedure used for analysis. The black line indicates the raw data while the coloured peaks show the fitted Lorentzian lineshapes. Similar plots for the (010) and (001) planes are shown in Fig. S2† and a more detailed example fit of a single Raman spectrum can be found in Fig. S3.† For each peak in the figure, the peak intensity (I) vs. sample angle (θ) was extracted and plotted. This data was compared and fitted to the expected I–θ behaviour from Table 1. Fig. 5 shows the data points for the 185 cm−1 peak I–θ plot. The solid lines are fits to the data points of the relevant functions from Table 1. For example, the 185 cm−1 peak has maximum intensity at 0° rotation, minimum at 90° and returns to its maximum at 180° rotation of the crystal. The 180° period is characteristic of an Ag symmetry vibration. Therefore the function fitted to the data was for an Ag mode in the (100) plane with parallel polariser geometry. The tensor elements were used as fitting parameters. Due to the reliable and consistent fit of the expected Ag function for all crystal orientations and both polariser geometries the symmetry can be confirmed as Ag. These plots were prepared for each peak in each of the six datasets in order to identify the mode symmetries. The remaining plots can be found in the Fig. S5–S7.† These plots show excellent consistency in peak position with only small variations (within the expected error of 1 cm−1) in values obtained from the different planes and polariser configurations. This further validates the rigorous analysis procedure.
Fig. 6 shows the DFT-calculated dispersion of the phonon bands along the high symmetry path within the Brillouin zone. Due to the fact that Raman spectroscopy probes only zone-centre phonons the corresponding theoretical values can be noted from the intersection of the phonon bands with the Γ point. 30 phonon energies were predicted in this way which is consistent with the expected 10Ag + 5B1g + 10B2g + 5B3g modes of Sb2Se3. The peaks determined using DFT were found to be shifted from the experimental positions in a systematic manner (−11 cm−1) which has been discussed previously for phonon energies calculated using the PBEsol functional with a similar shift found (−10 cm−1).42 Such disagreement can result from a combination of differences in computational lattice parameters versus experiment. This in turn may be a consequence of the athermal limit and inaccuracies in the DFT approach in modelling the interatomic forces precisely. For a material such as Sb2Se3, where strong and weak interactions are present in different directions, modelling the interatomic forces is challenging. Nevertheless a consistent linear shift of the DFT computed peaks upwards by 11 cm−1 resulted in excellent agreement with experimental results as seen in Table 2.
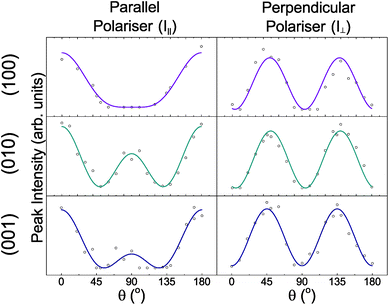 | ||
| Fig. 5 Raman peak intensity plots, I–θ, for the 185 cm−1 peak for each crystal plane in parallel and perpendicular polariser configuration. The points represent the experimental data while the solid line is a fit to the data using the relevant dependences in Table 1. | ||
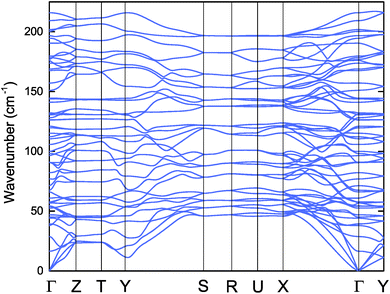 | ||
| Fig. 6 Phonon dispersion curve of Sb2Se3, calculated using PBEsol. The k-point labels use the convention of Bradley and Cracknell.43 | ||
| Exp. | Symmetry | FWHM | DFT | Lit. (RT) | Symmetry | FWHM | Lit. (10 K) |
|---|---|---|---|---|---|---|---|
| a Tentative symmetry assignment. | |||||||
| 213 | A1g | 6.4 | 213 | 212.8 | Ag | 6.0 | 215.6 |
| 212 | B11g | 5.3 | 211 | ||||
| 205 | B21g | 11.5 | 205 | 207.8 | 7.3 | 209.0/203.7 | |
| 192 | A2g | 11.9 | 190 | 191.5 | Ag | 10.6 | 195.8 |
| 187 | A3g | 11.8 | 187 | ||||
| 185 | A4g | 10.6 | 185 | 184.7 | Ag | 11.5 | 189.1 |
| 180 | 182.7 | ||||||
| 178 | 174.7/168.3/164 | ||||||
| 156 | B13g | 15.1 | 156 | ||||
| 155 | B12g | 13.9 | 155 | 154.4 | Bxg | 13.2 | 157.4 |
| 143/142/132 | |||||||
| 131 | B22g | 14.6 | 131 | 132.2 | Bxg | 14.0 | 138.7 |
| 124 | B32g | 9.9 | 126/124 | 125.7 | Bxg | 12.3 | 130.0 |
| 122 | 122.9 | ||||||
| 117 | A5ga | 117 | 118.7 | Ag | 8.7 | 119.0/114.7 | |
| 111 | B23g | 7.5 | 111/107 | 109.3 | Bxg | 13.0 | 111.4 |
| 102.6 | Bxg | 6.7 | 107.2 | ||||
| 101 | A6g | 8.3 | 93 | 100.1 | Ag | 3.8 | 103.3 |
| 97.6 | Bxg | 3.8 | 99.5 | ||||
| 88 | 94.9/91.2 | ||||||
| 82 | A7ga | 83 | 80.1 | Ag | 2.9 | 83.4 | |
| 72/69 | 78.5/76.0 | ||||||
| 68 | 74.7/71.9 | ||||||
| 58/56 | 61.6 | Ag | 2.4 | ||||
| 55/49 | 54.4 | Bxg | 2.0 | ||||
A complete description of the determined vibrational modes of Sb2Se3 is presented in Table 2. The experimental peaks, their symmetries, theoretically predicted modes and previously reported peak positions15 are compared and show very good agreement. Seven Ag modes and seven Bg modes were assigned experimentally. Several assignments deviate from those seen by Vidal-Fuentes and are further discussed below. Vidal-Fuentes et al.15 could not resolve the peaks found at 212, 187 and 156 cm−1 with a randomly oriented crystal. For the same reason, the Bg symmetries could previously not be assigned. All other peaks seen by Vidal-Fuentes were corroborated by the experimental peak positions determined here. In addition, the partial symmetry assignments Vidal-Fuentes report are consistent with the symmetries determined in this study.
While Vidal-Fuentes report a single peak at 213 cm−1, the experimental results here from the (001) plane indicated two closely spaced peaks (213 and 212 cm−1). The B1g modes show large relative intensity in the perpendicular polariser geometry for this plane (see Fig. S7†). Due to intensity differences, the 213 cm−1 Ag mode cannot be resolved in the perpendicular polariser case and the 212 cm−1 B1g mode is of too low intensity to be seen in the parallel polariser geometry. The existence of two peaks in this region is also consistent with the closely spaced modes predicted via DFT. Data from the (010) plane suggests two Ag peaks in this region, however this second peak of Ag symmetry was not observed in any other plane. It has been included for completeness but could not be confidently labelled (Fig. S6†).
For the (001) plane, the global fit for the Ag mode around 185 cm−1 was shifted to 187 cm−1 for both the parallel and perpendicular polariser case (see Fig. S7†) over numerous repetitions of the experiment. This is a strong indication of the existence of another mode and is again corroborated by the theoretical calculations. This also holds true for the mode at 155 cm−1. The peak at 155 cm−1 is clearly visible in the (010) plane spectra (see Fig. S6†) and a 156 cm−1 feature is visible in the (100) plane (Fig. S5†). The latter could be an artefact from the collection cone angle of the objective lens which does not uniquely collect light scattered normal to the sample surface.19 However the consistency of the results with theory and literature suggest this is not the case.
Once a shift of +11 cm−1 was applied, the DFT calculations predicted all of the experimentally observed modes to a high degree of accuracy. Some modes which were not observed experimentally were also predicted. In contrast to the calculations, no modes around 140 cm−1 were seen in the Raman spectra which is consistent with the experimental data from Vidal-Fuentes et al. This discrepancy may be due to the low intensity of these vibrational modes. The remaining predicted modes show very good agreement with those experimentally observed.
The 110–140 cm−1 region was difficult to analyse in the (100) and (001) planes as there are many overlapping modes. The broad nature and low intensity of the features in this region prohibit accurate global fits to be calculated. Individual spectra in each crystal orientation show a clear peak at 117 cm−1 (see ESI Fig. S2–S4†). This mode was assigned as Ag as only these modes are expected to be visible in spectra for all three crystal orientations. However, this assignment should be considered tentative on the present evidence, even though it is consistent with both Vidal-Fuentes and DFT predictions. Nevertheless, the additional peaks predicted by DFT in this region are expected to be present although they cannot be resolved in the data measured at room temperature.
The peak at 100 cm−1 lies at the edge of the Raman spectrometer filter cut off and thus the position may be artificially high. This mode showed strong Ag vibrational symmetry in all parallel polariser configurations and was therefore included. The cut off using the perpendicular polariser case was slightly higher so that the mode at 100 cm−1 was no longer visible and could not be analysed. The filter cut-off generally limited the analysis of the vibrations at wavenumbers below 100 cm−1. The mode at 82 cm−1 is included in the table, with a tentative assignment of symmetry, even though its intensity was reduced by the cut off of the low-pass filter. Nevertheless this peak remained visible in the spectra and displayed a peak intensity variation consistent with an Ag mode (Fig. S7†). Further work could be done with a Raman spectrometer configured to measure below 100 cm−1 using the same analysis technique to identify and characterise the low wavenumber vibrations.
While the orientation of the ribbons is difficult to unequivocally deduce from the Raman spectra, it is clear that the device relevant (001) plane shows little to no Raman scattering intensity around 155 cm−1. Minimisation of this peak may provide a fast approach to testing the alignment of the ribbons in thin films and crystals. In the crossed polariser geometry, altering growth parameters to maximise the 205 cm−1 peak intensity (see Fig. S7†) can also ensure growth in the [001] direction. Raman spectroscopy already provides a fast, non-destructive approach to mate†rial characterisation and this could be further exploited.
Conclusions
van der Waals crystals such as Sb2Se3 may easily cleave, revealing cleavage steps. These may be used in optical orientation of crystals for cutting without the need for X-ray methods. Angle-resolved polarised Raman spectroscopy of individual crystal planes was used to identify the Raman modes of Sb2Se3 and assign vibrational symmetries to each peak in the spectrum. A total of ten Ag, five B1g, ten B2g and five B2g modes are expected from group theory and DFT calculations. Experimentally, seven Ag, two B1g, three B2g and two B3g modes were identified. Results are consistent with those of Vidal-Fuentes,15 but additional peaks were identified and concrete symmetry assignments made through the use of oriented crystals in this work. DFT calculations supported and verified the phonon mode energies as well as predicting some low intensity and lower wavenumber modes. Some low energy modes were not observable experimentally, but are expected to be measured in further studies. A methodology was reported to quickly identify the technologically important (001) orientation using the 155 cm−1 Raman peak. This study both strengthens the fundamental understanding of Sb2Se3 as a material and paves the way for rapid determination of film orientation and grain to grain variation of growth.Conflicts of interest
There are no conflicts to declare.Acknowledgements
Many thanks to Laurence Hardwick for use of the Raman spectrometer. This work was supported by the Engineering and Physical Sciences Research Council (EPSRC) grant number EP/N509693/1 (N. Fleck and T. D. C. Hobson) and funding from the University of Liverpool (N. Fleck). The authors acknowledge the use of the UCL Legion, Grace and Myriad High Performance Computing Facilities (Legion@UCL, Grace@UCL and Myriad@UCL) and associated support services in the completion of this work. We are also grateful to the ARCHER UK National Supercomputing Service, provided via our membership of the UK's HEC Materials Chemistry Consortium, funded by EPSRC (EP/L000202, EP/R029431), and the UK Materials and Molecular Modelling Hub for computational resources, MMM Hub, which is partially funded by EPSRC (EP/P020194/1). The XRD facility used was supported by the EPSRC (EP/P001513/1). M. R. Correia thanks the funding provided from the i3N, UIDB/50025/2020 and UIDP/50025/2020 projects, financed by national funds through the FCT/MEC. The underlying data in this paper is available from https://doi.org/10.17638/datacat.liverpool.ac.uk/1062.Notes and references
- M. Birkett, W. M. Linhart, J. Stoner, L. J. Phillips, K. Durose, J. Alaria, J. D. Major, R. Kudrawiec and T. D. Veal, APL Mater., 2018, 6, 084901 CrossRef.
- K. Zeng, D. J. Xue and J. Tang, Semicond. Sci. Technol., 2016, 31, 063001 CrossRef.
- Z. Li, X. Liang, G. Li, H. Liu, H. Zhang, J. Guo, J. Chen, K. Shen, X. San, W. Yu, R. E. I. Schropp and Y. Mai, Nat. Commun., 2019, 10, 125 CrossRef PubMed.
- X. Liu, J. Chen, M. Luo, M. Leng, Z. Xia, Y. Zhou, S. Qin, D. J. Xue, L. Lv, H. Huang, D. Niu and J. Tang, ACS Appl. Mater. Interfaces, 2014, 6, 10687–10695 CrossRef CAS PubMed.
- W. Yang, J. H. Kim, O. S. Hutter, L. J. Phillips, J. Tan, J. Park, H. Lee, J. D. Major, J. S. Lee and J. Moon, Nat. Commun., 2020, 11, 861 CrossRef CAS PubMed.
- P. P. Kong, F. Sun, L. Y. Xing, J. Zhu, S. J. Zhang, W. M. Li, Q. Q. Liu, X. C. Wang, S. M. Feng, X. H. Yu, J. L. Zhu, R. C. Yu, W. G. Yang, G. Y. Shen, Y. S. Zhao, R. Ahuja, H. K. Mao and C. Jin, Sci. Rep., 2014, 4, 6679 CrossRef CAS.
- T. Ko, M. Shellaiah and K. W. Sun, Sci. Rep., 2016, 6, 35086 CrossRef CAS PubMed.
- T. D. C. Hobson, O. S. Hutter, M. Birkett, T. D. Veal and K. Durose, IEEE 7th World Conference on Photovoltaic Energy Conversion (WCPEC) (A Joint Conference of 45th IEEE PVSC, 28th PVSEC & 34th EU PVSEC), Waikoloa Village, HI, 2018, pp. 0818–0822 Search PubMed.
- R. Vadapoo, S. Krishnan, H. Yilmaz and C. Marin, Nanotechnology, 2011, 22, 175705 CrossRef PubMed.
- K. Momma and F. Izumi, J. Appl. Crystallogr., 2011, 44, 1272–1276 CrossRef CAS.
- A. Shongalova, M. Correia, B. Vermang, J. Cunha, P. Salomé and P. Fernandes, MRS Commun., 2018, 8, 865–870 CrossRef CAS.
- A. L. J. Pereira, L. Gracia, D. Santamaría-Pérez, R. Vilaplana, F. J. Manjón, D. Errandonea, M. Nalin and A. Beltrán, Phys. Rev. B: Condens. Matter Mater. Phys., 2012, 85, 174108 CrossRef.
- G. Mestl, P. Ruiz, B. Delmon and H. Knozinger, J. Phys. Chem., 1994, 98, 11276–11282 CrossRef CAS.
- K. Nagata, K. Ishibashi and Y. Miyamoto, Jpn. J. Appl. Phys., 1981, 20, 463–469 CrossRef CAS.
- P. Vidal-Fuentes, M. Guc, X. Alcobe, T. Jawhari, M. Placidi, A. Pérez-Rodríguez, E. Saucedo and V. I. Roca, 2D Materials, 2019, 6, 045054 CrossRef CAS.
- H. Chen, Z. Ma, Y. Shao, Z. ur Rehman, K. Zhang, Q. He and L. Song, AIP Adv., 2017, 7, 095316 CrossRef.
- S. Caramazza, A. Collina, E. Stellino, F. Ripanti, P. Dore and P. Postorino, Eur. Phys. J. B, 2018, 91, 35 CrossRef.
- T. Sakashita, M. Deluca, S. Yamamoto, H. Chazono and G. Pezzotti, J. Appl. Phys., 2007, 101, 123517 CrossRef.
- T. Sander, S. Eisermann, B. K. Meyer and P. J. Klar, Phys. Rev. B: Condens. Matter Mater. Phys., 2012, 85, 165208 CrossRef.
- C. Kranert, C. Sturm, R. Schmidt-Grund and M. Grundmann, Phys. Rev. Lett., 2016, 116, 127401 CrossRef PubMed.
- Y. Zhou, L. Wang, S. Chen, S. Qin, X. Liu, J. Chen, D. J. Xue, M. Luo, Y. Cao, Y. Cheng, E. H. Sargent and J. Tang, Nat. Photonics, 2015, 9, 409–415 CrossRef CAS.
- T. Schmid, N. Schäfer, S. Levcenko, T. Rissom and D. Abou-Ras, Sci. Rep., 2016, 5, 18410 CrossRef PubMed.
- H. Song, T. Li, J. Zhang, Y. Zhou, J. Luo, C. Chen, B. Yang, C. Ge, Y. Wu and J. Tang, Adv. Mater., 2017, 29, 1700441 CrossRef PubMed.
- T. C. Damen, S. P. S. Porto and B. Tell, Phys. Rev., 1966, 142, 570–574 CrossRef CAS.
- G. Kresse and J. Hafner, Phys. Rev. B: Condens. Matter Mater. Phys., 1993, 47, 558–561 CrossRef CAS PubMed.
- G. Kresse and J. Hafner, Phys. Rev. B: Condens. Matter Mater. Phys., 1994, 49, 14251–14269 CrossRef CAS PubMed.
- G. Kresse and J. Furthmüller, Phys. Rev. B: Condens. Matter Mater. Phys., 1996, 54, 11169–11186 CrossRef CAS PubMed.
- G. Kresse and J. Furthmüller, Comput. Mater. Sci., 1996, 6, 15–50 CrossRef CAS.
- J. P. Perdew, K. Burke and M. Ernzerhof, Phys. Rev. Lett., 1996, 77, 3865–3868 CrossRef CAS PubMed.
- J. P. Perdew, A. Ruzsinszky, I. G. Csonka, O. A. Vydrov, G. E. Scuseria, L. A. Constantin, X. Zhou and K. Burke, Phys. Rev. Lett., 2008, 100, 136406 CrossRef PubMed.
- P. Blöchl, Phys. Rev. B: Condens. Matter Mater. Phys., 1994, 50, 17953–17979 CrossRef PubMed.
- A. Togo and I. Tanaka, Scr. Mater., 2015, 108, 1–5 CrossRef CAS.
- A. M. Ganose, A. J. Jackson and D. O. Scanlon, J. Open Source Softw., 2018, 3, 717 CrossRef.
- M. A. Tumelero, R. Faccio and A. A. Pasa, J. Phys. Chem. C, 2016, 120, 1390–1399 CrossRef CAS.
- L. J. Phillips, C. N. Savory, O. S. Hutter, P. J. Yates, H. Shiel, S. Mariotti, L. Bowen, M. Birkett, K. Durose, D. O. Scanlon and J. D. Major, IEEE Journal of Photovoltaics, 2019, 9, 544–551 Search PubMed.
- M. Huang, P. Xu, D. Han, J. Tang and S. Chen, ACS Appl. Mater. Interfaces, 2019, 11, 15564–15572 CrossRef CAS PubMed.
- C. N. Savory and D. O. Scanlon, J. Mater. Chem. A, 2019, 7, 10739–10744 RSC.
- J. M. Skelton, D. Tiana, S. C. Parker, A. Togo, I. Tanaka and A. Walsh, J. Chem. Phys., 2015, 143, 064710 CrossRef PubMed.
- X. Hua, V. I. Hegde and C. Wolverton, Chem. Mater., 2019, 31, 9445–9452 CrossRef CAS.
- V. L. Deringer, R. P. Stoffel, M. Wuttig and R. Dronskowski, Chem. Sci., 2015, 6, 5255–5262 RSC.
- J. Anversa, S. Chakraborty, P. Piquini and R. Ahuja, Appl. Phys. Lett., 2016, 108, 212601 CrossRef.
- T. J. Whittles, T. D. Veal, C. N. Savory, P. J. Yates, P. A. E. Murgatroyd, J. T. Gibbon, M. Birkett, R. J. Potter, J. D. Major, K. Durose, D. O. Scanlon and V. R. Dhanak, ACS Appl. Mater. Interfaces, 2019, 11, 27033–27047 CrossRef CAS PubMed.
- C. J. Bradley and A. P. Cracknell, The mathematical theory of symmetry in solids, Oxford University Press, 1972, p. 768 Search PubMed.
Footnotes |
| † Electronic supplementary information (ESI) available. See DOI: 10.1039/d0ta01783c |
| ‡ These authors contributed equally to this work. |
| This journal is © The Royal Society of Chemistry 2020 |

![[thin space (1/6-em)]](https://www.rsc.org/images/entities/char_2009.gif) cos2
cos2


