
 Open Access Article
 This Open Access Article is licensed under a
 Creative Commons Attribution 3.0 Unported Licence
Computational prediction of the thermoelectric performance of LaZnOPn (Pn = P, As)†
Maud
Einhorn
 *ab,
Benjamin A. D.
Williamson
ab and
David O.
Scanlon
abc
*ab,
Benjamin A. D.
Williamson
ab and
David O.
Scanlon
abc
aDepartment of Chemistry, University College London, 20 Gordon Street, London WC1H 0AJ, UK. E-mail: d.scanlon@ucl.ac.uk
bThomas Young Centre, University College London, Gower Street, London WC1E 6BT, UK
cDiamond Light Source Ltd., Diamond House, Harwell Science and Innovation Campus, Didcot, Oxfordshire OX11 0DE, UK
First published on 23rd March 2020
Abstract
High-efficiency earth-abundant thermoelectric materials present an environmentally friendly route for power generation via waste-heat harvesting. Whilst record thermoelectric efficiencies have been achieved in recent years, the leading materials tend to contain toxic and rare elements, including Pb, Te and Bi, which can be problematic commercially. In this study, the thermoelectric capabilities of two earth-abundant candidate thermoelectric materials LaZnOP and LaZnOAs have been investigated using density functional theory (DFT). The electronic structure and band alignment of both materials have been calculated using hybrid DFT including spin–orbit coupling effects, and indicate that both materials should be p-type dopable with highly mobile charge carriers. We analyse the vibrational properties and calculate the lattice thermal conductivity of LaZnOPn (Pn = P, As) using lattice dynamics and find both materials to exhibit highly anisotropic thermal transport, driven by differences in phonon lifetimes and group velocity. We calculate the electronic transport properties, including predicted ZTs, for LaZnOP and LaZnOAs and conclude that both LaZnOP and LaZnOAs are promising candidate materials for high-temperature thermoelectric applications. Furthermore, we provide insight into the effects of nanostructuring during processing on the thermoelectric potential of both materials.
1 Introduction
Given the rapidly increasing global demand for clean and renewable energy, any effective decarbonisation strategy must involve maximising the energy efficiency of existing technologies. Thermal energy is an unavoidable product of myriad processes, with 52% of energy input globally estimated to be lost as waste heat, significantly increasing global energy consumption.1,2 As such, waste-heat harvesting presents a promising opportunity to generate clean energy, through effective utilisation of some of the massive amount of thermal energy currently wasted to the environment.3,4 The thermoelectric effect describes the ability of a material to directly and reversibly generate electricity when subject to a thermal temperature gradient, with no moving parts or waste products.5 Thermoelectric generators present a promising opportunity to improve the efficiency of an abundance of processes in applications spanning power generation, transportation, domestic goods, wearable devices powered by heat from the human body, as well as solid-state refrigeration technologies via the Peltier effect.6–11The efficacy of a thermoelectric material is measured using the dimensionless thermoelectric figure of merit ZT, given by
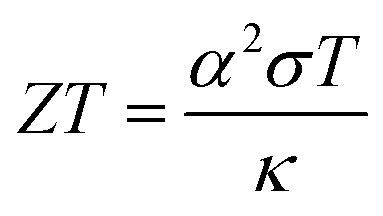 | (1) |
The widespread adoption of thermoelectric generators for industrial and commercial heat harvesting has been somewhat hindered by poor conversion efficiencies (η), expressed as
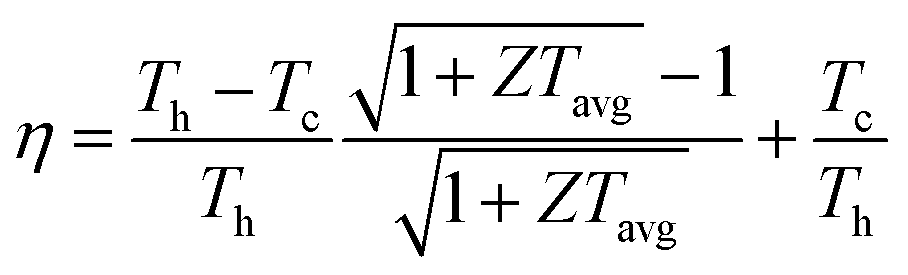 | (2) |
Oxide thermoelectrics are of interest for high-temperature applications in particular, as they tend to possess superior chemical and thermal stability properties across a wide temperature range and under oxidising conditions, as well as being low cost.34–37 The performance of oxides thermoelectrics has historically lagged behind the records set by intermetallic and chalcogenide-based materials, with few oxides possessing the low thermal conductivity and high power factors required for industrial deployment.38,39 A range of layered cobalt oxide materials, including NaxCoO2 and Ca3CO4O9, were found to possess reasonable p-type thermoelectric properties, beginning in the late 1990's.40,41 Fujita et al. reported a ZT > 1 at 800 K for NaxCo2O2−δ single crystals prepared using a flux method.41 Polycrystalline Tb-doped Ca3Co4O9 prepared using a solid-state synthesis method were found to posses a ZT of 0.74 at 800 K.42 While the performance of n-type thermoelectrics generally has not been as promising as the p-type counterparts, the rare earth-doped perovskite-based SrTiO3 materials are considered the archetypal n-type oxide thermoelectrics, with a record ZT of 0.41 at 973 K reported for Sr1−3x/2LaxTiO3−δ.43
In this work, we present a theoretical study of the of the layered mixed-anion quaternary oxypnictides LaZnOP and LaZnOAs, which are of interest as potential earth-abundant thermoelectrics.44–46 Multinary semiconductors, including the I2–II–IV–VI4 and I–II2–III–VI4 families of materials have been increasingly of interest in recent years across fields spanning photovoltaics, photocatalysis, nonlinear optics and thermoelectric energy generation.47–52 The promising performance of quaternary thermoelectric materials has been found to be broadly driven by their low thermal conductivity. Kuo et al. recently reported on four I2–II–IV–VI4 quaternary selenide compounds (BaAg2SnSe4, BaCu2GeSe4, BaCu2SnSe4, SrCu2GeSe4), which were found to possess ultra-low thermal conductivities.53 The I–II2–III–VI4 material CuMn2InTe4 was also found to possess a low intrinsic thermal conductivity and strong doping potential, indicating promise for thermoelectric applications.54 The layered quaternary oxyselenide BiCuOSe, a material which is isostructural with LaZnOPn (Pn = P, As), has been reported to have a p-type ZT > 1 when doped with Pb, originating from a very low intrinsic lattice thermal conductivity (0.4–0.5 W m−1 K−1), which has been attributed to weak intra-layer bonding and resulting strong bond anharmonicity.55,56
Herein, we have calculated the electronic band structure, band alignment and electronic transport properties including the Seebeck coefficient, electrical conductivity, electronic component of thermal conductivity and power factor across a range of temperatures and doping concentrations from first principles using hybrid-density functional theory (DFT) including spin–orbit coupling (SOC) effects. In addition, the lattice dynamics, including the phonon dispersion, Grüneisen parameter and lattice thermal conductivity of LaZnOPn (Pn = P, As) were calculated using DFT within the Generalised Gradient Approximation (GGA). An estimate for ZT is predicted from the calculated lattice thermal conductivity and electronic band structure using Boltzmann transport theory within the constant relaxation time approximation (RTA). Our study indicates that LaZnOP and LaZnOAs have the potential to be promising p-type earth-abundant high-temperature thermoelectrics.
2 Computational methodology
All density functional theory (DFT) calculations were performed within the Vienna Ab initio Simulation Package,57–60 using projector augmented-wave (PAW) pseudopotential method to account for interactions between core and valence electrons.61,62 The kinetic energy cutoff for the plane-wave basis set were checked for convergence, with a 450 eV energy cutoff and 6 × 6 × 3 Γ-centred k-point grid deemed to be sufficient to converge the total energy to within 0.01 eV per atom. A more dense 13 × 13 × 6 Γ-centred k-point grid was used for all density of states (DOS) calculations.The revised Perdew–Burke–Ernzerhof Generalised Gradient Approximation (GGA) functional (PBEsol)63 was used for all lattice dynamics calculations, including for the second- and third-order interatomic force constants used to calculate the phonon dispersion, Grüneisen parameter and lattice thermal conductivity. PBEsol has been shown to accurately reproduce lattice parameters in solid systems, and has demonstrated good performance in lattice dynamics calculations, while maintaining a relatively low computational cost.64–68 The Heyd–Scuseria–Ernzerhof hybrid exchange–correlation density functional (HSE06),69 which contains 25% screened Hartree–Fock exchange at short ranges, was used for all electronic structure, band alignment and electronic transport property calculations. HSE06 has proven success in calculating the structural properties and electronic structure of materials, including oxide semiconductors compared to experiment, eliminating the well-known band-gap underestimation error association with local-density approximation (LDA) and GGA functionals.67,70–73
The structure of LaZnOPn (Pn = P, As) reported by Lincke et al.74,75 was first optimised using the above functionals to a force conversion criterion of 0.01 eV Å−1, with the basis-set expanded by 1.3 times to 585 eV to eliminate Pulay stress.76 The equilibrium structures of the compounds in this study are provided in an online repository: https://doi.org/10.5281/zenodo.3715440.
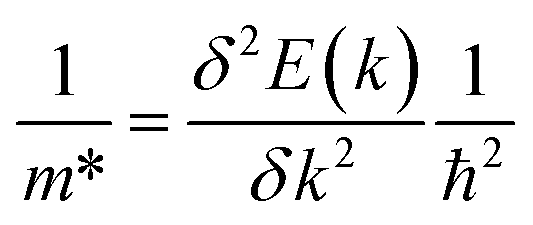
Spin–orbit coupling (SOC) effects were included for the electronic band structure and electronic transport properties, to account for the relativistic effects originating from heavier elements in the materials. Electronic band structures, density of states and phonon dispersions were generated using the open-source Python package: sumo developed by Ganose et al.77 The electron (e−) and hole (h+) effective masses (m*) at a given k were calculated from parabolic fitting of the band edges of the conduction and valence bands with eigenvalue E(k), respectively, according to
 | (3) |
The temperature dependent polaron charge carrier mobility (μ) values were calculated using the PolaronMobility.jl package,78 using the method described by Davies et al.79 The static dielectric constant was calculated using density functional perturbation theory (DFPT) using PBEsol. The high-frequency dielectric constant was obtained from optical properties calculated with the HSE06 functional, using the method of Furthmüller et al.80
Alignment of the core state electron eigenvalues to the vacuum level were done using the core-level alignment approach. A slab-gap model consisting of a non-polar 7 layer thick slab was constructed from the HSE06 bulk optimised unit cell with a (010) surface termination and 30 Å vacuum separation between slabs, and calculated using HSE06 + SOC.81 The planar average of the electrostatic potential was calculated using the MacroDensity package and plotted along the (001) direction, with the value of the electrostatic potential at the plateau taken to be the energy of the vacuum.82–84
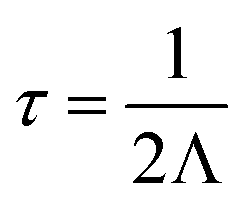
Vibrational properties, including phonon dispersion and lattice thermal conductivities were calculated using the supercell and finite displacement approaches, as implemented in Phonopy85 and Phono3py86 software packages. The structures of LaZnOPn (Pn = P, As) were relaxed initially using PBEsol, to a force convergence criterion of 0.0001 eV Å−1. The harmonic force constants were calculated from displaced 5 × 5 × 4 supercells (800 atoms) using a 0.01 Å displacement amplitude and with proportional reduction in Brillouin-zone sampling. The Grüneisen parameter was calculated from displaced supercells at the optimised cell volume, and ±1% volume expansions from this volume. Phonon DOS were calculated using Phonopy on a 36 × 36 × 17 Γ-centred q-mesh. The displaced structures for the third-order interatomic force constants (5168 displaced structures) were generated using Phono3py with a reduced supercell size of 4 × 4 × 2 (256 atoms) using a 0.03 Å displacement amplitude to reduce computational cost. Lattice thermal conductivity values were calculated by solving the linear Boltzmann Transport Equation (BTE) within the single-mode relaxation time approximation (RTA), as implemented in Phono3py, and were deemed to be converged with a 36 × 36 × 17 Γ-centred q-point mesh, including the non-analytical term correction and isotopic effects.86 The lifetimes (τ) of a phonon at a frequency ω and q-point (q = 2πk) were calculated from the imaginary component of self-energy (Λ), where
 | (4) |
The group velocities (vg) and phonon mean free paths (Λ) can be calculated from the phonon lifetimes, such that
 | (5) |
The electronic transport properties of LaZnOPn (Pn = P, As), including the Seebeck coefficient, electrical conductivity and electronic contribution to lattice conductivity were calculated using the BoltzTraP code.87 The wavefunction of the HSE06 optimised structure was recalculated using a much denser k-mesh (22 × 22 × 10 Γ-centred) with SOC included, and the electronic transport properties were calculated by solving the linear Boltzmann Transport Equation (BTA) under the constant RTA and using the rigid band approach. The temperature-dependent electronic contribution to the thermal conductivity (κelec) is calculated using the Wiedemann–Franz law:
| κelec = LσT | (6) |
All crystal structures diagrams were produced using the VESTA software package.88
3 Results and discussion
3.1 Structure and geometry
Both LaZnOP and LaZnOAs crystallise in the tetragonal P4/nmm space group, and are isostructural with the promising thermoelectric material BiCuOSe. [La3+O2−]+ and [Zn2+Pn3−]− layers are stacked alternately along the (010) direction, and with La–P coordination between layers (Fig. 1).46 The [Zn2+Pn3−]+ layer consists of ZnP4 edge- and corner-sharing tetrahedra, while the [La3+O2−]+ layer contains La3+ coordinated to four equivalent O2−. Table 1 shows a comparison of the experimental and calculated lattice parameters of the PBEsol and HSE06 relaxed structures, and corresponding bond distances.44,46 The optimised lattice parameters are in excellent agreement with experiment for both functionals, with a ∼1% difference for all values except for those calculated for LaZnOP using PBEsol, which shows an underestimation in the c (010) direction of ∼3%. PBEsol is known to slightly underestimate the lattice parameters in many systems, which is consistent with the results seen here.89 | ||
| Fig. 1 (a) Unit cell of LaZnOPn (Pn = P, As), and the crystal structure viewed along the (b) (001) and (c) (010) directions, with the unit cell boundary marked by dashed lines. The La, Zn, O and Pn atoms are shown in orange, blue, red and grey, respectively. | ||
| a, b (Å) | c (Å) | Vol. (Å3) | d La–O (Å) | d Zn–Pn (Å) | d La–Pn (Å) | ||
|---|---|---|---|---|---|---|---|
| LaZnOP | PBEsol | 3.99 | 8.77 | 139.62 | 2.35 | 2.47 | 3.29 |
| HSE06 | 4.03 | 8.94 | 145.19 | 2.36 | 2.49 | 3.36 | |
| Exp.46 | 4.04 | 8.91 | 145.39 | 2.37 | 2.50 | 3.35 | |
| Exp.44 | 4.04 | 8.89 | 145.10 | ||||
| LaZnOAs | PBEsol | 4.05 | 8.93 | 146.47 | 2.36 | 2.55 | 3.33 |
| HSE06 | 4.09 | 9.11 | 152.39 | 2.37 | 2.57 | 3.41 | |
| Exp.46 | 4.10 | 9.07 | 152.06 | 2.38 | 2.57 | 3.39 | |
3.2 Electronic structure
The electronic structure of LaZnOP and LaZnOAs were calculated using HSE06 + SOC from the HSE06 bulk optimised structure. The electronic band structures of LaZnOPn (Pn = P, As) are shown in Fig. 2. The calculated and experimental band gaps and electron and hole effective masses, and corresponding temperature dependent polaron mobilities are summarised in Table 2. Both LaZnOP and LaZnOAs have direct band gaps located at the Γ point, which were found to be 1.435 eV and 1.242 eV, respectively. The slightly smaller band gap of LaZnOAs can be attributed to the decreased electronegativity of As compared to P in LaZnOP, which results in reduced localisation of electrons in the system. | ||
| Fig. 2 The electronic band structure of (a) LaZnOP and (c) LaZnOAs calculated using HSE06 + SOC, plotted along a high symmetry path in the Brillouin zone according to the Bradley and Cracknell notation.94 The conduction and valence bands are coloured by orange and blue. The electronic density of states of (b) LaZnOP and (d) LaZnOAs, calculated using HSE06 + SOC. The VBM has been set to 0 eV in all cases. | ||
| LaZnOP | LaZnOAs | |
|---|---|---|
| E g (eV) | 1.435 | 1.242 |
| Exp. Eg (eV)44,45,74,75 | 1.4, 1.7, 2.6 | 1.5, 2.3 |
| m*(Γ–X) | 0.195/0.462 | 0.180/0.298 |
| m*(Γ–M) | 0.186/0.299 | 0.168/0.246 |
| m*(Γ–Z) | 0.935/1.857 | 0.966/1.713 |
| μ (cm2 V−1 s−1) (Γ–X) | 113.76/26.85 | 316.57/143.93 |
| μ (cm2 V−1 s−1) (Γ–M) | 122.88/56.16 | 352.41/194.45 |
| μ (cm2 V−1 s−1) (Γ–Z) | 7.65/2.01 | 21.87/8.42 |
The calculated band gap of LaZnOP is in excellent agreement with experimental results reported by Kayanuma et al. showing a 1.4 eV optical band gap for LaZnOP single crystals, obtained from diffuse reflectance spectra data.44 A band gap of 0.75 eV was calculated from DFT using the GGA functional PBE96 in the same study, indicating issues with the use of GGA functionals for an accurate description of the electronic structure of LaZnOP. Our results are underestimations compared to larger experimental optical band gaps of ∼1.7 eV and ∼1.5 eV taken from diffuse reflectance spectra reported by the same group for powdered samples of LaZnOP and LaZnOAs, respectively.45 Larger band gaps of 2.6 and 2.3 eV, respectively, were reported for LaZnOP and LaZnOAs single crystals from electronic absorption spectra measured using a microcrystal spectrophotometer.74,75 Another theoretical study reports direct band gaps of 0.62 eV and 0.53 eV, respectively, for LaZnOP and LaZnOAs, again calculated using a GGA functional.90 The vast range in experimental and theoretical band gap values reported for these systems illustrates the importance of a study using hybrid DFT, which has proven success in reproducing the band gap of semiconducting materials compared to experiment.71,72
One of the complications in terms of maximising the ZT of a material is the contradiction between the electronic properties required for a high Seebeck coefficient and high electrical conductivity. Previous studies have shown that a large density of states and accompanying minimal dispersion at band edges is favourable for maximising the Seebeck coefficient.15,26 Conversely, highly dispersive bands with light electrons and holes are required for good electrical conduction. Degeneracy and anisotropy have been successfully exploited in band structure engineering techniques, with heavy bands providing sufficient density of states for a large Seebeck coefficient and the light bands reducing electrical resistivity.91–93
Electron and hole effective masses, calculated from parabolic fitting of the valence and conduction band edges results in small electron and hole effective masses along the Γ–X and Γ–M directions in both compounds, with larger effective masses present in the Γ–Z direction (Table 2). In both LaZnOP and LaZnOAs, the electron effective masses are smaller than hole effective masses in all directions. Between the two compounds, all electron and hole effective masses are lower in LaZnOAs, with the exception of the electron effective mass in the Γ–Z direction. The charge carrier effective masses, which are inversely proportional to carrier mobilities indicate that electrons and holes will be mobile in directions within the layers and less mobile moving perpendicular to the layers. The calculated electron and hole mobility values are listed in Table 2. All electron and hole mobilities are higher in LaZnOAs than in LaZnOP, which is reflective of the higher frequency optical dielectric constant (ωoptic) of LaZnOAs. Significantly higher charge carrier mobilities are seen in the Γ–X and Γ–M directions in both materials compared to the Γ–Z direction, in agreement with the trend observed in the calculated effective masses. The highly anisotropic mobilities are a result of more effective orbital overlap within the [La3+O2−]+ and [Zn2+Pn3−]− layers, which is reduced in the through-layer direction due to the weaker intra-layer interactions.
Fig. 2 shows the total and partial density of states (DOS), calculated with HSE06 + SOC. There are clear similarities between the compositional make-up of the valence and conduction bands in the two compounds. In both systems, the top of the valence band is predominantly composed of pnictide p states, with O p, Zn p, La d and s orbitals also contributing to the valence band. The bottom of the conduction band is predominantly composed of Zn s states (Fig. S1†), with La d and f, Zn d and Pn (Pn = P, As) p orbital contributions deeper into the conduction band.
3.3 Band alignment
The band alignment of LaZnOP and LaZnOAs (Fig. 3) calculated relative to the O 1s core level within the bulk using HSE06 + SOC reveals that both materials have high-lying conduction band minima and valence band maxima, relative to the vacuum level. These features are characteristic of native p-type semiconducting materials, such as Cu2O and the isostructural LaCuOSe, which is a degenerate p-type semiconductor when doped with Mg.71,95–97 High-lying valence band maxima, and the resulting low ionisation potentials drives the formation of holes in semiconducting materials, while lower electron affinities limit n-type dopability due to charge compensation from the higher concentration p-type defects. From these results we propose that LaZnOP and LaZnOAs show promise as p-type thermoelectric materials, although careful assessment of the defect chemistry must be performed to identify a suitable dopant. | ||
| Fig. 3 Band alignment for of LaZnOP and LaZnOAs, with energies calculate relative to the P 1s state. The conduction and valence bands are coloured in orange and blue, respectively. | ||
An experimental band alignment for LaZnOP from UPS data found the conduction band minimum to be located at ∼3 eV below the vacuum, compared to our calculated value of 2.5 eV.44 In the same study, bipolarity was indicated for undoped and Zn-doped LaZnOP samples, with the undoped samples indicating n-type behaviour from small negative Seebeck coefficient values (−2.7 μV K−1), and Cu-doped samples showing p-type behaviour and positive Seebeck coefficients. However the samples did not exhibit the behaviour expected of band semiconductors, notably the Seebeck coefficients of the undoped samples did not vary with carrier concentration.
Moving from P2− to As2−, the level of the conduction band minimum is largely unchanged, with the valence band maximum shifting up by 0.25 eV. As we can see from the density of states, the top of the valence band is predominantly composed of Pn p states, and the shift in ionisation potential can be rationalised by considering the reduced electronegativity of the pnictide anion moving down the group, meaning it is easier to remove an electron from the valence band. On the other hand, the conduction band minimum in both cases contains mainly Zn s states, which is largely unaffected by the choice of pnictide.
3.4 Vibrational properties
Fig. 4 shows the phonon dispersion curves of LaZnOPn (Pn = P, As) plotted along the high symmetry path in the Brillouin zone, alongside the phonon partial density of states (PDOS), calculated using the finite displacement method with a 5 × 5 × 2 supercell with the PBEsol functional. In both LaZnOP and LaZnOAs, the calculated phonon spectra contain 24 dispersion relations with no imaginary phonon frequencies present, indicating both structures are dynamically stable. As in the electronic band structure, there is notable anisotropy in the phononic properties, with significantly lower dispersion along the Γ–Z (through-layer) direction compared to Γ–X (in-layer) in both systems. As group velocity is calculated from the derivative of the phonon dispersion, flat phonon bands are indicative of small phonon group velocities, and are thus favourable for low lattice thermal conductivity.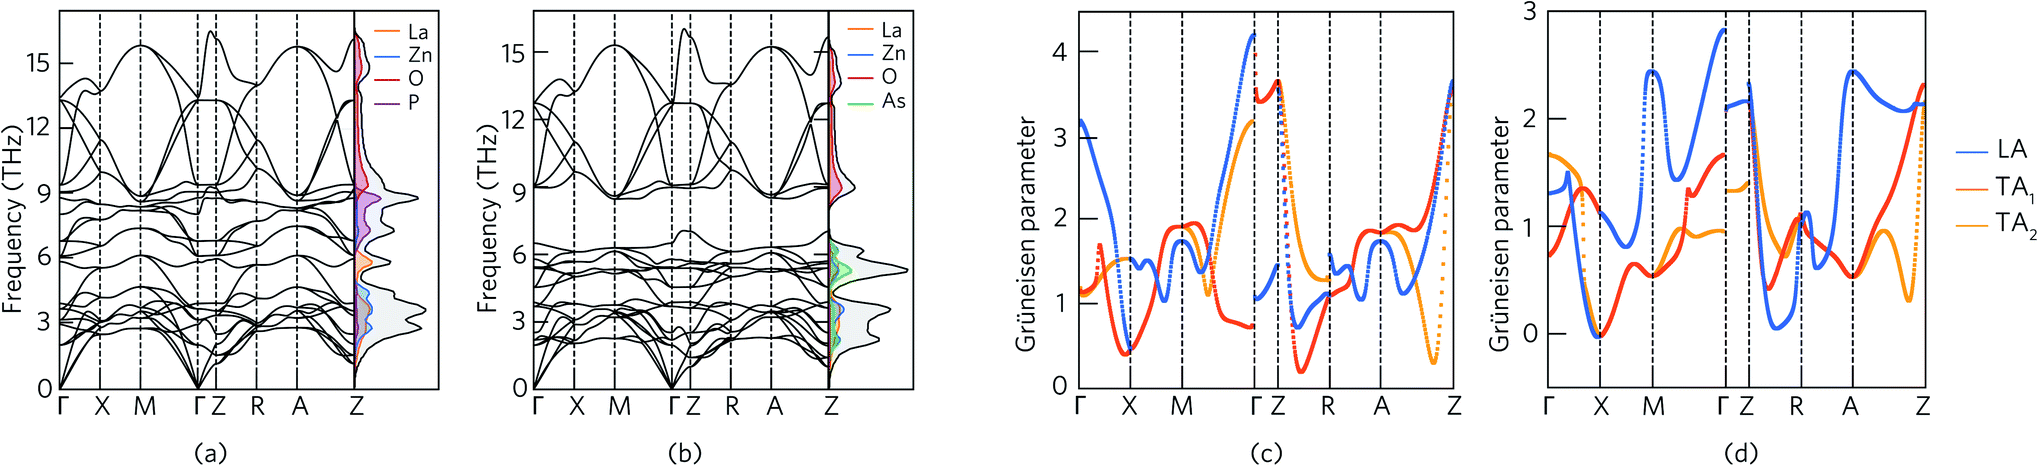 | ||
| Fig. 4 Phonon dispersion and phonon density of states of (a) LaZnOP and (b) LaZnOAs calculated using the PBEsol functional, plotted along a high symmetry pathway. Mode Grüneisen parameters of (c) LaZnOP and (d) LaZnOAs calculated using the PBEsol functional, plotted along a high symmetry pathway. In the plot, the longitudinal acoustic mode is highlighted in blue, and the two transverse acoustic phonon modes are highlighted in orange and yellow. | ||
The phonon partial density of states (PDOS) shows that in both systems the acoustic branches are dominated by the heavier cation species, La3+ and Zn2+. Changing the Pn species from P to the heavier As results in a flattening of the low-frequency phonon modes, and corresponding reduced group velocity. In both compounds, the highest energy optical branches (above 9 THz) originate from phonon modes involving mainly O states which are highly dispersive. The large mass contrast present in LaZnOAs, between the heavier ions and the lighter O2− results in a phonon band gap between 6.2–9 THz. Phonon band gaps have been shown to reduce the thermal conductivity in materials such as in Zintl compounds, via reduction of the group velocity of modes near the band edges.98
The mode Grüneisen parameter γp provides an estimation of the degree of anharmonicity of a vibrational phonon mode in a system by considering the change in properties of a particular phonon mode with respect to thermal expansion. Anharmonic phonon scattering, which can be driven by weak chemical bonding in a lattice, is responsible for the Umklapp scattering processes which cause a finite lattice thermal conductivity in the absence of external scattering mechanisms such as grain boundaries and point defects. In systems in which the phonon scattering is dominated by Umklapp scattering processes, a large Grüneisen parameter is indicative of a low lattice thermal conductivity, related to the significant anharmonic phonon scattering processes.99–101 Indeed, the Grüneisen parameter has been used to rationalise the ultra-low lattice thermal conductivity resulting from strongly anharmonic bonding in materials such as SnSe, PbSe and BiCuOSe.27,102,103
Fig. 4 shows the Grüneisen parameters of the acoustic modes in LaZnOP and LaZnOAs plotted along the high symmetry paths in the Brillouin zone. The Grüneisen parameters are positive for all acoustic modes in both LaZnOP and LaZnOAs, apart from at the X point in LaZnOAs. The average acoustic mode Grüneisen parameters in LaZnOP and LaZnOAs are 1.67 and 1.14, respectively, with maximum Grüneisen parameters of 3.67 and 2.83 occuring at the Z point in both systems. The increased anharmonicity in modes corresponding to motion in the (010) direction can be attributed to weaker intra-layer interactions, indicating the layered structure helps to facilitate changes in pressure by easily compressing or expanding in the (010) direction. The relatively large Grüneisen parameters in the acoustic phonon modes in LaZnOP and LaZnOAs are indicative that the phonon scattering in these modes are dominated by Umklapp processes, and thus should contribute significantly to a reduction in thermal transport. The average Grüneisen parameter of BiCuOSe, a material which has ultra-low lattice thermal conductivity stemming from strong anharmonic phonon scattering, has been calculated to be 2.4–2.6 from first principles.103 PbSe and PbTe, both excellent thermoelectric materials with strong bond anharmonicity, have been reported to have average Grüneisen parameters of 1.65 and 1.45, respectively.27
Fig. 5(a) shows the temperature dependent lattice thermal conductivity (κlatt) for LaZnOP and LaZnOAs calculated within the single-mode RTA, along the in-layer (a, b) and through-layer (c) directions. In both compounds, the lattice thermal conductivity decreases with temperature between 0 K and 1000 K in both the in-layer and through-layer directions, following a near 1/T relationship. There is significant directional anisotropy in the thermal transport properties of LaZnOP and LaZnOAs, resulting in an average κc/κa,b ratio of 4.826 and 3.756 respectively at 300 K. The lattice thermal conductivity of LaZnOAs is smaller than LaZnOP in both directions across the entire temperature range, with an average reduction in the in-layer and through-layer lattice thermal conductivity of 31.53% and 11.14%, respectively.
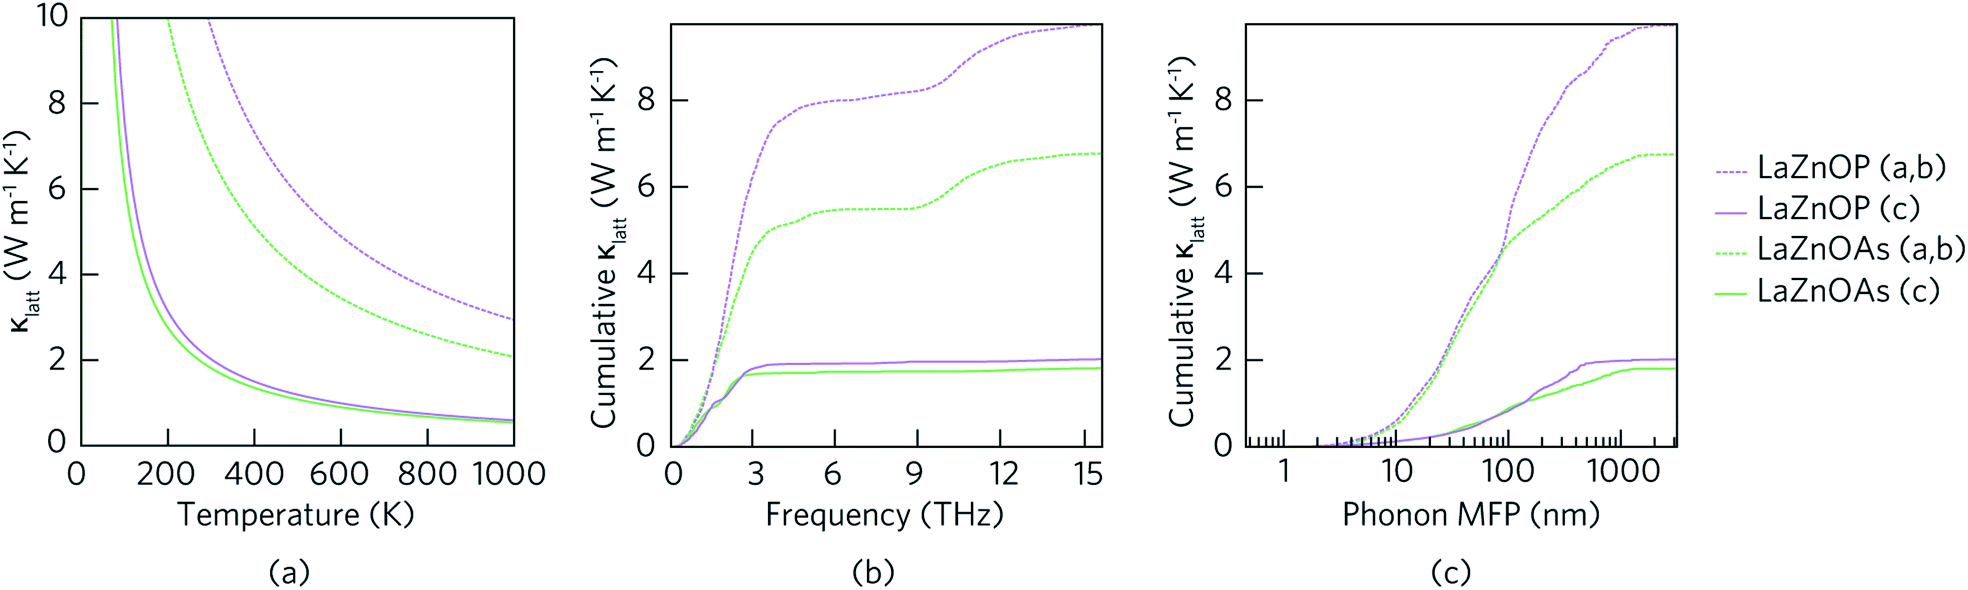 | ||
| Fig. 5 (a) Temperature-dependent lattice component of thermal conductivity and cumulative lattice thermal conductivity as a function of (b) frequency and (c) phonon mean free path of LaZnOP (purple) and LaZnOAs (green). Dashed and solid lines denote the in-layer (001) and through-layer (010) axial directions, respectively. | ||
Table 3 outlines the contribution of the acoustic and optical phonon modes to the total lattice thermal conductivity in LaZnOP and LaZnOAs at 300 K. It is found that the contribution of optical phonon modes to the total lattice thermal conductivity is greater in the through-layer direction than in the in-layer direction in both materials, by 16.5–17.5% respectively. Consideration of the lattice thermal conductivities with the lifetime of the phonon modes (Fig. 6) shows the acoustic phonon relaxation times are longer than the optical phonons in both systems, in some cases by an order of magnitude or greater.
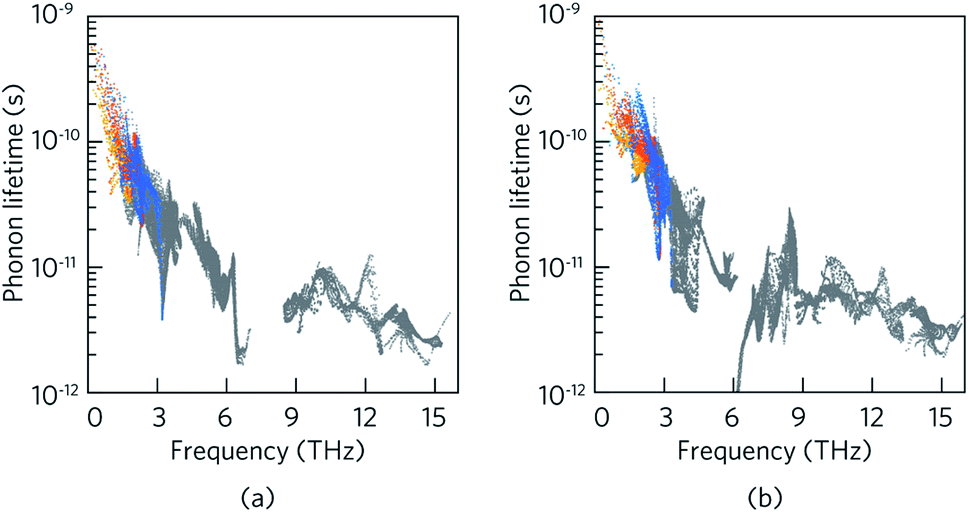 | ||
| Fig. 6 Frequency dependent phonon lifetimes of LaZnOP and LaZnOAs with the longitudinal acoustic and two transverse acoustic phonon mode lifetimes highlighted in blue, orange and yellow, respectively, and the optical phonon relaxation times in grey. | ||
| Mode | LaZnOP | LaZnOAs | ||
|---|---|---|---|---|
| a, b | c | a, b | c | |
| TA1 | 15.63% | 21.88% | 12.03% | 16.55% |
| TA2 | 19.42% | 25.83% | 17.83% | 25.84% |
| LA | 19.81% | 23.65% | 20.03% | 25.07% |
| O | 45.14% | 28.64% | 50.10% | 32.54% |
Between the two materials, the lifetime of the low-frequency acoustic and optical phonon modes are shorter in LaZnOAs than in LaZnOP, which indicates increased three-phonon scattering driven by the low-frequency As phonon modes in LaZnOAs. The low-frequency optical phonons, which are found to have a significant contribution to the in-layer lattice thermal conductivity in LaZnOAs, were also found to have lower average group velocities, as shown in Fig. S4.† In LaZnOP, the phonon modes in the frequency range dominated by P vibrational modes were found to have relatively long phonon lifetimes and large group velocities in the in-layer direction. We therefore attribute the reduced thermal transport in the in-layer direction in LaZnOAs to a combination of the greater contribution of optical phonons to the in-layer lattice thermal conductivity, which have shorter phonon lifetimes and group velocities.
Fig. 5(b) shows the cumulative contribution to lattice thermal conductivity against phonon mean free path (MFP) at 300 K. In both LaZnOP and LaZnOAs, the maximum phonon mean free path is longer in the in-layer direction than the through-layer direction, with 50% of in-layer vibrational phonon modes possessing mean free paths of less than 95.05 nm and 51.08 nm, respectively. On the other hand, 50% of the through-layer directional phonons have mean free paths of less than 136.93 nm and 106.93 nm, respectively. This indicates nanostructuring to sub 100 nm dimensions could effectively reduce the lattice thermal conductivity of both LaZnOP and LaZnOAs significantly, including by greater than 50% in the higher lattice thermal conductivity direction in both materials, and should therefore be considered during processing.
3.5 Thermoelectric properties
The dimensionless figure of merit ZT describes the efficiency of a thermoelectric material, with a good thermoelectric material exhibiting a ZT > 1. The predicted p-type ZT values of LaZnOP and LaZnOAs calculated using BoltzTraP as a function of temperature and carrier concentration are shown in Fig. 7, calculated using the BoltzTraP code.87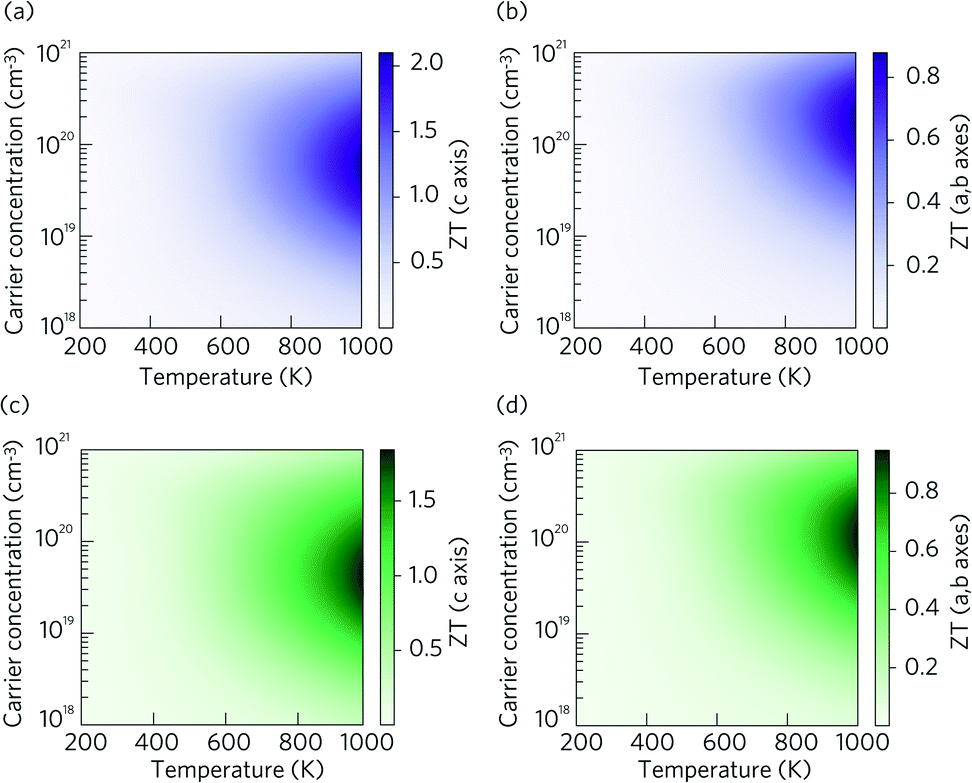 | ||
| Fig. 7 Heatmaps showing the calculated p-type thermoelectric figure of merit ZT as a function of temperature and charge carrier concentration for LaZnOP (purple) and LaZnOAs (green), in the (a and c) through-layer and (b and d) in-layer directions. | ||
The maximum ZT values for LaZnOP and LaZnOAs in the through-layer direction were found to be 2.10 and 1.92 at 1000 K, respectively, corresponding to optimal charge carrier concentrations of 1.52 × 1019 cm−3 and 4.24 × 1019 cm−3. The maximum ZTs in the in-layer directions were 0.88 (1.87 × 1020 cm−3) and 0.95 (1.18 × 1020 cm−3) at 1000 K. The directional anisotropy in the thermoelectric performance is due to the much higher lattice thermal conductivity in the in-layer direction in both materials, stemming from higher phonon group velocities and lower anharmonicity in the vibrational modes. The high ZT values predicted indicates that LaZnOP and LaZnOAs are very promising p-type high-temperature thermoelectric materials, assuming they are dopable to the optimal carrier concentrations needed. Single-crystal Ca3Co4O9, a known p-type oxide thermoelectric, has been reported to have a ZT of 0.87 at 973 K.104 A maximum ZT of 1.4 at 923 K was reported for modulation-doped BiCuOSe, which is isostructural with LaZnOP and LaZnOAs.105 In addition, the long mean free paths of the heat-carrying phonons in LaZnOP and LaZnOAs indicate that the ZT values calculated here have the potential to be improved through nanostructuring techniques, although this may have an opposing detrimental affect on charge carrier mobilities.
Comparing the ZT results in the c direction (Fig. 7(a) and (c)), the maximum ZT decreases as we move from P to As in LaZnOPn, despite the lattice thermal conductivity of the two materials being very similar at this temperature (0.58 and 0.55, respectively). The disparity in the ZT values must therefore come from the electronic transport properties of the two materials. Fig. S2 and S3† show the temperature dependence of p-type electrical conductivity, Seebeck coefficient, electronic lattice thermal conductivity and power factor for LaZnOP and LaZnOAs, for a range of charge carrier concentrations from 1018–1021 cm−3. In both systems, increasing the carrier concentration results in a steady increase in the electronic lattice thermal conductivity and electronic conductivity values, and accompanying decrease in the Seebeck coefficient. The total thermal conductivity in a material is determined from a sum of the lattice and electronic components to thermal conductivity. The predicted electronic lattice thermal conductivity values are very similar between LaZnOP and LaZnOAs, with an increase in electronic lattice thermal conductivity observed with increasing temperature. At high levels of doping, such as those that are required to achieve the maximum predicted ZTs, the through-layer lattice and electronic thermal conductivities are similar in magnitude, while the through-layer thermal conductivity is dominated by the lattice component. This further indicates that experimental investigation of the processing conditions of both LaZnOP and LaZnOAs must be considered, as phonon analysis indicates that nanostructuring could be a promising route to improving the ZT of both materials by reducing the in-layer lattice thermal conductivity. Electrical conductivity (σ) follows the same increasing trend as electronic thermal conductivity with carrier concentration, but slightly decreases with temperature. The Seebeck coefficient is found to be larger in LaZnOP than in LaZnOAs, which can be attributed to the directly proportional relationship between the Seebeck coefficient (S) and the charge carrier effective mass at the valence band maximum (Table 2).
Importantly, to realise the maximum predicted ZT values detailed doping studies are necessary to understand the defect chemistry of LaZnOP and LaZnOAs. However, according to the doping limit rules, which suggest that the position of the band edges of a material control their dopability, the band alignment of LaZnOP and LaZnOAs clearly support a p-type dopable material.106–111 It is known that a p-type material will have a high-lying valence band maximum and corresponding low ionisation potential, which favours hole formation. Conversely, n-type materials tend to possess high electron affinities and lower-lying conduction band maxima.97,112 In the case of these systems, the ionisation potentials and electron affinities for both materials are relatively small, indicating p-type dopability, providing there are no compensating low formation energy donor defects present. A study of the defect properties will indicate the doping potential of LaZnOP and LaZnOAs, and also provide guidance on optimised experimental growth conditions.
4 Conclusion
We have investigated the structural, electronic, lattice dynamical and thermoelectric properties of the layered oxypnictide materials LaZnOP and LaZnOAs from first principles. Electronic structure and band gap calculations using hybrid density functional theory (DFT) indicate that both materials have direct band gaps of 1.435 eV and 1.242 eV, respectively, and band alignments that show a strong propensity for p-type dopability. Such behaviour must be assessed by detailed investigation of the defect chemistry of both materials. We have evaluated that both materials are promising earth-abundant thermoelectric candidates, with predicted maximum p-type ZTc and ZTa,b values of 2.10 and 0.88 for LaZnOP, and 1.92 and 0.95 for LaZnOAs, respectively. The vibrational properties of both materials indicate that they contain strongly anharmonic bonding and have a low intrinsic lattice thermal conductivity, which are also strongly anisotropic. The presence of low-frequency vibrational modes attributed to As in LaZnOAs appears to increase the three phonon scattering processes and reduce phonon dispersion, thus reducing phonon lifetimes and group velocities, ultimately resulting in a lower lattice thermal conductivity, when compared to LaZnOP. In addition, we propose that these materials are excellent candidates for nanostructure engineering, which we propose will likely result in a reduction in the lattice thermal conductivity, from analysis of the mean free paths of the heat carrying phonons.Conflicts of interest
There are no conflicts to declare.Acknowledgements
We are grateful to the UK Materials and Molecular Modelling Hub for computational resources, which is partially funded by EPSRC (EP/P020194/1) and to UCL for the provision of the Legion, Myriad and Grace supercomputers. Via our membership of the UK's HEC Materials Chemistry Consortium, which is funded by EPSRC (EP/L000202, EP/R029431), this work used the ARCHER UK National Supercomputing Service (http://www.archer.ac.uk). DOS and BADW acknowledge support from the European Research Council, ERC (grant no. 758345).References
- A. Firth, B. Zhang and A. Yang, Appl. Energy, 2019, 235, 1314–1334 CrossRef.
- C. Forman, I. K. Muritala, R. Pardemann and B. Meyer, Renewable Sustainable Energy Rev., 2016, 57, 1568–1579 CrossRef.
- M. Hamid Elsheikh, D. A. Shnawah, M. F. M. Sabri, S. B. M. Said, M. Haji Hassan, M. B. Ali Bashir and M. Mohamad, Renewable Sustainable Energy Rev., 2014, 30, 337–355 CrossRef.
- H. Jouhara, N. Khordehgah, S. Almahmoud, B. Delpech, A. Chauhan and S. A. Tassou, Therm. Sci. Eng. Prog., 2018, 6, 268–289 CrossRef.
- G. A. Slack, Solid State Phys., 1979, 34, 1–71 CAS.
- L. E. Bell, Science, 2008, 321, 1457–1461 CrossRef CAS PubMed.
- E. Toberer, Nat. Energy, 2016, 1, 16172 CrossRef.
- L. Shen, X. Pu, Y. Sun and J. Chen, Energy, 2016, 113, 9–24 CrossRef.
- X. Liu, Y. D. Deng, Z. Li and C. Q. Su, Energy Convers. Manage., 2015, 90, 121–127 CrossRef.
- M. Hyland, H. Hunter, J. Liu, E. Veety and D. Vashaee, Appl. Energy, 2016, 182, 518–524 CrossRef.
- C. S. Kim, H. M. Yang, J. Lee, G. S. Lee, H. Choi, Y. J. Kim, S. H. Lim, S. H. Cho and B. J. Cho, ACS Energy Lett., 2018, 3, 501–507 CrossRef CAS.
- G. J. Snyder and E. S. Toberer, Nat. Mater., 2008, 7, 105–114 CrossRef CAS PubMed.
- G. S. Nolas, G. A. Slack, D. T. Morelli, T. M. Tritt and A. C. Ehrlich, J. Appl. Phys., 1996, 79, 4002–4008 CrossRef CAS.
- S. Lee, K. Esfarjani, T. Luo, J. Zhou, Z. Tian and G. Chen, Nat. Commun., 2014, 5, 3525 CrossRef PubMed.
- G. Tan, L. D. Zhao and M. G. Kanatzidis, Chem. Rev., 2016, 116, 12123–12149 CrossRef CAS PubMed.
- G. A. Slack, in CRC Handbook of Thermoelectrics, ed. D. M. Rowe, CRC Press, Boca Raton, 1995, p. 407 Search PubMed.
- G. S. Nolas, D. T. Morelli and T. M. Tritt, Annu. Rev. Mater. Sci., 1999, 29, 89–116 CrossRef CAS.
- Y. Liu, H. Xie, C. Fu, G. J. Snyder, X. Zhao and T. Zhu, J. Mater. Chem. A, 2015, 3, 22716–22722 RSC.
- M. Beekman, D. T. Morelli and G. S. Nolas, Nat. Mater., 2015, 14, 1182–1185 CrossRef CAS PubMed.
- M. Beekman and D. G. Cahill, Cryst. Res. Technol., 2017, 52, 1700114 CrossRef.
- L. You, Y. Liu, X. Li, P. Nan, B. Ge, Y. Jiang, P. Luo, S. Pan, Y. Pei, W. Zhang, G. J. Snyder, J. Yang, J. Zhang and J. Luo, Energy Environ. Sci., 2018, 11, 1848–1858 RSC.
- B. Qin, D. Wang, W. He, Y. Zhang, H. Wu, S. J. Pennycook and L. D. Zhao, J. Am. Chem. Soc., 2019, 141, 1141–1149 CrossRef CAS PubMed.
- V. Vargiamidis and N. Neophytou, Phys. Rev. B, 2019, 99, 45405 CrossRef CAS.
- X. Zhang and L. D. Zhao, J. Materiomics, 2015, 1, 92–105 CrossRef.
- H. J. Goldsmid, Materials, 2014, 7, 2577–2592 CrossRef CAS.
- J. P. Heremans, V. Jovovic, E. S. Toberer, A. Saramat, K. Kurosaki, A. Charoenphakdee, S. Yamanaka and G. J. Snyder, Science, 2008, 321, 554–557 CrossRef CAS PubMed.
- H. Wang, Y. Pei, A. D. Lalonde and G. J. Snyder, Adv. Mater., 2011, 23, 1366–1370 CrossRef CAS PubMed.
- Y. Da, Y. Xuan and Q. Li, Energy, 2016, 95, 200–210 CrossRef.
- Y. Maral, M. Aktas, O. Erol, R. Ongun and F. Polat, J. Eng. Res. Appl. Sci., 2017, 6, 703–710 Search PubMed.
- D. Champier, Energy Convers. Manage., 2017, 140, 167–181 CrossRef.
- R. Amatya and R. J. Ram, J. Electron. Mater., 2012, 41, 1011–1019 CrossRef CAS.
- C. Yang, D. Souchay, M. Kneiß, M. Bogner, H. M. Wei, M. Lorenz, O. Oeckler, G. Benstetter, Y. Q. Fu and M. Grundmann, Nat. Commun., 2017, 8, 16076 CrossRef CAS.
- W. He, D. Wang, J. F. Dong, Y. Qiu, L. Fu, Y. Feng, Y. Hao, G. Wang, J. Wang, C. Liu, J. F. Li, J. He and L. D. Zhao, J. Mater. Chem. A, 2018, 6, 10048–10056 RSC.
- J. He, Y. Liu and R. Funahashi, J. Mater. Res., 2011, 26, 1762–1772 CrossRef CAS.
- Y. Yin, B. Tudu and A. Tiwari, Vacuum, 2017, 146, 356–374 CrossRef CAS.
- S. A. Miller, P. Gorai, U. Aydemir, T. O. Mason, V. Stevanović, E. S. Toberer and G. Jeffrey Snyder, J. Mater. Chem. C, 2017, 5, 8854–8861 RSC.
- Y. Feng, X. Jiang, E. Ghafari, B. Kucukgok, C. Zhang, I. Ferguson and N. Lu, Adv. Compos. Hybrid Mater., 2018, 1, 114–126 CrossRef CAS.
- A. Nag and V. Shubha, J. Electron. Mater., 2014, 43, 962–977 CrossRef CAS.
- K. B. Spooner, A. M. Ganose and D. O. Scanlon, J. Mater. Chem. A, 2020 10.1039/d0ta02247k.
- I. Terasaki, Y. Sasago and K. Uchinokura, Condens. Matter, 1997, 56, 685–687 Search PubMed.
- K. Fujita, T. Mochida and K. Nakamura, Jpn. Soc. Appl. Phys., 2001, 40, 4644–4647 CrossRef CAS.
- S. Saini, H. S. Yaddanapudi, K. Tian, Y. Yin, D. Magginetti and A. Tiwari, Sci. Rep., 2017, 7, 44621 CrossRef CAS PubMed.
- Z. Lu, H. Zhang, W. Lei, D. C. Sinclair and I. M. Reaney, Chem. Mater., 2016, 28, 925–935 CrossRef CAS.
- K. Kayanuma, H. Hiramatsu, M. Hirano, R. Kawamura, H. Yanagi, T. Kamiya and H. Hosono, Phys. Rev. B: Condens. Matter Mater. Phys., 2007, 76, 195325 CrossRef.
- K. Kayanuma, R. Kawamura, H. Hiramatsu, H. Yanagi, M. Hirano, T. Kamiya and H. Hosono, Thin Solid Films, 2008, 516, 5800–5804 CrossRef CAS.
- A. T. Nientiedt and W. Jeitschko, Inorg. Chem., 1998, 37, 386–389 CrossRef CAS PubMed.
- S. P. Ramkumar, Y. Gillet, A. Miglio, M. J. Van Setten, X. Gonze and G. M. Rignanese, Phys. Rev. B, 2016, 94, 224302 CrossRef.
- A. Ghosh, S. Palchoudhury, R. Thangavel, Z. Zhou, N. Naghibolashrafi, K. Ramasamy and A. Gupta, Chem. Commun., 2016, 52, 264–267 RSC.
- V. V. Badikov, D. V. Badikov, L. Wang, G. S. Shevyrdyaeva, V. L. Panyutin, A. A. Fintisova, S. G. Sheina and V. Petrov, Cryst. Growth Des., 2019, 19, 4224–4228 CrossRef CAS.
- I. Sheebha, V. Venugopal, J. James, V. Maheskumar, A. Sakunthala and B. Vidhya, Int. J. Hydrogen Energy, 2020, 45, 8139–8150 CrossRef.
- M. D. Regulacio and M. Y. Han, Acc. Chem. Res., 2016, 49, 511–519 CrossRef CAS PubMed.
- Q. Song, P. Qiu, F. Hao, K. Zhao, T. Zhang, D. Ren, X. Shi and L. Chen, Adv. Electron. Mater., 2016, 2, 1600312 CrossRef.
- J. J. Kuo, U. Aydemir, J. H. Pöhls, F. Zhou, G. Yu, A. Faghaninia, F. Ricci, M. A. White, G. M. Rignanese, G. Hautier, A. Jain and G. J. Snyder, J. Mater. Chem. A, 2019, 7, 2589–2596 RSC.
- D. Hobbis, W. Shi, A. Popescu, K. Wei, R. Baumbach, H. Wang, L. Woods and G. S. Nolas, Dalton Trans., 2020, 49, 2273–2279 RSC.
- G. K. Ren, S. Wang, Z. Zhou, X. Li, J. Yang, W. Zhang, Y. H. Lin, J. Yang and C. W. Nan, Nat. Commun., 2019, 10, 2814 CrossRef PubMed.
- H. Shao, X. Tan, G. Q. Liu, J. Jiang and H. Jiang, Sci. Rep., 2016, 6, 21035 CrossRef CAS PubMed.
- G. Kresse and J. Hafner, Phys. Rev. B: Condens. Matter Mater. Phys., 1993, 47, 558 CrossRef CAS PubMed.
- G. Kresse and J. Hafner, Phys. Rev. B: Condens. Matter Mater. Phys., 1994, 49, 14251 CrossRef CAS PubMed.
- G. Kresse and J. Furthmüller, Comput. Mater. Sci., 1996, 6, 15–50 CrossRef CAS.
- G. Kresse, J. Furthmüller, Y. J. Li, Y. J. Chen, J. C. Walmsley, R. H. Mathinsen, S. Dumoulin, H. J. Roven, S. Yip, T. Supervisor and S.-h. Chen, Phys. Rev. B: Condens. Matter Mater. Phys., 2000, 62, 11169–11186 CrossRef.
- P. E. Blöchl, Phys. Rev. B: Condens. Matter Mater. Phys., 1994, 50, 17953–17979 CrossRef PubMed.
- G. Kresse and D. Joubert, Phys. Rev. B: Condens. Matter Mater. Phys., 1999, 59, 1758–1775 CrossRef CAS.
- J. P. Perdew, A. Ruzsinszky, G. I. Csonka, O. A. Vydrov, G. E. Scuseria, L. A. Constantin, X. Zhou and K. Burke, Phys. Rev. Lett., 2008, 100, 136406 CrossRef PubMed.
- J. M. Skelton, D. Tiana, S. C. Parker, A. Togo, I. Tanaka and A. Walsh, J. Chem. Phys., 2015, 143, 64710 CrossRef PubMed.
- J. M. Skelton, L. A. Burton, S. C. Parker, A. Walsh, C. E. Kim, A. Soon, J. Buckeridge, A. A. Sokol, C. R. A. Catlow, A. Togo and I. Tanaka, Phys. Rev. Lett., 2016, 117, 075502 CrossRef PubMed.
- C. N. Savory, R. G. Palgrave, H. Bronstein and D. O. Scanlon, Sci. Rep., 2016, 6, 20626 CrossRef CAS PubMed.
- M. Birkett, C. N. Savory, A. N. Fioretti, P. Thompson, C. A. Muryn, A. D. Weerakkody, I. Z. Mitrovic, S. Hall, R. Treharne, V. R. Dhanak, D. O. Scanlon, A. Zakutayev and T. D. Veal, Phys. Rev. B, 2017, 95, 115201 CrossRef.
- W. W. Leung, C. N. Savory, R. G. Palgrave and D. O. Scanlon, J. Mater. Chem. C, 2019, 7, 2059–2067 RSC.
- J. Heyd, G. E. Scuseria and M. Ernzerhof, J. Chem. Phys., 2003, 118, 8207–8215 CrossRef CAS.
- P. Mori-Sánchez, A. J. Cohen and W. Yang, Phys. Rev. Lett., 2008, 100, 146401 CrossRef PubMed.
- D. O. Scanlon, J. Buckeridge, C. R. A. Catlow and G. W. Watson, J. Mater. Chem. C, 2014, 2, 3429–3438 RSC.
- C. N. Savory, A. M. Ganose, W. Travis, R. S. Atri, R. G. Palgrave and D. O. Scanlon, J. Mater. Chem. A, 2016, 4, 12648–12657 RSC.
- L. J. Phillips, C. N. Savory, O. S. Hutter, P. J. Yates, H. Shiel, S. Mariotti, L. Bowen, M. Birkett, K. Durose, D. O. Scanlon and J. D. Major, IEEE J. Photovolt., 2019, 9, 544–551 Search PubMed.
- H. Lincke, R. Glaum, V. Dittrich, M. Tegel, D. Johrendt, W. Hermes, M. H. Möller, T. Nilges and R. Pöttgen, Z. Anorg. Allg. Chem., 2008, 634, 1339–1348 CrossRef CAS.
- H. Lincke, R. Glaum, V. Dittrich, M. H. Möller and R. Pöttgen, Z. Anorg. Allg. Chem., 2009, 635, 936–941 CrossRef CAS.
- P. Pulay, Mol. Phys., 1969, 17, 197–204 CrossRef CAS.
- A. M. Ganose, A. J. Jackson and D. O. Scanlon, J. Open Source Softw., 2018, 3, 717 CrossRef.
- J. M. Frost, Phys. Rev. B, 2017, 96, 195202 CrossRef.
- D. W. Davies, C. N. Savory, J. M. Frost, D. O. Scanlon, B. J. Morgan and A. Walsh, J. Phys. Chem. Lett., 2020, 11, 438–444 CrossRef CAS PubMed.
- M. Gajdoš, K. Hummer, G. Kresse, J. Furthmüller and F. Bechstedt, Phys. Rev. B: Condens. Matter Mater. Phys., 2006, 73, 045112 CrossRef.
- S. H. Wei and A. Zunger, Appl. Phys. Lett., 1998, 72, 2011–2013 CrossRef CAS.
- L. A. Burton and A. Walsh, Appl. Phys. Lett., 2013, 102, 132111 CrossRef.
- A. Walsh and K. T. Butler, Acc. Chem. Res., 2014, 47, 364–372 CrossRef CAS PubMed.
- A. M. Ganose, C. N. Savory and D. O. Scanlon, J. Mater. Chem. A, 2017, 5, 7845–7853 RSC.
- A. Togo, L. Chaput, I. Tanaka and G. Hug, Phys. Rev. B: Condens. Matter Mater. Phys., 2010, 81, 174301 CrossRef.
- A. Togo and I. Tanaka, Scr. Mater., 2015, 108, 1–5 CrossRef CAS.
- G. K. Madsen and D. J. Singh, Comput. Phys. Commun., 2006, 175, 67–71 CrossRef CAS.
- K. Momma and F. Izumi, J. Appl. Crystallogr., 2011, 44, 1272–1276 CrossRef CAS.
- P. Haas, F. Tran and P. Blaha, Phys. Rev. B: Condens. Matter Mater. Phys., 2009, 79, 085104 CrossRef.
- S. Muhammady, A. S. Erlyanti, R. Widita and Y. Darma, Int. J. Quantum Chem., 2020, 120, e26090 CrossRef CAS.
- Y. Pei, H. Wang and G. J. Snyder, Adv. Mater., 2012, 24, 6125–6135 CrossRef CAS.
- W. G. Zeier, A. Zevalkink, Z. M. Gibbs, G. Hautier, M. G. Kanatzidis and G. J. Snyder, Angew. Chem., Int. Ed., 2016, 55, 6826–6841 CrossRef CAS PubMed.
- J. He, Y. Xia, S. S. Naghavi, V. Ozoliņš and C. Wolverton, Nat. Commun., 2019, 10, 719 CrossRef CAS PubMed.
- C. J. Bradley and A. P. Cracknell, Acta Crystallogr., Sect. A: Cryst. Phys., Diffr., Theor. Gen. Crystallogr., 1973, 29, 581–582 Search PubMed.
- A. Klein, Thin Solid Films, 2012, 520, 3721–3728 CrossRef CAS.
- H. Hiramatsu, K. Ueda, H. Ohta, M. Hirano, T. Kamiya and H. Hosono, Thin Solid Films, 2003, 445, 304–308 CrossRef CAS.
- B. A. Williamson, J. Buckeridge, N. P. Chadwick, S. Sathasivam, C. J. Carmalt, I. P. Parkin and D. O. Scanlon, Chem. Mater., 2019, 31, 2577–2589 CrossRef CAS PubMed.
- S. M. Kauzlarich, A. Zevalkink, E. Toberer and G. J. Snyder, in Thermoelectric Materials and Devices, The Royal Society of Chemistry, 2007, pp. 1–26 Search PubMed.
- R. Peierls, Ann. Phys., 1929, 395, 1055–1101 CrossRef.
- J. Callaway, Phys. Rev., 1959, 113, 1046–1051 CrossRef CAS.
- Y. J. Han, Phys. Rev. B: Condens. Matter Mater. Phys., 1996, 54, 8977–8980 CrossRef CAS PubMed.
- Y. Xiao, C. Chang, Y. Pei, D. Wu, K. Peng, X. Zhou, S. Gong, J. He, Y. Zhang, Z. Zeng and L. D. Zhao, Phys. Rev. B, 2016, 94, 125203 CrossRef.
- L. Lindsay and C. A. Polanco, in Handb. Mater. Model., 2018, pp. 1–31 Search PubMed.
- M. Shikano and R. Funahashi, Appl. Phys. Lett., 2003, 82, 1851–1853 CrossRef CAS.
- Y. L. Pei, H. Wu, D. Wu, F. Zheng and J. He, J. Am. Chem. Soc., 2014, 136, 13902–13908 CrossRef CAS PubMed.
- F. Zhang, S. H. Wei and A. Zunger, Phys. Rev. Lett., 2000, 84, 1232–1235 CrossRef PubMed.
- S. B. Zhang, S. H. Wei and A. Zunger, J. Appl. Phys., 1998, 83, 3192–3196 CrossRef CAS.
- W. Walukiewicz, Phys. B, 2001, 302–303, 123–134 CrossRef.
- W. Walukiewicz, J. Cryst. Growth, 1996, 159, 244–247 CrossRef CAS.
- W. Walukiewicz, Appl. Phys. Lett., 1989, 54, 2094–2096 CrossRef CAS.
- S. B. Zhang, J. Phys.: Condens. Matter, 2002, 14, R881–R903 CrossRef CAS.
- M. Burbano, D. O. Scanlon and G. W. Watson, J. Am. Chem. Soc., 2011, 133, 15065–15072 CrossRef CAS PubMed.
Footnote |
| † Electronic supplementary information (ESI) available. See DOI: 10.1039/d0ta00690d |
| This journal is © The Royal Society of Chemistry 2020 |