
 Open Access Article
 This Open Access Article is licensed under a Creative Commons Attribution-Non Commercial 3.0 Unported Licence
LiSi3As6 and Li2SiAs2 with flexible SiAs2 polyanions: synthesis, structure, bonding, and ionic conductivity†
Justin
Mark
 ab,
Kathleen
Lee‡
c,
Maxwell A. T.
Marple
d,
Shannon
Lee
ab,
Sabyasachi
Sen
d and
Kirill
Kovnir
*ab
ab,
Kathleen
Lee‡
c,
Maxwell A. T.
Marple
d,
Shannon
Lee
ab,
Sabyasachi
Sen
d and
Kirill
Kovnir
*ab
aDepartment of Chemistry, Iowa State University, Ames, Iowa 50011, USA. E-mail: kovnir@iastate.edu
bAmes Laboratory, U.S. Department of Energy, Ames, Iowa 50011, USA
cDepartment of Chemistry, University of California, Davis, Davis, CA 95616, USA
dDepartment of Materials Science and Engineering, University of California, Davis, Davis, CA 95616, USA
First published on 9th January 2020
Abstract
Two novel ternary phases, LiSi3As6 and Li2SiAs2, have been synthesized and characterized. Both phases have an identical Si![[thin space (1/6-em)]](https://www.rsc.org/images/entities/char_2009.gif) :As ratio of 1:2 providing insight on how layers of the parent phase SiAs2 accommodate excess electrons from Li cations to form Si–As anionic frameworks. LiSi3As6 exhibits a variety of bonding schemes involving Si–Si and As–As bonds, as well as corner-sharing SiAs4 tetrahedra, while Li2SiAs2 is isostructural to the previously reported Li2SiP2, with adamantane-like Si4As10 units connected into 3D framework. LiSi3As6 and Li2SiAs2 are predicted to be indirect semiconductors which was experimentally confirmed by optical properties characterization. Li2SiAs2 exhibits low thermal conductivity of 1.20 W m−1 K−1 at 300 K in combination with a room temperature ionic conductivity of 7 × 10⁻⁶ S cm−1, an order of magnitude greater than that of the phosphide and nitride analogues, indicating its potential as a solid-state Li-ion conductor.
:As ratio of 1:2 providing insight on how layers of the parent phase SiAs2 accommodate excess electrons from Li cations to form Si–As anionic frameworks. LiSi3As6 exhibits a variety of bonding schemes involving Si–Si and As–As bonds, as well as corner-sharing SiAs4 tetrahedra, while Li2SiAs2 is isostructural to the previously reported Li2SiP2, with adamantane-like Si4As10 units connected into 3D framework. LiSi3As6 and Li2SiAs2 are predicted to be indirect semiconductors which was experimentally confirmed by optical properties characterization. Li2SiAs2 exhibits low thermal conductivity of 1.20 W m−1 K−1 at 300 K in combination with a room temperature ionic conductivity of 7 × 10⁻⁶ S cm−1, an order of magnitude greater than that of the phosphide and nitride analogues, indicating its potential as a solid-state Li-ion conductor.
Introduction
Ionic conductivity is one of the fundamental properties of matter which is highly demanded for various applications from membranes and sensors to fuel cells and batteries. Discovery of novel compounds containing the desired ions and understanding of basic structure–properties relationships is crucial for the development of novel ion conductors. For example, in batteries, oxide and nitride materials were traditionally considered as potential Li and Na solid ion conductors, such as NASICON, LISICON, garnet, and perovskite type conductors.1–5 Recent discovery of the novel crystalline phase Li10GeP2S12 with extraordinary ionic conductivity pointed out the potential of non-oxide systems.6–13 Indeed, a reduction of the ionicity of the Li–X bonds (where Li is surrounded by X atoms) should result in easier Li transport, as shown through comparing oxides vs. phosphides.14 This pointed to the necessity to study complex Li pnictides, which led to the recent discovery of several promising Li–Si–P phases, such as Li14SiP6, Li10Si2P6, Li8SiP4, Li3Si3P7, Li2SiP2, and LiSi2P3.15–18 These recent works revealed that the Li–Si–P system was poorly investigated with the only previously reported compound, Li5SiP3, having been identified in 1954.19 In the same article by Juza and Schulz, the first Li–Si–As compound Li5SiAs3 was also reported.19Given the many similarities in phosphide and arsenide chemistry, we explored the Li–Si–As system for new phases to investigate further reduction of the ionicity of Li–X bonds and changes in Li conductivity. Upon our exploration of Li intercalation into the binary layered SiAs we reported a novel layered compound, Li3Si7As8, which was only the second phase ever reported in this ternary phase space.20 Based on the existence of another binary silicon arsenide, SiAs2, we kept the Si:As ratio as 1:2 and studied how the Si–As anionic framework would react to different concentrations of Li cations (Fig. 1). This has resulted in the discovery of two new phases, LiSi3As6 (=Li0.33SiAs2) and Li2SiAs2, with the latter being isostructural to previously reported Li2SiP2.17,18 LiSi3As6 exhibits an intricate structure and bonding demonstrating that the complex bonding motifs frequently exhibited by silicon-phosphides are also available to the arsenide counterparts. Si–As frameworks in both reported crystal structures differ from that in the Li-free SiAs2 due to the extra electrons provided by Li cations causing Si–As bonding rearrangements. In this work we report on the syntheses and crystal structures of the title phases and detailed characterization of heat transport properties and Li-conductivity of Li2SiAs2.
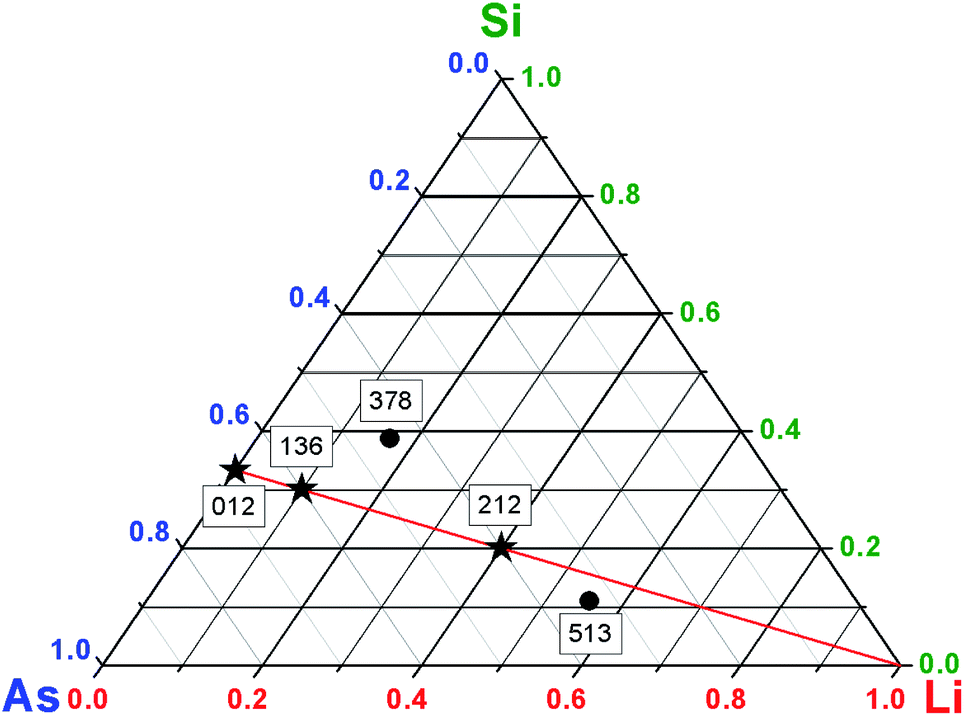 | ||
| Fig. 1 Ternary phase diagram for the Li–Si–As system. SiAs2, LiSi3As6, and Li2SiAs2 are shown as stars connected with a red line, while Li5SiAs3 and Li3Si7As8 are shown as circles.19,20 The labels of the compounds correspond to the stoichiometric ratios of Li:Si:As. | ||
Experimental
Warning
At high temperatures the As vapor pressure may be sufficient to damage the reaction ampoule. Another possible reason for ampoule failure is the reaction of silica with Li. In either case, the release of toxic As vapor will occur. The concentration of As should be kept to a minimum. Use of the secondary larger size ampoule and placing the furnace in a well-ventilated space like a fumehood is highly recommended.Synthesis
All materials were handled in an Ar-filled glovebox with O2 levels < 1 ppm. The starting materials, Si (Alfa Aesar, 99.999%) and gray As (Alfa Aesar, 99.9999%) were used as received. The surface of the Li granules (Alfa Aesar, 99%) was scraped off to remove any surface oxidation.A single crystal of LiSi3As6 was first obtained by loading elemental Li, Si, and As into a carbonized silica ampoule (9/11 mm inner/outer diameter) in a 0.8:3:3 ratio, respectively. The ampoule was then flame sealed under vacuum. The initial ampoule was then placed into a larger silica ampoule and flame sealed under vacuum to create a protective outer jacket. The ampoule was placed in a muffle furnace and heated to 923 K over 48 h. The sample was annealed at this temperature for 240 h and then slowly cooled to room temperature over 48 h. It was subsequently found that LiSi3As6 could be synthesized by a stoichiometric mixture of the elements, under the same conditions, however the sample was still contaminated with significant amounts of SiAs2, Si, and As admixtures. Reducing the reaction temperature to 823 K prevents SiAs2 formation, however unreacted Si and As remain. Further attempts to synthesize single phase samples by varying the temperature profile were unsuccessful.
Li2SiAs2 was first synthesized by loading elemental Li, Si, and As in a 0.5:1:2 ratio into a Nb ampoule, which resulted in a mixture of Li2SiAs2 as well as SiAs, Si, and As. Single phase samples of Li2SiAs2 were prepared using a stoichiometric ratio of the elements sealed in a Nb ampoule under Ar atmosphere. The Nb ampoule was then sealed inside a silica ampoule under vacuum to prevent Nb oxidation during annealing. The ampoule was placed in a muffle furnace and heated to 523 K over 24 h, annealed at this temperature for 24 h, and heated to 923 K over 24 h, and annealed at this temperature for 96 h. The furnace was then turned off and the furnace was cooled to room temperature. The product is a red powder that degrades after several minutes of exposure to ambient conditions.
X-ray diffraction
Powder X-ray diffraction (XRD) was performed using a Rigaku Miniflex 600 with Cu-Kα radiation and a Ni-Kβ filter using sample holders with a zero-background silicon plate insert (Fig. 2). | ||
| Fig. 2 Powder X-ray diffraction patterns of as-synthesized LiSi3As6 (top) and Li2SiAs2 (bottom). Below each experimental pattern (black) is a calculated pattern based on the crystal structure for LiSi3As6 (red) and Li2SiAs2 (blue). The admixture peaks are indicated in the legend. While LiSi3As6 is not single phase, the Li2SiAs2 contain minimum amounts of admixture which may also be generated during XRD experiment due to exposure to air. | ||
Single crystal XRD was performed using a Bruker AXS SMART diffractometer and Bruker D8 Venture diffractometer, both utilizing Mo-Kα radiation. Datasets were collected at 90 K under a N2 stream and under ambient conditions with ω-scans recorded with a 0.3° step width and integrated with the Bruker SAINT software. Structure determination and refinement of the crystal structures were carried out using the SHELX suite of programs.21 Further details of the crystal structure determination may be found through Cambridge Crystallographic Data Centre by using CCDC-1954349 (Li2SiAs2) and CCDC-1954350 (LiSi3As6).†
Scanning electron microscopy energy-dispersive X-ray spectroscopy (SEM-EDXS)
Elemental analyses of selected crystals of for LiSi3As6 were performed using a FEI Quanta 250 field emission-SEM with EDXS detection (Oxford X-Max 80) and Aztec software (Fig. S3†). Samples were mounted in epoxy, polished to a level surface, coated with a conductive layer of carbon, and then mounted onto carbon tape. The average Si:As ratio was determined to be 1:2.1(4) based on scans of 12 sites, confirming the 1:2 Si:As ratio for LiSi3As6.
Diffuse reflectance spectroscopy
UV-vis diffuse reflectance spectrum of Li2SiAs2 was recorded using a Thermo Scientific Evolution 220 Spectrometer equipped with an integrating sphere. The reflectance data were converted to the Kubelka–Munk function, f(R) = (1 − R)2(2R)−1. Samples were cold-pressed into an 8 mm diameter pellet in an Ar-filled glovebox. The pellet was sealed inside a polypropylene bag to ensure the sample would not oxidize during the measurement. An empty polypropylene bag was used for the background scans.Differential scanning calorimetry (DSC)
Differential scanning calorimetry was performed on a Netzcsh STA 449 F3 Jupiter and Netzsch DSC 404 F3 Pegasus Differential Scanning Calorimeters. Approximately 30–50 mg of sample were sealed inside evacuated silica ampoules. LiSi3As6 was heated at a rate of 10 K min−1 with a max temperature of 1073 K and cooled to room temperature at the same rate. Li2SiAs2 was heated to 1273 K and cooled to room temperature at a rate of 10 K min−1. XRD patterns were collected after DSC experiments (Fig. S2†).Quantum chemical calculations
Electronic structure calculations including the band structure, density of states (DOS), and electron localization function (ELF) analyses, were carried out using the tight-binding linear muffin-tin orbital atomic sphere approximation (TB-LMTO-ASA) package.22 The Barth Hedin exchange potential was used for the LDA calculations.23 A basis set of As(4s, 4p), Si(3s, 3p), and Li(2s) orbitals was used with downfolded As(4d), Si(3d), Li(2p, 3d) orbitals. The DOS and band structures for LiSi3As6 were calculated after converging the total energy on a k-mesh of 8 × 8 × 8 points with 105 irreducible k-points, while Li2SiAs2 was computed with a k-mesh of 8 × 8 × 8 points with 59 irreducible k-points. The ELF (η)24–27 was evaluated with modules implemented within the TB-LMTO-ASA program package. The ParaView program was used for visualization of ELF.28,29Spark plasma sintering (SPS)
All manipulation and handling of Li2SiAs2 samples and SPS dies were performed in an Ar-filled glovebox. Finely ground powder was loaded into a 5 mm diameter graphite die between two sheets of graphite foil and WC plungers. This assembly was loaded into a protective outer graphite die with graphite plungers. The sample was quickly transferred to the SPS (Dr Sinter Lab Jr SPS-211Lx, Sumitomo Coal Mining Co., Ltd.) to limit the exposure to air. A uniaxial pressure of 50 MPa was applied while the sample was heated to 648 K over 4 minutes, then heated to 748 K over 5 minutes. The sample was annealed at this temperature for 10 minutes while the pressure was increased to 127 MPa. The pressure was then released, and the sample was cooled to room temperature. The assembly was quickly transferred to an Ar-filled glovebox where the surfaces were polished to remove any traces of graphite.Li-conductivity
Electrical conductivity was measured by ac impedance methods using a HP 4192A impedance analyzer with a frequency range of 30 Hz to 13 MHz (Fig. S4 and S5†). Colloidal silver paste (Ted Pella) was applied to pellets sintered via SPS and cured to form the electrodes. The sample was measured within an Ar filled glovebox through a temperature range of 300–369 K. Measurements were carried out after the sample's temperature reached equilibrium. ZView software was used to analyze the impedance spectra through simulation with a series of parallel resistor and constant phase elements for bulk and grain boundary responses.Determination of the ionic transference number was accomplished by using the dc polarization technique on a cell of Ag/Li2SiAs2/Li. A Keithley 230 voltage source in series with a Keithley 617 electrometer was used to simultaneously apply 5 mV and measure the current response with time. The polarity of the cell (+)Ag/Li2SiAs2/Li(−) results in depletion of Li ions at the Ag electrode/Li2SiAs2 interface allowing only electronic charge carriers as the source of electrical current. Comparing the initial current when the voltage was activated to the current after reaching steady state provides the electronic contribution to conductivity and consequently the ionic transference number through, tion + telec = 1.
Thermal transport
Temperature-dependent thermal conductivity was measured on a Li2SiAs2 pellet of greater than 85% geometrical density in the temperature range of 2–300 K on a commercial multipurpose Physical Properties Measurement System (PPMS, Quantum Design) using the Thermal Transport Option.Results/discussion
Both compounds can be synthesized using elements as precursors. The high Li content in Li2SiAs2 requires the use of Nb crucibles to avoid Li losses through reactions with silica. This compound was synthesized as almost single-phase sample. In the case of LiSi3As6, samples with significant amounts of the target phase were produced, but single-phase samples were not achieved despite multiple efforts. LiSi3As6 appears very stable, demonstrating long term air stability, as well as stability in H2O and 6 M HCl washes for at least 30 minutes. On the other hand, Li2SiAs2 is more air-sensitive, showing significant signs of degradation after a couple minutes of exposure to ambient conditions. This drastic disparity in stability may stem from the large difference in the Li contents. The decrease of the stability with the increase of the formal negative charge on the pnictide polyanion was observed in the Cs–Si–As system. For example, Cs0.16SiAs2 is water stable, while Cs2SiAs2 is moisture sensitive and Cs5SiAs3 is air sensitive.30–32 Similarly, Li3Si7As8 with a Li content between LiSi3As6 and Li2SiAs2 was reported to be mildly air-sensitive and moisture sensitive.20Differential scanning calorimetry (DSC) was used to investigate the thermal stabilities of the title phases. DSC of LiSi3As6 exhibits two peaks upon heating, the first at 801 K is attributed to the sublimation of elemental arsenic impurities in the sample, while the peak at 995 K is the melting/decomposition of LiSi3As6; however no sharp peaks corresponding to recrystallization were observed upon cooling (Fig. S1† top). PXRD of the sample after the DSC measurement shows the major phase to be SiAs2, with a Si impurity which was in the initial sample (Fig. S2†). DSC experiment indicates that upon heating a peritectic decomposition of LiSi3As6 into SiAs2 took place. The DSC experiment was performed in a silica container and the released Li may have reacted with silica at high temperature. The melting point of SiAs2 is 1250 K which is higher than the maximum temperature used in the DSC experiment. Thus, SiAs2 was not melted and no sharp crystallization peaks were observed upon cooling. For Li2SiAs2, DSC shows the onset of melting at 1167 K with a sharp crystallization peak beginning at 740 K (Fig. S1† bottom). The melting temperature was higher than the synthesis temperature of 923 K. PXRD of the products after the DSC measurement shows that the sample contains mainly Li2SiAs2 with SiAs impurities, most likely due to the Li reacting with the silica ampoule during heating.
LiSi3As6 crystallizes in the orthorhombic Cmce space group (No. 64), Pearson symbol oS-80. Similar to a number of complex ternary silicon phosphides,33–40 LiSi3As6 exhibits several different bonding schemes including corner sharing SiAs4 tetrahedra, Si–Si dumbbells, and As–As bonds. The structure is composed of alternating planes of SiAs4 tetrahedra and Si2As6 antiprisms along the b-direction (Fig. 3A and B). The SiAs4 tetrahedra have Si–As distances of 2.316(2)–2.405(2) Å, similar to distances reported in compounds such as Cs5SiAs3, Li3Si7As8, and CeSiAs3, among others.20,32,41–47 These tetrahedra are interconnected through three different bonding arrangements to form a slab, shown in Fig. 3D. Along [100] direction, chains of corner sharing tetrahedra are further linked through alternating As–As bonds which are 2.512(2) Å in length. These chains are combined into a slab by perpendicular As–As bonds of 2.445(1) Å along the [001] direction between neighboring chains (Fig. 3D). Both As–As distances are within reported lengths observed for As–As bonds.41,42,48–51
 | ||
| Fig. 3 Crystal structure of LiSi3As6. (A) and (B) general views along [001] and [100]; (C) view of the Si2As6 antiprism slab omitting the tetrahedra; (D) view of the SiAs4 tetrahedral slab. Unit cell shown as black lines, Li: pink, Si: black, As: blue, SiAs4: gray, Si2As6: teal. | ||
The plane of Si2As6 antiprisms is formed through isolated Si2As6 units, which are surrounded by 6 Li atoms in the ab-plane, shown in Fig. 3C. The Si–Si distance in these antiprisms is 2.341(6) Å, while the Si–As distances measure 2.367(2)–2.387(3) Å, all within typical reported distances taking into account covalent radii for Si (1.17 Å) and As (1.22 Å).20,32,36,41–47,52–54,58 The Li atoms within this plane have distorted octahedral coordination with Li–As distances of 2.83(2)–2.95(2) Å, which fall within reported values.19,20,55–57 All As atoms in the Si2As6 units are corner shared with SiAs4 tetrahedra from neighboring slabs along the b-direction, creating the complex 3D structural arrangement.
LiSi3As6 has a Wyckoff sequence of g3f2ed. Other compounds with this Wyckoff sequence include Ta6Br14, Ta6I14, CuP4Se4I, and MnTl2As2S5.59–62 Ta6Br14 and Ta6I14 contain isolated clusters forming 1D structures, while CuP4Se4I crystallizes in a 2D layered structure.59–61 Previously MnTl2As2S5 was the only 3D phase reported with this Wyckoff sequence, however this structure lacks homoatomic bonds like the Si–Si bonds found in LiSi3As6.62
Li2SiAs2 crystallizes in the tetragonal space group I41/acd (No. 142) in the same structure type as Na2SnAs2 and Li2SiP2.17,18,63 Adamantane-like Si4As10 units are connected to each other through shared As atoms (Fig. 4). In the structure, each Si atom is coordinated by four As atoms forming a tetrahedron while each As is coordinated by two Si atoms (Fig. 4C). Li atoms are tetrahedrally coordinated by four As atoms (Fig. 4D). The Si–As bond distances found in Li2SiAs2 are in a much narrower range compared to LiSi3As6, falling between 2.3424(8)–2.3778(7) Å. These bond lengths fall in the mid-range of those found in LiSi3As6, matching common lengths in other compounds.20,32,41–47 The Li–As distances range from 2.516(3)–2.853(1) Å and are shorter than those found in LiSi3As6, however they span distances found for other reported Li–As containing compounds and are not nearly as short as distances found in Li3Si7As8.19,20,55–57 Larger alkali metals, A = K, Rb, and Cs, form 2–1–2 compounds, A2SiAs2.32,44,64 In the crystal structure of these compounds one-dimensional anionic [SiAs2]2− chains composed of edge-sharing SiAs4 tetrahedra are present. A reduction of the cation size leads to rearrangements of the same building units, SiAs4 tetrahedra, into a three-dimensional framework.
 | ||
| Fig. 4 Crystal structure of Li2SiAs2. (A) and (B) general views; (C) Si4As10 adamantane-like fragment; (D) Li coordination. Unit cell shown as black lines, Li: pink, Si: black, As: blue, Li@As4: pink, Si4As10: teal. | ||
We have previously shown that the parent SiAs2 binary compound is able to accommodate ∼0.16 cations as large as Cs per formula unit in the interlayer space forming Cs0.16SiAs2−x without significant modification of the 2D SiAs2 layers, given that the extra electrons are compensated either by As vacancy formation or by aliovalent M/Si substitutions (M = Ga, Zn, Cu).30 Further increase of the cation content leads to the structural reconstruction in the Si–As framework. Doubling the cation content in the case of LiSi3As6 (=Li0.33SiAs2) results in a collapse of the layered structure of SiAs2 into a 3D framework with the formation of Si–Si bonds. However, LiSi3As6 maintains the SiAs4 corner-sharing and As–As bonding within a “layer,” similar to the Si–As layers found in SiAs2.42 The Li2SiAs2 stoichiometry results in more drastic structural rearrangements due to the excess electrons added to the Si–As network. This results in the removal of homoatomic bonds, as the Li2SiAs2 no longer contains any Si–Si or As–As bonds. Partial removal of homoatomic bonds was also observed for the Li incorporation into SiAs to form Li3Si7As8.20
Considering a polar bonding scheme for LiSi3As6, each tetrahedral Si can be considered as Si4+, while each Si in the antiprism can be considered as Si3+. Similarly, As coordinated to three or two Si atoms is As3−, while As atoms forming one or two bonds to As atoms are As2− and As−, respectively. This bonding scheme results in the electron balanced composition of (Li+)(Si4+)2(Si3+)(As3−)2(As2−)2(As−)2. Alternatively, the Si–As bonds can be considered as covalent bonds where the electron pair is shared between As and Si. In such a description four-coordinated Si atoms and three-coordinated As atoms have oxidation states of 0, while two-coordinated As atoms have formal oxidation states of −1, leading to the electron-balanced formula (Li+)(Si0)3(As0)5(As−). For Li2SiAs2, both polar and covalent assignments of the oxidation states result in charge balanced compositions of (Li+)2(Si4+)(As3−)2 and (Li+)2(Si0)(As−)2, respectively.
To gain a better understanding of the bonding in these phases electronic structure calculations were performed using the TB-LMTO-ASA program.22 From the band structures and DOS, LiSi3As6 and Li2SiAs2 were found to be indirect semiconductors with bandgaps of 0.97 eV and 1.43 eV, respectively (Fig. 5). For Li2SiAs2 both direct transitions at the Z and Γ points have larger energy of 1.67 eV, while for LiSi3As6 the direct transition at the Γ point is 1.31 eV. The density of states for both phases exhibit significant contributions from Si and As in the conduction and valence bands, suggesting strong covalent bonding in the Si–As frameworks. For Li2SiAs2 electron localization function analysis shows the expected covalent bonding between Si and As with two electron lone pairs on each As atom (Fig. 6). This is expected because each As is coordinated to two silicon atoms. This result favors the covalent description of the chemical bonding in Li2SiAs2 as (Li+)2(Si0)(As−)2.
 | ||
| Fig. 5 Density of states and band structures for LiSi3As6 (top) and Li2SiAs2 (bottom). | ||
 | ||
| Fig. 6 Electron localization function isosurface (η = 0.84) for Li2SiAs2. Si: black, As: blue. | ||
Analysis of the chemical bonding in LiSi3As6 also supports the covalent nature of the Si–As interactions. Si1 atoms are engaged in the three covalent Si–As bonds in addition to the Si1–Si1 covalent bond, while Si2 atoms form four Si–As bonds similar to Si atoms in Li2SiAs2 (Fig. 7A). As4 forms three As–Si bonds and has an electron lone pair (Fig. 7B). Every As atom in the SiAs4 pentagonal ring fragment has one electron lone pair in addition to two As–Si + one As–As bonds (for As1) or two As–As + one As–Si bonds (for As3) (Fig. 7C). Finally, two coordinated As2 is an analogue of the As atoms in Li2SiAs2, possessing two-electron lone pairs in addition to two As–Si bonds, which supports its description as As− (Fig. 7B). Li atoms are not engaged in the covalent bonding and have spherical distribution of ELF corresponding to core 2s electrons (Fig. 7D).
 | ||
| Fig. 7 Chemical bonding in LiSi3As6 according to electron localization function (ELF, η) analysis: 3D isosurfaces of ELF showing bonding around (A) Si atoms, η = 0.82; (B) As2 and As4 atoms, η = 0.82; (C) As1–As3–As3–As1 fragment, η = 0.69; (D) coloring of the ELF distributions for a slice of the crystal structure of LiSi3As6 containing Li atom. As: blue; Si; black, Li: pink. | ||
To confirm the theoretical bandgap of Li2SiAs2 diffuse reflectance spectroscopy was utilized to determine the experimental bandgap. Measurements were performed on pellets sealed under argon inside polypropylene bags to prevent sample oxidation during data collection. Tauc plots of Li2SiAs2 show that it has an indirect transition of less than the instrument limit of 1.1 eV and a direct transition of 1.40 eV (Fig. 8). The large bandgaps are supported by quantum chemical calculations and by the red-brown color of the crystals. Due to the black color of LiSi3As6 and Si impurities in samples the experimental band gap was not measured for LiSi3As6.
 | ||
| Fig. 8 Solid-state UV-vis Kubelka–Munk diffuse reflectance spectrum of Li2SiAs2 (left). Tauc plots for allowed direct and indirect transitions (right). | ||
Presence of significant amounts of Si and As impurities in the samples of LiSi3As6 prevented property characterization for this silicon-arsenide. However, Li2SiAs2 was synthesized near single-phase and its thermal, charge, and ion conductivities were studied in detail. Li2SiAs2 is expected to have a low thermal conductivity due to the large number of atoms in the unit cell and overall complexity of the crystal structure which should result in complex phonon structure. The measured temperature-dependent thermal conductivity has a typical trend for crystalline compounds with a peak at 50 K and decreasing thermal conductivity as a function of increasing temperature at higher temperatures due to Umklapp phonon–phonon scattering (Fig. 9). At 300 K the thermal conductivity reaches a value of 1.20 W m−1 K−1. The electrical resistivity of Li2SiAs2 was too high to be measured using the Physical Property Measurement System. We estimated the electrical resistivity to be above 10 kΩ m at room temperature based on our previous experience with highly resistive compounds and PPMS.65,66 The impedance measurements confirmed high dc electrical resistivity of the Li2SiAs2 to be over 70 kΩ m.
 | ||
| Fig. 9 Temperature-dependent thermal conductivity of Li2SiAs2. | ||
Given the isostructural nature of Li2SiAs2 to Li2SiP2 and the promising Li-ion conductivity observed in the latter,17,18 the Li-conductivity of a pressed pellet of Li2SiAs2 was characterized. Fig. 10 shows the temperature-dependence of the bulk electrical conductivity for Li2SiAs2 with a room temperature conductivity of 7 × 10⁻⁶ S cm−1. The impedance curves are provided in the Fig. S4 and S5.† This conductivity is over an order of magnitude greater than that of the analogous phosphide (4 × 10⁻⁷ S cm−1) and nitride (8 × 10⁻⁸ S cm−1) phases,17,67 indicating the potential of Li2SiAs2 as a solid-state Li-ion conductor. This conductivity may be further enhanced through trivalent doping, as predicted for Li2SiP2 by Yeandel et al.68 or even by increasing the Li content as seen by enhanced performance when going from Li8SiP4 to the related Li14SiP6.15 The activation energy for conduction is calculated from the slope of conductivity using an Arrhenius expression of σ(T) = σ0exp(−Ea/kT) and found to be Ea = 0.53 eV. DC polarization experiments reveal the ionic transference number is 0.98, indicating the conductivity is almost entirely ionic in character, which is a prerequisite for solid ionic conductor applications in Li-ion batteries. A combination of high Li-ionic conductivity with low electrical conductivity suggests Li2SiAs2 is a promising solid-state Li-ion conductor.
 | ||
| Fig. 10 Arrhenius plot of the ionic conductivity temperature dependence for Li2SiAs2. | ||
Conclusions
Two new phases in the Li–Si–As ternary system have been synthesized and characterized. LiSi3As6 crystallizes in a new structure type and its structural complexity demonstrates that the various bonding schemes often observed in tetrel-phosphides can also be displayed in the less studied tetrel-arsenides. Li2SiAs2 is isostructural to previously reported Li2SiP2 and exhibits ionic conductivity that is an order of magnitude greater than that of the phosphide and nitride analogues, in line with the increase of size and decrease in electronegativity of As compared to P and N. These two new phases add to the recently growing Li–Si–As phase space and indicate there is much to be explored in this system in terms of phase identification and property characterization.Conflicts of interest
There are no conflicts to declare.Acknowledgements
We thank Prof. F. Osterloh (UC Davis) for access to the UV-vis spectrometer, Ben Nail (UC Davis) for assistance with the diffuse reflectance measurements, and Prof. S. M. Kauzlarich (UC Davis) for access to the SPS and DSC. This work was supported by the Laboratory Research and Development Program of the Ames Laboratory under the U.S. Department of Energy Contract No. DE-AC02-07CH11358.References
- P. Knauth, Solid State Ionics, 2009, 180, 911–916 CrossRef CAS.
- Y. Meesala, A. Jena, H. Chang and R.-S. Liu, ACS Energy Lett., 2017, 2, 2734–2751 CrossRef CAS.
- S.-C. Li, J.-Y. Cai and Z.-X. Lin, Solid State Ionics, 1988, 28–30, 1265–1270 CrossRef.
- Y. Deng, C. Eames, B. Fleutot, R. David, J. N. Chotard, E. Suard, C. Masquelier and M. S. Islam, ACS Appl. Mater. Interfaces, 2017, 9, 7050–7058 CrossRef CAS PubMed.
- S. Narayanan, F. Ramezanipour and V. Thangadurai, J. Phys. Chem. C, 2012, 116, 20154–20162 CrossRef CAS.
- A. Bhandari and J. Bhattacharya, J. Phys. Chem. C, 2016, 120, 29002–29010 CrossRef CAS.
- N. Kamaya, K. Homma, Y. Yamakawa, M. Hirayama, R. Kanno, M. Yonemura, T. Kamiyama, Y. Kato, S. Hama, K. Kawamoto and A. Mitsui, Nat. Mater., 2011, 10, 682–686 CrossRef CAS PubMed.
- A. Kuhn, J. Kohler and B. V. Lotsch, Phys. Chem. Chem. Phys., 2013, 15, 11620–11622 RSC.
- P. Bron, S. Johansson, K. Zick, J. Schmedt auf der Gunne, S. Dehnen and B. Roling, J. Am. Chem. Soc., 2013, 135, 15694–15697 CrossRef CAS PubMed.
- A. Kuhn, O. Gerbig, C. Zhu, F. Falkenberg, J. Maier and B. V. Lotsch, Phys. Chem. Chem. Phys., 2014, 16, 14669–14674 RSC.
- Y. Kato, R. Saito, M. Sakano, A. Mitsui, M. Hirayama and R. Kanno, J. Power Sources, 2014, 271, 60–64 CrossRef CAS.
- S. P. Ong, Y. Mo, W. D. Richards, L. Miara, H. S. Lee and G. Ceder, Energy Environ. Sci., 2013, 6, 148–156 RSC.
- I. Tarhouchi, V. Viallet, P. Vinatier and M. Ménétrier, Solid State Ionics, 2016, 296, 18–25 CrossRef CAS.
- P. G. Bruce, B. Scrosati and J. M. Tarascon, Angew. Chem., Int. Ed., 2008, 47, 2930–2946 CrossRef CAS PubMed.
- S. Strangmuller, H. Eickhoff, D. Muller, W. Klein, G. Raudaschl-Sieber, H. Kirchhain, C. Sedlmeier, V. Baran, A. Senyshyn, V. L. Deringer, L. van Wullen, H. A. Gasteiger and T. F. Fässler, J. Am. Chem. Soc., 2019, 141, 14200–14209 CrossRef PubMed.
- H. Eickhoff, L. Toffoletti, W. Klein, G. Raudaschl-Sieber and T. F. Fässler, Inorg. Chem., 2017, 56, 6688–6694 CrossRef CAS PubMed.
- L. Toffoletti, H. Kirchhain, J. Landesfeind, W. Klein, L. van Wullen, H. A. Gasteiger and T. F. Fässler, Chem.–Eur. J., 2016, 22, 17635–17645 CrossRef CAS PubMed.
- A. Haffner, T. Bräuniger and D. Johrendt, Angew. Chem., Int. Ed., 2016, 55, 13585–13588 CrossRef CAS PubMed.
- R. Juza and W. Schulz, Z. Anorg. Allg. Chem., 1954, 275, 65–78 CrossRef CAS.
- J. Mark, M. P. Hanrahan, K. E. Woo, S. Lee, A. J. Rossini and K. Kovnir, Chem.–Eur. J., 2019, 25, 6392–6401 CrossRef CAS PubMed.
- G. M. Sheldrick, Acta Crystallogr., Sect. A: Found. Crystallogr., 2008, 64, 112–122 CrossRef CAS PubMed.
- O. Jepsen, A. Burkhardt and O. K. Andersen, The Program TB-LMTO-ASA, Version 4.7, Max-Planck-Institut fur Festkorperforschung, Stuttgart, Germany, 1999 Search PubMed.
- U. von Barth and L. Hedin, J. Phys. C: Solid State Phys., 1972, 5, 1629–1642 CrossRef CAS.
- A. D. Becke and K. E. Edgecombe, J. Chem. Phys., 1990, 92, 5397 CrossRef CAS.
- A. Savin, O. Jepsen, J. Flad, O. K. Andersen, H. Preuss and H. G. von Schnering, Angew. Chem., Int. Ed. Engl., 1992, 31, 187–188 CrossRef.
- A. Savin, R. Nesper, S. Wengert and T. F. Fässler, Angew. Chem., Int. Ed. Engl., 1997, 36, 1808–1832 CrossRef CAS.
- Y. Grin, A. Savin and B. Silvi, in The Chemical Bond: Fundamental Aspects of Chemical Bonding, ed. G. Frenking and S. Shaik, Wiley-VCH, Weinheim, 2014, vol. 10, pp. 345–382 Search PubMed.
- Sandia National Labs, Kitware Inc, Los Alamos National Labs, Paraview: Parallel visualization application, version 4.1.0 64-bit, USA, http://paraview.org Search PubMed.
- A. I. Baranov, Visualization plugin for ParaView, 2012 Search PubMed.
- K. E. Woo, J. A. Dolyniuk and K. Kovnir, Inorg. Chem., 2019, 58, 4997–5005 CrossRef CAS PubMed.
- B. Eisenmann and J. Klein, J. Less-Common Met., 1991, 175, 109–117 CrossRef CAS.
- B. Eisenmann, J. Klein and M. Somer, Angew. Chem., Int. Ed. Engl., 1990, 29, 87–88 CrossRef.
- A. Haffner and D. Johrendt, Z. Anorg. Allg. Chem., 2017, 643, 1717–1720 CrossRef CAS.
- J. Mark, J.-A. Dolyniuk, N. Tran and K. Kovnir, Z. Anorg. Allg. Chem., 2019, 645, 242–247 CrossRef CAS.
- J. Mark, J. Wang, K. Wu, J. G. Lo, S. Lee and K. Kovnir, J. Am. Chem. Soc., 2019, 141, 11976–11983 CrossRef CAS PubMed.
- X. Zhang, T. Yu, C. Li, S. Wang and X. Tao, Z. Anorg. Allg. Chem., 2015, 641, 1545–1549 CrossRef CAS.
- S. Ono, H. Hayakawa and K. Nomura, Nippon Kagaku Kaishi, 1976, 11, 1700–1709 CrossRef.
- P. Kaiser and W. Jeitschko, J. Solid State Chem., 1996, 124, 346–352 CrossRef CAS.
- P. Kaiser and W. Jeitschko, Z. Anorg. Allg. Chem., 1996, 622, 53–56 CrossRef CAS.
- H. G. V. Schnering and G. Menge, J. Solid State Chem., 1979, 28, 13–19 CrossRef.
- H. Hayakawa and S. Ono, J. Less-Common Met., 1988, 144, 177–194 CrossRef CAS.
- T. Wadsten, Acta Chem. Scand., 1967, 21, 593–594 CrossRef CAS.
- T. Wadsten, Acta Chem. Scand., 1965, 19, 1232–1238 CrossRef CAS.
- J. Wolf, D. Weber and H.-G. V. Schnering, Z. Naturforschung B, 1986, 41, 731–735 Search PubMed.
- W. M. Hurng, J. D. Corbett, S. L. Wang and R. A. Jacobson, Inorg. Chem., 1987, 26, 2392–2395 CrossRef CAS.
- B. Eisenmann and H. Schäfer, Angew. Chem., Int. Ed. Engl., 1980, 19, 490–491 CrossRef.
- K. E. Woo, J. Wang, K. Wu, K. Lee, J.-A. Dolyniuk, S. Pan and K. Kovnir, Adv. Funct. Mater., 2018, 28, 1801589 CrossRef.
- K. A. Kovnir, A. V. Sobolev, I. A. Presniakov, O. I. Lebedev, G. V. Tendeloo, W. Schnelle, Y. Grin and A. V. Shevelkov, Inorg. Chem., 2005, 44, 8786–8793 CrossRef CAS PubMed.
- K. Ayouz, M. Kars, A. Rebbah and H. Rebbah, Acta Crystallogr., Sect. E: Struct. Rep. Online, 2009, 65, i15 CrossRef CAS PubMed.
- J. V. Zaikina, K. A. Kovnir, A. V. Sobolev, I. A. Presniakov, Y. Prots, M. Baitinger, W. Schnelle, A. V. Olenev, O. I. Lebedev, G. Van Tendeloo, Y. Grin and A. V. Shevelkov, Chem.–Eur. J., 2007, 13, 5090–5099 CrossRef CAS PubMed.
- B. Saparov and A. S. Sefat, J. Solid State Chem., 2012, 191, 213–219 CrossRef CAS.
- T. Wadsten, Chem. Scr., 1975, 8, 63–69 CAS.
- J. V. Zaikina, K. A. Kovnir, F. Haarmann, W. Schnelle, U. Burkhardt, H. Borrmann, U. Schwarz, Y. Grin and A. V. Shevelkov, Chem.–Eur. J., 2008, 14, 5414–5422 CrossRef CAS PubMed.
- J. V. Zaikina, K. A. Kovnir, U. Burkhardt, W. Schnelle, F. Haarmann, U. Schwarz, Y. Grin and A. V. Shevelkov, Inorg. Chem., 2009, 48, 3720–3730 CrossRef CAS PubMed.
- G. Brauer and E. Zintl, Z. Phys. Chem. B, 1937, 37, 323–352 Search PubMed.
- D. T. Cromer, Acta Crystallogr., 1959, 12, 36–41 CrossRef CAS.
- K. Lee, D. Kaseman, S. Sen, I. Hung, Z. Gan, B. Gerke, R. Pottgen, M. Feygenson, J. Neuefeind, O. I. Lebedev and K. Kovnir, J. Am. Chem. Soc., 2015, 137, 3622–3630 CrossRef CAS PubMed.
- W. Hönle, J. Buresch, K. Peters, J. H. Chang and H. G. von Schnering, Z. Kristallogr. - New Cryst. Struct., 2002, 217, 485–486 Search PubMed.
- B. Bajan and H.-J. Meyer, Z. Kristallogr. - Cryst. Mater., 1995, 210, 607 CAS.
- H. M. Artelt and G. Meyer, Z. Kristallogr. - Cryst. Mater., 1993, 206, 306–307 CAS.
- A. Pfitzner, S. Reiser and H.-J. Deiseroth, Z. Anorg. Allg. Chem., 1999, 625, 2196–2201 CrossRef CAS.
- M. Gostojić, A. Edenharter, W. Nowacki and P. Engel, Z. Kristallogr. - Cryst. Mater., 1982, 158, 43–52 CrossRef.
- M. Asbrand and B. Eisenmann, Z. Naturforschung B, 1993, 48, 452–456 CAS.
- W.-M. Hurng, E. S. Peterson and J. D. Corbett, Inorg. Chem., 1989, 28, 4177–4180 CrossRef CAS.
- J. Wang, K. Lee and K. Kovnir, J. Mater. Chem. C, 2015, 3, 9811–9818 RSC.
- J. Wang, J. T. Greenfield and K. Kovnir, J. Solid State Chem., 2016, 242, 22–27 CrossRef CAS.
- H. Yamane, S. Kikkawa and M. Koizumi, Solid State Ionics, 1987, 25, 183–191 CrossRef CAS.
- S. R. Yeandel, D. O. Scanlon and P. Goddard, J. Mater. Chem. A, 2019, 7, 3953–3961 RSC.
Footnotes |
| † Electronic supplementary information (ESI) available: Experimental details, figures, and tables pertinent to powder and single crystal X-ray diffraction, SEM/EDXS, differential scanning calorimetry results, impedance curves for Li2SiAs2. CCDC 1954349 and 1954350. For ESI and crystallographic data in CIF or other electronic format see DOI: 10.1039/c9ta11150f |
| ‡ Current Address: Jet Propulsion Laboratory, California Institute of Technology, 4800 Oak Grove Drive, Pasadena CA 91109, USA. |
| This journal is © The Royal Society of Chemistry 2020 |