Intermolecular cyclic polysulfides as cathode materials for rechargeable lithium batteries†
Fengli
Li
,
Yubing
Si
 ,
Zhongjun
Li
,
Wei
Guo
* and
Yongzhu
Fu
,
Zhongjun
Li
,
Wei
Guo
* and
Yongzhu
Fu
 *
*
College of Chemistry, Zhengzhou University, Zhengzhou 450001, P. R. China. E-mail: yfu@zzu.edu.cn; weiguo@zzu.edu.cn
First published on 25th November 2019
Abstract
An intermolecular cyclic polysulfide (ICPS) is designed, synthesized, and applied as a cathode material in rechargeable lithium batteries for the first time. Three ICPSs are formed. During discharge, they are converted to lithium 1,3-benzenedithiolate and lithium sulfide. During recharge, the starting materials are recovered. This work adds new members to the organopolysulfide family.
The development of personal electronics and electric vehicles is promoting the demand for high energy density batteries.1,2 However, current lithium-ion (Li-ion) batteries based on the lithium intercalation chemistry have limited capacities of 100–250 mA h g−1 and energy densities of 150–250 W h kg−1.3,4 Development of new electrode materials with higher capacities and energy densities is desirable.5–8 Organic electrode materials based on multielectron redox reactions have attracted intensive interest because of their high specific capacities and structural diversity.9,10 In 1988, Visco and DeJonghe employed organodisulfides as cathode materials for batteries;11 afterwards, disulfides,12,13 trisulfides,14,15 tetrasulfides,16 and polysulfides have been explored as cathode materials for rechargeable lithium batteries.17,18 Despite considerable progress being made, the study of organopolysulfides is still at an early stage.19 New materials having high capacities are still needed.
In principle, an effective strategy to increase the capacity of these materials is to embed more sulfur atoms into their molecular structure because each additional sulfur atom can store 2e− and 2Li+. In recent years, this strategy has been successfully employed in linear polysulfide compounds.20–22 However, the synthesis and application of intermolecular cyclic polysulfides (ICPSs) in batteries are rare. Many reported synthesis methods often suffer from tedious synthesis steps and complex separation processes.23,24 A facile synthesis approach is needed. Benzenedithiol (BDT) is a commercially available compound in which one thiol group can be substituted on ortho, meta, and para positions, and can serve as precursors for the synthesis of cyclic or polymeric polysulfides.25,26
In this study, ICPSs are synthesized by a facile and scalable method using 1,3-BDT and elemental sulfur as precursors. 1,3-BDT was selected because the space between two thiol groups allows additional sulfur atoms to be added. The synthesis is carried out at ambient temperature and without any catalyst. Ultrahigh performance liquid chromatography quadrupole time-of-flight mass spectrometry (UPLC-QTof-MS), elemental analysis, and Fourier-transform infrared (FTIR) and Raman spectroscopy studies are used to characterize the synthesized products. With the aid of X-ray photoelectron spectroscopy (XPS) and UPLC-QTof-MS, the discharge/recharge products are identified and the redox chemistry of ICPSs in lithium batteries is revealed.
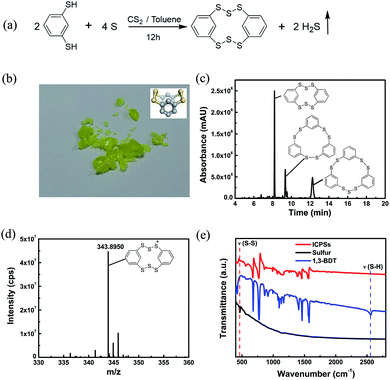
According to the reaction equation shown in Fig. 1a, the target ICPS is 2,3,4,6,7,8-hexathia-1,5(1,3)-dibenzenacyclooctaphane (HDBCO). In the synthesis, 1,3-BDT and sulfur powder were dissolved in a mixture of toluene/carbon disulfide solvents, which was stirred for 12 h to form a yellow solution (Fig. S1a†). H2S gas was detected through blackening upon exposure to lead acetate test strips (Fig. S1b†). When the solvent is removed, a green crystalline product was left behind (Fig. 1b). In HDBCO, the six intermolecular sulfur atoms and two carbon atoms on the phenyl rings form a crown structure which is stable like sulfur. HDBCO retains its structure in air for six months, as confirmed by MS analysis (Fig. S2†). The calculated S–S bond length and S–S–S angle of HDBCO are 2.07 Å and 107.4°, respectively, which are almost the same as those (S–S bond length: 2.04 Å and S–S–S angle: 107.8°) of α-sulfur.27 The coordinate of HDBCO optimized with DFT at the M062X/6-31G(d) level is shown in the ESI (Table S1†).
UPLC-QTof-MS was used to validate the composition of the synthesized sample. Fig. 1c presents the UV absorption spectrum which shows three peaks at retention times of 8.20, 9.35, and 12.25 min, indicating that three compounds are generated in the synthesis process. We extracted the ion chromatogram (XIC) of every possible generated compound. C12H8S6 appears at a retention time of 8.28 min in the XIC (Fig. S3†), which corresponds to the UV absorption peak at 8.20 min. Its m/z of 343.8950 (Fig. 1d) matches that of the positively ionized HDBCO. C18H12S6 and C18H12S7 appear at retention times of 9.43 and 12.33 min (Fig. S4a and b †), corresponding to the UV peaks at 9.35 and 12.25 min in Fig. 1c, respectively. Their MSs shown in Fig. S4c and d† match those of 2,3,5,6,8,9-hexathia-1,4,7(1,3)-tribenzenacyclononaphane (HTBCN) and 2,3,5,6,8,9,10-heptathia-1,4,7(1,3)-tribenzenacyclodecaphane (HTBCD). The elemental analysis shown in Table S2† confirms that the contents of element S and C roughly approach the calculated ones in HDBCO. Hence, UPLC-QTof-MS and elemental analysis support the successful synthesis of three ICPSs. According to the intensity of UV, the main product is HDBCO. The ratio of sulfur in the synthesis has almost no influence on the type of products. For example, when the 1,3-BDT![[thin space (1/6-em)]](https://www.rsc.org/images/entities/char_2009.gif) :
:![[thin space (1/6-em)]](https://www.rsc.org/images/entities/char_2009.gif) sulfur ratio is 1
sulfur ratio is 1![[thin space (1/6-em)]](https://www.rsc.org/images/entities/char_2009.gif) :
:![[thin space (1/6-em)]](https://www.rsc.org/images/entities/char_2009.gif) 5, the same products were obtained (Fig. S5†). Proton nuclear magnetic resonance (1H-NMR) was conducted to quantify the conversion of 1,3-BDT. Fig. S6† presents the 1H-NMR spectra of 1,3-BDT and the synthesized sample. The chemical shift of 3.423 ppm is assigned to the thiol proton in 1,3-BDT and the peaks between 7.038 and 7.189 ppm are assigned to the phenyl protons. For 1,3-BDT, the area ratio of the thiol proton: that of the phenyl protons is 2
5, the same products were obtained (Fig. S5†). Proton nuclear magnetic resonance (1H-NMR) was conducted to quantify the conversion of 1,3-BDT. Fig. S6† presents the 1H-NMR spectra of 1,3-BDT and the synthesized sample. The chemical shift of 3.423 ppm is assigned to the thiol proton in 1,3-BDT and the peaks between 7.038 and 7.189 ppm are assigned to the phenyl protons. For 1,3-BDT, the area ratio of the thiol proton: that of the phenyl protons is 2![[thin space (1/6-em)]](https://www.rsc.org/images/entities/char_2009.gif) :
:![[thin space (1/6-em)]](https://www.rsc.org/images/entities/char_2009.gif) 4. For the synthesized sample, the ratio changes to 2
4. For the synthesized sample, the ratio changes to 2![[thin space (1/6-em)]](https://www.rsc.org/images/entities/char_2009.gif) :
:![[thin space (1/6-em)]](https://www.rsc.org/images/entities/char_2009.gif) 43, indicating that 90% of 1,3-BDT is converted in the synthesis reaction.
43, indicating that 90% of 1,3-BDT is converted in the synthesis reaction.
The vibration of the formed S–S bonds in the synthesized ICPSs can be verified by FTIR and Raman spectroscopy. Fig. 1e presents the FTIR spectra of sulfur, 1,3-BDT, and ICPSs. 1,3-BDT exhibits a characteristic adsorption peak at 2565 cm−1, corresponding to the vibration of the thiol group (ν(SH)). In contrast, this peak disappears in the ICPSs due to the removal of protons and formation of S–S bonds. However, a new peak is shown at about 460 cm−1, corresponding to the vibration of S–S bonds (ν(S–S)), which can also be clearly seen in Fig. S7.† Raman spectra of ICPSs and sulfur in Fig. S8† show the characteristic absorption peaks between 400 and 550 cm−1 due to the stretching of the S–S bonds.28 The FTIR and Raman results confirm the conversion of thiol groups and the formation of S–S bonds in the ICPSs.
For convenient application in batteries, a part of the reacted solution was directly added to binder-free carbon nanotube (CNT) paper current collectors followed by the removal of the solvent to form ICPSs/CNT electrodes. X-ray diffraction (XRD) was performed on the synthesized sample. As shown in Fig. S9,† sulfur shows characteristic peaks. Upon conversion to ICPSs, no peaks can be observed, indicating almost complete conversion of sulfur to ICPSs which are amorphous. To observe the morphological details of the ICPSs in the electrode, scanning electron microscopy (SEM) was employed. From Fig. S10,† it can be seen that a gelatinous layer of the ICPSs is uniformly embedded in the CNT matrix, which allows good electronic conductivity and sufficient electrolyte penetration, thus providing a favorable environment for battery cycling.15
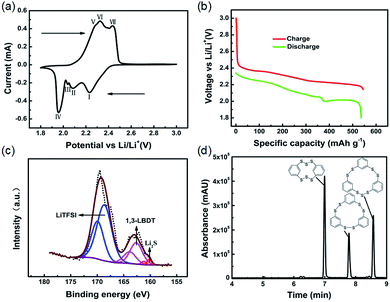
In order to study the redox reaction of the ICPSs, cyclic voltammetry (CV) was conducted. As can be seen in Fig. 2a, four reduction peaks denoting four steps are seen at 2.24, 2.08, 2.04, and 1.96 V upon the cathodic scan. These peaks result from the stepwise breakage and lithiation of the S–S bonds in the ICPSs, which is a complex process (as postulated in Scheme S1†). Overall, ICPSs mainly contain two kinds of S–S bonds. One is –Ph–S–S–S–Ph– and the other one is –Ph–S–S–Ph–. According to our previous studies, the dissociation energy of the S–S bond in CH3–S–S–CH3 is 70 kcal mol−1, whereas it is about 45 kcal mol−1 in CH3–S–S–S–CH3.14 Therefore, we believe that the S–S bond energy in –Ph–S–S–S–Ph– is smaller than that in –Ph–S–S–Ph–. In general, the bonds with low dissociation energy have priority in reduction. It is speculated that the peak at 2.24 V corresponds to the breakage and lithiation of the S–S bonds in –Ph–S–S–S–Ph–, the peak at 2.08 V corresponds to the lithiation of the S–S bonds in –Ph–S–S–Ph– and the intermediate –Ph–S–S–Li, the peak at 2.04 V corresponds to the formation of LiS–Ph–SLi, and the peak at 1.96 V corresponds to the formation of Li2S. Upon the anodic scan, three oxidation peaks at 2.28, 2.32, and 2.34 V can be observed, which are highly overlapped with each other. They correspond to the conversion of Li2S to sulfur radicals and the delithiation of LiS–Ph–SLi to form free radicals, which then combine to form ICPSs. The voltage profile shown in Fig. 2b matches the CV plots. The discharge process consists of two regions: a long voltage slope from 2.35 to 2.00 V related to the lithiation of S–S bonds in ICPSs and a flat voltage plateau at 2.00 V associated with formation of Li2S. The initial three reduction steps are continuous. In the recharge process, three continuous voltage regions can be observed.
To investigate the chemical transformations of ICPSs in the battery, XPS was conducted to identify sulfur species in the discharged electrode. As shown in Fig. 2c, three kinds of sulfur species can be observed. The strongest peak of S 2p3/2 at 168.8 eV corresponds to the sulfur in LiTFSI in the electrolyte.29 The weakest peaks centered at 160.2 and 161.4 eV are ascribed to S 2p1/2 and 2p3/2 of Li2S, respectively.30 The middle peak of S 2p3/2 at 162.6 eV can be assigned to sulfur in lithium 1,3-benzenedithiolate (1,3-LBDT). UPLC-QTof-MS of the discharged electrode was also performed. Fig. S11† shows the XIC and MS of the discharged sample. The intense peak at 1.43 min with an m/z of 141.9911 can be assigned to the positively ionized 1,3-BDT, which is the form of 1,3-LBDT in MS analysis. The XPS and UPLC-QTof-MS results both confirm that three ICPSs are converted to 1,3-LBDT and Li2S as the discharge products.
UPLC-QTof-MS was performed to identify the recharge products of 1,3-LBDT and Li2S. Fig. 2d presents the UV absorption spectrum of the recharged sample where three peaks can be observed. The corresponding XIC and their MS are shown in Fig. S12.† HDBCO appears at 6.99 min in the UV spectrum, which corresponds to the XIC peak at 7.05 min (shown in Fig. S12a†). Its m/z of 343.8950 (shown in Fig. S12b†) matches that of the positively ionized HDBCO. HTBCN appears at 7.78 min in the UV spectrum, which corresponds to the XIC peak at 7.85 min (shown in Fig. S12c†). Its m/z of 419.9263 (shown in Fig. S12d†) matches that of the positively ionized HTBCN. HTBCD appears at 8.57 min in the UV spectrum, which corresponds to the XIC peak at 8.63 min (shown in Fig. S12e†). Its m/z of 451.8984 (shown in Fig. S12f†) matches that of the positively ionized HTBCD. Evidenced by the UPLC-QTof-MS results, three ICPSs are recovered during recharge of 1,3-LBDT and Li2S in lithium cells.
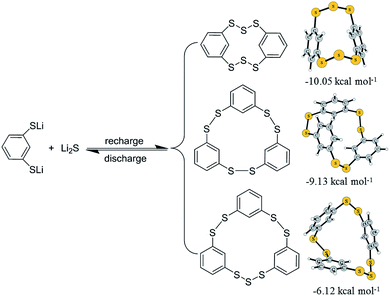
From the above analysis, the redox chemistry of ICPSs in lithium batteries is revealed. As shown in Scheme 1, in the discharge process, ICPSs are lithiated to form 1,3-LBDT and Li2S. In the following recharge process, three ICPSs are recovered. The radicals randomly generated from the delithiation of 1,3-LBDT and Li2S are instantaneously combined to form structures that are energetically favorable in the recharge process. The three recharge products are further optimized at the DFT/M06-2X/6-31G(d) level. The possible mechanism begins with the barrierless formation of HDBCO from two 1,3-benzenedithiolates and two sulfur radicals with the release of 10.05 kcal mol−1. Similarly, the other two ICPSs can be formed with three 1,3-benzenedithiolates radicals and three 1,3-benzenedithiolates radicals with a sulfur radical releasing 6.12 and 9.13 kcal mol−1, respectively. The calculation result confirms that HDBCO is the most stable and the easiest to form among the three ICPSs.
 | ||
| Scheme 1 Redox reactions of ICPSs during battery cycling. The right panel shows the reaction pathways of 1,3-BDT radicals and sulfur radicals to form the related products. | ||
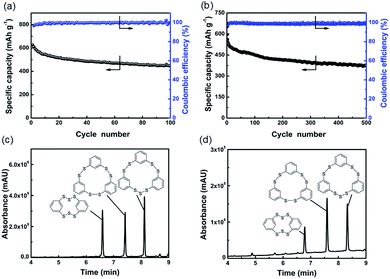
Fig. 3a presents the cycling performance of the cell at C/10 rate (1C = 623.4 mA g−1). It can deliver an ultrahigh initial specific capacity of 625.0 mA h g−1. Until 100 cycles, the cell also can exhibit a specific capacity of 445.8 mA h g−1, corresponding to 71.3% of the initial capacity. The coulombic efficiencies are close to 100% for most cycles. When the rate increases to 1C, the cell can deliver an initial specific capacity of 596.1 mA h g−1 as shown in Fig. 3b. The cell remains stable over 500 cycles and the capacity retention rate is 63.4%. The coulombic efficiency of the cell is near 99% in all the cycles. It is suggested that these polysulfides possess fast reaction kinetics and can be used efficiently in rechargeable lithium cells. In order to investigate the reversibility of ICPSs in lithium batteries, the voltage profiles in different cycles were collected, as shown in Fig. S13.† The curves are overlapped except the capacity decays, which evidences the reversibility of ICPSs in lithium batteries. Meanwhile, UPLC-QTof-MS spectra of recharged electrodes after the 50th and 100th cycles were recorded. As shown in Fig. 3c and d, three peaks resulting from the absorption of three ICPSs can be seen. Over cycling, HDBCO is continuously reduced, meaning some sulfur is lost when recharged. The reason could be the insulating and insoluble Li2S formed during the discharge, which is difficult to be converted back to sulfur in the structure of HDBCO. In addition, the environment in the lithium cell may not be suitable for the formation of HDBCO. The rate performance of a cell is shown in Fig. S14.† The cell shows discharge capacities of 543.9, 471.2, 278.8, and 140.2 mA h g−1 at C/2, 1C, 3C, and 5C, respectively.
In summary, we have synthesized an ICPS through a facile condensation reaction of 1,3-benzenedithiol with elemental sulfur. UPLC-QTof-MS, elemental analysis, FTIR, Raman, and XRD were used to confirm the successful synthesis of three ICPSs in which HDBCO is the main product. The ICPSs were evaluated in Li half cells. In the discharge process, they are converted to 1,3-LBDT and Li2S. In the recharge process, three ICPSs are recovered. Over cycling, HDBCO is continuously reduced. The cell can deliver an initial specific capacity of 625.0 mA h g−1 and retains 72.9% of the initial capacity over 100 cycles at C/10 rate. Even at 1C rate, it exhibits an initial specific capacity of 596.1 mA h g−1 and retains 63.4% of the initial capacity over 500 cycles. This work reports the first ICPSs and reveals their intriguing redox processes in rechargeable lithium batteries.
Conflicts of interest
There are no conflicts to declare.Acknowledgements
This work was supported by the National Natural Science Foundation of China (Grant No. 21975225 and 51902293), the Recruitment Program of Global Youth Experts in China, and Zhengzhou University.Notes and references
- M. Armand and J.-M. Tarascon, Nature, 2008, 451, 652–657 CrossRef CAS PubMed.
- P. G. Bruce, B. Scrosati and J.-M. Tarascon, Angew. Chem., Int. Ed., 2008, 47, 2930–2946 CrossRef CAS PubMed.
- J. B. Goodenough and Y. Kim, Chem. Mater., 2010, 22, 587–603 CrossRef CAS.
- A. Manthiram, J. Phys. Chem. Lett., 2011, 2, 176–184 CrossRef CAS.
- Z. Song and H. Zhou, Energy Environ. Sci., 2013, 6, 2280–2301 RSC.
- M. Liu, Y. Liu, Y. Yan, F. Wang, J. Liu and T. Liu, Chem. Commun., 2017, 53, 9097–9100 RSC.
- M. Liu, Q. Meng, Z. Yang, X. Zhao and T. Liu, Chem. Commun., 2018, 54, 5090–5093 RSC.
- Y. Liu, Y. Yan, K. Li, Y. Yu, Q. Wang and M. Liu, Chem. Commun., 2019, 55, 1084–1087 RSC.
- Y. Liang, Z. Tao and J. Chen, Adv. Energy Mater., 2012, 2, 742–769 CrossRef CAS.
- W. Guo and Y. Fu, Energy Environ. Mater., 2018, 1, 20–27 CrossRef CAS.
- S. J. Visco and L. C. DeJonghe, J. Electrochem. Soc., 1988, 135, 2905–2909 CrossRef CAS.
- H. Tsutsumi, K. Okada, K. Fujita and T. Oishi, J. Power Sources, 1997, 68, 735–738 CrossRef CAS.
- S. Deng, L. Kong, G. Hu, T. Wu, D. Li, Y. Zhou and Z. Li, Electrochim. Acta, 2006, 51, 2589–2593 CrossRef CAS.
- M. Wu, Y. Cui, A. Bhargav, Y. Losovyj, A. Siegel, M. Agarwal, Y. Ma and Y. Fu, Angew. Chem., Int. Ed., 2016, 55, 10027–10031 CrossRef CAS PubMed.
- M. Wu, A. Bhargav, Y. Cui, A. Siegel, M. Agarwal, Y. Ma and Y. Fu, ACS Energy Lett., 2016, 1, 1221–1226 CrossRef CAS.
- W. Guo, Z. D. Wawrzyniakowski, M. M. Cerda, A. Bhargav, M. D. Pluth, Y. Ma and Y. Fu, Chem.–Eur. J., 2017, 23, 16941–16947 CrossRef CAS PubMed.
- A. Bhargav, Y. Ma, K. Shashikala, Y. Cui, Y. Losovyj and Y. Fu, J. Mater. Chem. A, 2017, 5, 25005–25013 RSC.
- A. Bhargav, M. E. Bell, J. Karty, Y. Cui and Y. Fu, ACS Appl. Mater. Interfaces, 2018, 10, 21084–21090 CrossRef CAS PubMed.
- J. Liu, M. Wang, N. Xu, T. Qian and C. Yan, Energy Storage Materials, 2018, 15, 53–64 CrossRef.
- R. Steudel, Chem. Rev., 2002, 102, 3905–3945 CrossRef CAS PubMed.
- G. G. Rodríguez-Calero, S. Conte, M. A. Lowe, J. Gao, Y. Kiya, J. C. Henderson and H. D. Abruña, Electrochim. Acta, 2015, 167, 55–60 CrossRef.
- Y. Cui, J. D. Ackerson, Y. Ma, A. Bhargav, J. A. Karty, W. Guo, L. Zhu and Y. Fu, Adv. Funct. Mater., 2018, 28, 1801791 CrossRef.
- Z. Jin, H. Zhong, S. Li and Z. Li, J. Appl. Electrochem., 2013, 43, 783–788 CrossRef CAS.
- A. Alam, M. Kon-no, S. Ogawa and R. Sato, Tetrahedron, 2006, 63, 927–933 CrossRef.
- A. Bhargav, M. E. Bell, Y. Cui and Y. Fu, ACS Appl. Energy Mater., 2018, 1, 5859–5864 CrossRef.
- F. Li, Y. Si, B. Liu, Z. Li and Y. Fu, Adv. Funct. Mater., 2019, 1902223 CrossRef.
- N. Greenwood and A. Earnshaw, Chemistry of Elements, ELSEVIER, Oxford, 1997 Search PubMed.
- I. a. Gomez, O. Leonet, J. A. Blazquez, H.-J. r. Grande and D. Mecerreyes, ACS Macro Lett., 2018, 7, 419–424 CrossRef CAS.
- D. Wang, Y. Si, J. Li and Y. Fu, J. Mater. Chem. A, 2019, 7, 7423–7429 RSC.
- Y. Fu, C. Zu and A. Manthiram, J. Am. Chem. Soc., 2013, 135, 18044–18047 CrossRef CAS PubMed.
Footnote |
| † Electronic supplementary information (ESI) available. See DOI: 10.1039/c9ta10611a |
| This journal is © The Royal Society of Chemistry 2020 |


