
 Open Access Article
 This Open Access Article is licensed under a Creative Commons Attribution-Non Commercial 3.0 Unported Licence
MOF thin films with bi-aromatic linkers grown by molecular layer deposition
Kristian Blindheim
Lausund
 *a,
Malin Solheim
Olsen
ab,
Per-Anders
Hansen
a,
Håkon
Valen
b and
Ola
Nilsen
*a
*a,
Malin Solheim
Olsen
ab,
Per-Anders
Hansen
a,
Håkon
Valen
b and
Ola
Nilsen
*a
aCentre for Materials Science and Nanotechnology, Department of Chemistry, University of Oslo, Postboks 1033, Blindern, 0315 Oslo, Norway. E-mail: ola.nilsen@kjemi.uio.no
bNordic Institute of Dental Materials, Sognsveien 70 A, 0855 Oslo, Norway
First published on 13th January 2020
Abstract
Thin films of metal–organic frameworks (MOFs) are promising for a wide range of applications including membranes for separations and sensor materials in microelectronics. Growth of such thin films using atomic/molecular layer deposition (ALD/MLD) has recently been demonstrated; however, the range of examples is still narrow. Here, we expand the repertory of gas-phase MOF thin film synthesis by ALD/MLD to include 2,6-naphthalenedicarboxylate (2,6-NDC) and biphenyl-4,4′-dicarboxylate (BP-4,4′-DC) as organic linkers. The films, which were deposited using ZrCl4 and either H2–2,6-NDC or H2–BP-4,4′-DC, were amorphous and formed crystalline MOF-structures when treated with acetic acid vapour at 160 °C. The film growth was investigated using in situ quartz crystal microbalance (QCM) measurements, and was in addition characterized using spectroscopic ellipsometry (SE), photoluminescence (PL), scanning electron microscopy (SEM), grazing incidence X-ray diffraction (GIXRD) and X-ray reflectivity (XRR). We further performed introductory investigations into a selection of possible future applications of these films, due to their porosity, luminescent and antibacterial properties. Expanding the repertory of MOF synthesis by ALD/MLD to include longer linkers such as 2,6-NDC and BP-4,4′-DC enables synthesis of thin films with a larger range of pore sizes.
Introduction
Metal–organic frameworks (MOFs) are a class of porous materials based on inorganic metal clusters bound together by organic molecules called linkers. Such frameworks may result in very large porosities and exceptional pore size control when formed in the crystalline state. Their pore size is typically in the range of ca. 1 nm.The very high porosity of MOFs is useful for a wide range of applications, including membranes for separations or desalination,1,2 catalysis,3–5 destruction of toxins,6–9 gas storage,10–12 and drug delivery.13 MOFs are typically produced as powders by hydrothermal synthesis while thin film formations are less common. As reported by Allendorf et al.,14 achieving thin films of MOF materials will lead to new types of sensor materials and pave the way for better low-κ dielectrics in microelectronics.
Atomic layer deposition (ALD) is a thin film deposition technique where two or more precursors are sequentially pulsed into a reaction chamber through the gas phase.15 A precursor is allowed to react with and saturate the surface of the substrates before excess reactants are removed by an inert gas purge. The growth continues by pulsing of a second precursor into the reaction chamber, allowing it to react to saturation with the previous surface. After a new purge step, the process is repeated in a cyclic manner until the desired thickness is obtained. Due to the self-limiting growth with every pulse, only up to one monolayer of each precursor is added to the substrates with every pulse. When the precursors are larger organic molecules that become a part of the film, it has become common to refer to the process as molecular layer deposition (MLD),16 which is the case in our study.
The MLD technique can be used to make organic films or hybrid organic–inorganic films for use in a wide range of applications that are summarized in a review article by Meng et al.17 A few examples of MOF thin-films made by using MLD have emerged in the recent literature,18–21 such as the demonstration of UiO-66 growth,22 and growth of a similar MOF structure with an amino-functionalized linker.23
In the current work, we expand the repertory of MLD synthesis of Zr MOFs to also include 2,6-naphthalenedicarboxylate (2,6-NDC) and biphenyl-4,4′-dicarboxylate (BP-4,4′-DC) as linkers. This may enable synthesis of thin-films of MOF-structures with slightly larger pores than those previously reported. 2,6-NDC and BP-4,4′-DC themselves also have interesting properties such as a high near-UV absorbance, which is beneficial for luminescence, and certain types of antibacterial properties such as antibacterial photodynamic therapy. In this work, we explore the luminescent and antibacterial properties of the films for possible use as luminescent sensors or antibacterial surfaces. The global increase in antimicrobial resistance and infections related to bacterial adhesion and subsequent biofilm formation on medical devices pose a huge financial burden and are associated with increased mortality.24,25 In addition to a reported increase in antimicrobial resistance, bacteria biofilms are inherently more tolerant to antibiotics as compared to their free-floating, planktonic counterparts.26 It is therefore vital to develop methods to eradicate adhered bacteria and biofilms on medical devices with a lower selection for development of antibacterial resistance than the traditional use of antibiotics. Antibacterial photodynamic therapy is one such method suggested to have a lower risk of antibacterial resistance development.27
Experimental
Atomic/molecular layer deposition
An F-120 Sat-type ALD reactor (ASM Microchemistry Ltd) was used to deposit films by ALD/MLD. The precursors used were ZrCl4 (Merck Schuchardt OHG >98% or Sigma-Aldrich ≥99.9%), 2,6-naphthalenedicarboxylic acid (Sigma-Aldrich 99%), and biphenyl-4,4′-dicarboxylic acid (Sigma-Aldrich 97%). Acetic acid (Merck KGaA 100%) was used as a modulator in selected depositions and was pulsed after the organic acid precursor. Acetic acid from the same producer and of the same quality was also used in the crystallization of the films. N2 (AGA 99.999%) was used both as the carrier gas and for purging. A total flow of ca. 500 sccm (standard cubic centimetres per minute) of N2 was used throughout the experiments, leading to a background pressure of ca. 5 mbar. The precursors were heated to 165 °C (for ZrCl4), 225 °C (for H2–2,6-NDC), and 250 °C (for H2–BP-4,4′-DC) to reach sufficient sublimation. Acetic acid was kept at room temperature in an external container. The substrates were mostly 2 × 2 cm2 pre-cleaned Si(100) and were wiped with dust-free wipes, and otherwise used as received. Their native oxide thickness was measured by spectroscopic ellipsometry (SE) before deposition, and subtracted from the measured amount when the film thickness was determined after the depositions.In situ quartz crystal microbalance (QCM)
In situ QCM analyses were conducted using two 6 MHz AT-cut quartz crystals. These crystals were mounted ca. 5 cm apart in a homemade holder, and were used to monitor the mass increase during the deposition. Their separation reveals any delays in the saturation along the length of the reaction chamber. The signal was recorded using a Colnatec Eon-LT and processed by averaging over 16 consecutive ALD/MLD cycles. This signal was subsequently converted from a change in frequency (−ΔHz) to deposited mass in ng cm−2 by calibrating the sensitivity of each sensor. Thickness and density data measured by XRR on films deposited separately from the QCM measurements were used for this calibration. Variations in sensitivity of the sensors over time were also corrected for by repeating a standard sequence throughout the experiment and normalizing the results to this standard. The temperature was stabilized for 3 hours before any experiments were conducted in order to ensure a reliable response from the QCM-crystals. This setup was also used for a porosity test where the QCM detectors measured the amount of water that was absorbed in the porous films.Post-deposition treatment
A selection of the films was exposed to moisture for 24 hours to investigate its effects on the films. The relative humidity was maintained at ca. 75% through use of a saturated NaCl solution in the chamber. Crystallization of the films was performed by heating the samples to 160 °C for 24 hours in a sealed autoclave with an internal volume of 35 mL with approximately 0.1 mL of acetic acid added. Some films were submerged in a physiological saline solution (0.9% (w/v) NaCl) in order to investigate their stability in this environment. This is the same solution that was used as the solvent in the antibacterial assay.Characterization of the films
The thickness and refractive index of each film were measured by spectroscopic ellipsometry (SE). SE data were collected with a J. A. Woollam alpha-SE spectroscopic ellipsometer with a wavelength range of 390–900 nm. These data were modelled to a Cauchy-function using CompleteEASE software in order to determine the thicknesses and refractive indices (at λ = 632.8 nm) for all films. In addition, a VASE spectroscopic ellipsometer with a 270–1000 nm range, also from J. A. Woollam, was used for selected samples to investigate the UV absorption. The absorption coefficients of these films were modelled with a general oscillator model consisting of several Gaussian peaks. Photoluminescence (PL) and photoluminescence excitation (PLE) measurements were performed using a 280 nm diode and/or an Edinburgh Instruments FLS920 fluorescence spectrometer with a 450 W Xe lamp as excitation sources, respectively, and a USB2000+ spectrometer from Ocean Optics. Light-induced degradation of the luminescence was carried out using the 280 nm diode and the same spectrometer. Grazing incidence X-ray diffraction (GIXRD) and X-ray reflectivity (XRR) analyses were performed using a PANalytical Empyrean diffractometer. This diffractometer was equipped with a Cu Kα source powered at 45 kV/40 mA (λ = 1.5406 Å), a parallel beam X-ray mirror and a proportional point detector (PW 3011/20). An incident angle of ω = 0.30° was used for GIXRD, and for XRR analysis 2θ was scanned from 0.08° to 6°. The XRR results were analysed using X'Pert Reflectivity software provided by PANalytical. A HITACHI SU8230 scanning electron microscope (SEM) with a cold cathode field emission type electron gun was used to obtain SEM images of the samples. The working distance was approximately 2 mm, and the acceleration voltage was typically 1 kV with a beam current of 10 μA.Antibacterial properties
Stock cultures of Enterococcus faecalis OGRF1 (ATCC 47077) were stored at −80 °C in Brain Heart Infusion (BHI, Oxoid Ltd, Basingstoke, UK) supplemented with 30% glycerol. For the antibacterial assay, fresh cultures were prepared by growing E. faecalis overnight (ON) for 16 hours at 37 °C and 100% humidity under normal atmospheric conditions supplemented with 5% CO2.The ON cultures were centrifuged at 5000g for 5 minutes and resuspended in 0.9% (w/v) saline solution (Milli-Q) to an optical density of 1.0 at 600 nm using a spectrophotometer (Thermo Scientific Spectronic 200E spectrometer). The bacterial suspension was then diluted 1![[thin space (1/6-em)]](https://www.rsc.org/images/entities/char_2009.gif) :10 in 0.9% (w/v) saline solution to achieve a desired bacterial concentration of approximately 6 × 10⁷ CFU mL−1 (CFU = colony-forming units). Zr–2,6-NDC and Zr–BP-4,4′-DC films deposited on microscope cover glasses (ø = 20 mm, VWR) and uncoated cover glass controls were placed in culture plate wells (12-well, flat bottom, Costar, Corning Inc., Kennebunk, ME, USA). 1 mL of the diluted bacterial suspension was transferred to each well and the samples were incubated for 90 minutes (37 °C, 100% humidity, 5% CO2). Half of the samples were irradiated with UVA light with a spectrum shown by Bergh et al.28 for 30 min with a light dose of 12.2 J cm−2 using a Polylux-PT Dreve light box. The samples were placed back in the incubation cabinet and left for 30 minutes to ensure dark reactions. The samples were removed from the wells and transferred to 50 mL Falcon tubes containing 5 mL glass beads 3 mm in diameter (Merck) and 5 mL of 0.9% (w/v) saline and vortexed for 30 s before serial dilution and plating on BHI agar followed by incubation at 37 °C, 100% humidity, and 5% CO2 ON.
:10 in 0.9% (w/v) saline solution to achieve a desired bacterial concentration of approximately 6 × 10⁷ CFU mL−1 (CFU = colony-forming units). Zr–2,6-NDC and Zr–BP-4,4′-DC films deposited on microscope cover glasses (ø = 20 mm, VWR) and uncoated cover glass controls were placed in culture plate wells (12-well, flat bottom, Costar, Corning Inc., Kennebunk, ME, USA). 1 mL of the diluted bacterial suspension was transferred to each well and the samples were incubated for 90 minutes (37 °C, 100% humidity, 5% CO2). Half of the samples were irradiated with UVA light with a spectrum shown by Bergh et al.28 for 30 min with a light dose of 12.2 J cm−2 using a Polylux-PT Dreve light box. The samples were placed back in the incubation cabinet and left for 30 minutes to ensure dark reactions. The samples were removed from the wells and transferred to 50 mL Falcon tubes containing 5 mL glass beads 3 mm in diameter (Merck) and 5 mL of 0.9% (w/v) saline and vortexed for 30 s before serial dilution and plating on BHI agar followed by incubation at 37 °C, 100% humidity, and 5% CO2 ON.
Statistics
The antibacterial properties of the materials were analysed using One Way Anova followed by Tukey's multiple comparison test. The significance level was set to 0.05.Results and discussion
Deposition of hybrid films without modulation
The growth of the films deposited with ZrCl4 and either H2–2,6-NDC or H2–BP-4,4′-DC was initially investigated using the in situ QCM technique. A standard pulse and purge sequence with a 3 s ZrCl4 pulse, 2 s purge, 20 s H2–2,6-NDC/H2–BP-4,4′-DC pulse and 2 s purge (3–2–20–2 s) with a reaction temperature of 290 °C was chosen after some preliminary testing. Based on this standard sequence, the individual parameters were varied to find the growth rate as a function of pulse and purge lengths in both deposition systems (Fig. 1). From this, we can see that the growth is self-terminating. We also find that ZrCl4 saturates the surface after roughly 3 seconds in both cases, whereas the organic precursors reach saturation only after 15–20 seconds.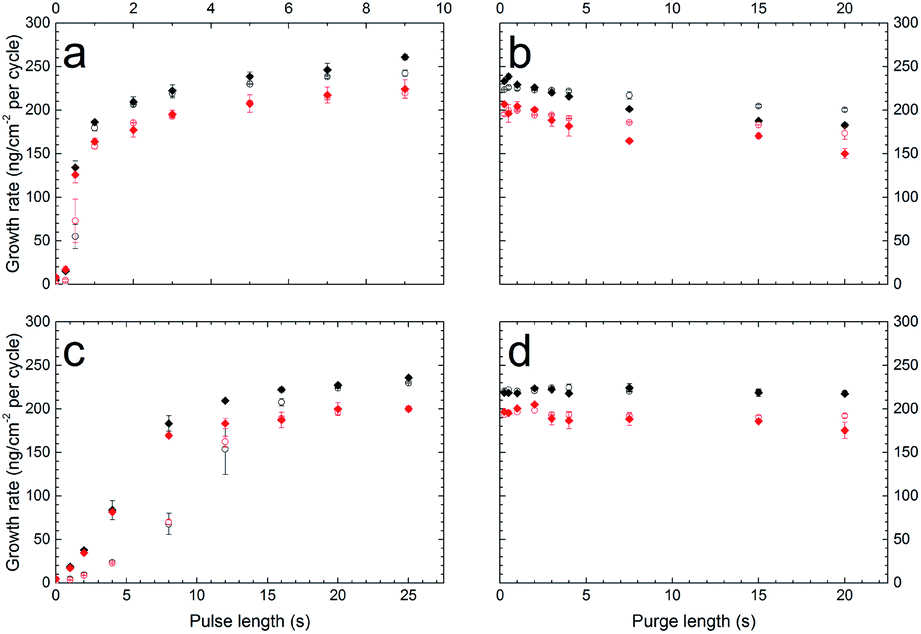 | ||
| Fig. 1 Test of self-saturating growth. The growth rate as a function of pulse and purge lengths as measured by the QCM technique for Zr–2,6-NDC (red) and Zr–BP-4,4′-DC (black). A standard pulsing sequence of 3 s ZrCl4 pulse, 2 s purge, 20 s H2–2,6-NDC or H2–BP-4,4′-DC pulse, and 2 s purge was used, and the parameters were varied individually. The parameters that are varied are (a) the ZrCl4 pulse length, (b) the ZrCl4 purge length, (c) the H2–2,6-NDC or H2–BP-4,4′-DC pulse length and (d) the H2–2,6-NDC or H2–BP-4,4′-DC purge length. Two sensors were used, one in the front of the reaction chamber (solid diamonds) and one in the back (open circles), situated ca. 5 cm apart. The data points show the average of two replicates of the experiment, and the error bars show the spread of these replicates. | ||
This is a relatively slow saturation compared to common ALD precursors, and can be due to slow surface kinetics due to steric hindrance by the bulky organic molecules, as illustrated for the H2–2,6-NDC molecule in Fig. 2, or due to a low vapour pressure of the organic acids.
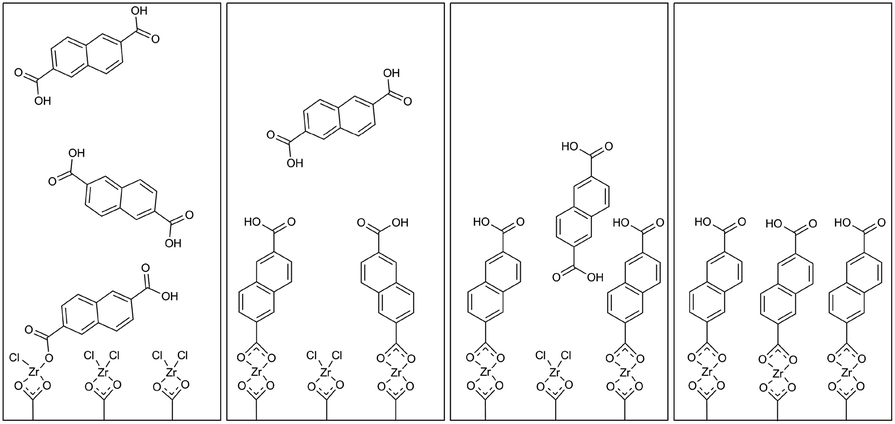 | ||
| Fig. 2 Illustration of 2,6-NDC saturation. From left to right, the images show four possible stages in the saturation process for one segment of the surface of the substrate. The relatively large 2,6-NDC-molecules may initially block the neighbouring binding sites causing saturation to take longer. | ||
The latter can be overcome by increasing the temperature of the precursors, however, this also raises the risk of degrading the precursors, particularly for complex organic structures.
There is a clear delayed saturation along the flow direction of the reaction chamber for the H2–2,6-NDC pulse. The difference in saturation times for the two QCM crystals situated 5 cm apart is roughly 5 seconds. This delay indicates that only a small amount of organic precursor is able to reaches the second crystal before the first crystal is saturated. This indicates that a low vapour pressure of the organic acids is a more important factor for the slow saturation than surface kinetics. If slow surface kinetics was the only factor, some gaseous acid molecules would travel past the first crystal and react on the second crystal even before full saturation was reached on the first crystal. However, this does not rule out slow surface kinetics.
Prior experience within our research group has shown that the 2,6-NDC linkers saturate the surface roughly 3–4 times faster when used in combination with lanthanide thd-compounds (thd = 2,2,6,6-tetramethyl-3,5-heptanedione), while providing a third of the growth rate. The large thd-ligands lead to a larger spacing between the binding sites on the surface, and less steric hindrance between the ligand molecules during saturation.
The slow saturation of the linkers can also be seen in Fig. 3 where the mass increase during one cycle with the 3–2–20–2 s pulse and purge sequence is shown for both Zr–2,6-NDC and Zr–BP-4,4′-DC. This figure, combined with the graphs in Fig. 1, shows that we have self-saturating growth with a stepwise mass increase with every pulse of the precursors, provided that the pulses are sufficiently long.
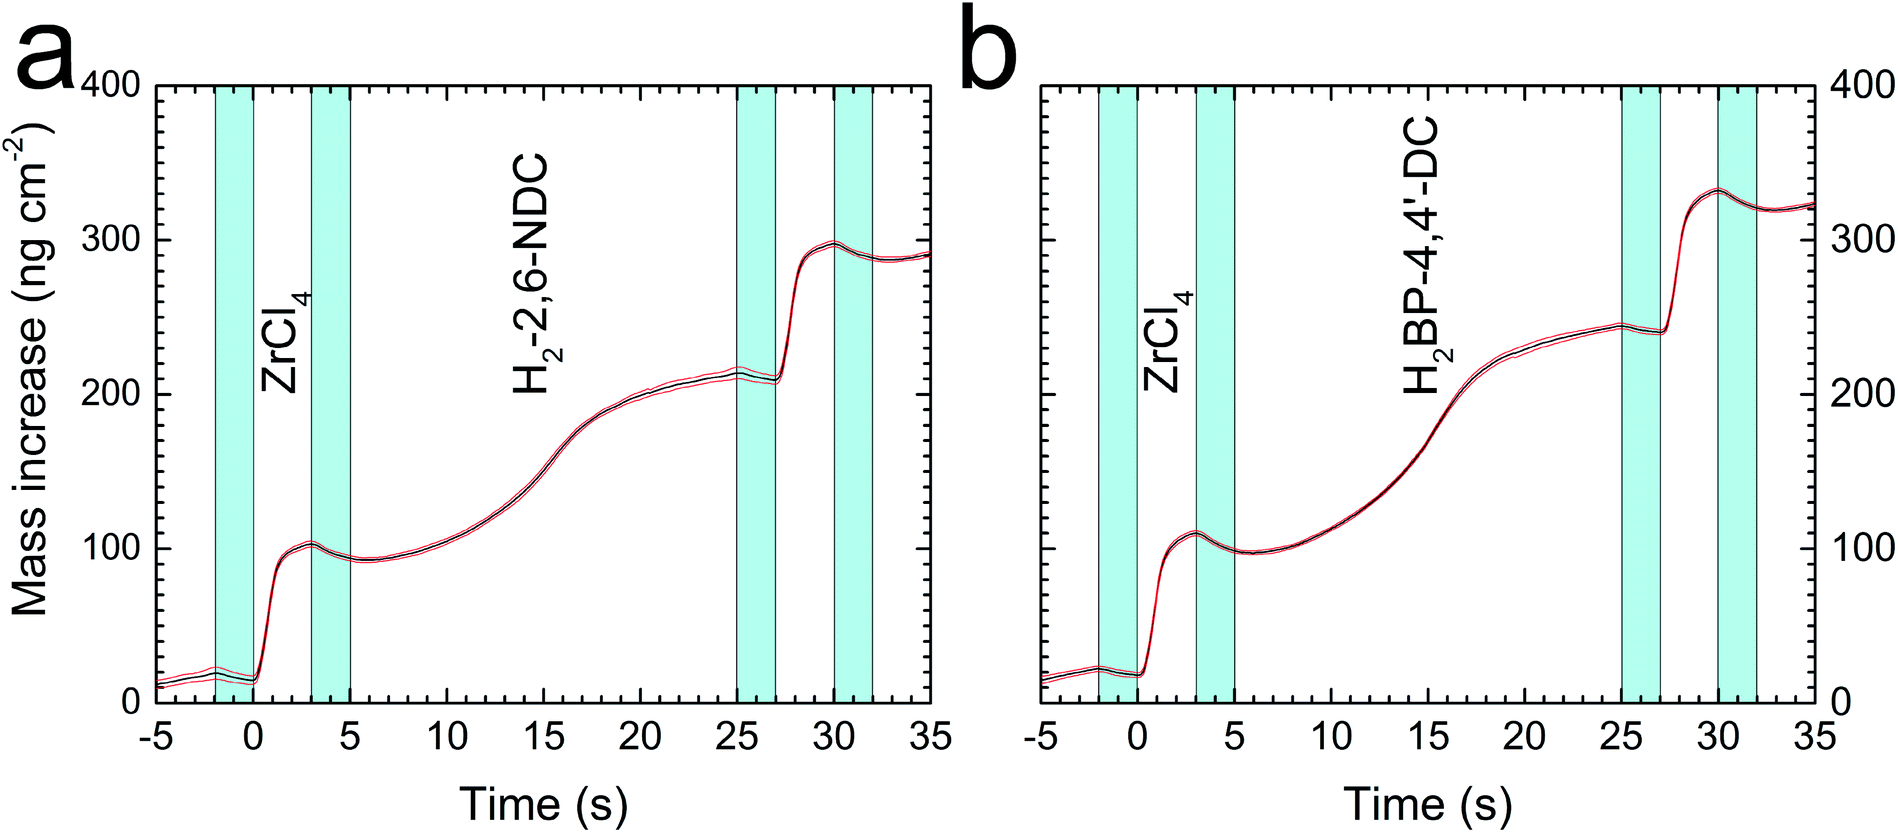 | ||
| Fig. 3 Quartz crystal microbalance characterization. Mass increase during one MLD cycle of (a) the Zr–2,6-NDC processes and (b) the Zr–BP-4,4′-DC process, as measured by the in situ quartz crystal microbalance (QCM) technique in the back of the reaction chamber. One ZrCl4 pulse and one acid pulse are labelled in both cases, and the pulses are separated by inert gas purge steps that are coloured in blue. The red lines show the standard deviations for the QCM data (n = 16). | ||
In addition to QCM investigations, the effect of the reaction temperature on the growth rates was mapped by measuring the thickness of films deposited at various temperatures (Fig. 4). For Zr–2,6-NDC, the growth rate is stable at around 8 Å per cycle at temperatures below ca. 350 °C, and decreases at higher reaction temperatures. This indicates that there is an ALD window for this process. An ALD window is not seen for the Zr–BP-4,4′-DC process where the growth rate steadily decreases with increasing temperatures. Not surprisingly, the growth rate is generally larger for the Zr–BP-4,4′-DC films than the Zr–2,6-NDC films since the H2–BP-4,4′-DC molecules are longer. The error bars in Fig. 4 indicate the standard deviation within each sample and are mostly due to a small thickness gradient along the length of the reaction chamber. The origin of this thickness gradient is most probably related to the formation of HCl as a by-product during the reaction.
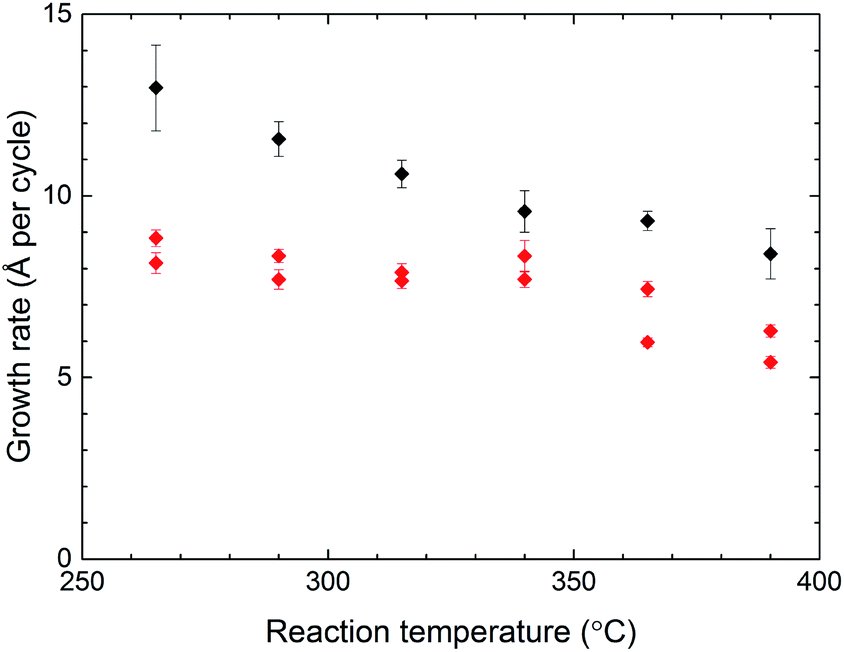 | ||
| Fig. 4 Growth rate vs. reaction temperature. The growth rates for Zr–2,6-NDC (red) and Zr–BP-4,4-DC (black) as a function of the reaction temperature, measured by spectroscopic ellipsometry (SE). The error bars indicate the standard deviation from measuring a total of nine points on the substrates from each deposition. The experiment series for Zr–2,6-NDC was repeated twice. | ||
Deposition of hybrid films with acetic acid modulation
Similarly to our previous work,22 some of the films were exposed to moist air with a relative humidity of 75% at room temperature for 24 hours. Previously, when 1,4-benzenedicarboxylic acid (1,4-BDC) was used as a precursor, we have seen that this can cause some of the 1,4-BDC to crystallize on the surface, indicating that there is an excess of linker molecules in the films. This excess amount of linker was avoided when acetic acid modulation was introduced to the ALD deposition as a 2 s acetic acid pulse and a 10 s purge following the purge after the organic acid pulse.In the current case, where H2–2,6-NDC was the organic precursor, there was no crystallization of the precursor on the surface after exposure to moist air (Fig. 5a). This is similar to what was found for films deposited with 2-amino-1,4-BDC,23 and indicates that the acetic acid modulation is not needed in this system. However, this is not completely true. When the films were submerged in an aqueous solution of 0.9% NaCl for 2.5 hours, the surface of the non-modulated film became rough and the GIXRD data show a couple of small peaks that correspond to crystalline H2–2,6-NDC.29 The acetic acid modulated film was still flat, and did not show crystalline H2–2,6-NDC on the surface after exposure to this saline solution (Fig. 5b). This indicates that the modulation still plays a role. The acetic acid molecules seem to aid the binding process of 2,6-NDC to Zr, thereby correcting the stoichiometry. In other words, modulation can be an advantage, particularly when applications require exposure to liquid water.
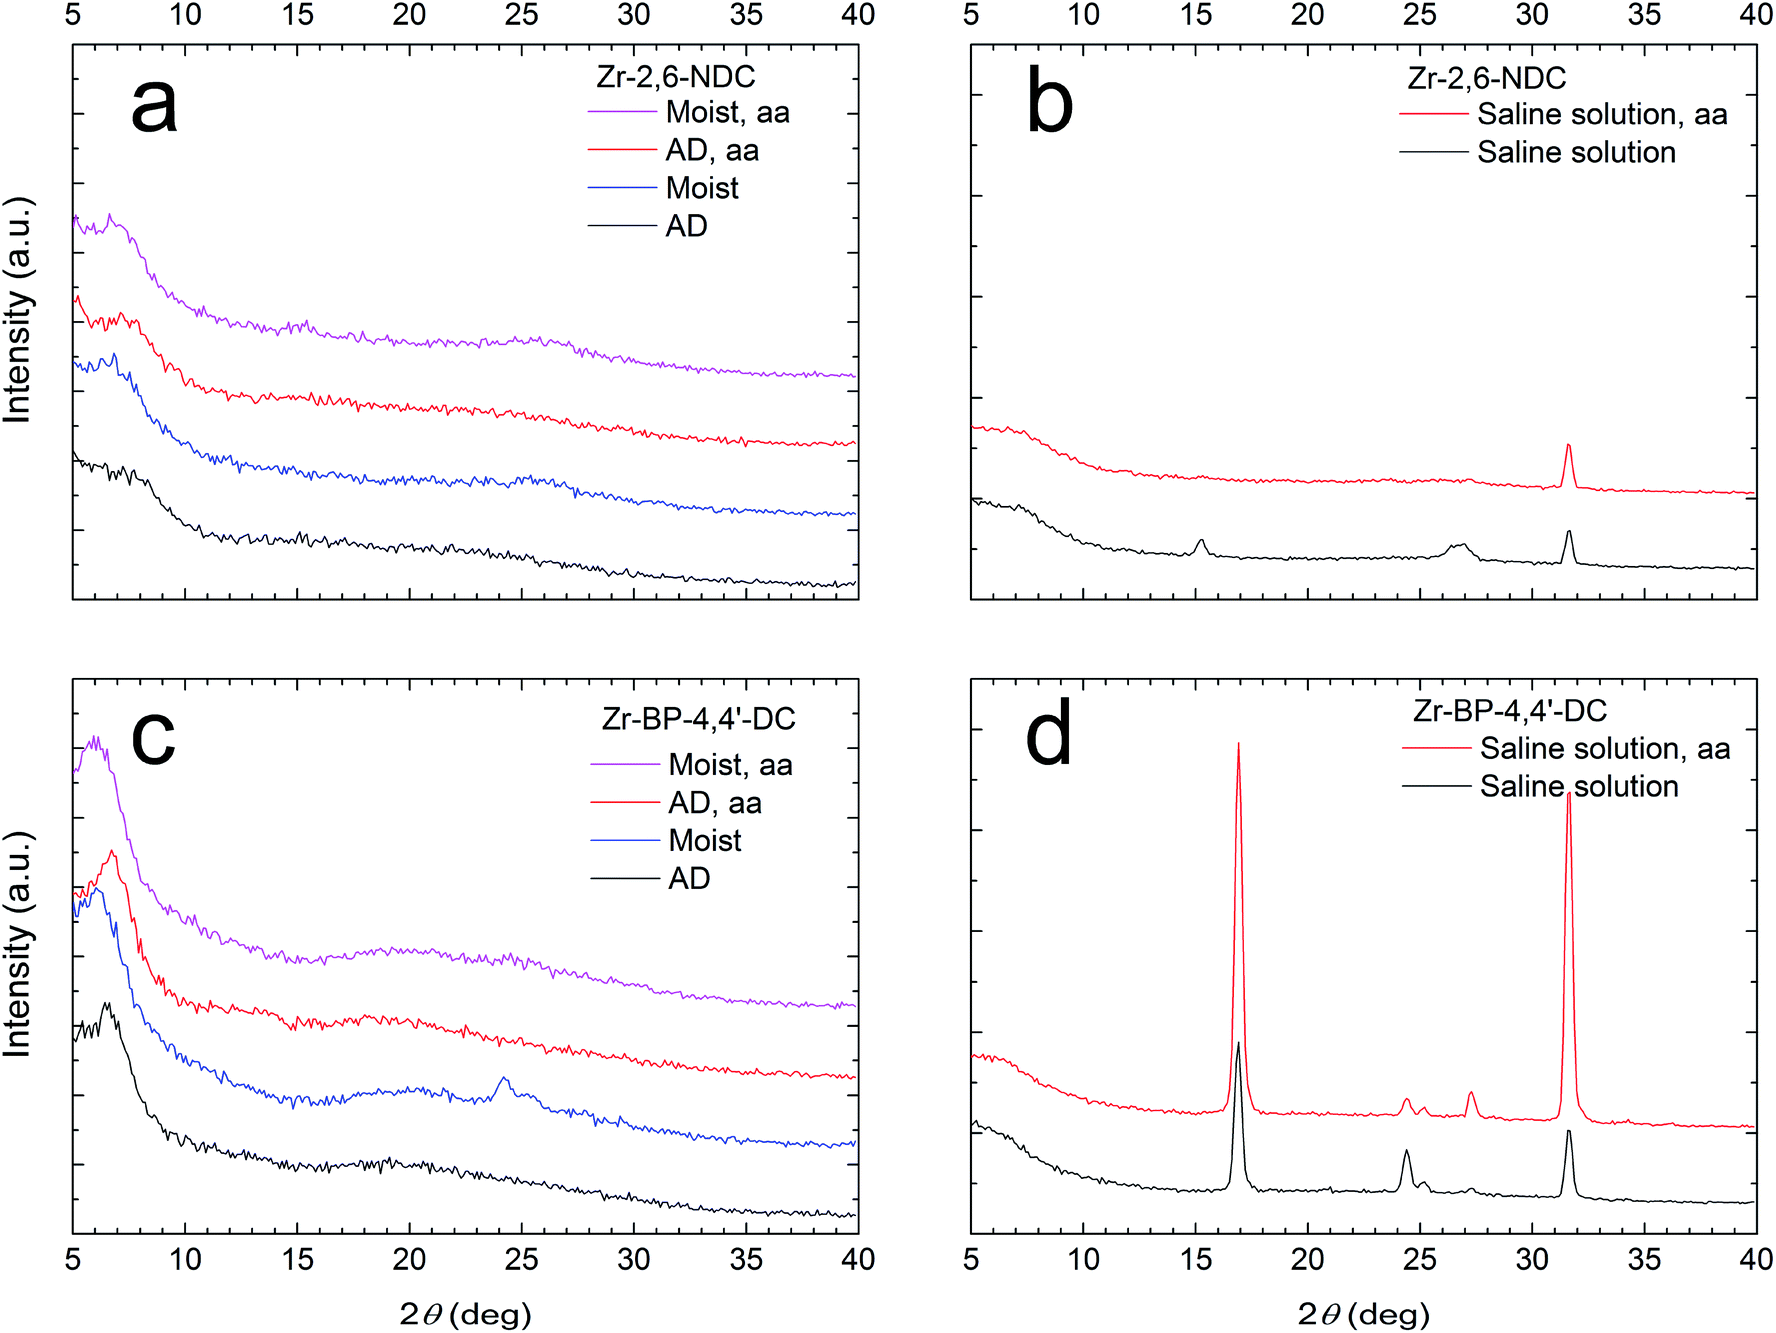 | ||
| Fig. 5 Effects of acetic acid modulation. (a) GI X-ray diffractograms for the as-deposited (AD) (black and red) and moisture treated (blue and magenta) Zr–2,6-NDC samples that have been deposited without (black and blue) and with (red and magenta) acetic acid modulation (aa). (b) GI X-ray diffractograms for two Zr–2,6-NDC samples deposited without (black) and with (red) acetic acid modulation (aa) that have been submerged in a 0.9% NaCl aqueous solution for 2.5 hours. (c and d) The same as (a) and (b), respectively, but for Zr–BP-4,4′-DC samples. The peak at 31.7° in (b) and (d) corresponds to NaCl from the saline solution. | ||
When H2–BP-4,4′-DC was used as the organic precursor, the behaviour was more similar to our previous results with Zr–1,4-BDC films. Here, we see the crystallization of a small amount of the precursor when the unmodulated sample is exposed to moist air. This crystallization does not occur in the modulated sample (Fig. 5c). The Zr–BP-4,4′-DC films seem to be less stable in the aqueous NaCl solution. Larger peaks that correspond to H2–BP-4,4′-DC are seen, and this crystallization is not avoided by acetic acid modulation (Fig. 5d).
Crystallization and characterization of the films
Crystallization of the films was done in the same way as in our previous work22 by heat treatment of the coated substrates in a sealed autoclave with approximately 0.1 mL of acetic acid at 160 °C for 24 hours. This resulted in crystallization of the films as can be seen from the GI X-ray diffractograms in Fig. 6. We believe this to indicate the formation of MOF phases since some of the reflections are at low angles, corresponding to large unit cells, and since the reflections are different from those of the crystalline precursors. The diffractograms are of films made with 100 cycles of the standard 3–2–20–2 s pulse and purge sequence and films made with 500 cycles of the acetic acid modulated standard where a 2 s acetic acid pulse and a 10 s purge is added after the dicarboxylic acid pulse and purge in the standard sequence. There are clear similarities and differences in the diffractograms for the Zr–2,6-NDC films, indicating variations in breaking of symmetry of the MOF structure.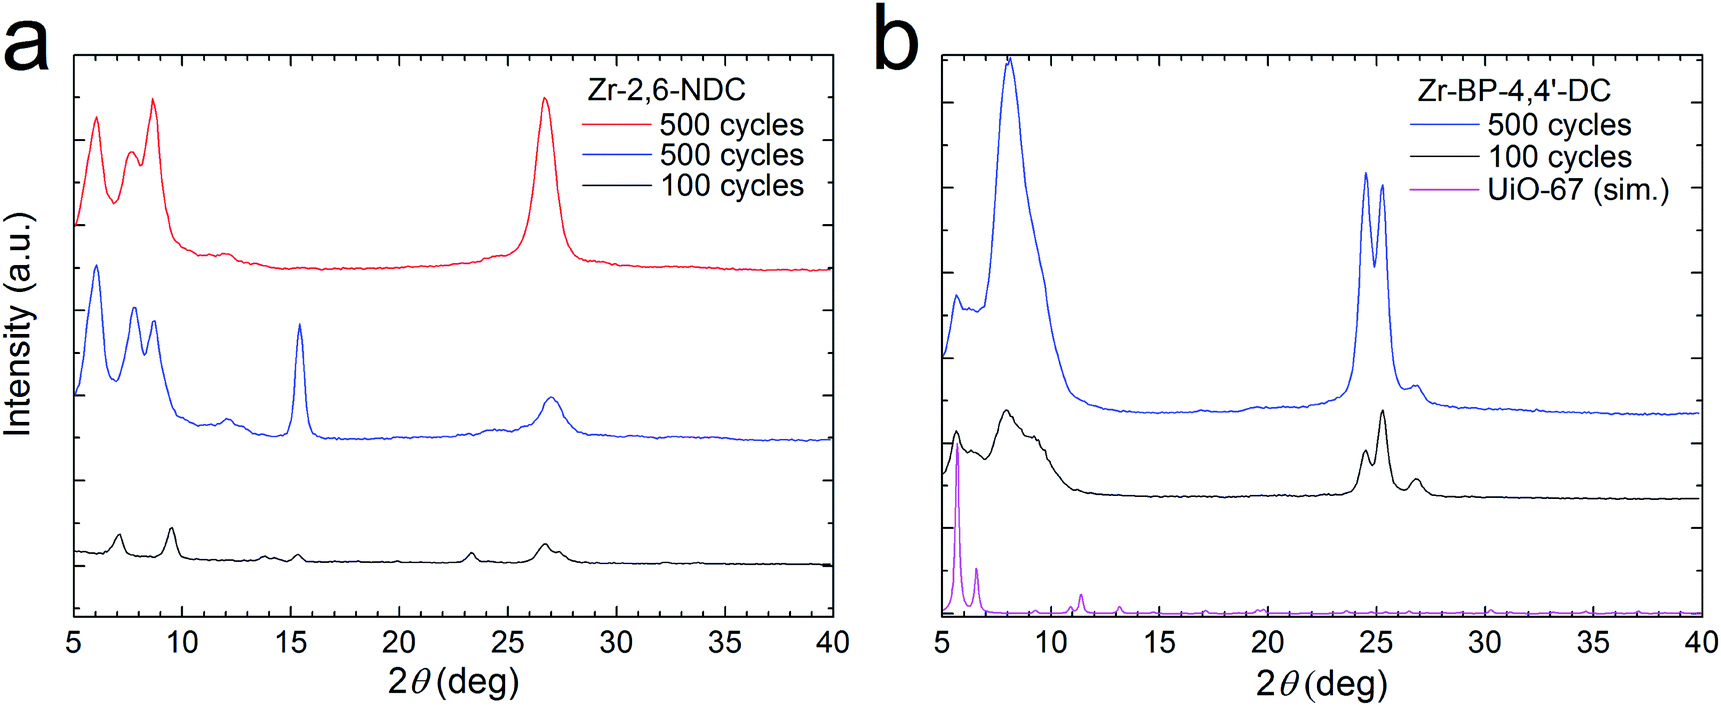 | ||
| Fig. 6 Crystalline MOF structures. GI X-ray diffractograms for (a) Zr–2,6-NDC films and (b) Zr–BP-4,4′-DC films that were heated to 160 °C in a sealed autoclave in acetic acid vapour. A film that was deposited with 100 cycles without acetic acid modulation (black) is included in both cases. For Zr–2,6-NDC, two films that were deposited with 500 cycles with acetic acid modulation (blue and red) are included, and for Zr–BP-4,4′-DC, one such film is shown (blue). A simulation of the diffractogram for UiO-67 (magenta) is included in (b). | ||
In these films, the exact structure of the formed MOFs is not known, but it is possible that more than one phase is made. In an article by Bon et al.,30 they show that three MOF structures can be made with Zr (or Hf) clusters and 2,6-NDC linkers. These are named DUT-52, DUT-53 and DUT-84. In addition, it is possible that other structures can be made, for instance, structures with “double clusters” like the ones reported by Cliffe et al.31 and Ermer et al.32 The Zr–BP-4,4′-DC films crystallize to form a small amount of UiO-67 (or a similar phase) and a larger amount of an unknown phase (Fig. 6b).
Although the exact structure is not known for most of the formed phases, it is clear that crystallization of a phase with a large unit cell occurs. The crystallization can also be seen in the SEM images in Fig. 7 and 8, where the amorphous films are relatively flat, and the crystalline samples have rough surfaces with large crystallites.
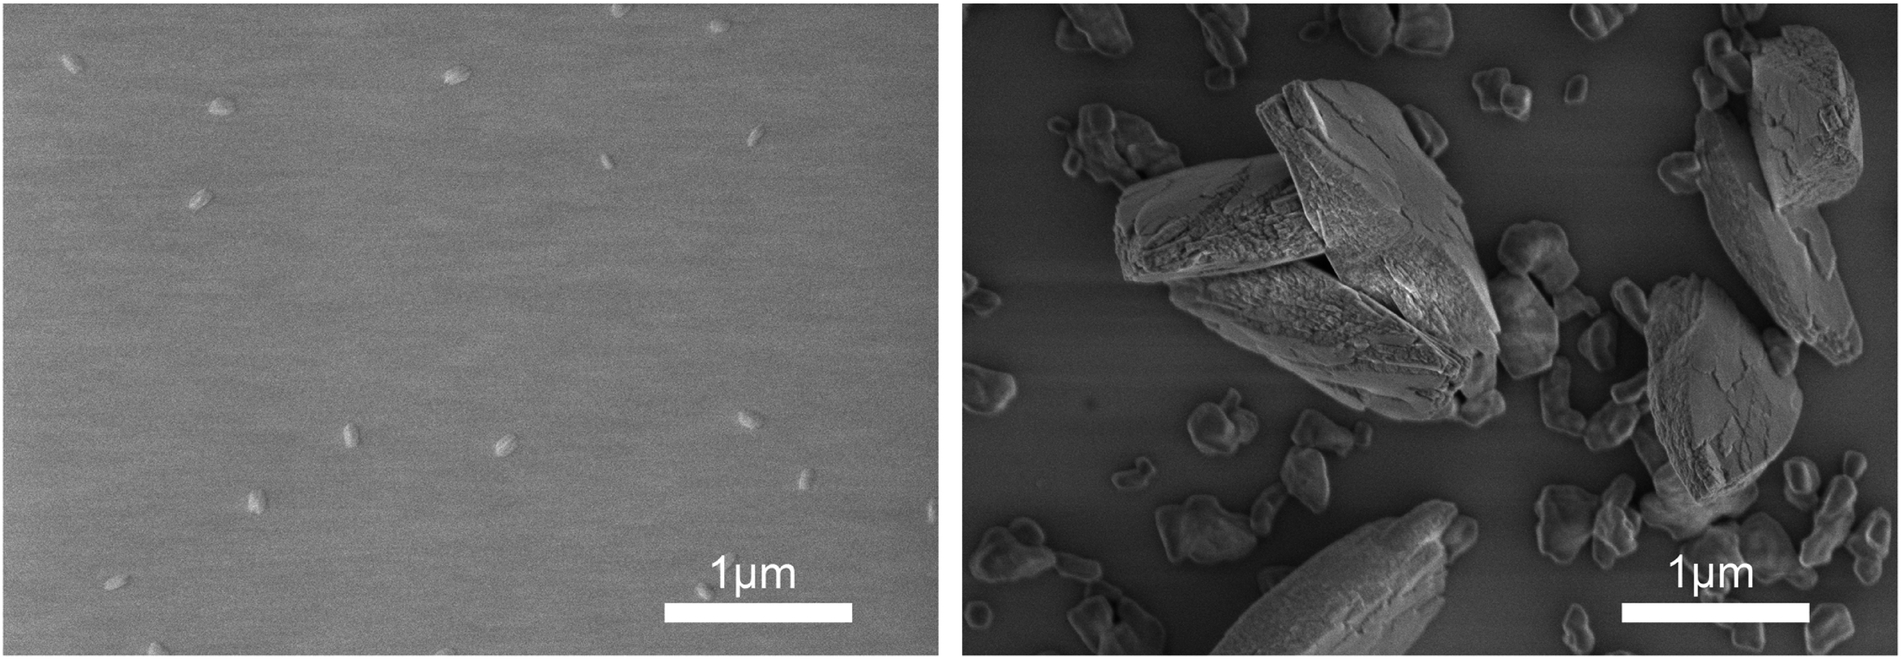 | ||
| Fig. 7 Zr–2,6-NDC films. Scanning electron microscopy (SEM) images of an amorphous as-deposited sample (left) and an autoclave treated, crystalline sample (right). The scale bars are 1 μm long. | ||
 | ||
| Fig. 8 Zr–BP-4,4′-DC films. Scanning electron microscopy (SEM) images of an amorphous as-deposited sample (left) and an autoclave treated, crystalline sample (right). The scale bars are 1 μm long. | ||
Porosity measurements
The QCM system was used to evaluate the film porosity. Four QCM crystals were coated with 500 cycles of the standard 3–2–20–2 s pulse and purge sequence, two were coated with Zr–2,6-NDC and the other two with Zr–BP-4,4′-DC. One film of each type was crystallized in an autoclave while the other films were left untreated. The Zr–BP-4,4′-DC coated crystals were placed back in the ALD reactor, and were heated to 120 °C for 2 hours in a vacuum to remove any water from the pores in the films. Afterwards, the reactor was cooled to room temperature and left overnight to ensure a complete temperature stabilization. Finally, the films were exposed to a 1 minute long water pulse that was registered by the QCM crystals (Fig. 9c). Afterwards, the same process was carried out for the Zr–2,6-NDC coated crystals (Fig. 9b).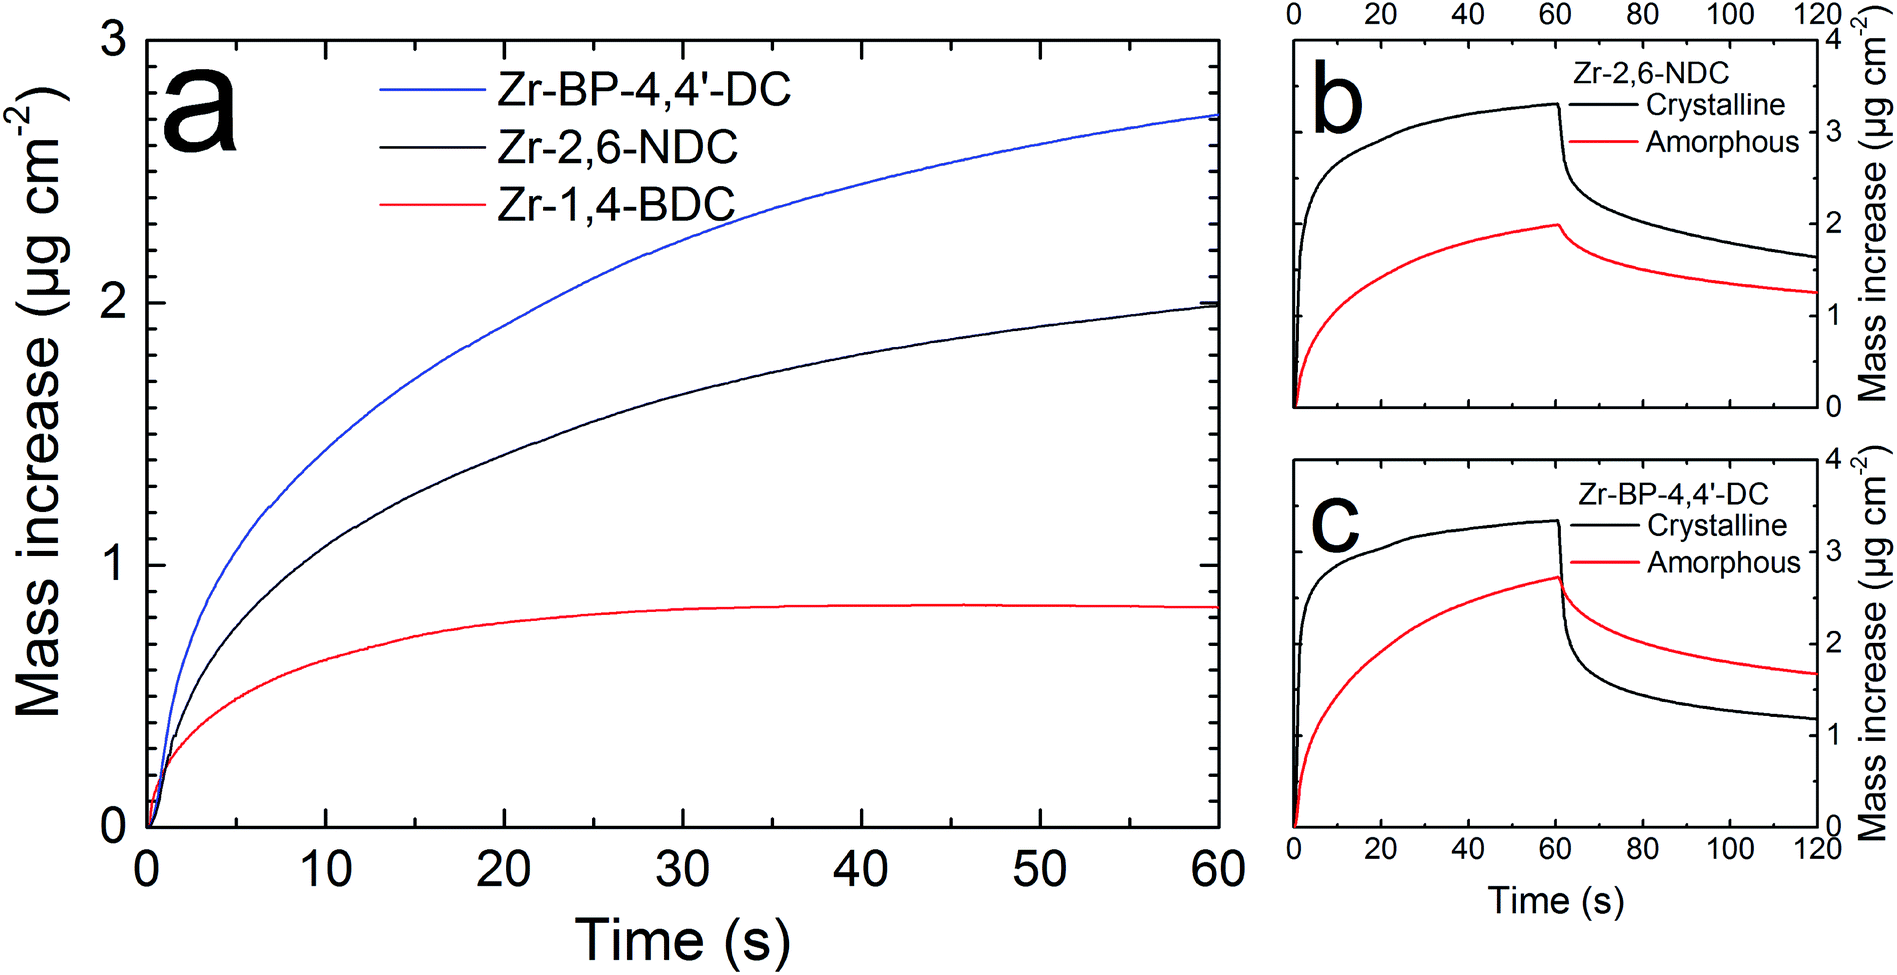 | ||
| Fig. 9 Porosity test by the quartz crystal microbalance technique. (a) A comparison between the water uptake in amorphous films of Zr–1,4-BDC (red), Zr–2,6-NDC (black), and Zr–BP-4,4′-DC (blue) over a 60 second long water pulse. (b and c) Porosity tests for amorphous (red) and crystalline (black) films of Zr–2,6-NDC and Zr–BP-4,4′-DC, respectively, showing a total time frame of 120 seconds (60 s pulse and 60 s purge). In our experience, all the water would be removed given a sufficiently long purge or heating after the water pulse (see the ESI of ref. 22 and 23). | ||
The amount of water absorbed in the films indicates whether the films are porous or not since a porous film has a much higher surface area than a non-porous film. Both the amorphous and the crystalline films are clearly porous when compared to the uncoated QCM crystal control (not shown). The response for the two crystalline films was three orders of magnitude higher than that of the control. In both cases, the crystalline samples seem to have more accessible pores due to a much faster transport of water in and out of the films (this is most prominent in the Zr–BP-4,4′-DC films), although the increased surface roughness in the crystalline samples also plays a role here. The total porosity is also higher in the crystalline samples (this is especially true for the Zr–2,6-NDC films).
It is difficult to properly quantify the total porosity or the pore size based on these results, but a comparison between the different films can be made (Fig. 9a). We can see that the total amount of absorbed water increases with increasing linker length (from 1,4-BDC,22 through 2,6-NDC, to BP-4,4′-DC). This corresponds well with a larger pore size with longer linkers, and therefore a higher total porosity. The comparison in Fig. 9a is between amorphous samples since this eliminates some uncertainties such as varying degrees of crystallization etc. We have used a constant number of cycles rather than constant thickness for the samples in this comparison to obtain a comparable number of pores between the samples.
The porosity seen in these films is another argument that MOF-like materials are formed, even though the exact MOF phases cannot be determined from the GIXRD data.
Luminescent properties
A strong near-UV absorbance of the 2,6-NDC and BP-4,4′-DC linkers is favourable for applications related to photoactivation such as luminescence and photocatalysis. The optical absorption coefficient, and emission and excitation spectra of the two film materials are shown in Fig. 10, where (a) and (c) show the emission spectra, consisting of two peaks in both cases. The longer wavelength peak at 485 nm has the same wavelength for both linkers while the shorter wavelength one varies in a manner similar to the excitation profile, i.e. this emission peak is at higher energies for BP-4,4′-DC. Another notable difference between these two materials is that the short wavelength emission depends on the deposition temperature for Zr–BP-4,4′-DC, but not for Zr–2,6-NDC. The variation in luminescence intensity in (a) is possibly due to differences in roughness and thickness, which will affect light scattering at the film/air interface and thus also both the UV absorption and how much emitted light escapes the film. Fig. 10b and d show that the excitation curves (i.e. monitoring the luminescence intensity while varying the excitation wavelength) correspond well with the modelled optical absorption from ellipsometry measurements. The excitation spectra of both short and long wavelength peaks are identical. This means that the absorption process leading to these two emission bands is the same. While our hybrid films show strong near-UV absorption, pure ZrO2 has a bandgap of around 5 eV (about 250 nm) and our ALD films of ZrO2 only absorb wavelengths shorter than 270 nm; thus, it is highly unlikely that the Zr-clusters are responsible for this absorption. The aromatic linkers, however, are expected to show exactly this type of multiplet absorption. This luminescence can be used in sensing, particularly when it is combined with high porosity, which will increase the interaction between gases or liquids and the material. An additional benefit of these films is that they contain both an aromatic compound and an inorganic cluster, both having different chemical reactivities, and will react to different chemical species.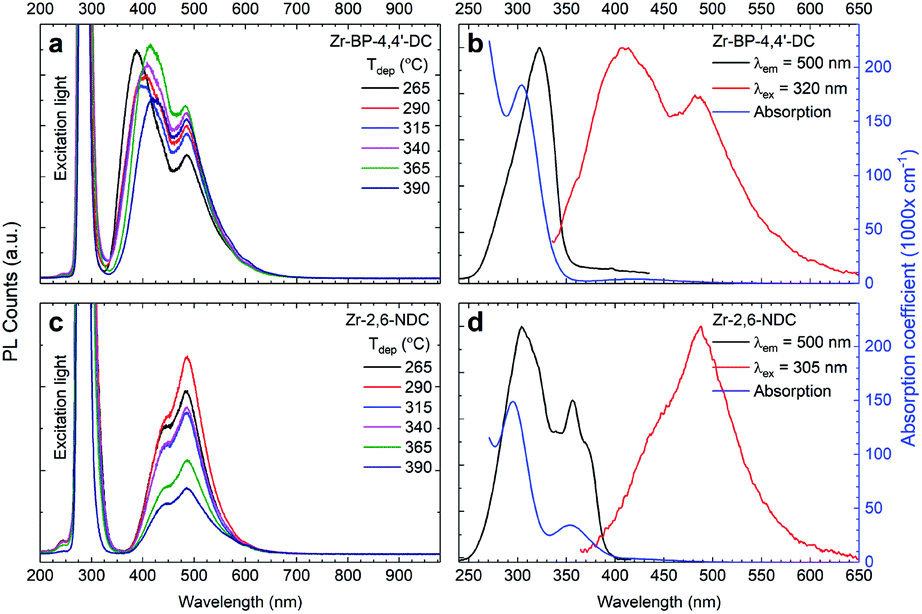 | ||
| Fig. 10 Luminescence, excitation and absorption properties. (a and c) The luminescence upon 280 nm excitation of the as-deposited samples as a function of deposition temperature. (b and d) The optical absorption (blue) spectra modelled from ellipsometry data, and excitation (black) and luminescence (red) spectra of the as-deposited film deposited at 290 °C. | ||
This way, such hybrid materials can be used for sensing a larger amount of chemicals than either the acid or ZrO2 could do alone. As seen in Fig. 11, this luminescence degrades under long time UV exposure, although at a predictable rate. This limits the materials sensing possibility for continuous measurements, but does not prevent short time measurements, for example, for blood samples. The very strong absorption of the aromatic linkers indeed makes these films quite ideal for such measurements, as only a very thin film is needed to obtain good optical signals, which then allows for fast kinetics of chemical species moving in and out of the porous structure.
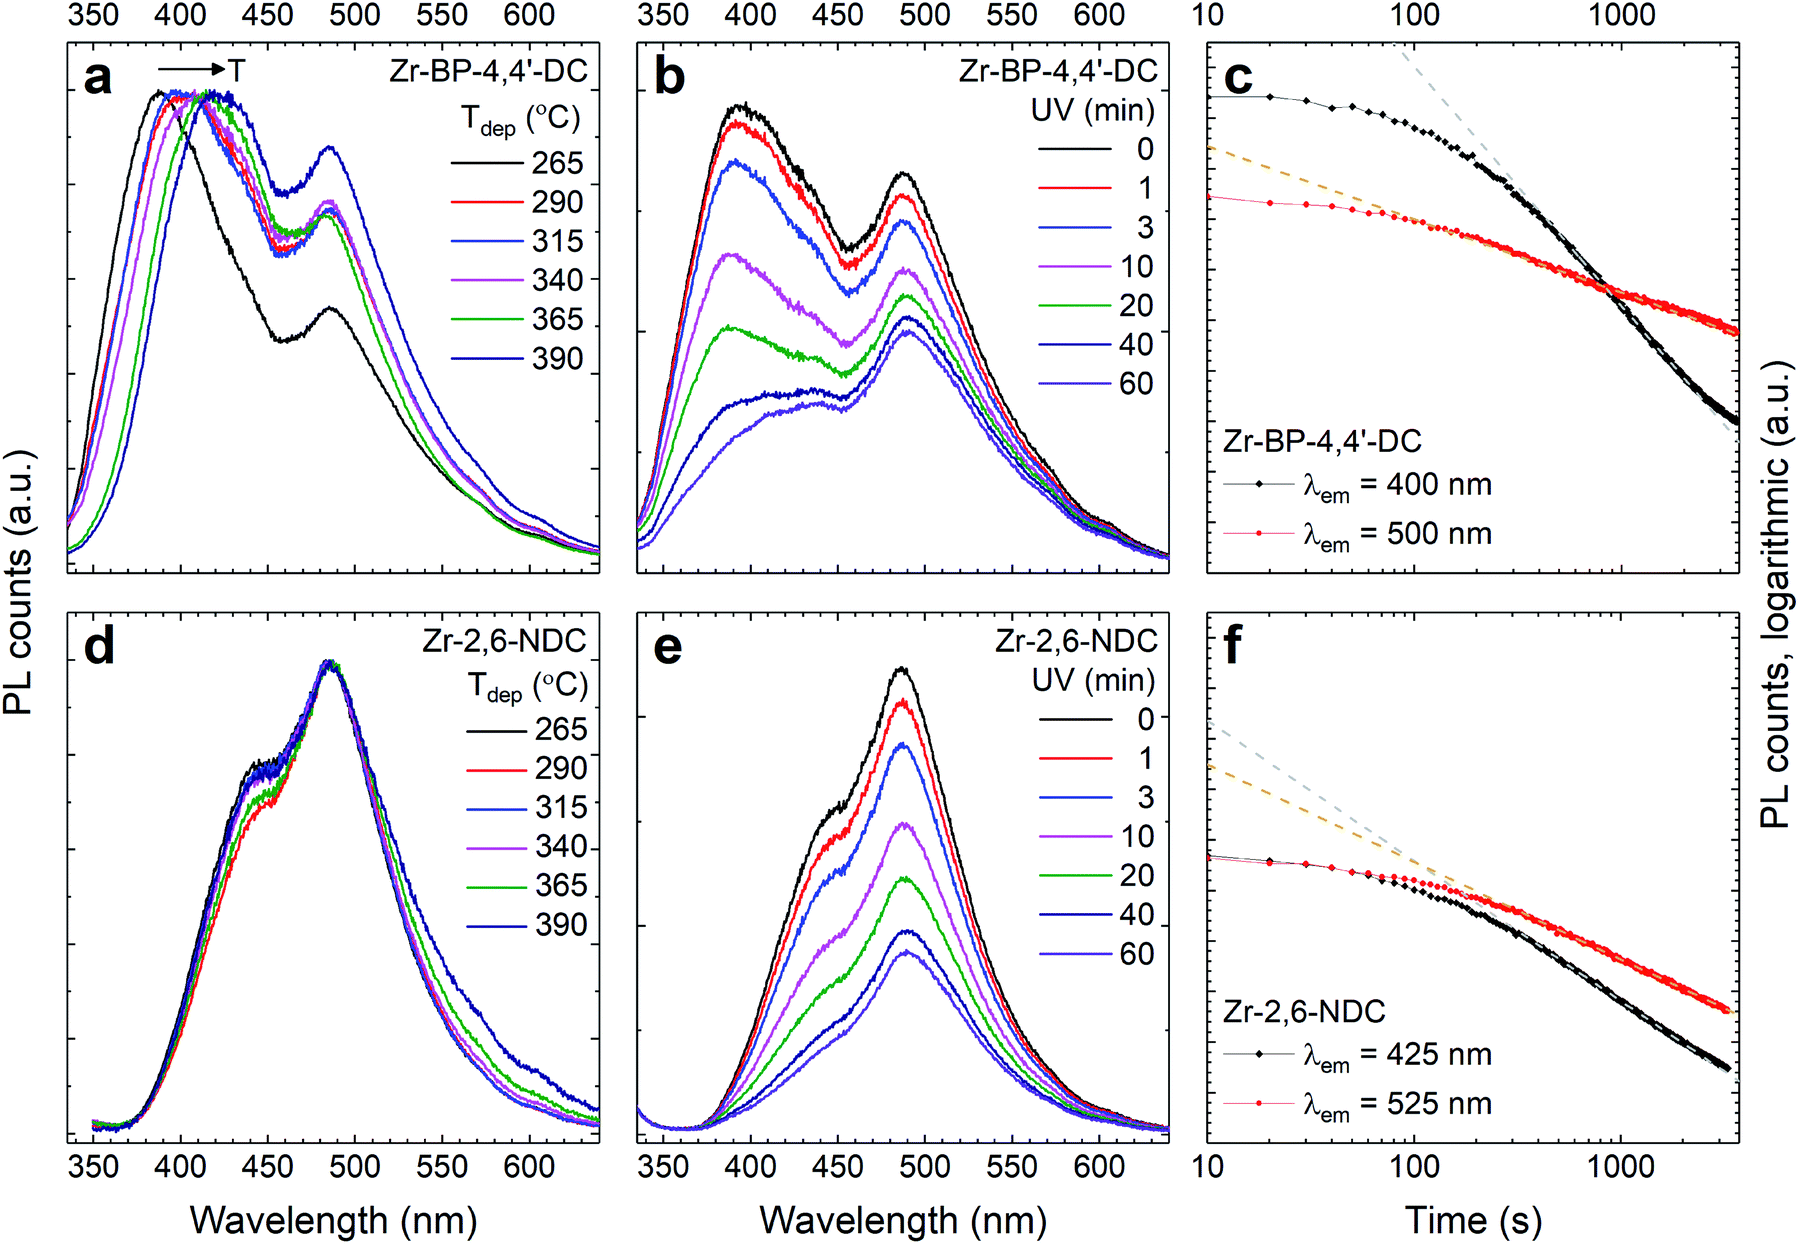 | ||
| Fig. 11 Luminescence evolution with deposition temperature and UV exposure time. (a and d) Normalized emission spectra. (b and e) The time evolution of these spectra upon UV exposure. (c and f) The evolution of the aromatic and zirconium cluster peaks upon UV exposure. | ||
Fig. 11a and d show the normalized emission spectra of the two materials for all deposition temperatures. For the Zr–BP-4,4′-DC films, the high energy peak is red-shifted with increasing deposition temperature in addition to the intensity variations seen in Fig. 10a. The Zr–2,6-NDC films on the other hand show no shifting of the high energy peak. Fig. 11b, c, e and f show that the emission decreases with time upon UV exposure. There is no apparent shift in peak positions, but both the high and low energy peaks decrease. However, it is seen that the high energy peak decreases faster in both cases, and BP-4,4′-DC decreases faster than 2,6-NDC. The low energy emission decreases at similar rates between the two linkers. The origin of the two emission peaks and how their peak position and intensity change can be interpreted as follows. The high energy emission peak varies just like the absorption peaks, so this peak likely stems from the aromatic molecule alone. The low energy peak on the other hand likely arises from the interaction between the metal and the carboxylate group. Otherwise there wouldn't be a reason for this peak to be at exactly the same energy for two molecules with different sized aromatic systems. Both the high and low energy peaks have the same excitation profile, which means that a photoinduced excitation always has the possibility of leading to both types of emissions. However, whether this is due to a higher excited state relaxing down to either of two lower energy emissive states with a certain branching ratio, or due to the energy always first ending up at the higher energy emissive state followed by a competition between emission and transfer to the lower energy state, is uncertain. In any case, there are several energy levels involved that could be affected differently by various stimuli. For the Zr–BP-4,4′-DC films on the other hand, the situation is more complex. In addition to intensity changes, the wavelength position of high energy peaks also changes with deposition temperature (but not with UV exposure time). If this peak indeed originates from the aromatic linker alone, this could mean that there is a difference in the intermolecular interaction, i.e. π–π interaction, that depends on how and if the aromatic rings are stacked face-to-face in the amorphous film.
As BP-4,4′-DC is larger and more elongated than 2,6-NDC, it is reasonable that a change in deposition temperature can also lead to differences in how these molecules interact. This difference could also arise from differences in the Zr–carboxylate bonding, i.e. monodentate or bidentate. This explanation matches both the growth rates of the two linkers, which show an ALD window for Zr–2,6-NDC (indicating the same bonding chemistry) while the growth rate for Zr–BP-4,4′-DC decreases with temperature (indicating a temperature dependent bonding chemistry). In addition, this also fits well with the fact that Zr–BP-4,4′-DC is more prone to acid crystallization upon exposure to moisture.
Antibacterial properties
Antibacterial MOFs have been reported in a few studies in the literature. These have typically relied on a slow degradation of the MOFs causing a release of toxic metal ions or ligands from the structure.33,34 Since our films absorb UV light, we decided to investigate their antibacterial effects due to phototoxic effects. Glass discs were coated with Zr–2,6-NDC or Zr–BP-4,4′-DC and used as substrates for the antibacterial assay, while uncoated glass discs were used as controls. Half of the samples were irradiated with UVA light, and the other half were used as dark controls. Three parallel experiments were performed for all sample types. A reduction in the number of viable bacteria was observed on the Zr–2,6-NDC films but not on the Zr–BP-4,4′-DC films under the specific UVA radiation that was used (data not shown). This is explained by the UV absorbance of the films. The Zr–BP-4,4′-DC films do not absorb the radiation from this light source, while the Zr–2,6-NDC films have an absorbance between 350 and 400 nm that overlaps with the emission of the lamp.Further experiments were conducted on the Zr–2,6-NDC films to investigate the significance of these results. Three independent experiments were performed for the Zr–2,6-NDC films and the controls, and the results are shown in Fig. 12. More than 50% reduction of viable bacteria was observed for the irradiated Zr–2,6-NDC samples as compared to the controls that were not irradiated. When this sample was compared to the irradiated control, a 40% reduction was observed. In other words, MOF films such as these could be interesting for antibacterial purposes due to their UV absorbance and phototoxic effects. In this study, Zr–2,6-NDC was the most promising probably due to the overlap between the UV absorbance of these films and emission from the lamp. This overlap is still quite small, indicating that MOF thin films could be even more promising for antibacterial applications if linkers with more ideal absorbance spectra are used.
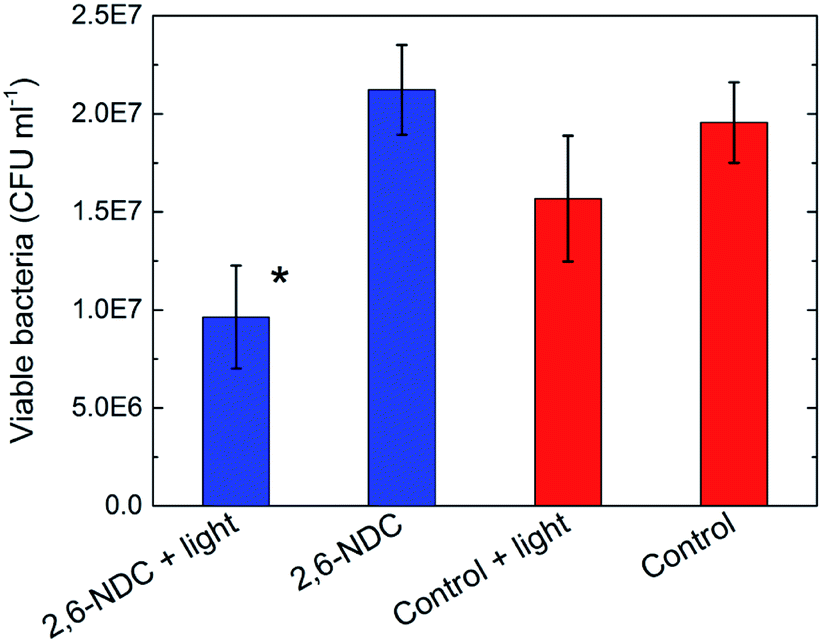 | ||
| Fig. 12 Antibacterial assay. Viable bacteria in CFU per mL after exposure to Zr–2,6-NDC samples (blue) and controls (red) with and without irradiation under UVA light. A significant difference from all other samples is marked by *. | ||
Conclusions
Amorphous but porous films have been made by MLD by combining ZrCl4 and either H2–2,6-NDC or H2–BP-4,4′-DC. The growth is self-saturating in both cases, indicating ALD/MLD-like growth even though the saturation of linker molecules is rather slow. Modulation of the growth using acetic acid prevents an excess amount of linker molecules in the Zr–BP-4,4′-DC films, and ensures a stronger bonding of the linkers in the Zr–2,6-NDC films. Modulation could then be useful for Zr–BP-4,4′-DC films and for some applications of the Zr–2,6-NDC films, such as applications where the films need to be exposed to liquid water. Crystallization of the films to form MOF-structures that are similar to DUT-52, DUT-53, DUT-84, or UiO-67 is possible by heat treatment for 24 hours at 160 °C in acetic acid vapour in a sealed autoclave. The films are luminescent and show potential as antibacterial surfaces.Conflicts of interest
There are no conflicts to declare.Acknowledgements
We acknowledge Diatech@UiO, a strategic research initiative of the University of Oslo, and the Research Council of Norway (Project No. 244087) for funding. K. B. L. is also thankful to the co-supervisors of this project Elsa Lundanes, Carl Henrik Gørbitz and Steven Wilson for their ideas and comments and to other colleagues at the University of Oslo for their aid. We would also like to acknowledge the Norwegian national infrastructure for X-ray diffraction and scattering (RECX), and the Debye Institute for Nanomaterials Science at Utrecht University for the use of the Edinburgh Instruments fluorescence spectrometer. We are grateful for the technical assistance from Inger Sofie Dragland, and scientific advice from Dr Ellen Bruzell regarding the light source and dosimetry for the antibacterial assay.Notes and references
- J.-R. Li, J. Sculley and H.-C. Zhou, Chem. Rev., 2012, 112, 869–932 CrossRef CAS PubMed.
- X. Liu, N. Keser Demir, Z. Wu and K. Li, J. Am. Chem. Soc., 2015, 137, 6999–7002 CrossRef CAS PubMed.
- U. Mueller, M. Schubert, F. Teich, H. Puetter, K. Schierle-Arndt and J. Pastré, J. Mater. Chem., 2006, 16, 626–636 RSC.
- J. Lee, O. K. Farha, J. Roberts, K. A. Scheidt, S. T. Nguyen and J. T. Hupp, Chem. Soc. Rev., 2009, 38, 1450–1459 RSC.
- J. Long, S. Wang, Z. Ding, S. Wang, Y. Zhou, L. Huang and X. Wang, Chem. Commun., 2012, 48, 11656–11658 RSC.
- S. Jakobsen, D. Gianolio, D. S. Wragg, M. H. Nilsen, H. Emerich, S. Bordiga, C. Lamberti, U. Olsbye, M. Tilset and K. P. Lillerud, Phys. Rev. B, 2012, 86, 125429 CrossRef.
- C. Wang, X. Liu, J. P. Chen and K. Li, Sci. Rep., 2015, 5, 16613 CrossRef CAS PubMed.
- J. E. Mondloch, M. J. Katz, W. C. Isley III, P. Ghosh, P. Liao, W. Bury, G. W. Wagner, M. G. Hall, J. B. DeCoste, G. W. Peterson, R. Q. Snurr, C. J. Cramer, J. T. Hupp and O. K. Farha, Nat. Mater., 2015, 14, 512–516 CrossRef CAS PubMed.
- D. T. Lee, J. Zhao, G. W. Peterson and G. N. Parsons, Chem. Mater., 2017, 29, 4894–4903 CrossRef CAS.
- H. R. Abid, H. Tian, H.-M. Ang, M. O. Tade, C. E. Buckley and S. Wang, Chem. Eng. J., 2012, 187, 415–420 CrossRef CAS.
- M. P. Suh, H. J. Park, T. K. Prasad and D.-W. Lim, Chem. Rev., 2012, 112, 782–835 CrossRef CAS PubMed.
- R. B. Getman, Y.-S. Bae, C. E. Wilmer and R. Q. Snurr, Chem. Rev., 2012, 112, 703–723 CrossRef CAS PubMed.
- K. M. L. Taylor-Pashow, J. D. Rocca, Z. Xie, S. Tran and W. Lin, J. Am. Chem. Soc., 2009, 131, 14261–14263 CrossRef CAS PubMed.
- M. D. Allendorf, A. Schwartzberg, V. Stavila and A. A. Talin, Chem.–Eur. J., 2011, 17, 11372–11388 CrossRef CAS PubMed.
- V. Miikkulainen, M. Leskelä, M. Ritala and R. L. Puurunen, J. Appl. Phys., 2013, 113, 021301 CrossRef.
- S. M. George, B. Yoon and A. A. Dameron, Acc. Chem. Res., 2009, 42, 498–508 CrossRef CAS PubMed.
- X. Meng, J. Mater. Chem. A, 2017, 5, 18326–18378 RSC.
- L. D. Salmi, M. J. Heikkilä, E. Puukilainen, T. Sajavaara, D. Grosso and M. Ritala, Microporous Mesoporous Mater., 2013, 182, 147–154 CrossRef CAS.
- L. D. Salmi, M. J. Heikkilä, M. Vehkamäki, E. Puukilainen, M. Ritala and T. Sajavaara, J. Vac. Sci. Technol., A, 2015, 33, 01A121 CrossRef.
- E. Ahvenniemi and M. Karppinen, Chem. Commun., 2016, 52, 1139–1142 RSC.
- A. Tanskanen and M. Karppinen, Sci. Rep., 2018, 8, 8976 CrossRef CAS PubMed.
- K. B. Lausund and O. Nilsen, Nat. Commun., 2016, 7, 13578 CrossRef CAS PubMed.
- K. B. Lausund, V. Petrovic and O. Nilsen, Dalton Trans., 2017, 46, 16983–16992 RSC.
- World Health Organization, Antimicrobial Resistance Global Report on Surveillance, 2019, http://apps.who.int/iris/bitstream/handle/10665/112642/9789241564748_eng.pdf;jsessionid=B6E3E184923CB41980C5BE4BEF2BA350?sequence=1, accessed 21.01.2019 Search PubMed.
- C. von Eiff, B. Jansen, W. Kohnen and K. Becker, Drugs, 2005, 65, 179–214 CrossRef CAS PubMed.
- S. M. Moskowitz, J. M. Foster, J. Emerson and J. L. Burns, J. Clin. Microbiol., 2004, 42, 1915–1922 CrossRef CAS PubMed.
- M. R. Hamblin and T. Hasan, Photochem. Photobiol. Sci., 2004, 3, 436–450 RSC.
- V. Bergh, E. Bruzell, A. Hegge and H. Tønnesen, Pharmazie, 2015, 70, 574–580 CAS.
- J. A. Kaduk and J. T. Golab, Acta Crystallogr., 1999, 55, 85–94 CrossRef PubMed.
- V. Bon, I. Senkovska, M. S. Weiss and S. Kaskel, CrystEngComm, 2013, 15, 9572–9577 RSC.
- M. J. Cliffe, E. Castillo-Martínez, Y. Wu, J. Lee, A. C. Forse, F. C. N. Firth, P. Z. Moghadam, D. Fairen-Jimenez, M. W. Gaultois, J. A. Hill, O. V. Magdysyuk, B. Slater, A. L. Goodwin and C. P. Grey, J. Am. Chem. Soc., 2017, 139, 5397–5404 CrossRef CAS PubMed.
- M. Ermer, J. Mehler, M. Kriesten, Y. Avadhut, P. S. Schulz and M. Hartmann, Dalton Trans., 2018, 47, 14426–14430 RSC.
- G. Wyszogrodzka, B. Marszałek, B. Gil and P. Dorożyński, Drug Discovery Today, 2016, 21, 1009–1018 CrossRef CAS PubMed.
- F. N. Azad, M. Ghaedi, K. Dashtian, S. Hajati and V. Pezeshkpour, Ultrason. Sonochem., 2016, 31, 383–393 CrossRef CAS PubMed.
| This journal is © The Royal Society of Chemistry 2020 |