
A sulfur-tolerant cathode catalyst fabricated with in situ exsolved CoNi alloy nanoparticles anchored on a Ruddlesden–Popper support for CO2 electrolysis†
Seongmin
Park
a,
Yoongon
Kim
a,
Yuseong
Noh
a,
Taewook
Kim
b,
Hyunsu
Han
a,
Wongeun
Yoon
a,
Junil
Choi
a,
Sang-Ho
Yi
c,
Woon-Jae
Lee
c and
Won Bae
Kim
 *a
*a
aDepartment of Chemical Engineering, Pohang University of Science and Technology (POSTECH), Pohang 37673, Republic of Korea. E-mail: kimwb@postech.ac.kr; Fax: +82-54-279-5528; Tel: +82-54-279-2397
bGreen Materials and Processes Group, Korea Institute of Industrial Technology, Ulsan 44413, Republic of Korea
cTechnical Research Laboratories, POSCO, Pohang 6261, Republic of Korea
First published on 7th October 2019
Abstract
We developed a new and efficient sulfur-tolerant catalyst for application as a solid oxide electrolysis cell (SOEC) cathode designed with in situ exsolved CoNi alloy nanoparticles anchored on a Ruddlesden–Popper (R.P.) support of La1.2Sr0.8Co0.4Mn0.6O4 and evaluated its catalytic activity for CO2 electrolysis to CO under a CO2 gas stream containing H2S species. This catalyst was prepared by in situ annealing of a perovskite derivative (La0.6Sr0.4Co0.5Ni0.2Mn0.3O3) in a 20% H2/N2 gas at 800 °C. The catalyst exhibited good reversibility of structural transitions during reduction and re-oxidation processes. A high current density of 703 mA cm−2 was achieved at 1.3 V and 850 °C with a maximum faradaic efficiency of 97.8%. In situ grown CoNi alloy nanoparticles and the high oxygen vacancy content in the R.P. support were responsible for its high catalytic activity and efficiency. Importantly, no sign of performance degradation was observed in galvanostatic tests over a period of 90 h operation under H2S-containing CO2 gas conditions. Moreover, the catalyst showed no noticeable structural changes even after exposure to 100 ppm H2S/N2, indicating that the catalyst developed in this study is highly active for CO2 electrolysis with a high tolerance against sulfur-poisoning species. Therefore, this Ruddlesden–Popper material with in situ exsolved CoNi alloy nanoparticles should be a promising cathode catalyst for practical application to H2S-containing CO2 gas streams that are effluents of power stations or steel making plants.
1. Introduction
Solid oxide electrolysis cells (SOECs) are promising systems for efficient conversion of CO2 using renewable electrical energy. They can produce CO and pure O2 through CO2 electrolysis with several technological advantages such as high efficiency, fast reaction kinetics, and decreased load of external electricity compared with low-temperature CO2 electrolysis.1–4 However, conventional Ni-based cathodes face serious poisoning problems because of sulfur compounds such as H2S, which is generally present in the CO2 stream emitted from fossil fuel power plants or steel making blast furnaces. For practical application of the SOEC system, this sulfur-poisoning issue needs to be overcome or circumvented because H2S-containing gases can damage a substantial number of catalytic reaction sites for CO2 electrolysis due to the strong adsorption of sulfur species.5,6 Furthermore, the irreversible formation of nickel sulfide (Ni3S2) between sulfur and the Ni catalyst could reduce catalytic activity.7,8Ceramic-based materials, especially with the perovskite structure, have attracted attention as promising electrode materials because of their coking resistance and high stability under redox conditions.9–16 Particularly, these perovskite materials are less vulnerable to sulfur-containing gas streams than metal-based catalysts such as Ni-YSZ.7,17 Strontium-doped lanthanum chromate (LSC) has been previously reported as a fuel electrode for solid oxide fuel cells (SOFCs) because of its better stability and sulfur tolerance than typical Ni-based anodes.11 In addition, strontium-doped lanthanum vanadate (LSV) exhibits low degradation in the presence of H2S-containing fuels for SOFC operation.18 However, research on H2S-tolerant electrode catalysts in the SOEC system has been rarely attempted although enormous amounts of CO2 can be emitted from sulfur-containing vent gases of power plants or steel making blast furnaces.
Considering that ceramic-based materials have relatively lower catalytic activity than Ni-based catalysts,3 one of the effective strategies to improve the catalytic activity would be the direct incorporation of catalytically active metal nanoparticles into ceramic materials; indeed, some trials were made with the impregnation method.19–23 However, this external impregnation method faces several drawbacks such as particle agglomeration and carbon deposition leading to performance degradation for CO2 electrolysis.24 Alternatively, in situ growth of metal nanoparticles from the parent ceramic material has drawn attention as an effective approach for enhanced catalytic activity;25–30 as the exsolved metal nanoparticles are likely to become strongly anchored onto the ceramic support, nanoparticle agglomeration and carbon deposition could be minimized, leading to much improved stability compared with those made from the impregnation method.25,27 Indeed, many exsolution-based perovskite materials have been reported to exhibit high catalytic activity and stability under CO2 electrolysis operation conditions.31,32
The Ruddlesden–Popper phase (An+1BnO3n+1) has been studied as an electrode material for solid oxide cell systems.33–35 This Ruddlesden–Popper structure has cubic perovskite layers surrounded by double rock-salt AO layers, as shown in Fig. S1.† The number of perovskite layers located between the rock-salt layers is related to the n value in the chemical formula of the Ruddlesden–Popper structure. This structure possesses a high redox stability and good oxygen ion conductivity with fast surface oxygen exchange as compared with those of simple perovskite structures, thus facilitating CO2 electrolysis reaction.36–38 However, high calcination temperatures above 1350 °C are required to directly synthesize the Ruddlesden–Popper structure, where particle growth leading to a substantial decrease in the triple phase boundary sites (TPBs) is critical. An alternative synthesis method to obtain the Ruddlesden–Popper structure is directly reducing perovskite derivatives in a reducing gas at around 800 °C, which is a milder condition than the typical preparation condition for this structure. A Ruddlesden–Popper catalyst of La1.2Sr0.8Mn0.4Fe0.6O4 with exsolved Fe metal nanoparticles, obtained by reducing the perovskite derivative of La0.6Sr0.4Mn0.2Fe0.8O3, was reported to exhibit outstanding electrochemical performance as an anode material for SOFCs.33 Furthermore, a catalyst composed of La1.2Sr0.8Co0.4Mn0.6O4 with in situ exsolved Co nanoparticles has also been demonstrated as a promising cathode material for SOECs for CO2 electrolysis.39
In this work, we developed a La1.2Sr0.8Co0.4Mn0.6O4 Ruddlesden–Popper material (R.P.LSCM) with in situ exsolved CoNi alloy nanoparticles (CoNi-R.P.LSCM) as a cathode material for SOECs for CO2 electrolysis. The CoNi-R.P.LSCM was obtained by directly reducing the perovskite derivative of La0.6Sr0.4Co0.5Ni0.2Mn0.3O3 (LSCNM) in a 20% H2/N2 gas flow at 800 °C. The structural, chemical, and electrical characteristics were examined by X-ray diffraction (XRD), scanning electron microscopy (SEM), transmission electron microscopy (TEM), energy-dispersive X-ray spectroscopy (EDS), X-ray absorption near-edge spectroscopy (XANES), thermogravimetric analysis (TGA), H2-temperature programmed reduction (H2-TPR), O2-temperature programmed oxidation (O2-TPO), CO2-temperature programmed desorption (CO2-TPD), and total electrical conductivity analysis. Furthermore, electrochemical properties of the single cell fabricated with the CoNi-R.P.LSCM cathode were investigated for the possible application of CoNi-R.P.LSCM as the cathode catalyst for SOECs for CO2 electrolysis even with H2S-containing CO2 gas streams.
2. Experimental procedure
2.1 Catalyst preparation and single cell fabrication
The La0.6Sr0.4Co0.5Ni0.2Mn0.3O3 perovskite (LSCNM) was first synthesized using a sol–gel method with metal precursors of La(NO3)3·6H2O (99.9%, Sigma Aldrich), Sr(NO3)2 (99.0%, Sigma Aldrich), Co(NO3)2·6H2O (99.0%, Sigma Aldrich), Ni(NO3)2·6H2O (98.0%, SAMCHUN), and Mn(NO3)2·6H2O (98+%, Alfa Aesar). The precursors in a stoichiometric ratio were dissolved in distilled water, and then, the chelating materials, ethylenediamine tetraacetic acid (EDTA, 99.5%, Sigma Aldrich) and citric acid (99.5%, Daejung, Korea), were introduced with a molar ratio of 1![[thin space (1/6-em)]](https://www.rsc.org/images/entities/char_2009.gif) :1.5:1 for metal ions/citric acid/EDTA. The pH of the solution was adjusted to 7 by adding ammonia water (28–30%, SAMCHUN) drop-wise, and then, the mixture was stirred sufficiently until the solution became transparent. Afterward, the solution was heated to 90 °C until it was gelled. The gel was dried at 200 °C for 1 h, and then preheated at 700 °C for 10 h to remove the organic components. The sample was pulverized using a mortar, then calcined at 1100 °C and kept for 10 h to obtain the final black powder sample. The R.P.LSCM was synthesized using a sol–gel method with the same process except for the calcination temperature of 1350 °C. Reference samples such as LaCoO3, LaNiO3 and LaMnO3 were also synthesized for XANES analysis by the same sol–gel method.
:1.5:1 for metal ions/citric acid/EDTA. The pH of the solution was adjusted to 7 by adding ammonia water (28–30%, SAMCHUN) drop-wise, and then, the mixture was stirred sufficiently until the solution became transparent. Afterward, the solution was heated to 90 °C until it was gelled. The gel was dried at 200 °C for 1 h, and then preheated at 700 °C for 10 h to remove the organic components. The sample was pulverized using a mortar, then calcined at 1100 °C and kept for 10 h to obtain the final black powder sample. The R.P.LSCM was synthesized using a sol–gel method with the same process except for the calcination temperature of 1350 °C. Reference samples such as LaCoO3, LaNiO3 and LaMnO3 were also synthesized for XANES analysis by the same sol–gel method.
To measure the electrochemical performance of a single cell, electrolyte-supported button cells were fabricated and used, in which the electrolyte pellet was prepared by pressing La0.8Sr0.2Ga0.8Mg0.2O3 (LSGM, Fuel cell materials) powder and pre-sintering at 1200 °C for 3 h. Afterward, the pre-sintered pellet was sintered again at 1450 °C for 10 h to obtain a dense electrolyte support with a diameter of 18 mm and thickness of 300 μm. A mixture of LSCNM and gadolinium-doped ceria (GDC, Ce0.9Gd0.1O2, UHSA Anan Kasei) in a weight ratio of 6:4 was prepared with an organic binder (mixture of α-terpineol and ethyl cellulose) to prepare a cathode slurry. Using a similar process, an anode slurry was also prepared with a mixture of La0.6Sr0.4Co0.2Fe0.8O3 (LSCF, Fuel cell materials)/GDC and the same organic binder. The cathode and anode slurries were screen-printed onto the prepared LSGM electrolyte pellet on the respective sides and then finally sintered at 1000 °C for 1 h.
2.2 Characterization of materials
The crystal structure, phase stability, and chemical compatibility of the catalysts were investigated by XRD (Ultima IV, Rigaku) within a 2θ range of 10–80° using Cu-Kα radiation. The morphologies of the catalysts and exsolved nanoparticles were observed using a SEM (JSM, 7401F, JEOL) and TEM (JEM-2100F, JEOL), respectively. XANES analysis was performed at the 7D beamline of the Pohang Accelerator Laboratory (PLS-II). The absorption spectra were obtained at room temperature for the K-edges of Co (7709.0 eV), Ni (8332.8 eV), and Mn (6539.0 eV) and analyzed with the ATHENA software. Thermogravimetric analysis (SDT Q600, TA instruments) of the catalysts was conducted over a temperature range from 30 °C to 850 °C at a heating rate of 10 °C min−1 to characterize their thermophysical properties. The H2-TPR test was performed using a flow reactor, where H2 gas was flowed through the catalyst, and then, the amount of H2O released with the reduction process of the catalyst was detected using a GC-MS system (7890B-5977B, Agilent technologies) from 30 °C to 850 °C at a heating rate of 10 °C min−1. O2-TPO was also performed with the same reactor, where 5% O2/N2 mixed gas was flowed through the catalyst, and the amount of O2 gas was detected using the GC-MS system (7890B-5977B, Agilent technologies) while raising the temperature from 30 °C to 850 °C at a heating rate of 10 °C min−1. The electrical conductivity of the cathode material was measured using the four-probe method. Prior to the conductivity analysis, the cathode powder was pressed into a dense bar and then sintered at 1350 °C for 10 h to obtain high density. Conductivity values were estimated by measuring the ohmic resistance values under different gas conditions of 20% H2/N2 reducing gas, air, or a gas mixture of 30% CO/CO2 with Pt wire and Ag paste as the current collector from 450 °C to 850 °C. For CO2-TPD analysis, CO2 gas was flowed through the catalyst at room temperature for 1 h, and was purged with He for 3 h. Afterward, the desorbed CO2 was measured using the GC-MS system (7890B-5977B, Agilent technologies) while ramping the temperature to 900 °C at a heating rate of 10 °C min−1. The chemical reactivity between CoNi-R.P.LSCM and H2S was investigated by XRD after the sample was exposed to the 100 ppm H2S/N2 gas at 850 °C for 10 h.2.3 Electrochemical measurements
For the single cell test, the button cell was attached to an alumina tube and sealed with a Pyrex ring sealant. A Pt mesh and wires were used to collect the current on the anode side, and Ag wires were used in the cathode compartment. Prior to the single cell tests, the temperature was raised to 850 °C to seal the reaction compartment by melting the Pyrex ring. Subsequently, 20% H2/N2 mixed gas was fed into the cathode compartment for 0.5 h to allow complete reduction of the cathode material to the CoNi-R.P.LSCM phase, while the anode compartment was exposed to ambient air. Thereafter, 30% CO/CO2 mixed gas was fed into the cathode compartment for CO2 electrolysis. The electrochemical measurements were conducted using electrochemical impedance spectroscopy (EIS, MP2, Zive Lab) in the frequency range of 100 MHz to 10 mHz at the open circuit voltage (OCV). For the sulfur-poisoning test, different mixtures of gases containing 25, 50, and 100 ppm H2S in a reaction gas of 30% CO/CO2 were fed into the cathode compartment to investigate the sulfur tolerance of the cathode catalyst. The outlet gases from the cathode side were analyzed using a gas chromatograph (GC, Agilent 7890) equipped with a Carboxen 1000 column and a thermal conductivity detector (TCD). The TCD detector was maintained at 200 °C, and He was used as the carrier gas.3. Results and discussion
The evolution of LSCNM phases and their redox behaviors were investigated through XRD measurements (Fig. 1a). The as-prepared LSCNM samples exhibited a dominant phase of perovskite structure. After exposure to a reducing atmosphere with a 20% H2/N2 gas mixture at 800 °C for 10 h, the LSCNM showed a phase transition from the perovskite to a Ruddlesden–Popper structure, denoted as empty circles, along with an additional evolution of the CoNi alloy phase, as denoted by filled squares. During the phase transition, some Co and Ni elements were exsolved from their lattice sites to form alloy phase nanoparticles on the material surface, while the other elements remained in the lattice as a part of the Ruddlesden–Popper structure. The representative peaks corresponding to the Ruddlesden–Popper structure were observed at 2θ near 31.32, 33.24, 42.08, 43.80, 47.75, 54.32, 58.08, and 65.16, indicating that the Ruddlesden–Popper structure with an n value of 1 (A2BO4) has a tetragonal structure.40 The La2O3 phase, denoted as stars in the figure, which was unavoidably generated during the exsolution process,41 appeared in the XRD pattern of CoNi-R.P.LSCM. Upon re-oxidation in air, CoNi-R.P.LSCM returned to its original LSCNM perovskite structure without forming impurity phases, suggesting good reversibility of the structural transition between the Ruddlesden–Popper structure and the perovskite. The re-formed perovskite showed the XRD pattern with some noise peaks which could be associated with the lower crystallinity due to the relatively lower treatment temperature. The catalyst was mixed with GDC to enhance the oxygen ion conductivity of the electrode, and the chemical reactivity between the LSCNM and GDC was examined to check for undesirable phase formations that could lead to performance degradation of the electrode (Fig. 1b). The mixture, annealed in air at 1000 °C for 1 h, exhibited XRD peaks of the perovskite LSCNM and fluorite GDC without any additional phase or peak shift, indicating negligible reactivity between the LSCNM and GDC.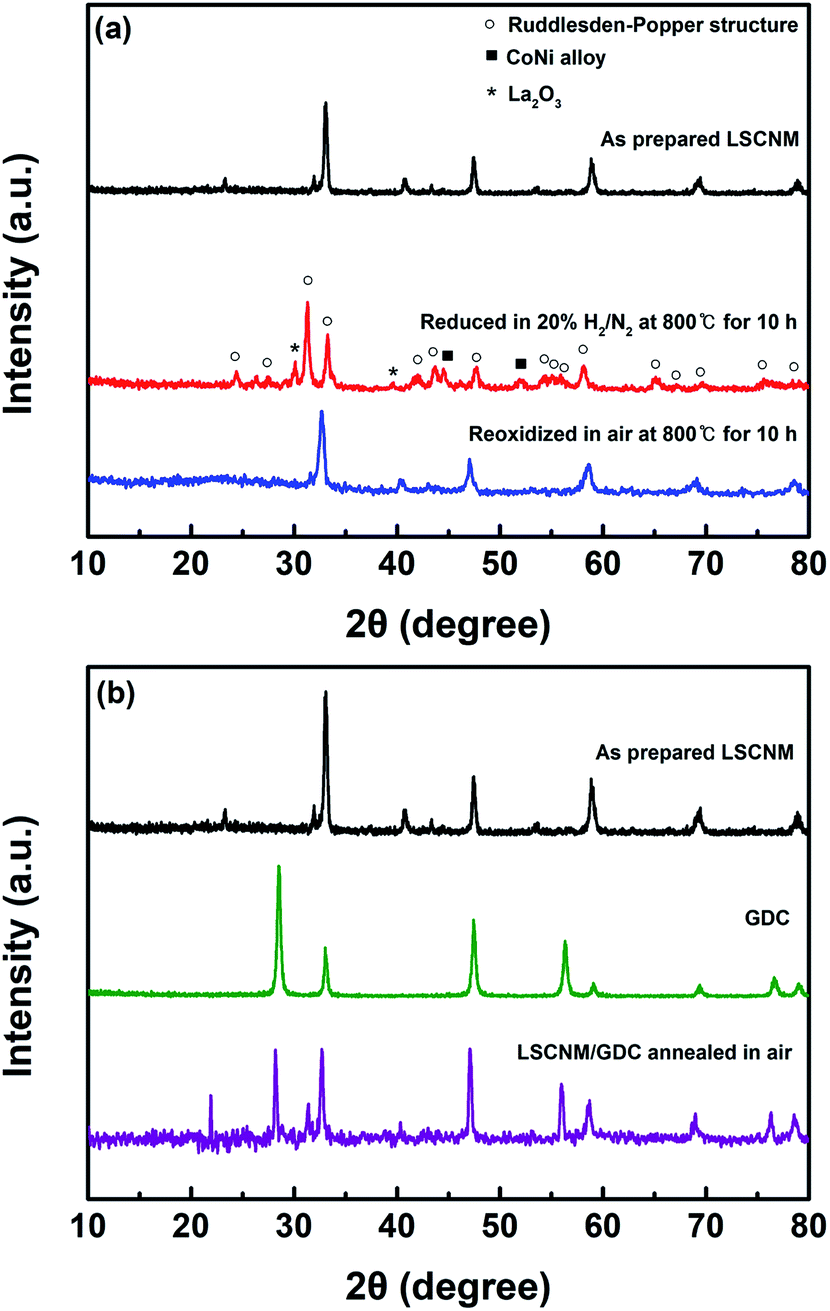 | ||
| Fig. 1 XRD patterns of (a) LSCNM perovskite with redox treatment and (b) LSCNM mixed with GDC after heat treatment in air at 1000 °C for 1 h. | ||
The surface morphologies of LSCNM and CoNi-R.P.LSCM were examined by SEM, as shown in Fig. 2. No metal nanoparticles were observed on the surface of the perovskite LSCNM sample (Fig. 2a). After exposure to a reducing atmosphere, CoNi alloy nanoparticles with diameters of approximately 10–30 nm were clearly observable, and they were uniformly distributed on the surface of the R.P.LSCM support (Fig. 2b). The morphological characteristics of CoNi alloy nanoparticles were further examined with TEM and EDS (Fig. 2c). La, Sr, Co, Ni, and Mn were found to be present in CoNi-R.P.LSCM. Furthermore, Co (green) and Ni (pink) elements were displayed with strong intensity in a ratio of 6:4 over the nanoparticle. Based on this information, the phase transition equation from LSCNM to CoNi-R.P.LSCM can be derived as follows:
 | (1) |
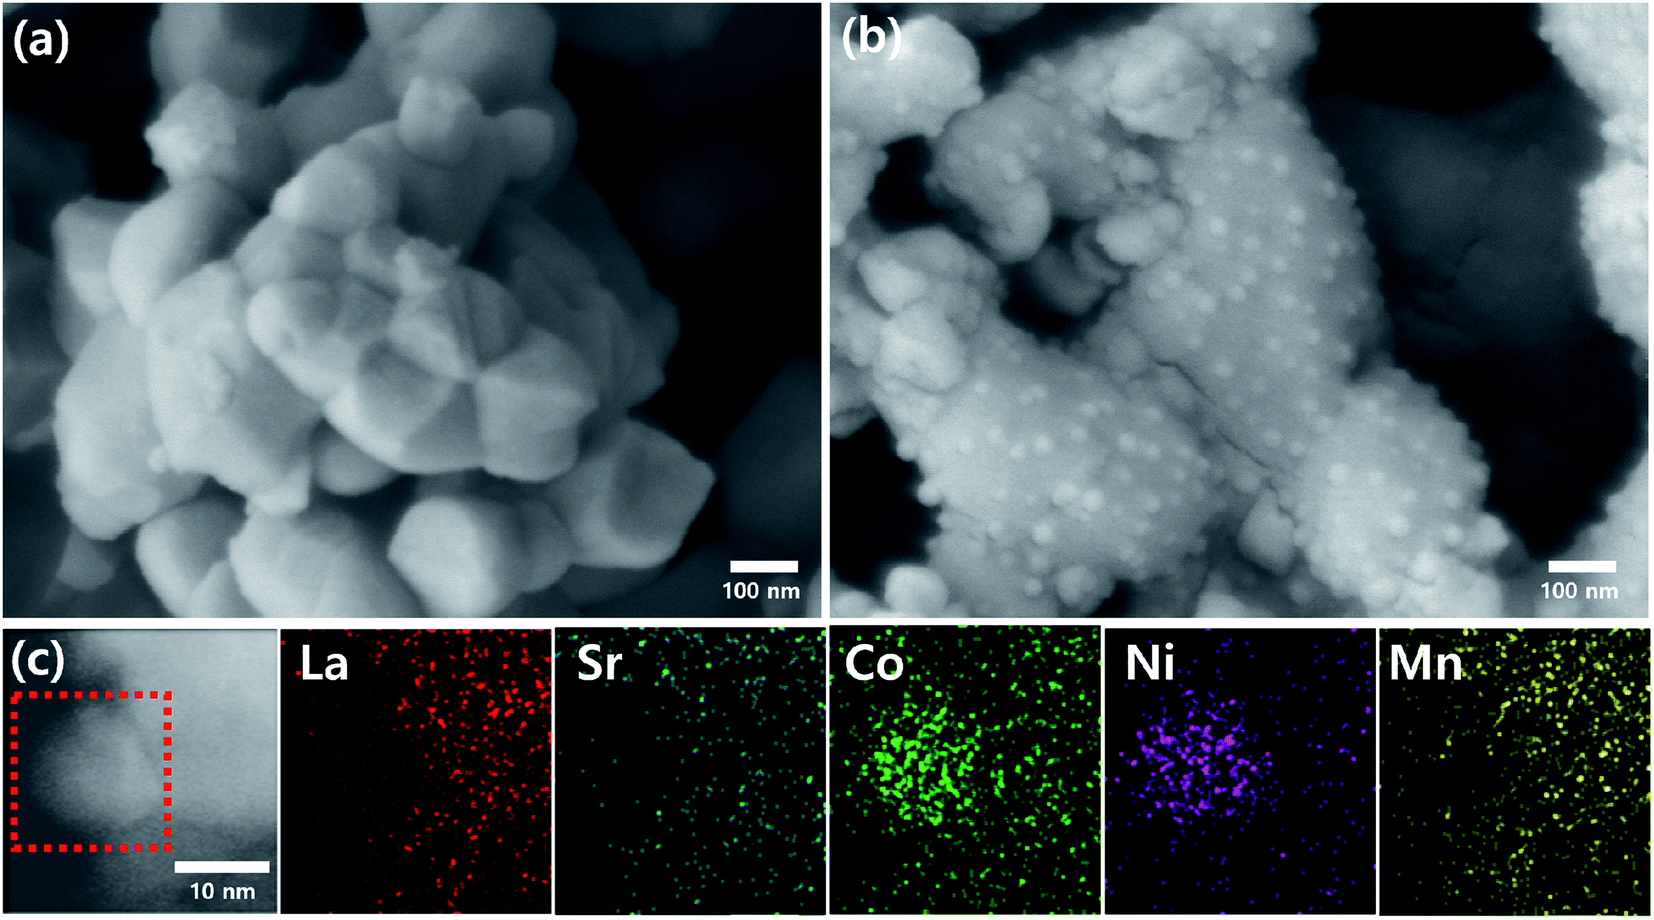 | ||
| Fig. 2 SEM images of (a) as-prepared LSCNM and (b) CoNi-R.P.LSCM. (c) TEM and EDS elemental mappings of (La, Sr, Co, Ni, Mn) of the CoNi-R.P.LSCM powder. | ||
The previously proposed exsolution mechanism represents four processes: cation diffusion, reduction, nucleation, and particle growth.42 In the case of LSCNM, the Co and Ni cation species first diffuse from the bulk phase to the surface of the LSCNM, and they are subsequently reduced to the metallic phase. The reduced Co and Ni species are combined into small nanoparticles. As Co and Ni have low Tamman temperatures of 604 °C and 590 °C, respectively,43 atoms in the particles have sufficient mobility at 800 °C to form uniformly distributed alloy nanoparticles of Co and Ni.
The local electronic and geometric structures of the Co, Ni, and Mn were investigated by XANES spectra that were recorded at the Co K-edge, Ni K-edge, and Mn K-edge (Fig. 3). For the Co K-edge, the LSCNM, CoNi-R.P.LSCM, and R.P.LSCM, together with the reference samples of Co metal, CoO (99.9%, Sigma Aldrich), Co3O4 (99.0%, Alfa Aesar), and LaCoO3, are included in Fig. 3a. In the Co K-edge XANES graphs, significant differences between the LSCNM (blue) and CoNi-R.P.LSCM (black) were observed, suggesting that the electronic and structural environments of Co in the catalysts were changed during the reduction process. To verify the relative composition of Co species in the CoNi-R.P.LSCM sample, a linear combination fitting (LCF) analysis with XANES spectra was conducted (Fig. S2†). Approximately 63.6% of Co exists as a metal phase, and the remaining 36.4% has the Ruddlesden–Popper structure. This is close to the theoretical ratio for Co species (Co in metal:Co in R.P. = 6:4), which can be calculated from eqn (1). The Ni K-edge XANES graph of CoNi-R.P.LSCM (black) appears to be similar to that of Ni0 (purple), as shown in Fig. 3b, because Ni species are present only in the CoNi alloy nanoparticles and not in the Ruddlesden–Popper support. For the Mn K-edge (Fig. 3c), the spectrum of CoNi-R.P.LSCM (black) seems to differ from that of the LSCNM (blue), indicating that the geometric structures and electronic characteristics of Mn were changed from those in the sample before the reduction treatment.
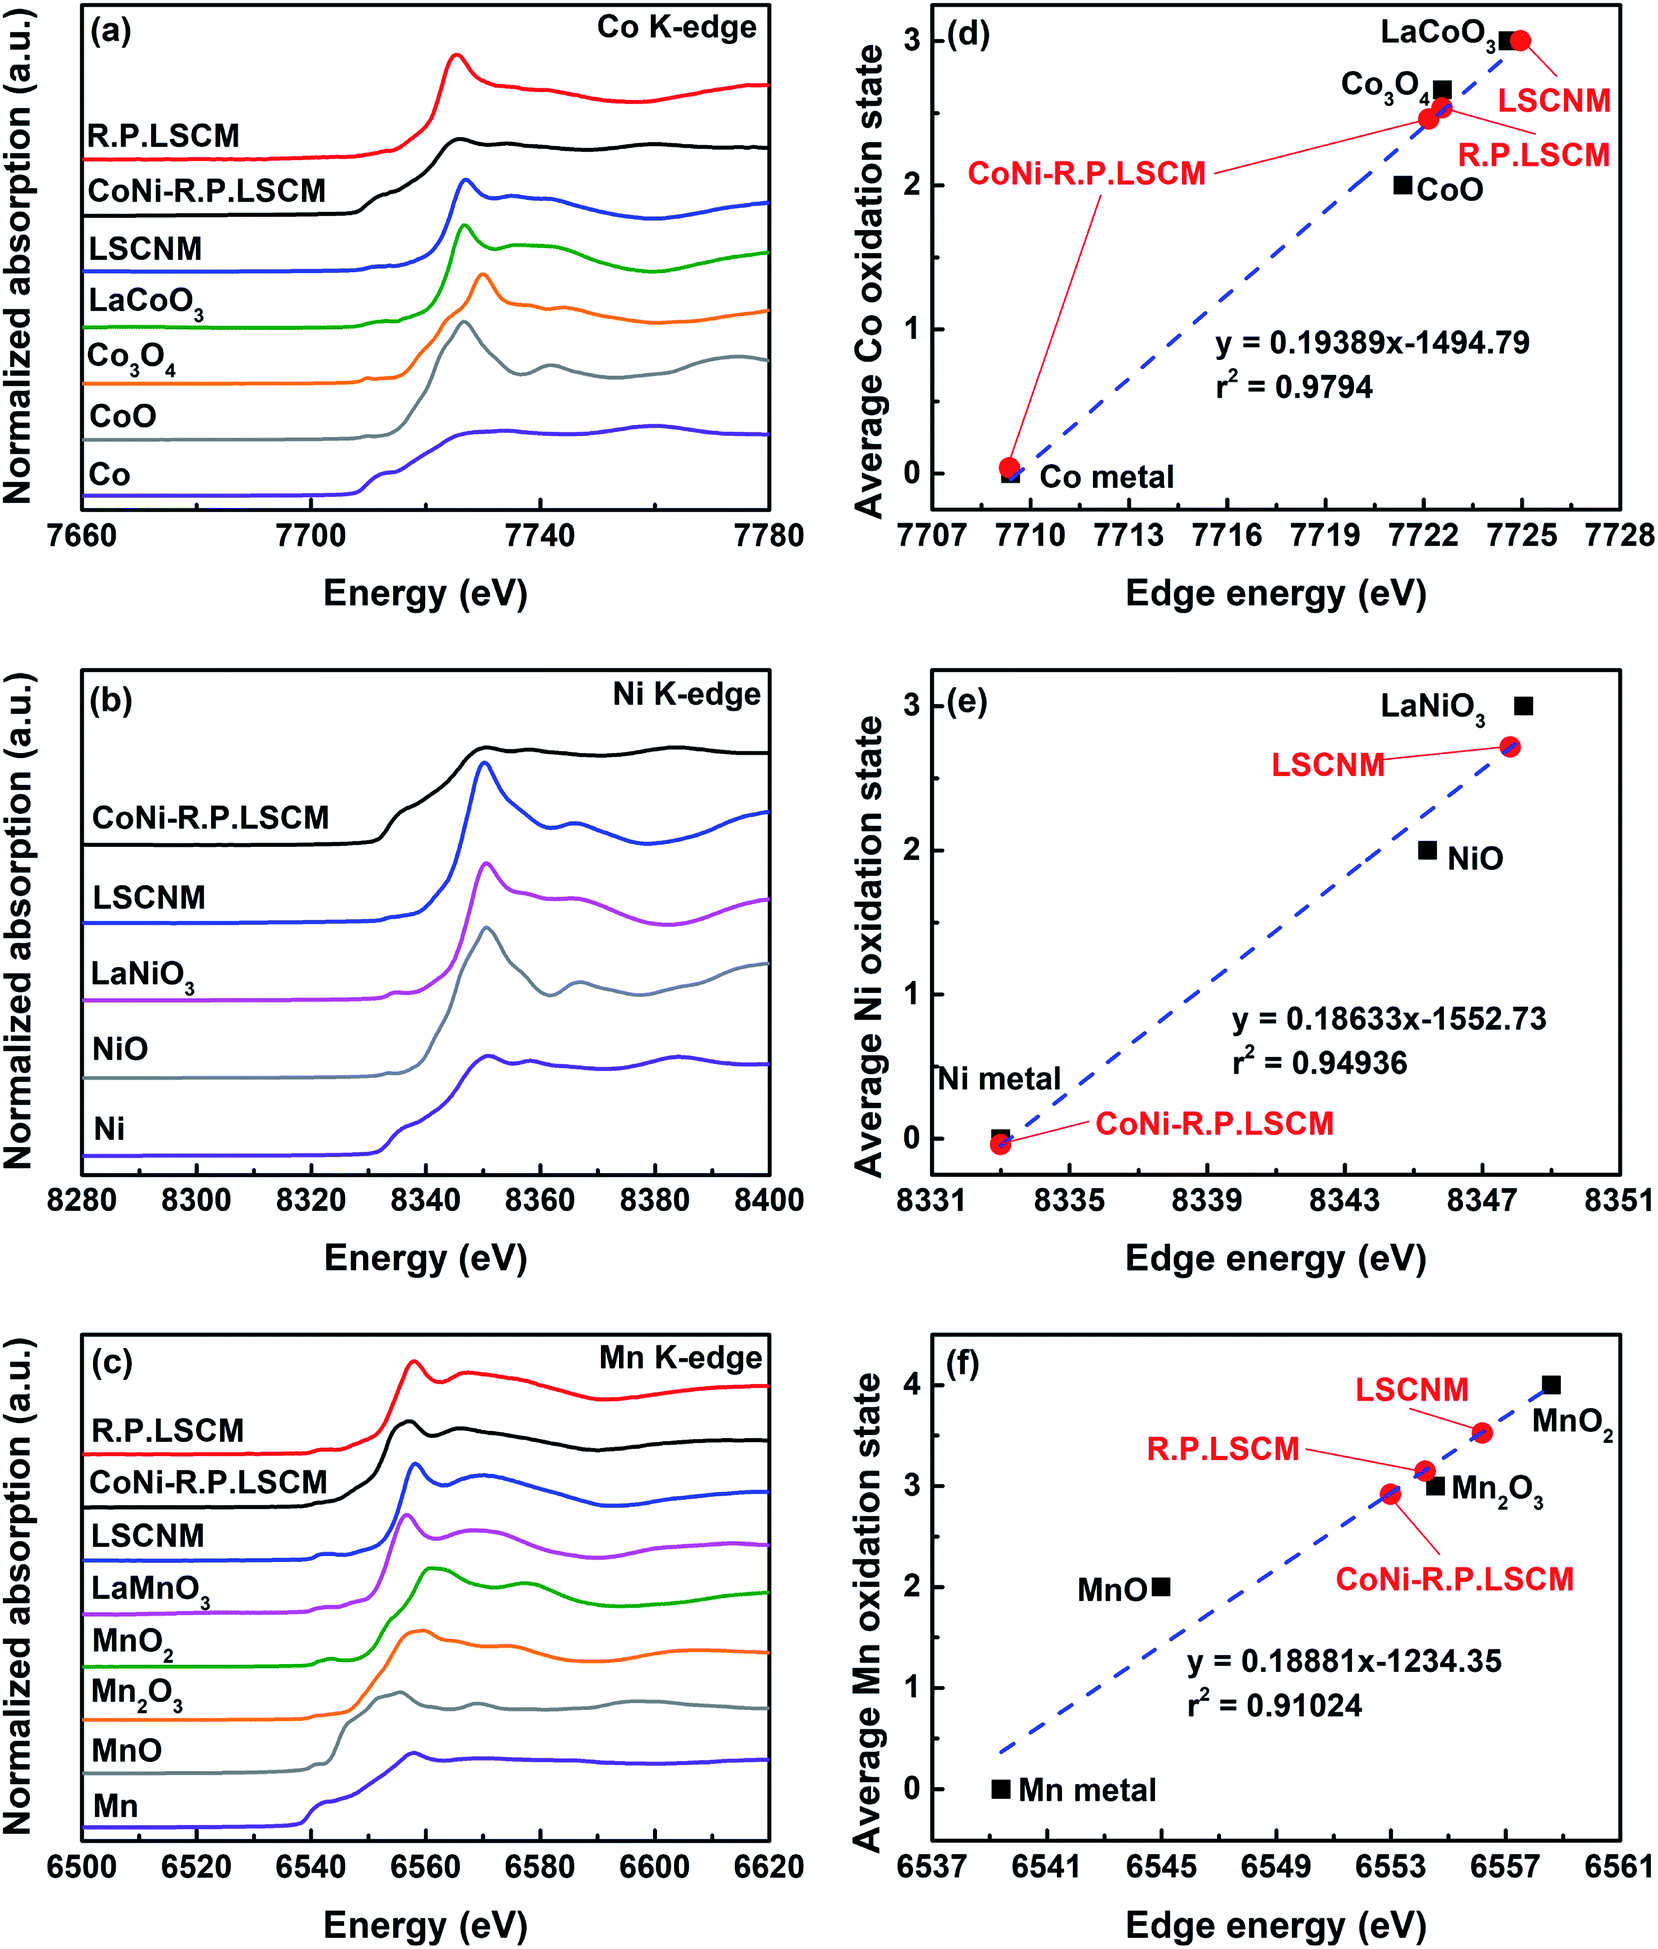 | ||
| Fig. 3 XANES spectra of the (a) Co K-edge, (b) Ni K-edge, and (c) Mn K-edge in LSCNM and Co-R.P.LSCoMn together with those of Co, CoO, Co3O4, LaCoO3, R.P.LSCM, NiO, LaNiO3, MnO, Mn2O3, MnO2, and LaMnO3 as standard references. The average oxidation states of (d) Co, (e) Ni, and (f) Mn as a function of the edge energy. | ||
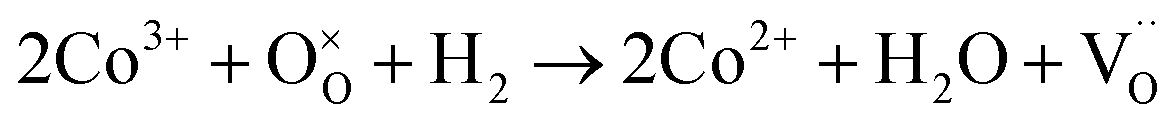
The number of oxygen vacancies is very important for good cathode catalyst materials.31,32,44,45 For the CO2 electrolysis reaction, high oxygen ion conductivity is required for oxygen ions to be efficiently transferred to the electrolyte. Furthermore, the oxygen vacancy sites formed on the surface of the catalysts can act as host sites for the adsorption of CO2 molecules. To verify the average oxidation state of B-site elements and confirm oxygen vacancy formation in the CoNi-R.P.LSCM, XANES analysis was performed again. Linear calibration between the edge positions and the known oxidation states of reference samples was carried out to estimate the oxidation state of the B-site elements. Co species in the CoNi-R.P.LSCM showed two edge positions, which corresponded to the oxidation numbers of 0 and 2.458. The zero-oxidation state could come from the CoNi alloy nanoparticles, and the oxidation number of 2.458 could be attributed to the Co species present in the Ruddlesden–Popper support (Fig. 3d). According to the linear calibration using reference compounds, the oxidation states of the Co and Mn species seem to decrease from 3.002 to 2.458 for Co, and from 3.523 to 2.918 for Mn during the phase transition from LSCNM to CoNi-R.P.LSCM (Fig. 3d and f). For the Ni case, CoNi-R.P.LSCM shows an edge position that corresponds to the zero-oxidation state because Ni species are present only in the form of metallic nanoparticles (Fig. 3e). From the assumption that the crystal structure maintains electrical neutrality, the non-stoichiometry of oxygen (δ) in the catalyst can be calculated by using the average oxidation state of the B-site elements. The calculated δ value was approximately 0.033 for the Ruddlesden–Popper support in the CoNi-R.P.LSCM, indicating that oxygen vacancies existed and they could play a role in improving catalytic activity.45 Using the oxidation state value of B-site elements as summarized in Table S1,† the total reduction process for Co, Ni, and Mn during the phase transition from LSCNM to CoNi-R.P.LSCM could be given as the following eqn (2)–(4):
 | (2) |
 | (3) |
 | (4) |
TGA measurements were conducted in the temperature range of 30–850 °C under the reducing gas conditions of 20% H2/N2 to investigate the phase transition temperature and the amount of oxygen vacancies around the temperature of CO2 electrolysis (Fig. 4a). The weight of LSCNM decreased as the temperature increased, which was mainly caused by the escape of oxygen from the lattice. There are two weight reduction regions at approximately 250 to 400 °C and 550 to 650 °C. The first weight reduction region could be ascribed to the oxygen loss from the lattice of the LSCNM perovskite structure, as confirmed by Fig. S3a.† In the temperature range of 550 to 650 °C, the weight loss of the catalyst could be attributed to the additional oxygen escape from the lattice during the phase transition to the CoNi-R.P.LSCM Ruddlesden–Popper structure, as described in eqn (1). The CoNi-R.P.LSCM phase was stably maintained at temperatures of 650 °C or higher (Fig. S3a†). Fig. 4b shows the weight change in CoNi-R.P.LSCM powder over varied temperatures under an air atmosphere. The weight of the CoNi-R.P.LSCM appeared to return to its original value as the temperature increased. The CoNi-R.P.LSCM sample maintained its structure up to 700 °C, and then showed a phase transition to LSCNM perovskite above 700 °C (Fig. S3b†). Based on the TGA measurements, a weight change of 6.97% occurred from the redox process in the LSCNM sample. Assuming that the weight decrease was mainly caused by the escape of oxygen from the lattice, a non-stoichiometry δ of 0.230 could be obtained at 850 °C, which is much larger than that of the calculated value from the XANES analysis. At high temperatures, the liberation of adsorbed oxygen and lattice oxygen is promoted under reducing gas conditions, resulting in a larger value of δ.
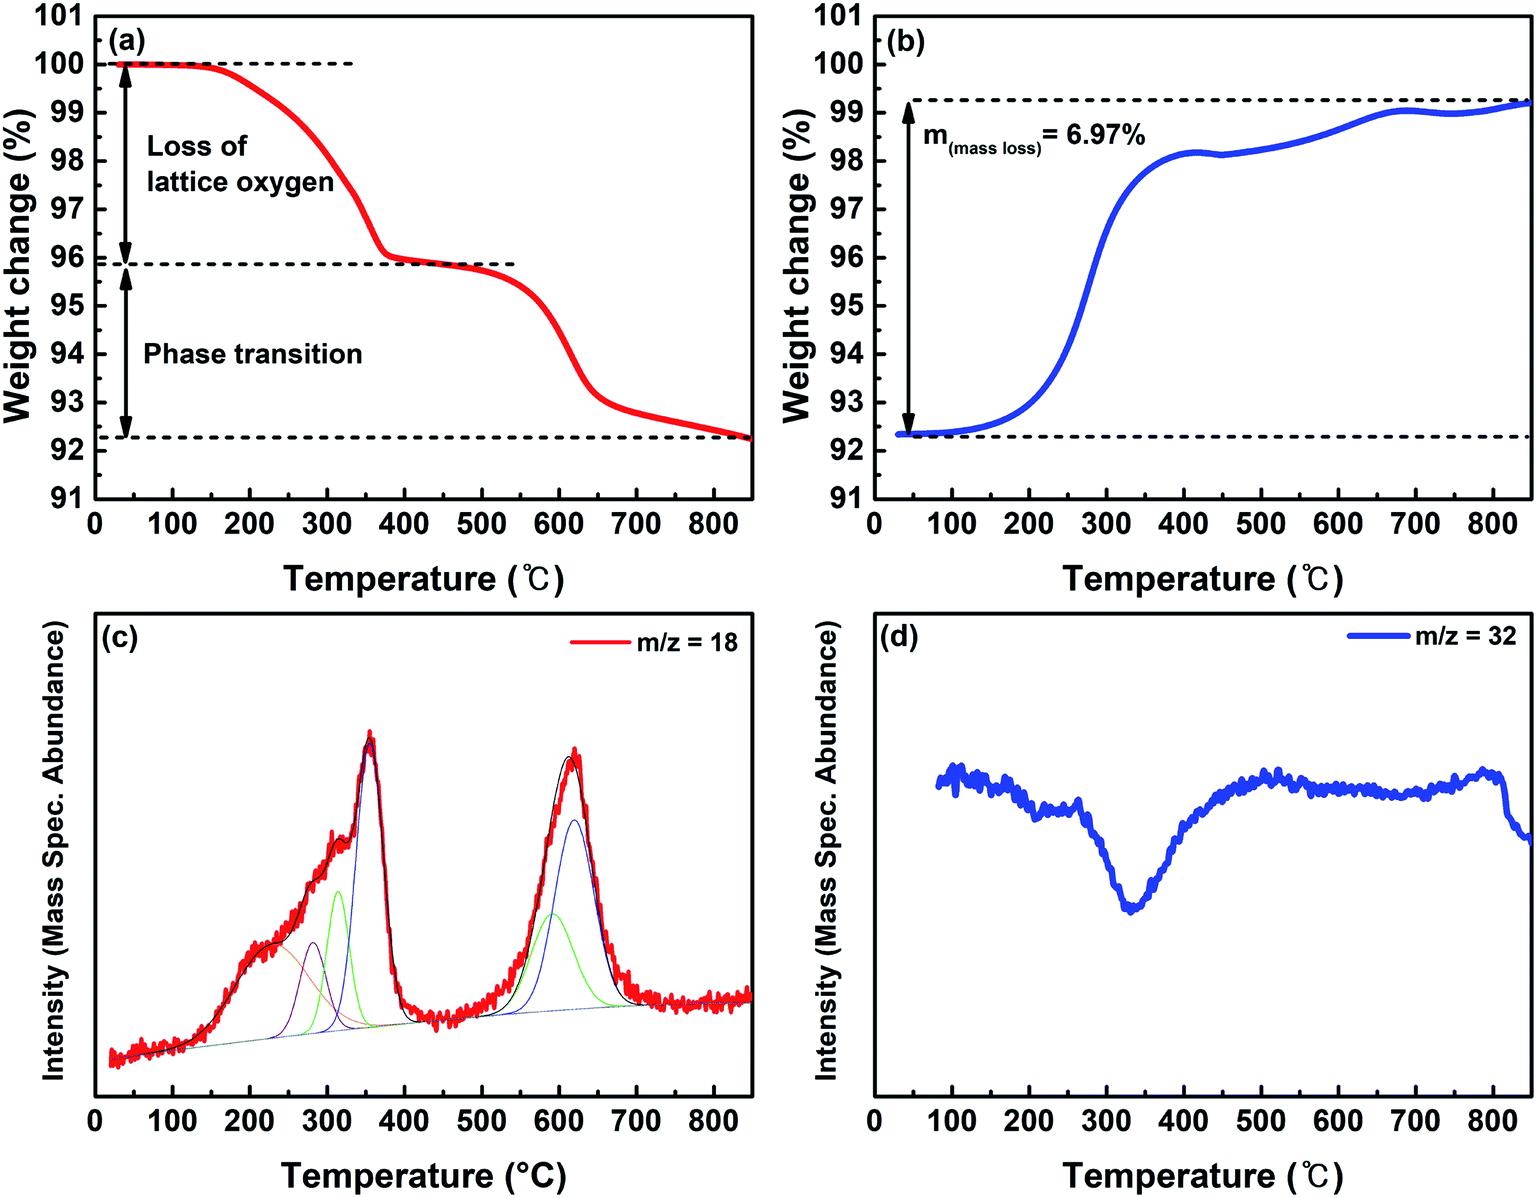 | ||
| Fig. 4 TGA analyses of (a) LSCNM in the 20% H2/N2 reducing atmosphere and (b) CoNi-R.P.LSCM under ambient air and a temperature range of 30–850 °C. (c) H2-TPR profile for the LSCNM and (d) O2-TPO profile for the CoNi-R.P.LSCM in a temperature range of 30–850 °C. | ||
Fig. 4c shows the H2-TPR profile of the as-prepared LSCNM powder, which exhibits two major reduction peaks by consuming the H2 with oxygen species on the sample to form H2O. The first peak in the temperature range of 100–450 °C can be deconvoluted into four minor peaks, as represented in Fig. S4a.† The first minor peak (orange) is presumably due to the reduction of adsorbed oxygen or the evolution of adsorbed H2O molecules. The other peaks should be caused by the reduction processes of B-site elements of the LSCNM, leading to the escape of lattice oxygen, as shown in eqn (5)–(7).
 | (5) |
 | (6) |
 | (7) |
The Mn4+ in the LSCNM is first reduced to Mn3+ at a temperature of 300 °C or lower,46 and then, the third (green) and the fourth peak (blue) can be attributed to the reductions of Ni3+ and Co3+ to Ni2+ and Co2+, respectively.47,48 The second major reduction peak in the temperature range of 550–700 °C was caused by the reduction processes of Ni2+ and Co2+ to Ni0 and Co0, along with the structural transition to Ruddlesden–Popper and the evolution of exsolved metal nanoparticles. Moreover, the positions of the two major reduction peaks are in good agreement with the weight loss positions observed in the TGA analysis (Fig. 4a), revealing that the reduction of B-site elements is responsible for the escape of lattice oxygen. Using the assumption that the area of each peak represents the amount of H2O produced by the reduction process of B-site elements, the ratio of the produced H2O from each element can be calculated as 1:0.47:0.16 for Co:Ni:Mn. This ratio is comparable with 1:0.54:0.18 for Co:Ni:Mn which was obtained from eqn (2)–(4). Fig. 4d represents the TPO profile of CoNi-R.P.LSCM, revealing two regions with decreased oxygen amounts in temperature ranges of 250–400 °C and 800 °C or higher, which almost corresponded to the weight increase profiles observed from the TGA result in Fig. 4b.
Fig. 5 shows the electrical conductivity measured over the synthesized catalysts under various gas conditions with temperature. When measured in air, the catalyst represents the form of the LSCNM perovskite with a conductivity value of 161 S cm−1 at 850 °C (Fig. 5a). This value is higher than that for La0.6Sr0.4Co0.7Mn0.3O3, which is the Ni un-doped catalyst.39 This is possibly because Ni is doped into the Co sites, leading to the additional formation of electron holes, as shown by eqn (8).
 | (8) |
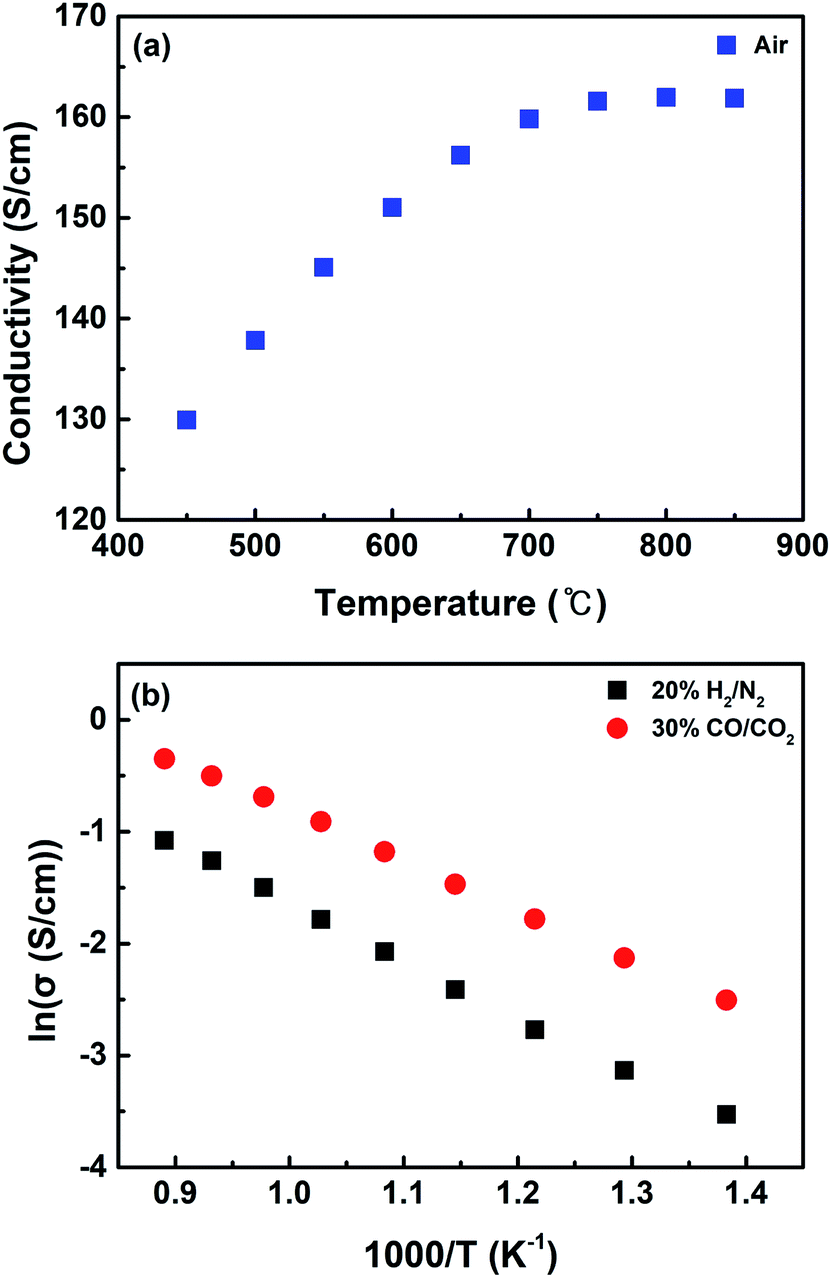 | ||
| Fig. 5 Electrical conductivity of (a) LSCNM measured in air and (b) CoNi-R.P.LSCM measured in 20% H2/N2 and 30% CO/CO2 in a temperature range of 450–850 °C. | ||
Under the reducing atmosphere (20% H2/N2), the CoNi-R.P.LSCM catalyst exhibited typical semiconductor-like behavior, as its conductivity increased with increasing temperature, like other Ruddlesden–Popper structures (Fig. 5b).33,39 The conductivity of CoNi-R.P.LSCM was 0.17 S cm−1 at 850 °C, which is smaller than that of normal perovskite materials. This is presumably because the Ruddlesden–Popper structure (A2BO4) has fewer B-site elements that can contribute to the conductivity and catalytic activity of AxByOz ceramic materials than the perovskite structure (ABO3).31,49,50 The conductivity of the catalyst measured under the gas conditions for CO2 electrolysis is also displayed in Fig. 5b. The catalyst showed a conductivity similar to that measured under reducing conditions, implying that the catalyst exists in the form of CoNi-R.P.LSCM and not in the form of LSCNM under the CO2 electrolysis gas conditions. This is possibly because of the very low oxygen partial pressure value of 3.45 × 10⁻¹⁷ atm at 30% CO/CO2 gas composition, which is calculated by the equilibrium constant at 850 °C.
The electrochemical characteristics (I–V curves) of a single cell with the CoNi-R.P.LSCM/GDC cathode for the CO2 electrolysis reaction are given in Fig. 6a. The negative current density region represents the power consumption as the CO2 molecules are decomposed into CO in the SOEC mode, and the positive current density region suggests power generation from the use of CO molecules as fuel in the SOFC mode. The single cell shows current density values of 703, 423, and 298 mA cm−2 at 850, 800, and 750 °C, respectively, under a voltage of 1.3 V, which are higher values than those previously reported for ceramic-based materials from which the cobalt or nickel component was exsolved (Table S2†). In particular, compared with Co-R.P.LSCoMn that has the same ceramic support structure (La1.2Sr0.8Co0.4Mn0.6O4), CoNi-R.P.LSCM showed better CO2 electrolysis performance which is possibly due to the effect of CoNi alloy nanoparticles and the larger formation of oxygen vacancies. The nonstoichiometry values (δ) of oxygen for CoNi-R.P.LSCM were 0.033 and 0.230 in this work based on the XANES and TGA experiments, respectively, while they were 0.020 (δXANES) and 0.200 (δTGA) for Co-R.P.LSCoMn, in our previous work.39 The current density at the same voltage was larger at higher temperatures. The CO2 electrolysis reaction could be promoted because of the relatively fast reaction kinetics and a small overpotential on the cathode at high operating temperatures.51 Furthermore, the oxygen vacancies formed on the surface of the catalyst at higher temperatures can accommodate and activate more CO2 molecules, facilitating electrolysis.31,32 The electrochemical performance of the single cell with the CoNi-R.P.LSCM/GDC cathode was further investigated by EIS at different temperatures, as shown in Fig. 6b. The first intercept value of the curve with the x-axis represents the ohmic resistance Rs, which is mainly attributed to the electrolyte and the interfacial contact between the electrolyte and the electrode.33,52 The polarization resistance Rp is the value of the difference between the two intercepts across the x-axis in the low-frequency and high-frequency regions.33,52 This value is mainly contributed by the interfacial oxygen ion exchange and charge transfer reaction, which is affected by oxygen ion conductivity and the triple phase boundary sites (TPBs).33,52 Both resistance values decreased when the temperature was increased, possibly due to the increased charge transfer properties, such as improved conductivity and fast reaction kinetics.
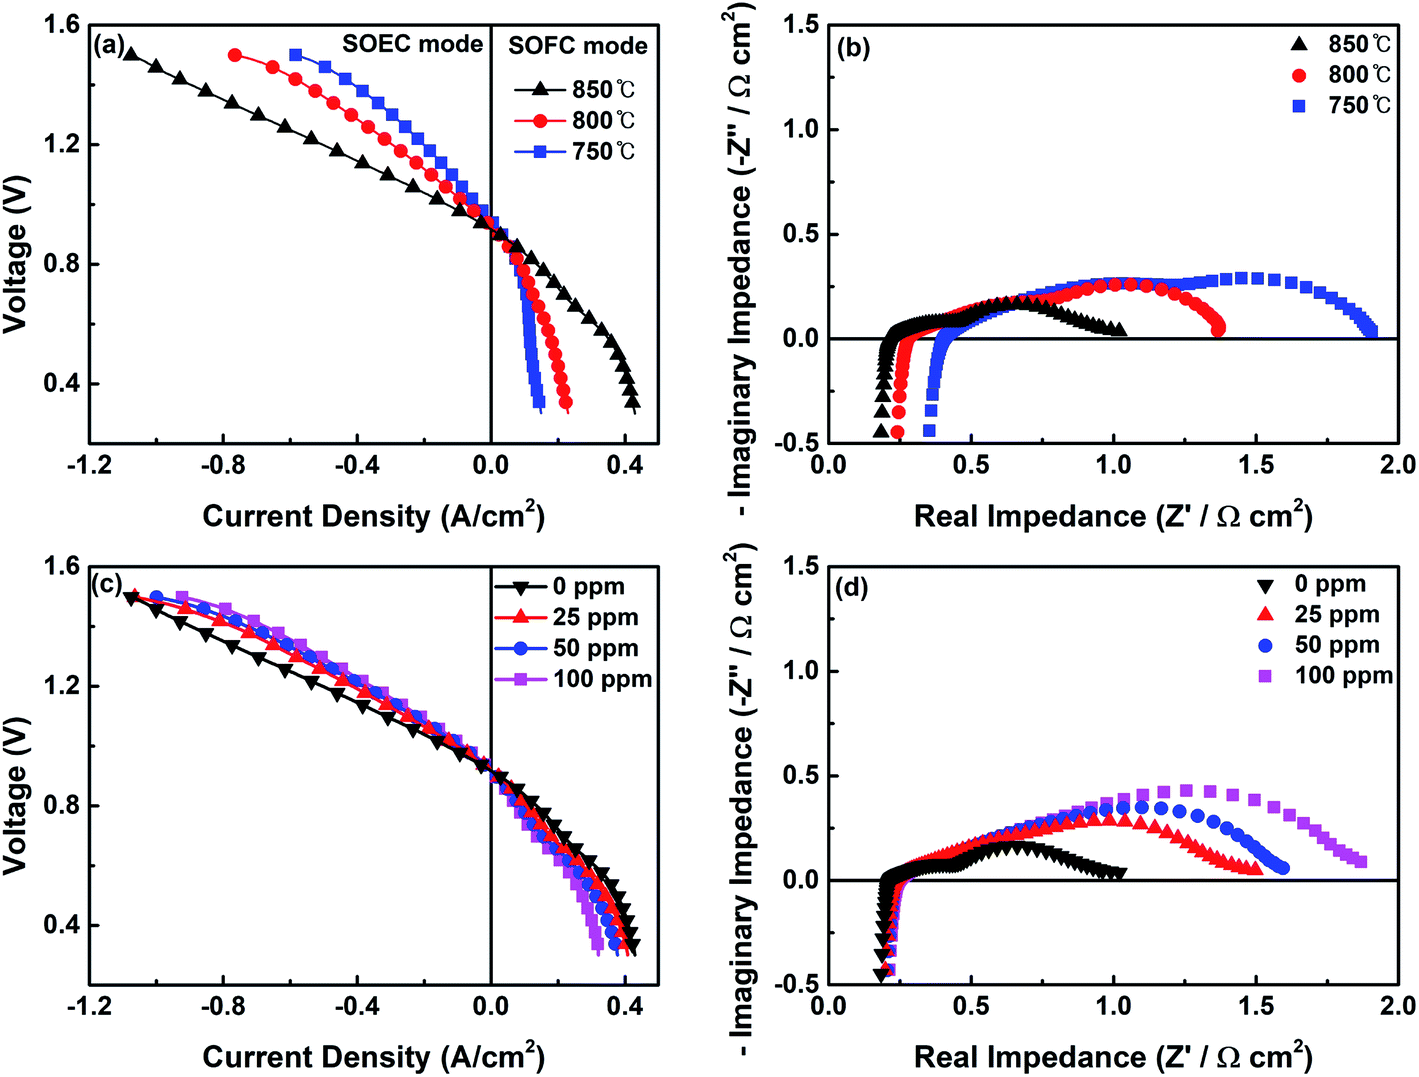 | ||
| Fig. 6 (a) Current–voltage curves for the CO2 electrolysis of the single cell with the CoNi-R.P.LSCM cathode under 30% CO/CO2 flow and (b) the corresponding EIS curves. (c) Current–voltage curves and (d) EIS curves of the single cell using the reaction gas streams that contain different concentrations of H2S. | ||
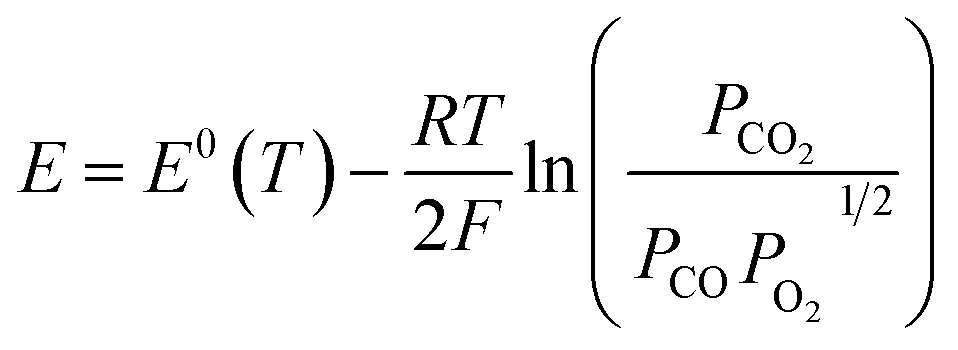
The electrochemical performance of the single cell with the R.P.LSCM/GDC cathode without CoNi alloys was also investigated, as shown in Fig. S5.† The OCV values were measured to be 0.917 V and 0.894 V for the CoNi-R.P.LSCM and R.P.LSCM cathode, respectively. Both values seem to be slightly smaller than the corresponding standard potentials for CO2 electrolysis [E0(T) = 0.957 V at 850 °C]. The partial pressures of each gas species involved in the reaction could contribute to the relatively lower potential values than the standard potential.53
 | (9) |
Compared with CoNi-R.P.LSCM, a relatively low current density value of 424 mA cm−2 was obtained at 1.3 V and 850 °C for R.P.LSCM (Fig. S5a†). Moreover, the R.P.LSCM/GDC cathode cell had a larger Rp value at 850 °C than the CoNi-R.P.LSCM (Fig. S5b†). These results imply that the presence of the CoNi alloy nanoparticles should contribute to the enhanced electrochemical performance. To investigate the effect of exsolved CoNi alloy nanoparticles on the R.P.LSCM support, CO2-TPD experiments on the CoNi-R.P.LSCM and R.P.LSCM samples were conducted (Fig. S6†). Both catalysts showed a CO2 desorption peak at approximately 700–800 °C, which is generally found in La- and Sr-based ceramic materials.27,54 The CO2 desorption peak position appeared at higher temperatures for the catalyst with exsolved nanoparticles, indicating that the CO2 molecules could be more strongly adsorbed on the surface of the CoNi-R.P.LSCM. This result may be attributed to the newly provided adsorption sites at the interface between the exsolved nanoparticles and the ceramic support.27 Moreover, the adsorption capacity of CO2 per unit area of the CoNi-R.P.LSCM, which indicates the peak area, appears to be relatively larger than that of the R.P.LSCM possibly due to the effect of the newly provided adsorption sites formed by the exsolved nanoparticles.
Fig. 6c and d show I–V and EIS curves of the single cell fabricated with the CoNi-R.P.LSCM/GDC cathode under the reaction gas conditions of 30% CO/CO2 with H2S. The electrochemical CO2 electrolysis of the cases with gas containing H2S exhibited a slight performance degradation with increased Rp values, as compared with the case of H2S-free gas. At a higher H2S content, the poisonous adsorption of sulfur onto the TPBs, which is detrimental to CO2 adsorption, may have a significant influence on the charge transfer resistance, leading to low CO2 electrolysis performance and high Rp. Fig. 7a exhibits the production rates of CO and the corresponding faradaic efficiencies at the applied voltages (vs. OCV). For the cases both with and without H2S, the amount of CO produced by the electrolysis of CO2 increased as the applied voltage was increased until 0.6 V (vs. OCV), and appeared to decrease at 0.8 V. This might be attributed to the damage to the electrode under high applied voltage.39,55 Both CO production rate and faradaic efficiency values remain still very high even under the presence of 100 ppm of H2S. To examine the long-term stability and the sulfur tolerance of the cathode, voltage values were investigated as a function of time at a constant applied current density of 700 mA cm−2 (Fig. 7b). During the initial operation under H2S-free gas, a voltage value of approximately 1.5 V was maintained without any sign of performance degradation, demonstrating that the CoNi-R.P.LSCM cathode is quite stable under the CO2 electrolysis conditions. More interestingly, stable voltage values were also obtained even in the reaction gas mixtures that contained various levels of H2S; this result implies that the CoNi-R.P.LSCM is quite a robust cathode catalyst, even under the CO2 gas conditions that contain H2S. To confirm the chemical reactivity between H2S and the CoNi-R.P.LSCM, an H2S poisoning test was conducted on the CoNi-R.P.LSCM. The CoNi-R.P.LSCM sample was exposed to 100 ppm H2S/N2 gas at 850 °C for 10 h, and then analyzed by XRD, as shown in Fig. S7.† No additional secondary phases or noticeable peak shifts were observed in the XRD analysis, even after exposure to H2S, indicating that the chemical reactivity between H2S and the CoNi-R.P.LSCM was negligible. In the SEM images (Fig. S8†), the CoNi-R.P.LSCM did not show any observable microstructure change before and after poisoning. Fig. S9† shows the TPO profiles of the Ni/GDC and the CoNi-R.P.LSCM after the poisoning test. The Ni/GDC exhibited a peak for SO2 evolution in the temperature range of 400–600 °C, which was attributed to the oxidation of adsorbed sulfur species. However, the CoNi-R.P.LSCM did not show such a peak corresponding to SO2 in the same temperature range, indicating that the CoNi-R.P.LSCM was much less susceptible to the adsorption of sulfur species than Ni/GDC (Fig. S10†). All these results suggest that the CoNi-R.P.LSCM developed in this study could provide an opportunity to be applied as a promising cathode catalyst for CO2 electrolysis with a good electrochemical performance and a high degree of stability, even for CO2 gas containing H2S.
 | ||
| Fig. 7 (a) Production rate of CO at different applied potentials and the corresponding faradaic efficiency and (b) voltage profile of the single cell with the CoNi-R.P.LSCM cathode at the constant current density of 700 mA cm−2 at 850 °C and using the reaction gas (30% CO/CO2) streams that contain different H2S contents. | ||
4. Conclusions
We developed a new, efficient catalyst with in situ grown CoNi alloy nanoparticles on a Ruddlesden–Popper support for use as a cathode material in SOECs. The catalyst was prepared by reducing the perovskite derivative of LSCNM in a 20% H2/N2 flow at 800 °C and exhibited good reversibility of structural transitions between the reduction and re-oxidation processes. The single cell fabricated with the CoNi-R.P.LSCM cathode showed a high current density of 703 mA cm−2 at a voltage of 1.3 V and a temperature of 850 °C, with a maximum faradaic efficiency of 97.8%. The in situ exsolved CoNi alloy nanoparticles and high oxygen vacancy content were responsible for the outstanding catalytic activity in CO2 electrolysis. More importantly, the CoNi-R.P.LSCM cathode also exhibited excellent durability in galvanostatic tests under CO2 gas streams containing poisonous H2S gas, with no phase change even at 100 ppm H2S/N2 gas exposure. With high H2S tolerance and good electrochemical performance in CO2 electrolysis, the CoNi-R.P.LSCM could be a promising cathode material for SOECs for practical applications under sulfur-containing CO2 gas conditions.Conflicts of interest
There are no conflicts to declare.Acknowledgements
This research was supported by the Basic Science Research Program through the National Research Foundation of Korea (NRF) funded by the Ministry of Science and ICT (NRF-2017R1A2B2012318), and also by the Korea Institute of Energy Technology Evaluation and Planning (KETEP) and the Ministry of Trade, Industry & Energy (MOTIE) of the Republic of Korea (20172010106300).References
- Y. Wang, T. Liu, L. Lei and F. Chen, Fuel Process. Technol., 2017, 161, 248–258 CrossRef CAS.
- G. Tsekouras and J. T. S. Irvine, J. Mater. Chem., 2011, 21, 9367–9376 RSC.
- Y. Zheng, J. Wang, B. Yu, W. Zhang, J. Chen, J. Qiao and J. Zhang, Chem. Soc. Rev., 2017, 46, 1427–1463 RSC.
- L. Zhang, S. Hu, X. Zhu and W. Yang, J. Energy Chem., 2017, 26, 593–601 CrossRef.
- A. Hauch, A. Hagen, J. Hjelm and T. Ramos, J. Electrochem. Soc., 2014, 161, F734–F743 CrossRef CAS.
- T. S. Li, H. Miao, T. Chen, W. G. Wang and C. Xu, J. Electrochem. Soc., 2009, 156, B1383–B1388 CrossRef CAS.
- M. Gong, X. Liu, J. Trambly and C. Johnson, J. Power Sources, 2007, 168, 289–298 CrossRef CAS.
- P. Boldrin, E. Ruiz-Trejo, J. Mermelstein, J. M. B. Menendez, T. R. Reina and N. P. Brandon, Chem. Rev., 2016, 116, 13633–13684 CrossRef CAS.
- K. Sasaki, K. Susuki, A. Iyoshi, M. Uchimura, N. Imamura, H. Kusaba, Y. Teraoka, H. Fuchino, K. Tsujimoto, Y. Uchida and N. Jingo, J. Electrochem. Soc., 2006, 153, A2023–A2029 CrossRef CAS.
- Z. Cao, L. Fan, G. Zhang, K. Shao, C. He, Q. Zhang, Z. Lv and B. Zhu, Catal. Today, 2019, 330, 217–221 CrossRef CAS.
- S. Zha, P. Tsang, Z. Cheng and M. Liu, J. Solid State Chem., 2005, 178, 1844–1850 CrossRef CAS.
- S. Wang, M. Liu and J. Winnick, J. Solid State Electrochem., 2001, 5, 188–195 CrossRef CAS.
- A. Tomita, K. Tsunekawa, T. Hibino, S. Teranishi, Y. Tachi and M. Sano, Solid State Ionics, 2006, 177, 2951–2956 CrossRef CAS.
- Y. Li, X. Chen, T. Yang, Y. Jiang and C. Xia, ACS Sustainable Chem. Eng., 2017, 5, 11403–11412 CrossRef CAS.
- Y. Wan, Y. Xing, Y. Li, D. Huan and C. Xia, J. Power Sources, 2018, 402, 363–372 CrossRef CAS.
- Y. Li, Y. Li, Y. Wan, Y. Xie, J. Zhu, H. Pan, X. Zheng and C. Xia, Adv. Energy Mater., 2019, 9, 1803156 CrossRef.
- R. Mukundan, E. L. Brosha and F. H. Garzon, Electrochem. Solid-State Lett., 2004, 7, A5–A7 CrossRef CAS.
- L. Aguilar, S. Zha, Z. Cheng, J. Winnick and M. Liu, J. Power Sources, 2004, 135, 17–24 CrossRef CAS.
- Y. Li, Y. Gan, Y. Wang, K. Xie and Y. Wu, Int. J. Hydrogen Energy, 2013, 38, 10196–10207 CrossRef CAS.
- R. Xing, Y. Wang, Y. Zhu, S. Liu and C. Jin, J. Power Sources, 2015, 274, 260–264 CrossRef CAS.
- A. Jun, J. Kim, J. Shin and G. Kim, Angew. Chem., Int. Ed., 2016, 55, 12512–12515 CrossRef CAS PubMed.
- X. Zhang, L. Ye, J. Hu, W. Jiang, C. J. Tseng and K. Xie, Electrochim. Acta, 2016, 212, 32–40 CrossRef CAS.
- Y. Gan, Q. Qin, S. Chen, Y. Wang, D. Dong, K. Xie and Y. Wu, J. Power Sources, 2014, 245, 245–255 CrossRef CAS.
- D. Neagu, T. Oh, D. N. Miller, H. Menard, S. M. Bukhari, S. R. Gamble, R. J. Gorte, J. M. Vohs and J. T. S. Irvine, Nat. Commun., 2015, 6, 8120 CrossRef.
- Y. Li, B. Hu, C. Xia, W. Q. Xu, J. P. Lemmon and F. Chen, J. Mater. Chem. A, 2017, 5, 20833–20842 RSC.
- Y. F. Sun, Y. Q. Zhang, J. Chen, J. H. Li, Y. T. Zhu, Y. M. Zeng, B. S. Amirkhiz, J. Li, B. Hua and J. L. Luo, Nano Lett., 2016, 16, 5303–5309 CrossRef CAS.
- L. Ye, M. Zhang, P. Huang, G. Guo, M. Hong, C. Li, J. T. S. Irvine and K. Xie, Nat. Commun., 2018, 8, 14785 CrossRef PubMed.
- H. Li, G. Sun, K. Xie, W. Qi, Q. Qin, H. Wei, S. Chen, Y. Wang, Y. Zhang and Y. Wu, Int. J. Hydrogen Energy, 2014, 39, 20888–20897 CrossRef CAS.
- W. Qi, K. Xie, M. Liu, G. Wu, Y. Wang, Y. Zhang and Y. Wu, RSC Adv., 2014, 4, 40494–40504 RSC.
- J. Zhang, K. Xie, Y. Zhang, L. Yang, G. Wu, Q. Qin, Y. Li and Y. Wu, RSC Adv., 2014, 4, 22697–22709 RSC.
- S. Liu, Q. Liu and J. L. Luo, ACS Catal., 2016, 6, 6219–6228 CrossRef CAS.
- S. Liu, Q. Liu and J. L. Luo, J. Mater. Chem. A, 2016, 4, 17521–17528 RSC.
- Y. S. Chung, T. Kim, T. H. Shin, H. Yoon, S. Park, N. M. Sammes, W. B. Kim and J. S. Chung, J. Mater. Chem. A, 2017, 5, 6437–6446 RSC.
- X. Huang, T. H. Shin, J. Zhou and J. T. S. Irvine, J. Mater. Chem. A, 2015, 3, 13468–13475 RSC.
- Y. Chen, B. Qian, G. Yang, D. Chen and Z. Shao, J. Mater. Chem. A, 2015, 3, 6501–6508 RSC.
- J. Zhou, G. Chen, K. Wu and Y. Cheng, J. Power Sources, 2014, 270, 418–425 CrossRef CAS.
- Y. Ling, F. Wang, Y. Okamoto, T. Nakamura and K. Amezawa, Solid State Ionics, 2016, 288, 298–302 CrossRef CAS.
- E. S. Raj, K. F. E. Pratt, S. J. Skinner, I. P. Parkin and J. A. Kilner, Chem. Mater., 2006, 18, 3351–3355 CrossRef CAS.
- S. Park, Y. Kim, H. Han, Y. S. Chung, W. Yoon, J. Choi and W. B. Kim, Appl. Catal., B, 2019, 248, 147–156 CrossRef CAS.
- B. S. Kwak, J. Y. Do, N. K. Park and M. Kang, Sci. Rep., 2017, 7, 16370 CrossRef.
- D. Neagu, G. Tsekouras, D. N. Miller, H. Menard and J. T. S. Irvine, Nat. Chem., 2013, 5, 916–923 CrossRef CAS PubMed.
- Y. Gao, D. Chen, M. Saccoccio, Z. Lu and F. Ciucci, Nano Energy, 2016, 27, 499–508 CrossRef CAS.
- M. D. Argyle and C. H. Bartholomew, Catalysts, 2015, 5, 145–269 CrossRef CAS.
- M. Nolan, J. Phys. Chem. C, 2009, 113, 2425–2432 CrossRef CAS.
- D. Lee and H. N. Lee, Materials, 2017, 10, 368 CrossRef PubMed.
- J. Zhang, Y. Li, L. Wang, C. Zhang and H. He, Catal. Sci. Technol., 2015, 5, 2305–2313 RSC.
- G. Zou, Y. Xu, S. Wang, M. Chen and W. Shangguan, Catal. Sci. Technol., 2015, 5, 1084–1092 RSC.
- S. Zhong, Y. Sun, H. Xin, C. Yang, L. Chen and X. Li, Chem. Eng. J., 2015, 275, 351–356 CrossRef CAS.
- S. Liu, K. T. Chuang and J. L. Luo, ACS Catal., 2016, 6, 760–768 CrossRef CAS.
- Q. Liu, X. Dong, G. Xia, F. Zhao and F. Chen, Adv. Mater., 2010, 22, 5478–5482 CrossRef CAS PubMed.
- T. H. Shin, J. H. Myung, M. Verbraeken, G. Kim and J. T. S. Irvine, Faraday Discuss., 2015, 182, 227–239 RSC.
- Y. S. Chung, H. Kim, H. C. Yoon, J. S. Chung and N. M. Sammes, Fuel Cells, 2015, 15, 416–426 CrossRef CAS.
- M. Ni, J. Power Sources, 2012, 202, 209–216 CrossRef CAS.
- X. Zhang, Y. Song, F. Guan, Y. Zhou, H. Lv, Q. Liu, G. Wang and X. Bao, J. Power Sources, 2018, 400, 104–113 CrossRef CAS.
- Z. Pan, Q. Liu, R. Lyu and S. H. Chan, J. Power Sources, 2018, 378, 571–578 CrossRef CAS.
Footnote |
| † Electronic supplementary information (ESI) available. See DOI: 10.1039/c9ta07700f |
| This journal is © The Royal Society of Chemistry 2020 |