 Open Access Article
Creative Commons Attribution 3.0 Unported Licence
Shear driven vorticity aligned flocs in a suspension of attractive rigid rods†
Mohan
Das
 a,
Lucille
Chambon
 a,
Zsigmond
Varga
 b,
Maria
Vamvakaki
 a,
James W.
Swan
b and
George
Petekidis
 *a
*a
aIESL – FORTH and Department of Material Science and Technology, University of Crete, GR – 71110, Heraklion, Greece. E-mail: georgp@iesl.forth.gr
bDepartment of Chemical Engineering, Massachusetts Institute of Technology, Cambridge, MA 02139, USA
First published on 13th November 2020
Abstract
A combination of rheology, optical microscopy and computer simulations was used to investigate the microstructural changes of a semi-dilute suspension of attractive rigid rods in an imposed shear flow. The aim is to understand the relation of the microstructure with the viscoelastic response, and the yielding and flow behaviour in different shear regimes of gels built from rodlike colloids. A semi-dilute suspension of micron sized, rodlike silica particles suspended in 11 M CsCl salt solution was used as a model system for attractive rods’ gel. Upon application of steady shear the gel microstructure rearranges in different states and exhibits flow instabilities depending on shear rate, attraction strength, volume fraction and geometrical confinement. At low rod volume fractions, the suspension forms large, vorticity aligned, particle rich flocs that roll in the flow-vorticity plane, an effect that is due to an interplay between hydrodynamic interactions and geometrical confinement as suggested by computer simulations. Experimental data allow the creation of a state diagram, as a function of volume fraction and shear rates, identifying regimes of stable (or unstable) floc formation and of homogeneous gel or broken clusters. The transition is related to dimensionless Mason number, defined as the ratio of shear forces to interparticle attractive force.
Introduction
Colloidal suspensions have wide applications as rheological modifiers in various consumer care products such as paints,1 inks,2 resins,3 adhesives,4 cosmetics,5 pharmaceuticals and drug delivery systems,6etc. and for industrial processes such as water treatment,7 emulsification,8 paper and pulp treatment,9 concrete,10 drilling fluids,11etc. Changing the interparticle potential is a method to engineer complex colloidal structures paving the way for generating novel products with optimized mechanical properties, shelf-life, stability, etc.12 As model systems, colloidal rods provide, in addition to their spherical counterparts, an interplay between rotational and translational degrees of freedom and liquid crystalline mesophases and/or metastable states of isotropic or anisotropic glasses and gels.13–15 Furthermore external fields such as flow can induce structural changes in colloidal systems such as jamming,16 ordering,17,18 shear banding,19,20 slip,21 and shear melting (yielding)22 influencing their rheological response. For applications, understanding these changes is critical as structural changes during processing affects the performance of the end – product. Moreover, particles in viscoelastic polymeric media exhibit rich structures under shear, often relevant in industrial applications. For example vorticity aligned structure have been revealed through butterfly scattering patterns in polymer melts doped by colloidal particles,23 and in suspensions in associative polymers.24Colloidal gels formed by aggregation of colloidal particles when their attraction strength U, is larger than thermal energy kBT exhibit time dependent phenomena such as ageing25–27 and thixotropy28 and possess solid-like response and elasticity.29,30 At low particle volume fraction, colloidal gels subjected to external stresses can undergo shear driven aggregation,31,32 and other shear induced structural changes in the flow-vorticity plane,33,34 breakage of clusters,35,36 exhibit delayed yielding,37,38 collapse of the particle network and sedimentation.39,40 Due to their thixotropy, shear history can be used as a way to tune viscoelastic response of colloidal gels by controlling the structural heterogeneity by varying pre-shear rate and strain amplitude in steady shear or oscillatory shear respectively.41,42 These properties render model colloidal gels valuable in simulating more complex industrial formulations and processes.
Low particle volume fraction colloidal gels exposed to shear flow in a confined space can exhibit large heterogeneities in the form of anisotropic, particle-rich flocs shaped like “logs” rolling with axis perpendicular to the flow-gradient plane. This so-called log rolling phenomenon has been observed experimentally in a variety of colloidal systems such as carbon black particles, cellulose, carbon nanotubes, silica and alumina particles as well as in attractive emulsions.43–52 Understanding of this phenomenon is critical in applications where attractive colloidal suspensions flow through narrow channels such as a slurry of carbon black or graphene particles used in capacitive energy storage systems.53–55 Initial observations of vorticity aligned flocs were attributed to “hoop stresses” arising from elastic instabilities due to the soft viscoelastic domains within a fluid of lower viscoelasticity. Such stresses were caused by normal forces exerted by a growing particle floc in the flow-gradient plane that is restricted within the rheometer gap. This confinement eventually results in the growth of the particle floc in the flow-vorticity plane.43,44 However, it is not clear how particle flocs remain stable while undergoing shear flow and what is the relation between the particle concentration, attraction strength and gap in the flow geometry, remaining a subject of interest.52 Recently Brownian dynamics simulations showed that this phenomenon arises due to a coupling between hydrodynamic interactions (HI) and the confining boundaries for a system of attractive particles,56 whereas instead in the absence of HI particles arrange themselves into sheets. The dimensionless ratio of hydrodynamic drag force due to shear to the interparticle attraction force (known as Mason number) can be used to define the boundaries of a stability diagram that relates shear rates and gaps necessary to observe stable vorticity aligned flocs. This response is also demonstrated in recent experiments with attractive spherical particles of different sizes and attraction strength.57
Dispersions of attractive rod-shaped colloids with high aspect ratio have a lower percolation threshold than spherical colloids and possess the additional control parameter of orientation which depends on the aspect ratio.58 Hard, attractive rods of length L and diameter D, exhibit Diffusion Limited Cluster Aggregation (DLCA) at significantly lower particle volume fractions compared to spheres and can form stable gels in the semi-dilute regime (Vrod/L3 < φ < Vrod/L2D).58–63 Furthermore, at high volume fractions (φ ≫ Vrod/L2D), rod shaped colloids can form glasses and liquid crystalline phases with short or long range orientational as well as positional order following Onsager's prediction of structural phase transitions.13,64–67 These properties make rod-shaped colloids useful in the field of advanced materials and for various optical applications.68–70 Considering the rich microstructural and rheological information available for colloidal gels made of spherical particles that have considerable scientific and practical implications, it is of interest to explore the dynamics and structure of colloidal gels made up of shape anisotropic particles such as rods.
Microscopic silica rods have been used as model systems to study the dynamics and phase behaviour of rod-like colloidal dispersions.71 Due to their relatively low dispersity in size, high aspect ratio and spherocylindrical shape, they exhibit all the phases associated with hard, rod-like systems.72 Furthermore, due to their microscopic size, they are useful in quantitative 3D real-space studies in concentrated phases at a single particle level73 not easy with other model rod-like particles such as FD-virus74 where scattering techniques are more widely used.75
In this paper we study the effects of external shear (imposing different shear rates) on the structure and the subsequent mechanical response of an attractive rod suspension consisting of micron sized silica rods dispersed in a concentrated salt solution. We mainly focus on the investigation of the conditions and mechanisms related with the formation of vorticity aligned clusters, as a consequence of shear melting (yielding) of rodlike colloidal gels in confined geometries. To this end rods of intermediate aspect ratio (= 10) are utilized while effort has been made to experimentally probe structures at different length-scales in order to most efficiently and comprehensively reveal any shear induced structural formations. For this we use a combination of rheometry and optical techniques such as dark-field microscopy and fluorescent confocal microscopy. The mechanisms of yielding and flow of the attractive rod suspension and the structural relaxation after shear cessation are explored through these methods. Such attractive rod suspensions exhibit flow instabilities at low shear rates arising from a competition between attraction forces and shear under confinement leading to the formation of large heterogeneities and vorticity aligned “log-rolling” clusters. Based on these quantities a state diagram was created describing how rod volume fraction and Mason number affect the evolution of the microstructure in shear flow.
Materials and methods
Silica rod synthesis
Bare and fluorescently coated silica rods were synthesized using a well-established wet chemical synthesis method.71 Here it is possible to control the rod aspect ratio by changing the concentration of the reagents as well as the reaction time. The method has comparatively high yield which allows studies on concentrated dispersions. Details regarding the rod synthesis are provided in ESI.†The rods have an average length, L = 4.36 μm with a length polydispersity of 18% and an average aspect ratio of 10 (Fig. S1, ESI†). We assume the rods to be cylinders with spherical end caps and calculate the volume of the rod, Vp = (π/4)LD2 + (π/6)D3. From this we calculate the theoretical overlap volume fraction, φ* (= Vp/L3) which was found to be 0.008. The density of the rods was found to be 1.98 g cm−3 (Fig. S2, ESI†).
Sample preparation
A suspending medium for the silica rod suspension was prepared by dissolving CsCl salt (Honeywell, ≥99.9%) in Milli-Q water so as to prepare a 65 wt% (11 M) solution. The density, and viscosity of the prepared CsCl solution was measured using combined oscillating U-tube density meter (DMA 4100 M, Anton Paar) and microviscometer (Lovis 2000 ME, Anton Paar) setup and found to be 1.91 g cm−3 and 1.238 mPa s respectively. Refractive index was measured using a refractometer (Atago 3T, 52422) and found to be 1.41. Silica rods dried under vacuum for 12 hours were mixed with 11 M CsCl solution to prepare a 4 vol% (or 4.16 wt%) suspension. The suspension was mixed overnight on a magnetic stirrer and placed in an ultrasonic bath for 10 minutes to ensure complete dispersion of individual silica rods.Interparticle attraction
The amount of salt added in the suspending medium ensures that electrostatic interactions are completely screened with a resultant Debye screening length, κe−1 < 1 nm. This ensures that the interparticle aggregation is driven by van der Waals attraction forces. All the rod suspensions prepared had rod concentration well below the isotropic–nematic transition point and hence we assume that the rods are randomly oriented. van der Waals attraction force for rod surfaces separated by a distance h ≪ D in a perpendicular to each other configuration, is given by76 | (1) |
We should also note that the sedimentation time over the length (≈5 μm) for a single rod parallel to its major axis in dilute solution is approximately 100 s, calculated based on the parallel friction coefficient for a rod,78
Rheo-optical characterization
All measurements were performed at 25 °C using a stress-controlled rheometer (MCR 302 WESP, Anton Paar) with glass cone–plate geometry (diameter: 40 mm, cone angle: 1.57°, truncation: 67 μm). Dodecane (Alfa Aeser, 99+%, with viscosity of 1.36 mPa s) was used as a solvent trap (as it is immiscible with water) to avoid sample evaporation by pouring it around the cone–plate geometry after sample loading. To estimate the shear rates at which we may expect that clusters will break apart we use the dimensionless ratio of the average viscous drag force felt by a rod moving with a velocity v to the average attractive force between two particles; as has been demonstrated for spherical particles with depletion attraction when this ratio, (called therein Pedep) is larger than one, the drag force exceeds interparticle attractions and clusters break down to individual particles.41,42,81 In other studies for attractive gels and magnetorheological fluids this ratio is called Mason number,53,82,83 Mn(= Fvisc/FA = 6πη0a2δ![[small gamma, Greek, dot above]](https://www.rsc.org/images/entities/i_char_e0a2.gif) /U) with U/δ being the interparticle attraction force. Below we use Mn to quantify the interplay between shear and attractive (van der Waals) forces; where for Mn > 1, we expect that bonds between individual rods to be broken and rods be fully dispersed (a necessary condition for sample rejuvenation). This requires a minimum steady shear rate of about 3200 s−1. As this is not possible due to experimental limitations; a maximum steady shear rate of 1000 s−1 applied for 600 seconds was used as rejuvenation protocol after which the sample was left at rest for another 5 seconds. This was followed by small amplitude oscillatory shear (γ = 0.1%, ω = 1 rad s−1) time sweep measurements performed for 2000 seconds and followed by a frequency sweep test (γ = 0.1%, ω = 0.1–100 rad s−1). After this, a strain sweep test (γ = 0.1–1000%, ω = 1 rad s−1) was performed followed by stress measurements at a variety of steady-state shear rates (0.06–100 s−1). The stress during start-up shear measurements at different imposed shear rates was also measured.
/U) with U/δ being the interparticle attraction force. Below we use Mn to quantify the interplay between shear and attractive (van der Waals) forces; where for Mn > 1, we expect that bonds between individual rods to be broken and rods be fully dispersed (a necessary condition for sample rejuvenation). This requires a minimum steady shear rate of about 3200 s−1. As this is not possible due to experimental limitations; a maximum steady shear rate of 1000 s−1 applied for 600 seconds was used as rejuvenation protocol after which the sample was left at rest for another 5 seconds. This was followed by small amplitude oscillatory shear (γ = 0.1%, ω = 1 rad s−1) time sweep measurements performed for 2000 seconds and followed by a frequency sweep test (γ = 0.1%, ω = 0.1–100 rad s−1). After this, a strain sweep test (γ = 0.1–1000%, ω = 1 rad s−1) was performed followed by stress measurements at a variety of steady-state shear rates (0.06–100 s−1). The stress during start-up shear measurements at different imposed shear rates was also measured.
We also use a rotational Peclet number, Per (= ![[small gamma, Greek, dot above]](https://www.rsc.org/images/entities/i_char_e0a2.gif) /Dr) to non-dimensionalize the applied shear rates, with the rotational diffusion coefficient of a rod defined by,84
/Dr) to non-dimensionalize the applied shear rates, with the rotational diffusion coefficient of a rod defined by,84
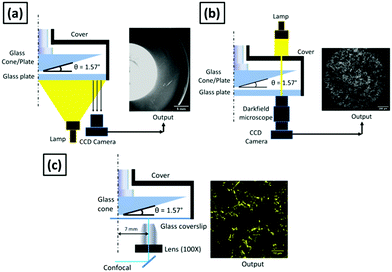
Different rheo-optical techniques were employed to capture changes in the suspension microstructure at various length scales (Fig. 1). First, a CCD camera (Grasshopper GRAS-14S3 M, Point Grey Research) was mounted below the glass base plate of the rheometer in order to capture one half of the top plate (dia = 40 mm) (Type A imaging). Second, the same camera was attached to a dark-field microscope (4.25×) mounted just below the bottom glass plate of the rheometer at a distance of 12.5 mm from the center (Type B imaging). Finally, to capture the microstructural changes at single particle level during shear, we combined the laser scanning confocal microscope (VT-Eye, Visitech International) with the rheometer (Type C imaging). Here the objective used was a Nikon oil-immersion type lens of 100× magnification with NA = 1.45 and a working distance of 130 μm inside the sample. The bottom glass base plate of the rheometer was replaced with a glass cover slip (diameter: 50 mm, thickness = 170 μm) to enable confocal microscopy, simultaneously with rheological tests.
A second set of rheo-optical measurements (Type A) were performed using a glass plate–plate geometry (diameter: 40 mm) at different gaps.
Brownian dynamics simulation
The recently developed positively-split Ewald (PSE) algorithm85,86 is employed to enable rapid simulation of colloidal particles with hydrodynamic interactions. In this method, objects such as rods are subdivided into spherical domains that interact via conservative, hydrodynamic, and Brownian forces. In this mode, the hydrodynamic and Brownian forces are accounted for using the Rotne–Prager–Yamakawa (RPY) formulation for the spherical domains. The method relies on a new formulation for Ewald summation of the RPY tensor, which guarantees that the real-space and wave-space contributions to the tensor are independently symmetric and positive-definite for all possible particle configurations. The computational complexity of the algorithm scales linearly with the number of spherical domains enabling hydrodynamic simulations with system sizes up to O (106) particles.In a given simulation Nrods rod like particles are modeled by connecting Nbeads spherical domains together in series with stiff and torsionally resistant springs to represent an individual stiff rod. The beads have mean particle radius, a, with an imposed polydispersity of σ = 5% to account for the slight roughness observed in the experimental rod system. Neighboring beads in a rod just touch at the extent of their hydrodynamic radius. The rods are made attractive through a short-ranged inter-particle attraction between beads of different rods and the beads exert a hard sphere-like repulsion when their hydrodynamic radii touch. This attraction is modeled using an Asakura–Oosawa form87 of width δ/a = 0.2 and characteristic depth U. For short-ranged attractions, of this form the potential is essentially linear between the point of inter-bead contact and the finite range of the attractive well. For the dispersions in the simulations we set the thermal energy scale to kBT = 0 as previous studies have observed log-rolling for both thermal and athermal systems. The strength of shear is varied by adjusting the strain rate and the dispersion is strained for up to γ = 300 strain units starting from a randomly dispersed configuration. As the system is athermal, the Mason number, Mn is used to control the shear force exerted on the particles. The spring stiffness holding beads together in a rod is always at least ten times higher than the shear strength to avoid any bending of the rods under flow. In the steady shear experiments, the flow Peclet number is larger than one, while the attractive forces are many time stronger than the thermal energy kBT (≈10kBT) so that the athermal approximation is a good one.
The dispersion is sheared employing Lees–Edwards boundary conditions in the flow–flow gradient direction.88 The aspect ratio of the simulated box in the gradient-vorticity direction is kept constant at 1 and the flow-gradient aspect ratio Axy is varied between 2.5 and 7.5 in order to resolve multiple, periodically spaced flocs. Confining walls along the flow-vorticity plane are represented by a hexagonal close packed lattice of particles connected to each other through rigid bonds. The walls interact hydrodynamically with particles of the colloidal dispersion and a stiff repulsion at contact identical to that between rods. This approach is a rather simplistic representation of confining walls, yet it effectively captures many features of the complex hydrodynamic interactions near walls.89 There are three layers of particles in each wall to ensure sufficient bending stiffness to resist buckling under shear. Two walls in the flow-vorticity plane define the boundaries of the sheared cell and their separation d the height of the confining gap. The specified volume fraction in simulations is given in terms of the total volume of beads relative to the sheared cell.
Results and discussion
Microstructure at quiescent state
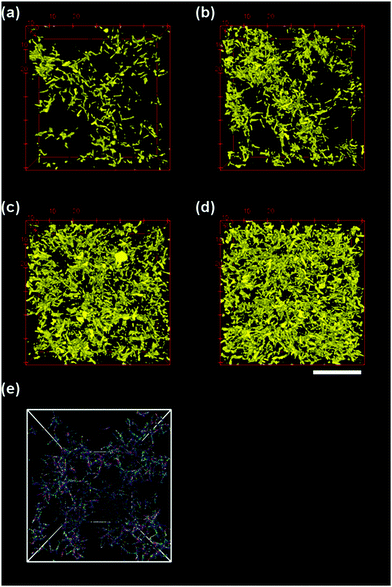
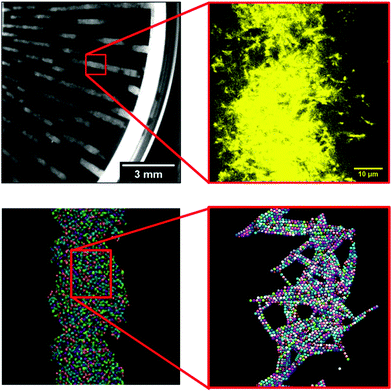
Three dimensional confocal micrographs were captured for the semi-dilute suspensions of silica rods in 11 M CsCl at volume fractions of φ/φ* = 0.5, 1, 2.5 and 5 (φ* = 0.008) after equilibration at room temperature (25 °C) for 30 minutes. This provided us microstructural information of the rod suspension in quiescent state (Fig. 2, top). Confocal micrographs revealed the formation of a three dimensional percolated network for all the rod volume fractions studied here. It is important to note that for the suspension at φ/φ* = 0.5 one may not expect to observe a percolated network, however, the rods used here have a length polydispersity of 18% and hence the calculated φ* is only an approximate average. At higher rod volume fractions, the suspension appears more homogeneous. Furthermore, it was found that there was no orientational ordering within the rod aggregates. Confocal micrographs captured over a period of 30 minutes at 600 second interval showed no significant microstructural changes and individual rods appeared to be kinetically arrested without exhibiting any local motion.A similar picture is revealed by the computer simulations (Fig. 2(e)) performed at a rod volume fraction φsim/φ* = 1.25 and 10kBT attraction strength per bead. Simulations are reproducing qualitatively the experimental picture, with the main finding that the rods structure so that they do not exhibit a high degree of alignment. The clusters of particles created by Diffusion Limited Aggregation (DLA) are quite fluffy and easily form a space spanning network.
Below we present the mechanical properties of such structures formed at quiescent conditions as well as the effect of steady shear rate in the formation of new shear induced metastable states.
Linear viscoelasticity and large amplitude oscillatory shear
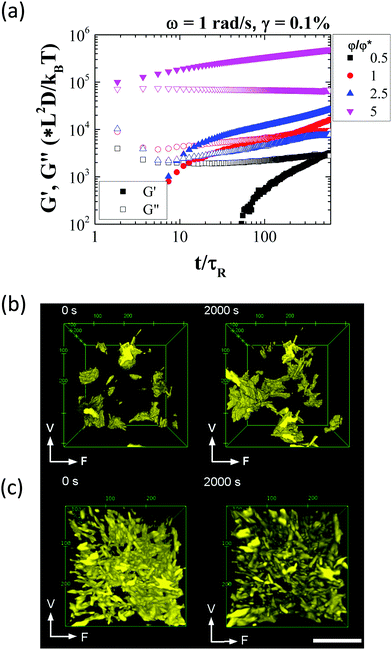
We first look at the linear viscoelastic response of the attractive rod suspension as a function of volume fraction using small amplitude oscillatory shear experiments immediately after steady shear rate rejuvenation. As a first step a dynamic time sweep (DTS) measurement was performed where the storage (G′) and loss moduli (G′′) were measured over a period of 2000 seconds after rejuvenation, to ensure that steady state was reached. This was followed by dynamic frequency sweep (DFS) and dynamic strain/amplitude sweep (DSS) measurements to probe both the particle dynamics at different time scales as well as to determine the upper limit of the linear viscoelastic window and the strain regime where yielding of the suspension takes place.The measurement time in the DTS measurement was normalized by the rotational relaxation time, τR (= 1/6Dr) and the shear modulus was scaled by the thermal energy density, kBT/(rod volume). All the suspensions exhibit ageing after rejuvenation (Fig. 3(a)). In the case of suspensions at φ ≤ φ*, a clear liquid to solid like transition was observed over time. Since the solvent is essentially Newtonian, the time evolution of the viscoelasticity (ageing) can be associated purely with the formation of a percolated structure aided by diffusion of the attractive rods. As more and more rods form connections over time, the structure evolves after shear cessation. At higher rod volume fractions this behaviour is weaker as rejuvenation does not result in significant change in the suspension microstructure and void volume fraction (or free volume between clusters) and hence the structure reforms faster and reaches a quasi-steady state in a shorter time.41 This picture is revealed during the DTS tests using three dimensional confocal microscope imaging where individual rod aggregates were observed to percolate over time (Fig. 3(b)) (check Video, ESI†). Therefore, the combined linear rheology and confocal microscopy suggests that as shear rejuvenation breaks down the structure only into smaller aggregates at low φ's these re-percolate slower after shear cessation. However, at higher φ's, due to the dense nature of the suspension, the initial re-percolation process is much quicker and is followed by a slower strengthening of the structure as a result of more local rearrangements and contact-driven ageing that was observed in systems with similar interactions.90
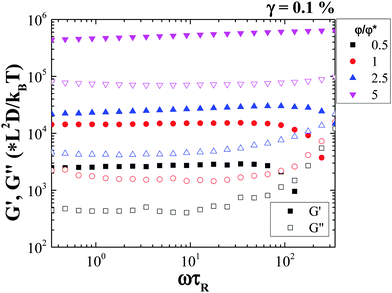
Frequency sweep measurements show that both G′ and G′′ are nearly independent of frequency, ω. The frequency of the measurement was rescaled with τR (as ω·τR) indicating we are accessing time scales below the single rod rotational relaxation time (Fig. 4). The measurement suggests that there are no relaxation processes associated with structural changes or rod rearrangements, at different time and length scales. This is consistent with the formation of a strong gel even at very low rod volume fractions.
 | ||
| Fig. 4 Dynamic frequency sweep measurements of the rod suspension at different rod volume fractions. | ||
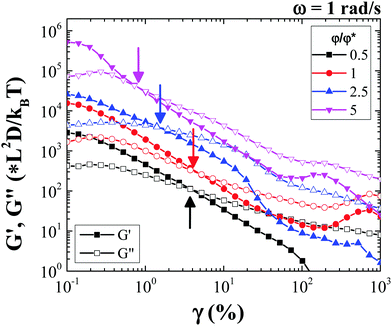
Amplitude sweep measurements performed at an angular frequency of 1 rad s−1 show that the rod gel network yields fully beyond a strain amplitude defined conventionally at the crossover of G′ and G′′. This yield point (G′(γy) = G′′(γy)) which is volume fraction dependent, is observed at strain amplitudes lower than 10% for all the rod volume fractions (Fig. 5), with the yield strain, γy decreasing with increasing rod volume fraction. Moreover, at low rod volume fractions the shear modulus, G′, shows a clear dependence on strain amplitude even before yielding, while for the higher rod volume fractions; a smaller yield strain indicates the formation of a more brittle gel. Studies on yielding in colloid polymer gels under oscillatory shear report that at high strain amplitudes the gel structure is broken and liquefied. However, at intermediate strain amplitudes, the gel structural heterogeneity increases, which eventually upon shear cessation results in a more heterogeneous and weaker gel.42 Note that the volume fraction dependence of G′ exhibits a power law slope which is almost half to that found for spherical particle gel as found by Shih et al.,29 while a qualitative agreement is also found in the decrease of the yield strain with φ as the system becomes more concentrated and more brittle (see Fig. S5, ESI†).
The investigation using confocal microscopy for the rod suspension undergoing oscillatory shear flow (Fig. S4, ESI†) shows that for low volume fractions (φ/φ* = 1) at low strain amplitudes (γ < γy), the percolated rod network undergoes reversible bending deformation, where clusters and gel strands bend back and forth, while internally individual rods rearrange reversibly under oscillatory shear (see confocal microscopy Video, ESI†). At large strain amplitudes (γ > γy) however, the percolated structure breaks and new larger and denser aggregates (as appear from microscopy images) are formed as a result of new bond formation between smaller neighbouring rod aggregates. In this way free volume (or void volume) between clusters increases. In the case of high rod volume fraction (φ/φ* = 5), at low strain amplitudes it was not possible to identify such local particle rearrangements. However, at high strain amplitudes individual rods within the aggregates were initially observed to undergo local angular displacements and at extremely large strain amplitudes, the gel structure gets ruptured (see Video, ESI†). Moreover, even at these large strain amplitudes, there is no flow-orientation of the rods.
The bending elasticity in colloidal aggregates formed by screening Coulomb interactions has been demonstrated in detail for spherical particles.90–93 Here however, in addition to contact bending stiffness witnessed in interparticle bonds formed by van der Waals attractions, particle orientation also plays a significant role in determining the bending (or flexure) modulus of the percolated structure and consequently in yielding of the rod gel.
The yielding mechanism can be contrasted with that reported by Mohraz and Solomon91 on gels of both spherical and rod-like colloids. For the higher volume fractions measured here, i.e. 2.5 and 5φ* (φ = 0.04 and 0.08), the structure of the gel network is such that there are no soft points on the backbone allowing angular rotation due to crowding by neighboring rods resulting in increased contact points per rod. The presence of multiple contact points per rod within the gel structure imparts a high bending elasticity of the gel network resulting in a brittle structure with a low yield strain.
At lower volume fractions, near the critical gelation point, the mechanism of yielding involves bending of the flexible gel backbone before rupturing. This flexibility arises mainly due to lower restrictions on individual rod motion in a less crowded environment allowing rotation of individual rods around specific soft points (as shown in the confocal Video in ESI†). Thus similarities with spherical particles DLCA gels maybe identified where relative angular rotation of a singly connected pair is allowed leading to unwinding of the backbone of a fractal cluster before rupturing.
Steady shear rheology
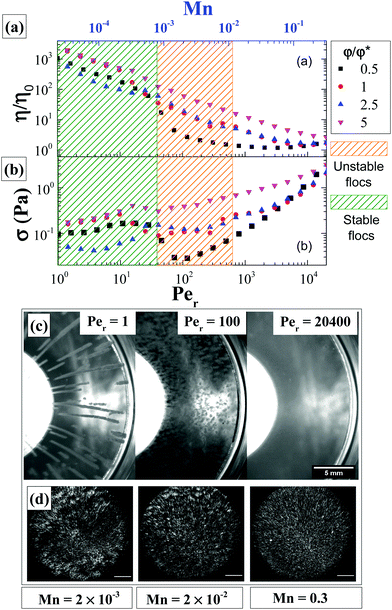
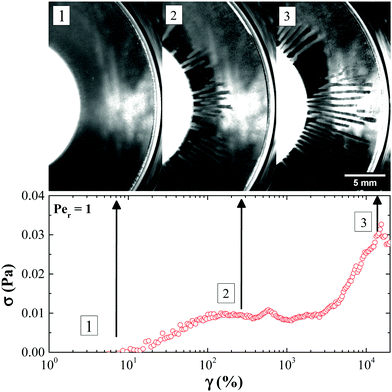
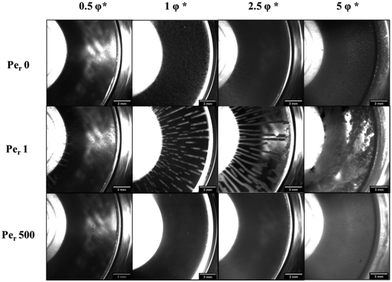
A similar start-up shear response is found at a volume fraction of 2.5φ*. However, at 5φ* this response was different (Fig. S5, ESI†). From macroscopic observations it was established that at this volume fraction there was no formation of log-rolling flocs (Fig. 8). These findings indicate the role of particle volume fraction in creating such heterogeneities. Similar volume fraction dependence of this phenomenon has been reported in other attractive systems of spherical colloids.49,50,52 Furthermore, we should keep in mind that the floc formation is initiated at the center of the cone–plate geometry where the gap is smaller and rods could experience confinement for the specific rod size.
Effect of confinement on floc formation
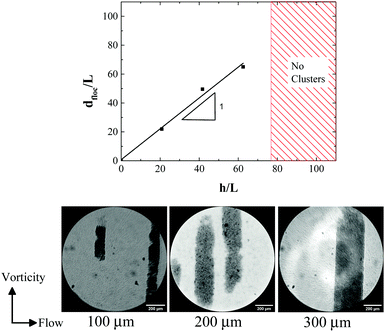
Effects of confinement of spherical particles between small gaps in the range of few particle diameters (∼10) have been explored theoretically,96 as well as experimentally97,98 in the latter with distinct crystalline arrangements.99 Dense colloidal suspensions under shear exhibit flow alignment in ordered structures100 with such phases also affecting the system's rheology. Hence, it is interesting to understand how attractive rod-like particles would behave under such conditions and to what extent structural changes such as local orientational ordering, take place.To this end we used parallel plate geometry to quantify the effect of confinement on the formation of vorticity aligned flocs in a low volume fraction suspension (φ/φ* = 1) of the attractive rods by changing the gap h between the plates (Fig. 9). We observed that beyond h = 300 μm (≈66Lrod), there was no formation of the vorticity aligned flocs. Furthermore, the floc diameter varies linearly with h. At larger gaps, we observe a response similar to shear banding (see Video, ESI†). However, with the existing imaging setup this could only be verified qualitatively. Interestingly, in the case of cone–plate geometry, the largest h at the edge is 122Lrod which is still able to induce vorticity aligned flocs. This is due to the initiation of the floc formation within the confinement zone close to the center of the cone–plate geometry. Since h increases from the center towards the edge of the cone–plate geometry, the cluster growth is unhindered at low Mn and the confinement effect is extended to larger values of h. This phenomenon puts into question the relation between the cluster length scale and confinement. It may rather be that once the floc formation is initiated, it grows in size even towards larger gaps until the volume fraction of particles within the floc matches the volume fraction of the gel at quiescent state. This also means that there should be a gradient in particle volume fraction within the flocs that are formed as a result of varying gap as observed in cone–plate geometry.
After discussing the macroscopic effects of steady shear flow on attractive rod suspension under confinement, we explore the microscopic changes using a combination of rheology and confocal microscopy. We capture the suspension microstructure before and after application of a steady shear rate of Per = 1 for the rod volume fraction at which we obtain log rolling flocs. A close inspection of the vorticity aligned flocs reveals the isotropic configuration of the rods within the particle rich floc. It is known that maximum packing for isotropic non-Brownian rods is expected to be around φmax(L/D) ≈ 5–6101 beyond which colloidal rods form ordered liquid crystal structures allowing mobility along their axis.13,102 However, attractions between rods can considerably slow down or arrest the diffusion driven ordering depending on the strength of attraction. Hence, our observations suggest that densely packed attractive rods show little thermal motion and form an isotropic microstructure.
We further need to explore how the heterogeneities arising from steady shear under confinement leads to the formation of log-rolling flocs that appear stable and equally spaced. In addition a quantitative determination of a possible liquid crystalline ordering by extracting the order parameter for the densely packed rods within the flocs would be valuable. As experimental observations are not able to easily provide such detailed structural information, we turn to Brownian dynamics simulations with hydrodynamic interactions in order to complementarily probe these phenomena and deduce answers to the above questions.
Simulation results
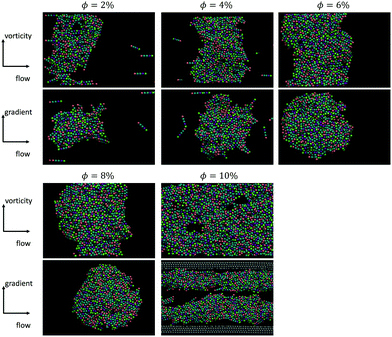
Simulations were conducted for rods with aspect ratio of 5 with the volume fraction ranging from 0.02 to 0.1. An additional set of simulations with aspect ratio 10, volume fractions of φsim = 0.01 (φsim/φ* = 1.25) and 0.04 (φsim/φ* = 5) was also carried out. The gap in the simulation was fixed at 5Lrod for each aspect ratio. In the simulations, with L/D = 5, the Mason number was also varied systematically.We found that for the weakest imposed shear rates (Mn = 0.001), log-like aggregates formed only for rod volume fractions smaller than 0.04 (φsim/φ* = 2). However, in these simulations stronger shear flows were able to break down the rod gel at higher volume fractions and also form vorticity aligned flocs. Fig. 10 shows the simulation results with L/D = 5 at a Mason number of 0.01 across different particle concentrations. Here the different colours indicate the different population size, in a 5% polydisperse size distribution, along the length of the rod which as discussed above simulates some roughness in the experimental rodlike particle. For the four cases that formed log-like aggregates, φsim = 0.02, 0.04, 0.06, 0.08 (or φsim/φ* = 1, 2, 3, 4) orientational order parameter was measured as S = 0.178, 0.085, 0.039 and 0.139, which indicates very little global alignment of the rods within the flocs.
In simulations of L/D = 10, which are closer in dimensions to the experimental suspensions, we also observe the formation of vorticity aligned flocs at volume fractions of up to 0.04 (φ/φ* = 5), when high enough Mason numbers were imposed. At large Mason numbers, Mn > 0.1, the aligned flocs were always destabilized in these simulations. Fig. 11 shows how multiple flocs form simultaneously in simulations and distribute themselves uniformly in the simulation cell with characteristic spacing between the flocs of about 2.7 times the channel height. From prior work we know that the Mason number characterizes the balance of hydrodynamic forces and interparticle attractions, and that this balance sets the preferred size of the aligned flocs. When the preferred floc size is larger than the size of the gap, alignment results. But when the preferred floc size is smaller than the gap, the alignment is disrupted. Fig. 12 depicts a slice through log-like flocs formed in experiment as well as in simulations with L/D = 10 and volume fraction of φ/φ* = 1 (exp.) and φsim/φ* = 1.25 (sim.) at Mn = 0.001 (exp.) and 0.01 (sim.) respectively. We find that there is no global alignment of rods within the floc, though in simulation results neighboring rods show some coordination in their alignment.
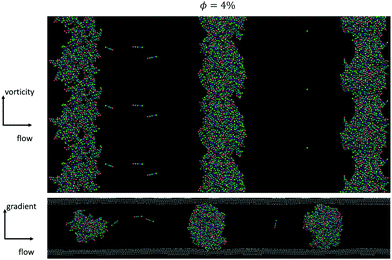 | ||
| Fig. 11 Simulations for a φsim = 0.04 at Mn = 0.01 in which 3 log-like flocs form. The spacing between the flocs matches the usual experimental observation: ∼2.7h. | ||
There are some differences between the experimental and the simulation conditions. Two key differences are the ratio of the gap to the particle size and the interactions between the particles and the boundaries. In the simulations, gaps bigger than five particle lengths are inaccessible. The largest simulations run here used tens of thousands of rods, or hundreds of thousands of beads. Doubling the gap in the simulation box requires doubling the other dimensions of the simulation cell to maintain its aspect ratio. Doubling the dimensions would thus require eight times as many particles. Future work is needed to achieve small gaps in experiments.
In the experiments the maximum gap at the edge of the cone–plate geometry is 531 μm which is equal to 122Lrod and flocs covered the entire diameter of the geometry. In the center of the cone, the gap is closer to 15Lrod. However in the plate–plate geometry, flocs did not form above a gap of 66Lrod. The simulations probe systematically smaller gaps than in either experimental flow geometries, which means the break-up of aligned flocs should occur at systematically lower Mason numbers in the experiments. From recent work,57 the relationship between the critical Mason number and the gap in a parallel plate geometry is predicted to scale as Mn ∼ h−2.
While the simulations use this parallel plate geometry, experimental geometries differ in significant ways that might alter this scaling prediction. In the cone–plate geometry, the shear rate is the same at all radial distances while the gap grows radially. Thus, the Mason number does not vary throughout the sample, but the degree of confinement does. In the plate–plate geometry, the shear rate grows with radial position, while the gap remains fixed at all positions. Thus, the Mason number varies throughout the sample and the degree of confinement does not. These differences might lead to slightly different predictions for the conditions under which aligned flocs can be observed in each geometry. Further work is needed to understand why this transition is so robust to changes in flow geometry.
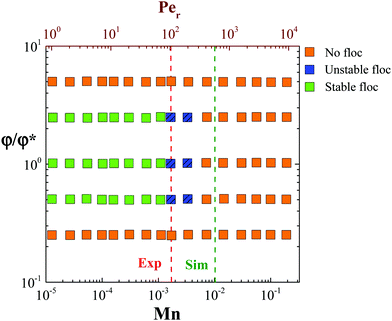
Based on the flow instabilities in attractive rod suspensions undergoing shear flow that were confirmed visually, we propose a state diagram (Fig. 13) relating the rod volume fraction and Mn. This is similar to the stability diagram proposed previously for dilute gels made up of spherical particles.56 At Mn > 0.01, the suspension appears to be homogeneous, however, this is due to the reduction in size of the heterogeneities to microscopic scale as confirmed using dark-field microscopy (Type B imaging), rather than complete breaking of the clusters to single particle level, which takes place at even higher rates. The large polydispersity in the floc size and time evolution of their size under steady shear rate flow conditions make it difficult to quantify the confinement (h/Lrod) associated with individual Mn and to propose a stability diagram. One may achieve this by using a parallel plate shear cell geometry where the shear rate and gap between the plates can be maintained constant throughout the duration of the measurement; a task that will be pursued in the future.
Discussion
Three dimensional confocal microscopy at a quiescent state probes directly a percolated network of the attractive rods which is highly porous and devoid of any local rod orientation within the clusters. This is in agreement with recent findings on the aggregation of elongated particles with fractal aggregates, as expected, being less dense than in the case of spherical particles.103 The rod aggregation process is more complex than Diffusion Limited Aggregation (DLA) or Reaction Limited Aggregation (RLA) mechanisms probably due to surface charge heterogeneity varying based on specific interparticle interactions. In contrast, rods with depletion attractions where the range of attraction is longer and the strength weaker, were shown to form bundles of aligned rods.63 Here we assume interparticle attraction is purely of van der Waals type and the frictional contributions to interparticle attraction were ignored for simplicity. While the roughness may play a role, cluster formation is driven here by attractions as the same rods with unscreened Coulomb repulsions did not exhibit any shear induced flocculation in contrast to the case of athermal fibers.104 A maximum steady shear rate of 1000 s−1 (or Per ≈ 20![[thin space (1/6-em)]](https://www.rsc.org/images/entities/char_2009.gif) 400) ensured sample rejuvenation with reproducible linear viscoelasticity. Since Mn < 1 at the highest shear rate applied, rejuvenation does not result in full dispersion into individual rods. Rather it results in the breakup of large percolated clusters to smaller dispersed rod aggregates leading to solid to liquid transition. After rejuvenation the more concentrated samples’ viscoelasticity evolves due to the rapid structure buildup, while in the lower rod volume fractions a clear liquid to solid transition is probed by the combined rheology and confocal microscopy measurements.
400) ensured sample rejuvenation with reproducible linear viscoelasticity. Since Mn < 1 at the highest shear rate applied, rejuvenation does not result in full dispersion into individual rods. Rather it results in the breakup of large percolated clusters to smaller dispersed rod aggregates leading to solid to liquid transition. After rejuvenation the more concentrated samples’ viscoelasticity evolves due to the rapid structure buildup, while in the lower rod volume fractions a clear liquid to solid transition is probed by the combined rheology and confocal microscopy measurements.
Initial yielding of rod gel (γ < 100%) at low rod volume fractions under oscillatory shear may be attributed to the bending and small scale restructuring of the percolated network rather than large scale rupture (Fig. 14(a)). Rupturing of the rod network occurs at larger strains (γ ≥ 200%). At low rod volume fractions, an individual rod in a percolated network has less number of contact points with the neighbouring rods. This allows an individual rod to re-orient itself in the direction of the imposed shear. However, a collective movement under shear of all the individual rods within a network from their initial position leads to a change in conformation of the network that mimics bending or flexing. This bending of the network before rupture pushes the yield strain to higher values.
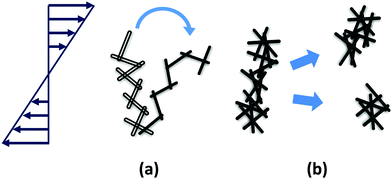 | ||
| Fig. 14 Proposed mechanism of yielding of rod gels under externally imposed stresses at low rod volume fraction (a) and at high rod volume fraction (b). | ||
A similar response has been reported for DLCA clusters of colloidal gels of spherical particles undergoing yielding.91 It is shown that these clusters undergo considerable deformation, such as unwinding, before rupturing. Here the mechanism proposed is the relative angular rotation of a singly connected particle pair. Under imposed stress, the large difference in stretching and bending moments in a singly connected backbone leads to full unwinding of the cluster before rupturing. Other mechanisms reported for a classic DLCA structure, explain the possibility of supporting large stresses if the structure is dominated by single-bond interactions formed via van der Waals forces. Here the bonds get rigid over time through contact-driven ageing and prevent rolling of contacts.90,92 Rod gels at low particle volume fractions are dominated by single-bond interactions and are susceptible to re-orientation at the contact point under shear. In addition they also exhibit contact – driven ageing by van der Waals forces.
At higher rod volume fractions, the percolated structure is rigid due to increased interparticle contact points leading to lower degree of freedom for individual rods to re-orient under externally imposed shear flow. This structure acquires larger G′ (more elastic), but on the other hand, is more brittle leading to fracturing at lower strains (Fig. 14(b)). Our study shows that even in the case of rod gels, mechanism of yielding exhibits a volume fraction dependence that was not reported earlier.91
The rigid rod suspension undergoing flow at steady shear rates, exhibit flow instabilities due to the competition between interparticle attraction and shear induced drag forces. Under confinement in narrow gaps, Fdrag < Fattr. (or Mn < 1), rod aggregates grow in size and form larger flocs. Since the rod aggregates are more porous compared to their spherical counterparts, the effect of confinement is more prominent, and the resultant floc resembles a “tumbleweed”. The continuous growth of particle rich flocs at low Per or Mn < 1 is restricted by the narrow gap in the flow-gradient plane. This leads firstly, to the densification of the porous aggregates and secondly, to their growth in the flow – vorticity plane exhibiting a “log-rolling” response at steady state. The fact that there is no local ordering of individual rods due to the increased rod density within the flocs corroborates the formation of low internal concentration, porous aggregates. Alignment or higher degree of local ordering may then be achieved only if the rod volume fraction is increased substantially.
Simulation results concur with the experimental observations, where at Mn < 1 rod aggregation occurs and at Mn < 0.1, the vorticity aligned flocs are stable. Furthermore, for a gap of 5Lrod, an inter-floc spacing (i.e. the distance between successive “logs”) of 2.7h was obtained at steady state. This reinforces the fact that under similar conditions, the mechanism of vorticity aligned floc formation is independent of particle aspect ratio and is strictly a function of interparticle attraction strength, the gap length scale and the particle volume fraction.
Conclusions
In this study, we report the structure and rheology of semi-dilute suspensions of attractive rods under steady shear flow using experiments and simulations. Structural evolution was directly probed using various rheo-optical techniques. The large aspect ratio of the rods and the resultant excluded volume leads to the formation of a percolated network that exhibits gel like response as verified using linear rheology and confocal microscopy. The sample's viscoelasticity evolves (ages) after cessation of shear rejuvenation due to the re-building of a percolated network of rod aggregates at low volume fractions and contact driven ageing at high volume fractions. We also show that yielding under oscillatory shear is driven by bending of the percolated network and local orientation of individual rods.Nonlinear rheology measurements reveal that at low rod volume fractions (φ/φ* ≤ 2.5) and low steady shear rates (Per < 100), attractive rod suspensions exhibit flow instabilities and form large heterogeneities along the vorticity direction. Similar results were obtained using Brownian dynamics simulations. For Mason number, Mn < 1, the interparticle attraction forces dominate and particle aggregates remain and restructure under shear. When the aggregate growth is restricted due to confinement in the flow-gradient plane, cluster grows in the flow-vorticity plane eventually creating log rolling flocs. We also show that large gaps lead to other phenomena such as slip or shear banding as shown in ESI,† for an experiment with h = 500 μm. Simulations show that hydrodynamic forces prevent the flocs from colliding with each other while maintaining a distance between them of about three times (actually 2.7) the channel (or gap) height. Both in experiments and simulations, rods do not form any locally oriented structure within the densely packed flocs. A state diagram identifies the regimes of vorticity aligned floc formation as a function of rod volume fraction and Mason number.
The effects introduced by particle anisotropy on yielding and the log-rolling phenomena may be multiple. Firstly, particle shape anisotropy shifts the volume fractions associated with the transition to lower values compared to spheres. Due to this, shear induced clusters along the vorticity direction of rods are less dense than those of spheres which due to higher bending ability and intracluster rearrangements may densify more than their rod-like counterparts. Note that the latter have the additional degree of orientational freedom where nematic clusters would have a much higher density than isotropic ones. In the present system however, there is direct experimental evidence, backed by computer simulations, that local bending rigidity restricts rod reorientation thereby freezing the rotational degrees of freedom and hindering the internal structures from evolving towards clusters of nematic buddles. As was shown DLCA clusters of colloidal spheres undergo considerable deformation, such as unwinding, before rupturing whereas the same was not observed in the corresponding rods.91 This reflects the inextensibility (or lack of internal degrees of freedom) of a rod in comparison to a linear array of spheres with the same aspect ratio.
Our study shows that flow instabilities such as vorticity aligned floc formation arise when highly heterogeneous attractive particle suspensions flow through confined geometry. The fact that the phenomenon itself is independent of particle aspect ratio proves its universality and needs to be given due consideration when performing fundamental and application oriented studies in formulations including attractive colloids.
Conflicts of interest
There are no conflicts to declare.Acknowledgements
The authors would like to acknowledge Esmaeel Moghimi for the fruitful discussions. This study was funded by the European Union within the Horizon 2020 project under the Marie Sklodowska Curie Innovative Training Network “DiStruc” (Grant agreement no. 641839) as well as innovation program “EUSMI” (Grant agreement no. 731019).References
- T. Mizutani, K. Arai, M. Miyamoto and Y. Kimura, Prog. Org. Coat., 2006, 55, 276–283 CrossRef CAS.
- J. Park and J. Moon, Langmuir, 2006, 22, 3506–3513 CrossRef CAS.
- H. Huang, B. You, S. Zhou and L. Wu, J. Colloid Interface Sci., 2007, 310, 121–127 CrossRef CAS.
- H. Barthel, M. Dreyer, T. Gottschalk-Gaudig, V. Litvinov and E. Nikitina, Macromol. Symp., 2002, 187, 573–584 CrossRef CAS.
- G. Savary, M. Grisel and C. Picard, in Natural Polymers: Industry Techniques and Applications, ed. O. Olatunji, Springer International Publishing, 2016, pp. 219–261 Search PubMed.
- S. R. Abulateefeh, et al. , Macromol. Biosci., 2011, 11, 1722–1734 CrossRef CAS.
- Z. K. Chowdhury, G. Amy and R. C. Bales, Environ. Sci. Technol., 1991, 25, 1766–1773 CrossRef CAS.
- R. Aveyard, B. P. Binks and J. H. Clint, Adv. Colloid Interface Sci., 2003, 100–102, 503–546 CrossRef CAS.
- B. Alince, P. Arnoldova and R. Frolik, J. Appl. Polym. Sci., 2000, 76, 1677–1682 CrossRef CAS.
- E. Masoero, E. Del Gado, R. J. M. Pellenq, F. J. Ulm and S. Yip, Phys. Rev. Lett., 2012, 109, 155503 CrossRef CAS.
- R. Caenn and G. V. Chillingar, J. Pet. Sci. Eng., 1996, 14, 221–230 CrossRef CAS.
- J. N. Israelachvili, Intermolecular and surface forces, Academic Press, 1992 Search PubMed.
- L. Onsager, Ann. N. Y. Acad. Sci., 1949, 15, 627–659 CrossRef.
- A. Cuetos and M. Dijkstra, Phys. Rev. Lett., 2007, 98, 095701 CrossRef.
- D. Guu, J. K. G. Dhont and M. P. Lettinga, Eur. Phys. J.: Spec. Top., 2013, 222, 2739–2755 Search PubMed.
- D. Bi, J. Zhang, B. Chakraborty and R. P. Behringer, Nature, 2011, 480, 355–358 CrossRef CAS.
- B. J. Ackerson and N. A. Clark, Phys. Rev. A: At., Mol., Opt. Phys., 1984, 30, 906–918 CrossRef CAS.
- M. D. Haw, W. C. K. Poon and P. N. Pusey, Phys. Rev. E: Stat., Nonlinear, Soft Matter Phys., 1998, 57, 6859–6864 CrossRef CAS.
- R. Besseling, et al. , Phys. Rev. Lett., 2010, 105, 268301 CrossRef CAS.
- J. K. G. Dhont, et al. , Faraday Discuss., 2003, 123, 157–172 RSC.
- P. Ballesta, G. Petekidis, L. Isa, W. C. K. Poon and R. Besseling, J. Rheol., 2012, 56, 1005–1037 CrossRef CAS.
- T. G. Mason and D. A. Weitz, Phys. Rev. Lett., 1995, 75, 2770–2773 CrossRef CAS.
- J. V. DeGroot Jr, C. W. Macosko, T. Kume and T. Hashimoto, J. Colloid Interface Sci., 1994, 166, 404–413 CrossRef.
- B. Belzung, F. Lequeux, J. Vermant and J. Mewis, J. Colloid Interface Sci., 2000, 224, 179–187 CrossRef CAS.
- D. Bonn and M. M. Denn, Science, 2009, 324, 1401–1402 CrossRef CAS.
- L. J. Teece, M. A. Faers and P. Bartlett, Soft Matter, 2011, 7, 1341–1351 RSC.
- G. Ovarlez, L. Tocquer, F. Bertrand and P. Coussot, Soft Matter, 2013, 9, 5540–5549 RSC.
- J. Mewis and N. J. Wagner, Adv. Colloid Interface Sci., 2009, 147–148, 214–227 CrossRef CAS.
- W.-H. Shih, W. Y. Shih, S.-I. Kim, J. Liu and I. A. Aksay, Phys. Rev. A: At., Mol., Opt. Phys., 1990, 42, 4772–4779 CrossRef CAS.
- A. H. Krall and D. A. Weitz, Phys. Rev. Lett., 1998, 80, 778–781 CrossRef CAS.
- J. Guery, et al. , Phys. Rev. Lett., 2006, 96, 198301 CrossRef CAS.
- Z. Shao, A. S. Negi and C. O. Osuji, Soft Matter, 2013, 9, 5492–5500 RSC.
- H. Verduin, B. De Gans and J. Dhont, Langmuir, 1996, 12, 2947–2955 CrossRef CAS.
- P. Varadan and M. J. Solomon, Langmuir, 2001, 17, 2918–2929 CrossRef CAS.
- R. C. Sonntag and W. B. Russel, J. Colloid Interface Sci., 1986, 113, 399–413 CrossRef CAS.
- R. Wessel and R. C. Ball, Phys. Rev. A: At., Mol., Opt. Phys., 1992, 46, R3008–R3011 CrossRef CAS.
- J. Sprakel, S. B. Lindström, T. E. Kodger and D. A. Weitz, Phys. Rev. Lett., 2011, 106, 248303 CrossRef.
- S. B. Lindström, T. E. Kodger, J. Sprakel and D. A. Weitz, Soft Matter, 2012, 8, 3657–3664 RSC.
- L. Starrs, W. C. K. Poon, D. J. Hibberd and M. M. Robins, J. Phys.: Condens. Matter, 2002, 14, 2485–2505 CrossRef CAS.
- S. Manley, J. M. Skotheim, L. Mahadevan and D. A. Weitz, Phys. Rev. Lett., 2005, 94, 218302 CrossRef CAS.
- N. Koumakis, et al. , Soft Matter, 2015, 11, 4640–4648 RSC.
- E. Moghimi, A. R. Jacob, N. Koumakis and G. Petekidis, Soft Matter, 2017, 13, 2371–2383 RSC.
- A. Montesi, A. A. Peña and M. Pasquali, Phys. Rev. Lett., 2004, 92, 058303 CrossRef.
- S. Lin-Gibson, J. A. Pathak, E. A. Grulke, H. Wang and E. K. Hobbie, Phys. Rev. Lett., 2004, 92, 048302 CrossRef CAS.
- D. Fry, et al. , Phys. Rev. Lett., 2005, 95, 038304 CrossRef CAS.
- E. K. Hobbie and D. J. Fry, Phys. Rev. Lett., 2006, 97, 036101 CrossRef CAS.
- Z. Fan and S. G. Advani, J. Rheol., 2007, 51, 585–604 CrossRef CAS.
- A. W. K. Ma, M. R. Mackley and S. S. Rahatekar, Rheol. Acta, 2007, 46, 979–987 CrossRef CAS.
- C. O. Osuji and D. A. Weitz, Soft Matter, 2008, 4, 1388–1392 RSC.
- A. S. Negi and C. O. Osuji, Rheol. Acta, 2009, 48, 871–881 CrossRef CAS.
- E. K. Hobbie, Rheol. Acta, 2010, 49, 323–334 CrossRef CAS.
- V. Grenard, N. Taberlet and S. Manneville, Soft Matter, 2011, 7, 3920–3928 RSC.
- V. Presser, et al. , Adv. Energy Mater., 2012, 2, 895–902 CrossRef CAS.
- S.-i. Jeon, et al. , Energy Environ. Sci., 2013, 6, 1471–1475 RSC.
- M. Boota, K. B. Hatzell, M. Alhabeb, E. C. Kumbur and Y. Gogotsi, Carbon, 2015, 92, 142–149 CrossRef CAS.
- Z. Varga and J. W. Swan, J. Rheol., 2018, 62, 405–418 CrossRef CAS.
- Z. Varga, et al. , Proc. Natl. Acad. Sci. U. S. A., 2019, 116, 12193–12198 CrossRef CAS.
- M. J. Solomon and P. T. Spicer, Soft Matter, 2010, 6, 1391–1400 RSC.
- A. M. Wierenga and A. P. Philipse, Colloids Surf., A, 1998, 137, 355–372 CrossRef CAS.
- A. Mohraz, D. B. Moler, R. M. Ziff and M. J. Solomon, Phys. Rev. Lett., 2004, 92, 155503 CrossRef.
- A. Mohraz and M. J. Solomon, J. Colloid Interface Sci., 2006, 300, 155–162 CrossRef CAS.
- J. R. Rothenbuhler, J.-R. Huang, B. A. DiDonna, A. J. Levine and T. G. Mason, Soft Matter, 2009, 5, 3639–3645 RSC.
- G. M. H. Wilkins, P. T. Spicer and M. J. Solomon, Langmuir, 2009, 25, 8951–8959 CrossRef CAS.
- G. J. Vroege and H. N. W. Lekkerkerker, Rep. Prog. Phys., 1992, 55, 1241–1309 CrossRef CAS.
- M. P. B. van Bruggen, J. K. G. Dhont and H. N. W. Lekkerkerker, Macromolecules, 1999, 32, 2256–2264 CrossRef CAS.
- G. Yatsenko and K. S. Schweizer, Langmuir, 2008, 24, 7474–7484 CrossRef CAS.
- H. N. W. Lekkerkerker and G. J. Vroege, Philos. Trans. R. Soc., A, 2013, 371, 20120263 CrossRef CAS.
- B. M. I. van der Zande, L. Pagès, R. A. M. Hikmet and A. van Blaaderen, J. Phys. Chem. B, 1999, 103, 5761–5767 CrossRef CAS.
- A. B. Golovin, et al. , Materials, 2011, 4, 390–416 CrossRef CAS.
- M. Wang, L. He, S. Zorba and Y. Yin, Nano Lett., 2014, 14, 3966–3971 CrossRef CAS.
- A. Kuijk, A. van Blaaderen and A. Imhof, J. Am. Chem. Soc., 2011, 133, 2346–2349 CrossRef CAS.
- A. Kuijk, D. V. Byelov, A. V. Petukhov, A. van Blaaderen and A. Imhof, Faraday Discuss., 2012, 159, 181–199 RSC.
- T. H. Besseling, et al. , J. Phys.: Condens. Matter, 2015, 27, 194109 CrossRef CAS.
- Z. Dogic and S. Fraden, Curr. Opin. Colloid Interface Sci., 2006, 11, 47–55 CrossRef CAS.
- S. F. Schulz, E. E. Maier and R. Weber, J. Chem. Phys., 1989, 90, 7–10 CrossRef.
- J. N. Israelachvili, in Intermolecular and Surface Forces, ed. J. N. Israelachvili, Academic Press, 3rd edn, 2011, pp. 253–289 Search PubMed.
- L. Bergström, Adv. Colloid Interface Sci., 1997, 70, 125–169 CrossRef.
- M. Chaouche and D. L. Koch, J. Rheol., 2001, 45, 369–382 CrossRef CAS.
- S. Broersma, J. Chem. Phys., 1981, 74, 6989–6990 CrossRef.
- M. M. Tirado, C. L. Martínez and J. G. de la Torre, J. Chem. Phys., 1984, 81, 2047–2052 CrossRef.
- N. Koumakis and G. Petekidis, Soft Matter, 2011, 7, 2456–2470 RSC.
- D. J. Klingenberg, J. C. Ulicny and M. A. Golden, J. Rheol., 2007, 51, 883–893 CrossRef CAS.
- J. Mewis and N. J. Wagner, Colloidal Suspension Rheology, Cambridge University Press, 2011 Search PubMed.
- A. Ortega and J. García de la Torre, J. Chem. Phys., 2003, 119, 9914–9919 CrossRef CAS.
- A. M. Fiore, F. B. Usabiaga, A. Donev and J. W. Swan, J. Chem. Phys., 2017, 146, 124116 CrossRef.
- A. M. Fiore and J. W. Swan, J. Chem. Phys., 2018, 148, 044114 CrossRef.
- S. Asakura and F. Oosawa, J. Polym. Sci., 1958, 33, 183–192 CrossRef CAS.
- A. W. Lees and S. F. Edwards, J. Phys. C: Solid State Phys., 1972, 5, 1921–1928 CrossRef.
- J. W. Swan and J. F. Brady, Phys. Fluids, 2007, 19, 113306 CrossRef.
- F. Bonacci, X. Chateau, E. M. Furst, J. Fusier, J. Goyon and A. Lemaître, Nat. Mater., 2020, 19, 775–780 CrossRef CAS.
- A. Mohraz and M. J. Solomon, J. Rheol., 2005, 49, 657–681 CrossRef CAS.
- J. P. Pantina and E. M. Furst, Phys. Rev. Lett., 2005, 94, 138301 CrossRef.
- J. P. Pantina and E. M. Furst, Langmuir, 2006, 22, 5282–5288 CrossRef CAS.
- J. Vermant and M. J. Solomon, J. Phys.: Condens. Matter, 2005, 17, R187–R216 CrossRef CAS.
- J. D. Park, K. H. Ahn and N. J. Wagner, J. Rheol., 2017, 61, 117–137 CrossRef CAS.
- A. Fortini and M. Dijkstra, J. Phys.: Condens. Matter, 2006, 18, L371–L378 CrossRef CAS.
- Y. Han, et al. , Nature, 2008, 456, 898–903 CrossRef CAS.
- P. Pieranski, L. Strzelecki and B. Pansu, Phys. Rev. Lett., 1983, 50, 900–903 CrossRef CAS.
- S. A. Rice, Chem. Phys. Lett., 2009, 479, 1–13 CrossRef CAS.
- I. Cohen, T. G. Mason and D. A. Weitz, Phys. Rev. Lett., 2004, 93, 046001 CrossRef.
- A. P. Philipse, Langmuir, 1996, 12, 5971 CrossRef CAS.
- T. Odijk, Macromolecules, 1986, 19, 2313–2329 CrossRef CAS.
- L. Wu, C. P. Ortiz and D. J. Jerolmack, Langmuir, 2017, 33, 622–629 CrossRef CAS.
- C. F. Schmid, L. H. Switzer and D. J. Klingenberg, J. Rheol., 2000, 44, 781–809 CrossRef CAS.
Footnote |
| † Electronic supplementary information (ESI) available. See DOI: 10.1039/d0sm01576h |
| This journal is © The Royal Society of Chemistry 2021 |


