 Open Access Article
Bio-inspired flow-driven chitosan chemical gardens†
Pawan
Kumar
 a,
Dezső
Horváth
 b and
Ágota
Tóth
 *a
*a
aDepartment of Physical Chemistry and Materials Science, University of Szeged, Rerrich Béla tér 1., Szeged, H-6720, Hungary. E-mail: atoth@chem.u-szeged.hu
bDepartment of Applied and Environmental Chemistry, University of Szeged, Rerrich Béla tér 1., Szeged, H-6720, Hungary
First published on 4th September 2020
Abstract
Organic chemical gardens of chitosan hydrogel develop upon injecting an acidic chitosan solution into an alkaline solution. Besides complex and budding structures, tubular hydrogel formations develop that exhibit periodic surface patterns. The underlying wrinkling instability is identified by its characteristic wavelength dependence on the diameter of the elastic material formed. The flow-driven conditions allow precise control over the structure that can help the design of soft bio-inspired materials. Our findings can also suggest a new direction in the field of chemobrionics.
Chitosan is a frequently used polysaccharide biopolymer derived from chitin, one of the most abundant natural polymers on Earth. Besides its significant properties like bio-degradability and biocompatibility, it has many practical applications ranging from medical sciences (e.g., wound healing) to pharmaceutical processes (e.g., drug delivery).1 For the last few decades, the study of chitosan and its derivatives have been of immense interest in biomaterial sciences, and different techniques of chitosan hydrogel preparation are established.2
Hydrogels are composed of polymeric networks, able to absorb large amounts of water while maintaining their strength, similar to natural tissues.3 They are among the most significant biomaterials, and their wide applications ranging from drug delivery to scaffolds for tissue engineering are the spotlight areas in biomedical science.4–6 Thin membranes of hydrogels confined on a substrate exhibit symmetry-breaking surface instabilities in the form of wrinkling, creasing, buckling, and folding via interaction with solvents or external stimuli.7–15 Interestingly, surface instabilities of gels mimic the morphologies of living bodies like brain folding, skin wrinkling, and periodic ridges in plants. Our focus is to produce self-organized surface patterning in situ via a sol–gel transition where the gelation takes place by the interaction of the originally acidic chitosan solution with an alkaline solution. The interface between the two electrolytes can lead to structural formations, like compact, porous, layered-oriented structures,16 self-assembled microcapillaries of chitosan hydrogel.17 Microfluidics18,19 and dip-coating20 have also been successfully utilized to create microtubes. The flexibility of the sol–gel process helps in constructing a variety of useful functional materials and morphologies. Monitoring and guiding smart biomaterial, like hydrogel, organized structure under sol–gel transition, can enlighten a new path in the field of self-organization.
The construction of self-assembled structures can occur in the presence of spatial gradients. Classic examples of self-organized far from equilibrium processes from a seed involving phase transitions are chemical gardens typically growing by the reactive interaction between cations (metal salts) and anions (alkaline solution)21–24 in which, the aggregation of minerals develops plants-like spatial structures. These self-assembled morphologies resemble natural organized structures, like soda straws (speleothems) in caves,25 ice brinicles,26,27 and black smokers on the ocean floor.28 In the emerging field of chemobrionics,21,29 where the spatiotemporal growth of chemical structures are addressed, experimental work on chemical gardens involves reactions of metallic cations most with the use of inorganic materials.22–24,30–34 However, pure organic/hydrogel garden-like structures are still not investigated. The extension from inorganic to organic garden formations is always a challenge for the researchers, and the complete understanding of the underlying mechanism behind these formations is not fully resolved.
In this work we report the first hydrogel garden-like structures where the driving force is sol–gel transition. We have observed thin, thick, budding tubes, and complex multi-armed chitosan hydrogel formations. Furthermore, periodic wrinkling patterns are identified as a result of the instability in the formed elastic material and the hydrodynamics behind their formation is characterized. Particle image velocimetry (PIV) and tomography reconstruction technique reveal the fluid flow motion and the 3-D structure of the tube.
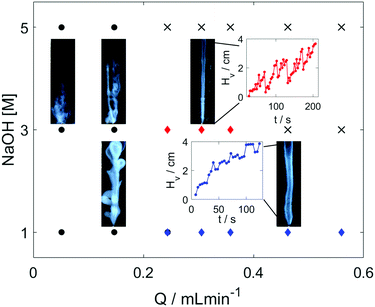
In our experimental study, hydrogel is formed in situ by injecting an acidic chitosan solution into sodium hydroxide solution in a Plexiglass cuvette of dimensions 1 × 1 × 10 cm as shown in Fig. 1. Upon contact with the basic solution, the initial polymer solution transforms into a hydrogel and depending on the experimental conditions (see experimental section in the ESI†), symmetry breaking of the chitosan hydrogel results in various self-organized forms as summarized in the dynamical phase diagram of Fig. 2.
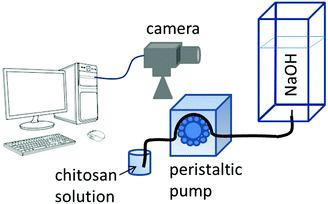 | ||
| Fig. 1 Schematic diagram of the experimental setup. For details see ESI.† | ||
The simplest structures are regular tubes of different diameters (diamond markers). The outer diameters, provided in Table S2 (ESI†), remain constant independent of the flow rate. The growth is erratic in more concentrated outer electrolyte where the tubes are thinner and hence more fragile as shown in the inset figure with red curve in Fig. 2. The drastic drops in the hydrogel height occur when hydrogel pieces pop off at the tip. In more dilute sodium hydroxide solutions thicker (blue curve) tubes evolve and they grow more smoothly. The smaller fluctuations in the tip position suggest that much smaller gel pieces are ripped off in the growing process.
Even at lower flow rates the tubes grow vertically because the injected liquid is less dense, however, additional tubes can pop out either from the tip of the inlet or from a weaker section of the tube. These side tubes then continue to grow vertically leading to the formation of complex, flower-like or branching (black circles in Fig. 2) organic structures. The vertical injection still dominates the growth as the height reached at selected times (see Table S2, ESI†) increases with the flow rate. Cross markers in Fig. 2 symbolize states characterized by high flow rates and greater density difference between the liquids that produce a thin vertical liquid jet without any hydrogel formation initiating from the inlet. The observed phase diagram reflects the general features of those associated with silica tubes, indicating that a phase transition at the interface between two fluids drives the pattern formation in the presence of spatial gradients around the local source.35
The evolving patterns and the phase diagram are robust as increasing the chitosan concentration by 50% will give qualitatively the same general picture. Upon increasing the cross-section of the inlet that widens the injected fluid jet, however, the hydrogel membrane can expand horizontally to a greater extent, touching the cuvette side walls. Having made the contact, the gel grows further vertically along the boundary but now without any rupturing. The geometry of the hydrogel structure also changes: instead of a vertical cylinder growing inside the cell, a vertical cylindrical segment develops where the side wall of the cuvette forms the plane. For better control of these patterns, we have used a different cuvette setup where the inlet is positioned near the wall in order to facilitate the boundary-assisted growth (see Fig. 3).
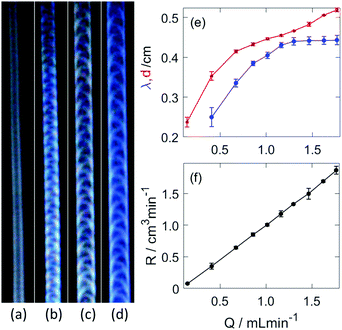
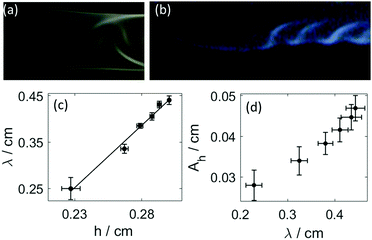
The presence of the wall expands the region of steady growth, within which no breaking of the tip is observed. Instead, the hydrogel structure develops a convex shaped head (see Fig. 4(a and b)), similarly to that of gravity currents, that propagates at a constant velocity. The injection rate plays a crucial role in the characteristic properties of these regular tubular structures; upon increasing it, a stable periodic pattern behind the head evolves on the curved outer surface of the tubular hydrogel, as shown in Fig. 3(b–d). The pattern itself arises from the regular deformation of the elastic material, during which the wrinkling originates from either boundary wall alternatingly then travels across the curved outer surface. The underlying sol–gel transition causes the “freezing” of the structure in the wake of the head.
The resultant cylindrical segment structure, excluding the leading head, is characterized by a constant diameter (d) and periodically varying height measured from the side wall. The wavelength of the pattern associated with deformation of the tube, blue curve in Fig. 3(e), increases up to a certain threshold of the injection rate (1.299 mL min−1). The diameter, depicted by a red curve in Fig. 3(e), on the other hand displays a monotonically increasing profile. The average height (h) is approximately half of the diameter, hence the volume growth rate of the hydrogel structure can be estimated from the change in the volume of a half cylinder as R = πdhv/4 where v is the linear growth rate of the tubular gel (see Fig. S2(a), ESI†) determined from the temporal evolution of the length in the vertical direction. The volume rate is directly proportional to the flow rate as illustrated in Fig. 3(f), and the value of the slope is 1.11 ± 0.02, near unity. This indicates that no significant flow across the hydrogel wall takes place in the time scale of the experiment, it basically separates the injected fluid from the outer electrolyte similarly to tubes of copper phosphate chemical gardens.36,37
As shown in Fig. 4(a and b), the disturbance in the outer wall of the hydrogel develops behind the propagating head structure that has a smooth surface. The deformations appear at the boundaries with a π phase shift between the two sides, and travel across the curved wall in opposite direction. Because these two motions are symmetric to the center plane normal to the wall, the resultant wavelength in the height variation, seen from the side in Fig. 4(b) is half of that in Fig. 3(e).
In order to characterize the flow associated with the growing process, we have calculated the Reynolds number (Re = ρvDH/η) where the hydraulic diameter for the cylindrical segment is defined as DH = dπ/(π + 2). For our experimental conditions Re < 5, indicating laminar flow. This has been confirmed by the experimental determination of the flow field within the hydrogel tube by particle image velocimetry (PIV). With reference to the outer electrolyte the laminar flow inside leads to a Richardson number (Ri = Gr/Re2) above 2, where the Grashof number for mass transfer is defined as Gr = gρΔρd3/η2, where g is the gravitational acceleration, ρ and η are the density and the viscosity of the liquid, while Δρ is the density difference between the injected fluid and the alkaline electrolyte. Since Ri > 0.25, the arising shear is not strong enough to generate Kelvin–Helmholtz instability, which is known to generate periodic patterns in reactive systems.38 Our PIV measurements show that the outer fluid at the vicinity of the freshly formed hydrogel flows in the same direction with the head with a velocity even somewhat greater than the progression of the tube tip itself (see Fig. S4, ESI†). This is the consequence of the short time-lag associated with the sol–gel transition that allows the presence of a thin fluid jet of chitosan solution, which leads the growth of the hydrogel structure. The thin viscous jet creates a vortex as it drags the outer electrolyte with it, therefore the reversal of the flow is in fact located farther from the gel wall, hence no significant shear is present along the wall.
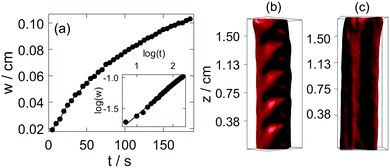
It is important to point out the surface deformation only occurs in the presence of the boundary along which the tube growth takes place. Creasing and wrinkling instabilities, that cause surface deformations, are associated with swelling of thin elastic gels sheets attached to a rigid boundary or a soft elastic substrate with different stiffness. The resultant symmetry breaking leads to characteristic wavelength scaling with the gel thickness.9–15 An analogous scenario occurs in our system when the growing gel tube reaches the side wall. The adhesive forces pin the gel surface to the glass sheet, which limits the swelling of the gel. The latter process is driven by the diffusion across the gel wall due to the pH difference. In our configuration for wrinkling instability to dominate, the wavelength should depend on the distance from the wall, i.e., on h. This is indeed observed in Fig. 4(c), revealing the importance of the varying elasticity in the changing environment. The viscoelastic deformation finally creates a stationary spatial structure because of the hardening of the gel, in which the amplitude in the periodic height variation of the circular segment also changes monotonically with the wavelength (see Fig. 4(d)). Here the latter is changed by varying the injection rate. Under the non-equilibrium conditions the sol–gel transition is accompanied by the thickening of the tube wall, which scales with time as tα with scaling exponent α = 0.508 ± 0.009 (see Fig. 5(a)). The temporal growth of the outer layer thickness (w) hence is governed by diffusion and it can be described as w = (kt)1/2, where the scaling constant k = (5.5 ± 0.12) × 10−5 cm2 s−1 is independent of the injection rate applied (0.672 mL min−1 ≤ Q ≤ 1.299 mL min−1). In the limit of fast injection with constant acidic environment on the inside k = 2D where D is the effective diffusion coefficient related to the sodium hydroxide outer electrolyte. The determined scaling exponent is in accordance with this. The tubular hydrogel in our flow-driven experiment is hence an isothermal analogy of lava tubes where the hard crust forming the conduit is result of phase transition driven by thermal conduction.39
The formed hydrogel tubular structure is robust, and its interior information can be visualized by optical tomography. In our experiments, squeezing occurs in the hydrogel tube as we stop injecting the acidic solution. The tomography reconstruction shows that the front side of the lower region of the tube shifts towards one side, and the backside is clogged (Fig. S6, ESI†). Fig. 5(b) represents that the upper region maintains the symmetric structure of the tube. The smooth surface of the channel in Fig. 5(c) indicates that patterns are maintained only on the upper surface of the gel.
In conclusion, self-organized hydrogel formations are produced in a simple flow-driven experiment, in which a chitosan solution is injected into an alkaline solution to create tubular, budding and multi-armed hydrogel garden morphologies. The concentration gradient between the injected and the outer liquid drives the sol–gel transition with temporal scaling revealing diffusion as the main mode of transport across the interface under laminar flow conditions. Furthermore, regular wrinkling deformation patterns are observed on the outer tubular surface when the expanding hydrogel is constantly exposed to a rigid wall. The boundary-assisted growth coupled to the sol–gel transition maintains gradients in viscosity and swelling properties lead to wrinkling instability where the wavelength of the resultant spatial pattern scales with the distance from the wall of the hydrogel. Our finding also proposes that organic garden formations can be observed in simple binary systems in the absence of metallic ions without classical precipitation reactions. Moreover, self-organized wrinkle-type periodic patterns via sol–gel transition open new possibilities for the design of adaptive soft materials under biomimetic conditions. The control of hydrogel morphologies and patterning helps in overcoming the challenges in tissue engineering.
The preliminary work on the chemical composition by Cintia Hajdu is gratefully acknowledged. This work was supported by the National Research, Development and Innovation Office (NN125746), and GINOP-2.3.2-15-2016-00013, and M-ERA.net MaSNEC projects, and the University of Szeged Open Access Fund (4963).
Conflicts of interest
There are no conflicts to declare.Notes and references
- H. Sashiwa and S.-I. Aiba, Prog. Polym. Sci., 2004, 29, 887–908 CrossRef CAS.
- N. Bhattarai, J. Gunn and M. Zhang, Adv. Drug Delivery Rev., 2010, 62, 83–99 CrossRef CAS.
- J. Kopeček, Biomaterials, 2007, 28, 5185–5192 CrossRef.
- Y.-N. Zhang, R. K. Avery, Q. Vallmajo-Martin, A. Assmann, A. Vegh, A. Memic, B. D. Olsen, N. Annabi and A. Khademhosseini, Adv. Funct. Mater., 2015, 25, 4814–4826 CrossRef CAS.
- N. A. Peppas, Biomedical applications of hydrogels handbook, Springer Science & Business Media, 2010 Search PubMed.
- R. Lev and D. Seliktar, J. R. Soc., Interface, 2018, 15, 20170380 CrossRef.
- J. Yoon, P. Bian, J. Kim, T. J. McCarthy and R. C. Hayward, Angew. Chem., Int. Ed., 2012, 51, 7146–7149 CrossRef CAS.
- A. W. Hauser, A. A. Evans, J.-H. Na and R. C. Hayward, Angew. Chem., Int. Ed., 2015, 54, 5434–5437 CrossRef CAS.
- J. Kim, J. Yoon and R. C. Hayward, Nat. Mater., 2010, 9, 159–164 CrossRef CAS.
- Z. Hu, Y. Chen, C. Wang, Y. Zheng and Y. Li, Nature, 1998, 393, 149–152 CrossRef CAS.
- H. Lee, J. Zhang, H. Jiang and N. X. Fang, Phys. Rev. Lett., 2012, 108, 214304 CrossRef.
- J. Dervaux and M. B. Amar, Annu. Rev. Condens. Matter Phys., 2012, 3, 311–332 CrossRef CAS.
- T. Tanaka, S.-T. Sun, Y. Hirokawa, S. Katayama, J. Kucera, Y. Hirose and T. Amiya, Nature, 1987, 325, 796–798 CrossRef CAS.
- E. S. Matsuo and T. Tanaka, Nature, 1992, 358, 482–485 CrossRef CAS.
- E. P. Chan, E. J. Smith, R. C. Hayward and A. J. Crosby, Adv. Mater., 2008, 20, 711–716 CrossRef CAS.
- J. Nie, W. Lu, J. Ma, L. Yang, Z. Wang, A. Qin and Q. Hu, Sci. Rep., 2015, 5, 7635 CrossRef CAS.
- V. Adibnia, M. Mirbagheri, P.-L. Latreille, J. Faivre, B. Cécyre, J. Robert, J.-F. Bouchard, V. A. Martinez, T. Delair, L. David and D. K. Hwang, Acta Biomater., 2019, 99, 211–219 CrossRef CAS.
- J. Oh, K. Kim, S. W. Won, C. Cha, A. K. Gaharwar, Š. Selimović, H. Bae, K. H. Lee, D. H. Lee, S.-H. Lee and A. Khademhosseini, Biomed. Microdevices, 2013, 15, 465–472 CrossRef CAS.
- K. Iijima, S. Ichikawa, S. Ishikawa, D. Matsukuma, Y. Yataka, H. Otsuka and M. Hashizume, ACS Biomater. Sci. Eng., 2019, 5, 5688–5697 CrossRef CAS.
- X.-Y. Wang, Y. Pei, M. Xie, Z.-H. Jin, Y.-S. Xiao, Y. Wang, L.-N. Zhang, Y. Li and W.-H. Huang, Lab Chip, 2015, 15, 1178–1187 RSC.
- L. M. Barge, S. S. S. Cardoso, J. H. E. Cartwright, G. J. T. Cooper, L. Cronin, A. D. Wit, I. J. Doloboff, B. Escribano, R. E. Goldstein, F. Haudin, D. E. H. Jones, A. L. Mackay, J. Maselko, J. J. Pagano, J. Pantaleone, M. J. Russell, C. I. Sainz-Diaz, O. Steinbock, D. A. Stone, Y. Tanimoto and N. L. Thomas, Chem. Rev., 2015, 115, 8652–8703 CrossRef CAS.
- F. Glaab, M. Kellermeier, W. Kunz, E. Morallon and J. M. Garca-Ruiz, Angew. Chem., 2012, 124, 4393–4397 CrossRef.
- F. Haudin, J. H. E. Cartwright, F. Brau and A. De-Wit, Proc. Natl. Acad. Sci. U. S. A., 2014, 111, 17363–17367 CrossRef CAS.
- Y. Ding, B. Batista, O. Steinbock, J. H. E. Cartwright and S. S. Cardoso, Proc. Natl. Acad. Sci. U. S. A., 2016, 113, 9182–9186 CrossRef CAS.
- C. A. Hill and P. Forti, Cave Minerals of the World, National Speleological Society, Alabama, 1997, pp. 285–287 Search PubMed.
- R. A. Paige, Science, 1970, 167, 171–172 CrossRef CAS.
- J. H. E. Cartwright, B. Escribano, D. L. González, C. I. Sainz-Daz and I. Tuval, Langmuir, 2013, 29, 7655–7660 CrossRef CAS.
- W. Martin, J. Baross, D. Kelley and M. J. Russell, Nat. Rev. Microbiol., 2008, 6, 805–814 CrossRef CAS.
- S. Cardoso, J. H. E. Cartwright, J. Cejková, L. Cronin, A. De Wit, S. Giannerini, D. Horváth, A. Rodrigues, M. J. Russell, C. I. Sainz-Diaz and A. Tóth, Artif. Life, 2020 DOI:10.1162/artl_a_00323.
- C. J. Steenbjerg Ibsen, B. F. Mikladal, U. Bjørnholt Jensen and H. Birkedal, Chem. – Eur. J., 2014, 20, 16112–16120 CrossRef CAS.
- R. Makki, M. Al-Humiari, S. Dutta and O. Steinbock, Angew. Chem., Int. Ed., 2009, 48, 8752–8756 CrossRef CAS.
- E. A. Hughes, M. Chipara, T. J. Hall, R. L. Williams and L. M. Grover, Biomater. Sci., 2020, 8, 812–822 RSC.
- R. Daly, O. Kotova, M. Boese, T. Gunnlaugsson and J. J. Boland, ACS Nano, 2013, 7, 4838–4845 CrossRef CAS.
- G. Pampalakis, Chem. – Eur. J., 2016, 22, 6779–6782 CrossRef CAS.
- S. Thouvenel-Romans and O. Steinbock, J. Am. Chem. Soc., 2003, 125, 4338–4341 CrossRef CAS.
- A. Tóth, D. Horváth, R. Smith, J. McMahan and J. Maselko, J. Phys. Chem. C, 2007, 111, 14762–14767 CrossRef.
- E. Rauscher, G. Schuszter, B. Bohner, A. Tóth and D. Horváth, Phys. Chem. Chem. Phys., 2018, 20, 5766–5770 RSC.
- P. Knoll, A. V. Gonzalez, Z. C. McQueen and O. Steinbock, Chem. – Eur. J., 2019, 25, 13885–13889 CrossRef CAS.
- A. Valerio, A. Tallarico and M. Dragoni, J. Geophys. Res., 2008, 113, B08209 CrossRef.
Footnote |
| † Electronic supplementary information (ESI) available. See DOI: 10.1039/d0sm01397h |
| This journal is © The Royal Society of Chemistry 2020 |

