 Open Access Article
Rheological response of a modified polyacrylamide–silica nanoparticles hybrid at high salinity and temperature†
Mohsen
Mirzaie Yegane
 *a,
Fatemeh
Hashemi
 b,
Frank
Vercauteren
c,
Nicole
Meulendijks
c,
Ridha
Gharbi
d,
Pouyan E.
Boukany
 b and
Pacelli
Zitha
a
aDepartment of Geosciences and Engineering, Delft University of Technology, Delft, The Netherlands. E-mail: Mohsen.mirzaieyegane@gmail.com
bDepartment of Chemical Engineering, Delft University of Technology, Delft, The Netherlands
cThe Netherlands Organisation for Applied Scientific Research (TNO), High Tech Campus 25, 5656AE Eindhoven, The Netherlands
dKuwait Oil Company, Ahmadi, Kuwait
First published on 30th September 2020
Abstract
Water-soluble polyacrylamides have often been used to modify flow response in various water-based technologies and industrial processes, including paints, water treatment, paper manufacturing, and chemical enhanced oil recovery. Polymers are susceptible to degradation at combined high salinity and elevated temperature conditions which limits their overall performance. Hybrid mixtures of hydrophobically modified polyacrylamide (HMPAM) with hydrophobically modified silica nanoparticles (NPs) emerged as a promising strategy for achieving enhanced stability and high viscosity in brines having a high total dissolved solids (TDS) content and high hardness at elevated temperatures (>20 wt% TDS, including >1.5 wt% divalent cations at T > 70 °C). The rheological response of the hybrids at various concentrations of HMPAM and NPs was examined to investigate the synergic effects. Hybridization of HMPAM with NPs led to a higher viscosity at high salinity and elevated temperature. The viscosity improvement was more pronounced when the concentration of HMPAM was in the semi-dilute regime and concentration of NPs was higher than a critical threshold where the viscosity increased roughly by a factor of 1.5. Here we present the mechanisms of improved viscosity behaviour. The rheological data suggest the role of NPs in the bridging between HMPAM molecules, which in turn increases the hydrodynamic radius and consequently the viscosity of the hybrids.
Introduction
The stability of colloidal systems at high electrolyte concentration is critical for optimum performance of various industrial products and processes, including water-based coatings or paints,1–3 environmental applications4–6 and chemical enhanced oil recovery (cEOR).7–9 In paints, for instance, once the salt concentration in the rust layer at the steel–paint interface exceeds a threshold, premature deterioration of the paint coating is observed.10As a basic cEOR method, polymer injection increases oil recovery over water flooding by viscosifying the aqueous drive water.11 Partially hydrolysed polyacrylamide (HPAM) is the most commonly utilised polymer for cEOR.11–14 HPAM is characterized by the presence of negatively charged carboxylic groups along the polymer backbone.15 Electrostatic repulsion among the carboxylic groups results in the expansion of the coiled HPAM chains, thus increasing the solution viscosity, compared to non-ionic polyacrylamide (PAM).12 At high ionic strength, however, electrostatic repulsions between the negatively charged groups are almost completely screened by mono- and divalent cations. Therefore, the excluded volume and consequently the molecular size of the polymer chains are reduced.16 For this reason, HPAM viscosity decreases as salinity increases. At sufficiently high concentrations of divalent cations, complexation of the metal ion by the carboxylate groups occurs leading to polymer precipitation.17,18 These effects are exacerbated as temperature increases due to further hydrolysis of acrylamide monomers in the polymer backbone.19
Several approaches for synthesising water-soluble polymers with improved rheological properties at high salinities up to 20 wt% total dissolved solids (TDS) and temperatures up to 120 °C have been reported.20–24 Many focus on the substitution of the acrylamide monomer by at least another monomer type which can enhance the stability of the polymer at such harsh conditions.20–22,25 For instance, the incorporation of 2-acrylamido-2-methylpropane sulfonic acid (AMPS)23,26 and N-vinyl-2-pyrrolidone (N-VP)24,26 co-monomers increases tolerance to high salinity particularly to the presence of divalent cations and against thermal hydrolysis respectively. Even though modified polyacrylamides have shown promising results at high temperatures and salinities, they are more expensive than HPAM and need to be overdosed to reach target viscosities since their molecular weight is low.27 Therefore, the use of such polymers is economically unattractive.
An alternative approach to overcome the above issues consists in combining the polymer with nanoparticles (NPs) to form a hybrid system which is stable at elevated temperature and high salinity. The premise of the new method is that the rheological properties of polymer solution at such harsh conditions can be improved by fine-tuning the polymer–NPs interactions. Several studies demonstrated that hybrid networks can be obtained by the introduction of silica nanoparticles in aqueous media into the macromolecular architecture of associative polymers based on reversible associations.28–32 Moreover, if the associative polymers also show lower critical solution temperature (LCST) properties, temperature and salting-out may be used to modify the viscoelastic properties of the hybrid network.28 Kamibayashi et al.33 have shown that associative polymers containing a minor proportion of hydrophobic groups can act as flocculants in aqueous suspension of silica NPs. The flocculation was induced by polymer bridging between silica NPs and led to a significant increase in the viscosity of the suspension. Bhardwaj et al.34 reported improved thermo-resistance and high thermal stability behaviour for nano-size PAM/silica composites. Maghzi et al.35 reported that the viscosity of a PAM/silica hybrid was higher than that of a polyacrylamide solution in the range of tested salinities from 1.4 wt% to 8.4 wt% TDS. Hu et al.36 observed that the addition of silica NPs considerably increases the HPAM viscosity at salinities up to 8 wt% NaCl and temperatures up to 80 °C. Cao et al.37 indicated that the salt-tolerance and heat-resistance properties of a solution containing copolymer of acrylamide and AMPS were improved by the addition of amino-functionalised silica NPs in brines containing up to 8 wt% NaCl and 0.12 wt% CaCl2 at 70 °C. The strong interaction between silica NPs and polymer is chiefly ascribed to hydrogen bonds between the functional groups on polymer molecules including hydroxyl, amide and carboxylate groups and the silanol groups on the surface of NPs.34,36–38
The above solutions suffer from several limitations: (a) polymer–NPs hybrids were not investigated for salinities higher than 8.4 wt% which are typical in various industrial processes (b) insufficient information was provided on colloidal stability at high salinity conditions and (c) the role of the polymer concentration, from dilute to semi-dilute regimes, on the rheological response of hybrids was not discussed. To address the limitations of current approaches, we propose a polymer–NPs hybrid system based on the hydrophobic–hydrophobic interaction. This specific interaction enables the development of a system, which is stable and retains sufficiently high viscosity at extreme salinities and elevated temperatures (>20 wt% TDS, including >1.5 wt% divalent cations, and T > 70 °C).
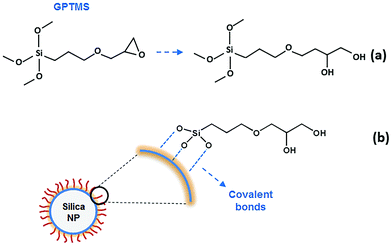
In our experiments hydrophobically modified silica NPs were added to a solution of hydrophobically modified polyacrylamide (HMPAM) to facilitate the bridging between polymer chains. Silica NPs were modified by gamma-glycidoxypropyltrimethoxysilane (GPTMS), a low molecular weight organic ligand to provide steric stabilization and ensure the colloidal stability at high salinity.39 By modification, the surface becomes more hydrophobic than the original bare silica but still has sufficient polarity to allow a good dispersion in water. To describe the colloidal stability of NPs in this work, an extended DLVO (xDLVO)40–42 theory has been used in different ionic strengths and with or without surface modification of NPs. In order to study the improvement of flow responses of the hybrids, viscosity measurements were performed at various concentrations of HMPAM and NPs.
The results showed that the addition of NPs increases the viscosity of HMPAM solutions. The increase was more pronounced once the concentration of HMPAM was in the semi-dilute regime and the concentration of NPs was larger than a critical threshold. The results suggest that in the semi-dilute regime, where polymer chains are in closer proximity to each other, NPs-induced bridging between HMPAM chains can occur which in turn enlarge the hydrodynamic radius of the hybrids and consequently increase their viscosity.
Experimental
Materials
GPTMS-modified silica NPs which are available under the commercial name Levasil CC301 were supplied by Akzo Nobel in suspension (ρ = 1.2 g cm−3) containing 28.1 wt% silica with an average particle diameter of 7 nm as reported by the manufacturer. Bare silica NPs were supplied by Sigma-Aldrich in powder form with a particle diameter of 10–20 nm obtained from BET. Acrylamide and t-butyl acrylamide monomers were purchased from Sigma-Aldrich. HMPAM (98 mol% acrylamide and 2 mol% t-butyl acrylamide) and PAM (100 mol% acrylamide) were synthesised using free radical polymerization.24 Their average molecular weights were estimated using the methodology used by Wu et al.43 which is based on viscosity measurements and found to be approximately 2.1 × 10⁶ and 2.7 × 10⁶ g mol−1 for HMPAM and PAM respectively (see the ESI†). Sodium chloride (NaCl) and calcium chloride dihydrate (CaCl2·2H2O) used for brine preparation were purchased from Sigma-Aldrich as well. All materials were used as received without further purification.Preparation of modified silica NPs, polymers and hybrids
| RSi(OMe)3 + 3H2O → RSi(OH)3 + 3MeOH | (1) |
Pre-hydrolysed silane is continuously added to the colloidal silica at 60 °C, at a rate of nearly 1.4 molecules GPTMS per nm2 silica surface per hour while being agitated. The pre-hydrolysed silane reacts with silanol groups on the surface of silica NPs, according to the following condensation reaction:
| Y–R–Si(OH)3 + (HO)X–silica particle → Y–R(OH)3−X–silica particle + xH2O | (2) |
Characterization of NPs and HMPAM
 | (3) |
![[thin space (1/6-em)]](https://www.rsc.org/images/entities/char_2009.gif) 000 revolutions per minute (rpm) for 20 minutes. All spectra were recorded on a wide-bore 500 MHz Bruker NMR. 1H NMR spectra were acquired at 500 MHz to determine the hydrophobic content of HMPAM. As a reference, a similar analysis was performed on PAM.
000 revolutions per minute (rpm) for 20 minutes. All spectra were recorded on a wide-bore 500 MHz Bruker NMR. 1H NMR spectra were acquired at 500 MHz to determine the hydrophobic content of HMPAM. As a reference, a similar analysis was performed on PAM.
In order to study the shear-thinning behaviour of the polymer solutions, the Carreau–Yasuda model48 as shown in eqn (4) was used:
 | (4) |
![[small gamma, Greek, dot above]](https://www.rsc.org/images/entities/i_char_e0a2.gif) is the shear rate and λ is a time constant known as relaxation time which is an inverse of a critical shear rate at which the transition from Newtonian to shear-thinning regimes occurs. The parameter n is the power-law slope obtained from the shear thinning part and the parameter a controls the width of transition from Newtonian to shear thinning. For oscillatory tests, the amplitude sweep was attempted at a constant frequency to realize the linear viscoelastic regime after which the frequency dependence of the hybrids was analysed within this viscoelastic regime.
is the shear rate and λ is a time constant known as relaxation time which is an inverse of a critical shear rate at which the transition from Newtonian to shear-thinning regimes occurs. The parameter n is the power-law slope obtained from the shear thinning part and the parameter a controls the width of transition from Newtonian to shear thinning. For oscillatory tests, the amplitude sweep was attempted at a constant frequency to realize the linear viscoelastic regime after which the frequency dependence of the hybrids was analysed within this viscoelastic regime.
Colloidal stability of dispersed NPs
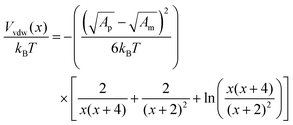
| Vt(x) = Vvdw(x) + Vele(x) + Vstr(x) | (5) |
The van der Waals potential is:50
 | (6) |
 | (7) |
 | (8) |
 | (9) |
The steric potential (Vstr) for the grafted ligand is calculated by summing the osmotic (Vosm) and elastic potentials (Vela).53 These are short-range repulsive interactions that tend to kinetically stabilize the NPs dispersion. The osmotic potential can be expressed as:54
 | (10) |
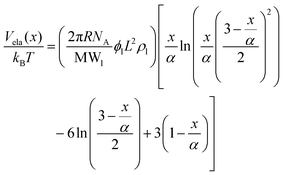 | (11) |
Results and discussion
Stability of hydrophobically modified silica NPs
Dispersions of GPTMS modified silica NPs in Brine2015 were found to be stable for over three months (Fig. S1, ESI†). In order to characterize the morphology of GPTMS-modified NPs (i.e. shape and size), TEM was performed for modified NPs dispersed either in DI water or in Brine2015. In order to study the impact of GPTMS modification on the prevention of aggregation of silica NPs, TEM was also performed on bare silica NPs with an approximately identical particle diameter (10–20 nm as reported by the supplier). Fig. 1 shows the TEM images of dilute dispersions of hydrophobically modified and bare silica NPs in DI water and in Brine2015. Stable dispersions were obtained for both types of NPs in DI water. However, the dispersion of modified NPs was completely transparent while the dispersion of bare NPs showed some turbidity (Fig. S2, ESI†). Fig. 1a shows that for the bare silica NPs in DI water, NPs formed aggregates even though the dispersion showed no phase separation. In contrast, for the GPTMS-modified NPs dispersed in DI water the TEM image (Fig. 1b) shows the presence of individual NPs and small clusters of NPs with a narrow cluster size distribution (see Fig. S5, ESI†) suggesting a slight tendency of NPs to form large aggregates.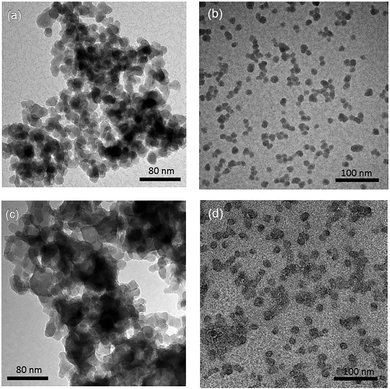 | ||
| Fig. 1 TEM images of dried samples (a) bare NPs in DI water (b) GPTMS-modified NPs in DI water (c) bare NPs in 20 wt% TDS brine (Brine2015) and (d) GPTMS-modified NPs in Brine2015. | ||
When bare NPs were dispersed in Brine2015 most of them adhered to one another and large aggregates were formed (see Fig. 1c). This is in agreement with the flocculation of small silica NPs into particulate networks, resulting in sedimentation as also reported by others.58,59Fig. 1d shows that for GPTMS-modified silica NPs in Brine2015, even though a few slightly larger agglomerates were formed, a majority of the NPs remained separated from each other. This shows that grafting low molecular weight ligands to the surface of NPs can prevent their aggregation in media with high ionic strength.47,60 The sample pictures of a suspension of bare and modified silica NPs in DI water and Brine2015 at a concentration of 0.05 wt% are shown in Fig. S2 (ESI†).
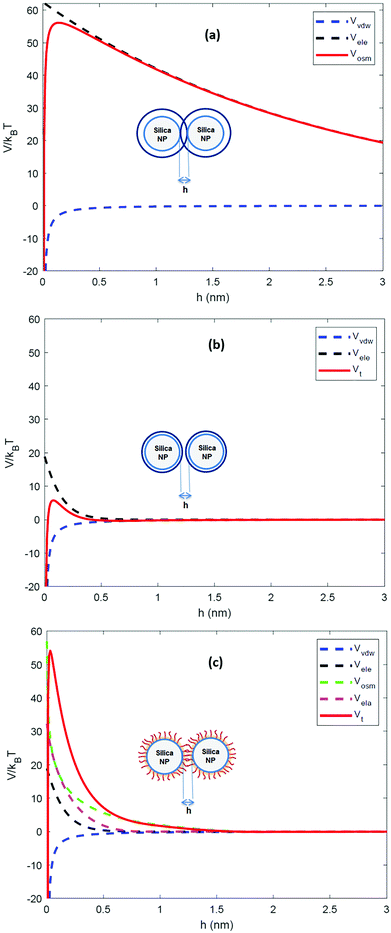
To determine the relative contributions of the surface forces to NPs interactions, the van der Waals, electrostatic and steric potentials were estimated using the xDLVO theory (see Inter-particle interaction section). This provides a semi-quantitative description of stability of NPs and the calculations highlight the importance of the grafted ligand for NPs stabilization at high salinity. For this purpose, three scenarios were considered: (a) bare silica NPs dispersed in a medium with low ionic strength (I = 10 mM, equivalent to 0.06 wt% NaCl), (b) bare silica NPs in a high ionic strength medium (I = 3834 mM representing the ionic strength of Brine2015) and (c) GPTMS modified NPs in a medium with similar high ionic strength. Table 1 summarises the parameters which were used for the calculations. All three scenarios were considered at room temperature. The ligand grafting density from TOC analysis according to eqn (3) was calculated to be 2.6 ± 0.1 μmol m−2. The thickness of the particle coating (L) was regarded as the length of a GPTMS molecule which is 0.95 nm.60 Even though it is reported in the literature that GPTMS is relatively well solvated in high salinities water,39,60 the Flory–Huggins interaction parameter was taken as 0.49 to give a conservatively low estimate of Vosm.
| Parameter | NPs functionality |
|---|---|
| Hamaker constant for water (J) | 3.7 × 10⁻²⁰ |
| Hamaker constant for silica (J) | 6.3 × 10⁻²⁰ |
| Particle diameter (nm) | 7 |
| Bulk density of ligand (g cm−3) | 1 |
| Ligand molecular weight (g mol−1) | 236 |
| Ligand grafting density (μmol m−2) | 2.6 |
| Ligand length (nm) | 0.95 |
| ζ potential (mV) | −29 |
| Flory–Huggins interaction parameter | 0.49 |
The calculated interaction potentials are shown in Fig. 2. As Fig. 2a suggests, for bare silica NPs dispersed in a low ionic strength medium, Vele decreased exponentially with increasing h, approaching zero at large h. Vvdw, which indicates an inverse power law with h, did not decay to zero. Vvdw is dominant over Vele in very short particle separation distances, which results in a deep minimum in the Vt profile. However, for larger h values (i.e. h > 0.1 nm), the electrostatic double layer repulsion becomes dominant and a potential barrier of larger than 55/kBT is obtained (Vmax > 55/kBT). This implies that the colloidal stability is ensured. When bare silica NPs were dispersed in Brine2015 (Fig. 2b), Vvdw did not change, as it is independent of aqueous phase salinity. However, as can be inferred from eqn (8), the Debye length diminishes with increasing ionic strength, resulting in significant reduction in Vele. This is also evident in Vt and the potential barrier becomes smaller than 16/kBT (Vmax < 16/kBT) implying that the colloidal stability is not achieved. The fact that the potential barrier did not completely disappear was due to the high ζ potential and small size of the NPs. The latter makes the van der Waals attracting potential smaller.
When two GPTMS-modified silica NPs approach each other to a separation distance h smaller than 2L (h < 2L) the ligand molecules interact with each other, which leads to an increase in the local segment density of ligand molecules in the interaction zone. This results in strongly repulsive interaction due mainly to two effects: (a) to rise in osmotic potential in the interaction zone according to eqn (10) and (b) decrease in configurational entropy of the ligand molecules in the overlap region due to decrease in volume available for ligand molecules, as is shown in eqn (11). Fig. 2c indicates that the contribution of Vosm and Vela significantly increases the potential barrier to more than 50/kBT (Vmax > 50/kBT) which ensures the colloidal stability of GPTMS-modified silica NPs at such high salinity. Note that these calculations are based on some inherent assumptions in xDLVO theory61 and were used to semi-quantitatively show the effect of NPs surface modification by GPTMS on the colloidal stability of the system.
Hydrophobic content of HMPAM
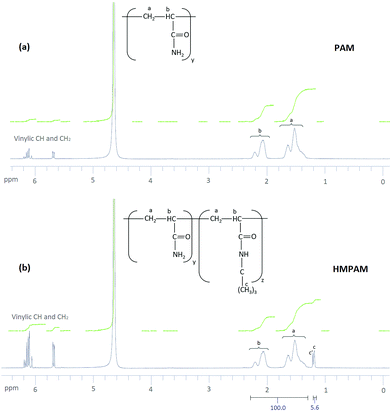
The result of 1H NMR spectra is shown in Fig. 3. For PAM, as can be seen in Fig. 3a, peaks a and b correspond to aliphatic CH2 and aliphatic CH respectively in polyacrylamide. Moreover, some other peaks appear in the range of 5.65–6.25 ppm. These peaks are attributed to vinylic CH and CH2 in acrylamide monomer which means some of the monomers were not polymerized.62 The yield of polymerization was estimated to be 92.5 ± 0.5%. For HMPAM, as can be seen in Fig. 3b, compared with PAM two additional peaks were detected. Peak c corresponds to the proton in the methyl group (–(CH3)3) of HMPAM. Another peak (c′) was observed next to peak c. This small peak is attributed to the methyl groups in t-butyl acrylamide monomer which were not polymerized (see the 1H NMR spectrum of t-butyl acrylamide in Fig. S8, ESI†). Also here, the peaks in the range of 5.65–6.25 ppm correspond to vinylic CH and CH2 in acrylamide and t-butyl acrylamide monomers which were not polymerized. As compared to PAM, the integrating areas of these peaks appear to be larger. This indicates that the yield of the polymerization is smaller and it was estimated to be 81.0 ± 0.5%.The hydrophobic content of HMPAM was estimated according to the following equation:
 | (12) |
Rheology of HMPAM solutions
Fig. 4 shows the viscosities of HMPAM solution in DI water and in Brine2015 at 25 °C and in Brine2015 at 70 °C as a function of shear rate at different concentrations. The Carreau–Yasuda model (eqn (4)) was used to fit the experimental rheology data. The list of fitting parameters is tabulated in Tables S1–S3 (ESI†). From Fig. 4a it can be observed that HMPAM solutions in DI water showed a Newtonian behaviour at low to intermediate shear rates which was followed by a shear thinning behaviour at higher shear rates. The extension of the Newtonian and shear-thinning regimes depends on the concentration of HMPAM. The shear-thinning effect was more pronounced for high concentrations of HMPAM solution. This is explained by the deformation of polymer chains in the shear direction, which allows for easier flow of the molecules, resulting in the reduction of the viscosity with an increase in shear rates.63 However, it was found that at concentrations lower than 0.1 wt%, HMPAM solution only exhibits a Newtonian behaviour over the range of tested shear rates. This suggests that, in this case, the structural characteristics of the polymer chains no longer affect the viscosity. The shear rate dependency of HMPAM solution increased with an increase in polymer concentration. This is ascribed to an increase of associations among polymer chains leading to the higher viscosity and extending the shear thinning region.64 Such shear rate dependency was more pronounced at concentrations larger than the overlap concentration (Cp*), which was calculated to be approximately 0.49 ± 0.01 wt% for HMPAM in DI water (see Fig. S7a, ESI†). From Table S1 (ESI†) it can be seen that relaxation time increases as concentration rises. This means that at higher concentrations, when HMPAM molecule is deformed by shear forces, it requires a longer time to relax to its original conformation.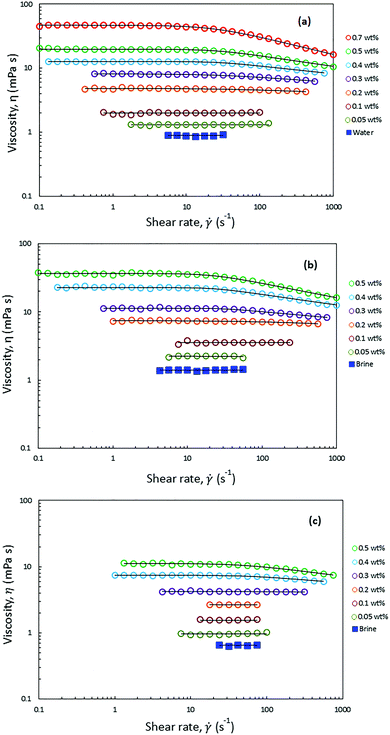 | ||
| Fig. 4 Steady state shear viscosity of HMPAM at different concentrations in (a) DI water at 25 °C (b) Brine2015 at 25 °C and (c) Brine2015 at 70 °C. The solid line is acquired by fitting the experimental data into Carreau–Yasuda model. The fitting parameters are presented in Tables S1–S3 (ESI†). | ||
HMPAM showed an excellent solubility in Brine2015 over the range of tested concentrations, up to 0.5 wt%, which led to complete transparent solutions. Since HMPAM is a non-ionic polymer, it did not strongly respond to the presence of cations in the solvent. Fig. 4b shows that, irrespective of concentration, the viscosity of HMPAM solutions increased in Brine2015 throughout all the tested shear rates as compared to HMPAM solutions in DI water. As HMPAM showed an excellent solubility both in DI water and Brine2015, this is mainly attributed to an increase in solvent viscosity which was measured to be 0.9 ± 0.1 and 1.4 ± 0.1 mPa s for DI water and Brine2015 respectively. This implies that the increase in viscosity is approximately 55% which is close to the observed increase in the viscosity for HMPAM at various concentrations. The overlap concentration of HMPAM dissolved in Brine2015 was found to be approximately 0.30 ± 0.01 wt% (see Fig. S7b, ESI†). This infers that an association among HMPAM chains occurs at lower concentrations in Brine2015 than in DI water. As can be seen in Fig. 4b and Table S2 (ESI†), it was also found that at a given concentration, the shear-thinning behaviour was more pronounced and the relaxation time was longer in Brine2015 when compared with HMPAM in DI water. Fig. 4c shows that increasing the temperature from 25 °C to 70 °C reduced the viscosities of HMPAM solution in Brine2015 and made the shear dependency of concentration less pronounced. Such a reduction in the viscosity was by a factor of 2.3 for HMPAM solutions with concentrations of 0.05 and 0.1 wt%, which is comparable with the reduction in viscosity of Brine2015. At higher concentrations, this factor increased up to 3.3 for 0.5 wt% HMPAM.
Rheology of HMPAM–NPs hybrids at high salinity and temperature
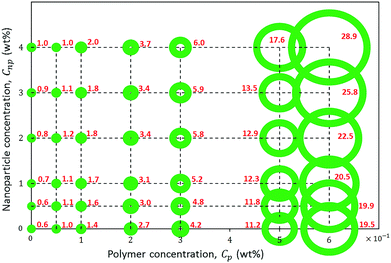
The rheological response of the hybrids of HMPAM and GPTMS-modified NPs at high salinity and elevated temperature was investigated at various HMPAM and NPs concentrations. All the samples were prepared in Brine2015 and the viscosity measurements were performed at 70 °C. The concentration of HMPAM was selected as 0.05, 0.1 and 0.2 wt% in the dilute regime, 0.3 wt% in the boundary of transition from dilute to semi-dilute and 0.5 and 0.6 wt% in the semi-dilute regime. The concentration of NPs also varied from 0.5 to 4 wt%. Fig. 8 shows the results of such viscosity measurements. All the reported viscosities are at shear rate of reported viscosities are at shear rate of 7.5 s−1 which is within the typical range of practical shear rate values in various industrial processes.65 The inserted values on the horizontal axis of the plot in Fig. 5 correspond to the viscosities of HMPAM solutions without NPs. The viscosity of Brine2015 at 70 °C (corresponding to the origin of the graph) was 0.6 ± 0.1 mPa s. Once up to 0.3 wt% of HMPAM was added to Brine2015, the viscosity increased to 4.2 ± 0.1 mPa s. An additional increase of the concentration to 0.5 and 0.6 wt% significantly increased the viscosity to 11.2 ± 0.1 and 19.5 ± 0.1 mPa s respectively as the association among chains was achieved. The values along the vertical axis of the plot in Fig. 5 represent the viscosity of NPs dispersion in the absence of HMPAM. The increase in NPs concentration from 0.5 to 4 wt% increased the viscosity from 0.6 ± 0.1 to 1.0 ± 0.1 mPa s. The viscosity of HMPAM–NPs hybrids is discussed at different polymer concentration regimes. In the dilute regime (Cp = 0.05, 0.1 and 0.2 wt%), the addition of NPs to HMPAM solution did not have a substantial impact on the viscosity of the hybrids. For instance, the addition of 4 wt% NPs to 0.2 wt% HMPAM only increased the viscosity another 1.0 ± 0.1 mPa s. Once the HMPAM concentration was close to the overlap concentration (Cp = 0.3 wt%), as the NPs concentration increased, a more substantial increase in viscosity was perceived (incremental viscosity of 1.8 ± 0.1 mPa s with the addition of 4 wt% NPs). Furthermore, in the semi-dilute regime (Cp = 0.5 and 0.6 wt%) the most significant synergic effect was witnessed. Addition of 4 wt% NPs to 0.5 and 0.6 wt% HMPAM solution increased the viscosity another 6.4 ± 0.1 and 9.4 ± 0.1 mPa s respectively. In this polymer concentration regime, there appears to be a critical NPs concentration (Cnp,c) present, above which the increase in the viscosity of the hybrid is more pronounced.In order to provide a better assessment of the effect of Cnp,c on the viscosity of the HMPAM–NPs hybrid when HMPAM is in the semi-dilute concentration regime, Fig. 6 was plotted. The viscosity measurement was also attempted for the hybrid of 0.5 wt% HMPAM and 3.5 wt% NPs (this was not represented in Fig. 5 for better readability of the graph). As can be seen in Fig. 6, regardless of concentration, the viscosity of the dispersion of NPs remained low, suggesting that the viscosity enhancement of HMPAM–NPs hybrid cannot be considered as a superposition of viscosity of HMPAM solution and NPs dispersion. On the other hand, the increase in NPs concentration increased the viscosity of the hybrids containing 0.5 and 0.6 wt% HMPAM in two different regimes: for the hybrids containing 0.5 wt% HMPAM, with the addition of up to 3 wt% NPs, the viscosity of hybrid grew linearly with a relatively small growth rate; however, from 3 wt% to 4 wt% a second more significant linear increase in viscosity was observed. This suggests that in order to have a considerable increase in the viscosity of the hybrid, the NPs concentration should be above a certain critical threshold (Cnp,c) to bridge between HMPAM chains using hydrophobic–hydrophobic interactions. Cnp,c for the hybrids containing 0.5 wt% HMPAM was 3.0 ± 0.1 wt%. For the hybrid containing 0.6 wt% HMPAM, however, it was found that Cnp,c is lower (1.5 ± 0.1 wt%). This can be explained by the fact that with an increase in the HMPAM concentration in the semi-dilute regime, the polymer chains come in closer proximity to each other and a smaller amount of NPs is needed to enable the bridging between HMPAM molecules.
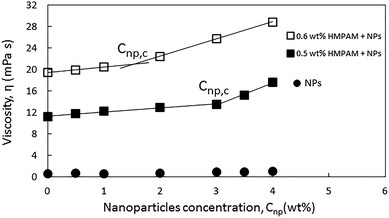 | ||
| Fig. 6 Viscosities of 0.5 and 0.6 wt% HMPAM in combination with NPs at different concentrations ranging from 0 to 4 wt% at shear rate of 7.5 s−1. | ||
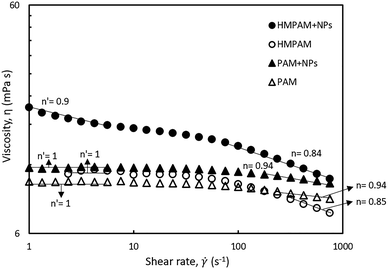
To investigate the influence of hydrophobic–hydrophobic interactions on the NPs-induced bridging between HMPAM molecules, the shear rate dependency of two combinations were studied (a) the hybrid of 0.5 wt% HMPAM and 4 wt% NPs and (b) the hybrid of 0.5 wt% PAM and 4 wt% NPs. As mentioned earlier, unlike HMPAM, PAM does not contain the hydrophobic group of t-butyl acrylamide and it was selected to examine whether there is a similar synergic effect between PAM and NPs or not. As can be seen in Fig. 7, the viscosity of the hybrid of HMPAM and NPs is considerably higher than the viscosity of HMPAM, whereas a synergic effect was not observed for the hybrid of PAM and NPs and the viscosity of this hybrid was only slightly higher than the viscosity of PAM. This finding suggests that NPs can facilitate the bridging between HMPAM molecules only using hydrophobic–hydrophobic interactions, with the end result of creating larger molecules, whereas such an effect was not observed for the hybrid of NPs and PAM. Therefore, it can be inferred that as expected there is no effective interaction between PAM and hydrophobically modified silica NPs.
Moreover, to investigate the rheological properties of the hybrids, where shear-thinning occurs, the shear rate dependency of the hybrids was studied. As can be seen in Fig. 7, the hybrid of HMPAM and NPs showed a shear-thinning behaviour both in low shear rates (<10 s−1) and high shear rates (>100 s−1). The power-law slope of the second shear-thinning is close to the power-law slope of the shear-thinning observed for HMPAM at high shear rates, whereas at low shear rates we did not detect a shear-thinning for HMPAM. We hypothesize the presence of two shear-thinning regimes for HMPAM–NPs hybrid as follows. HMPAM chains are bridged by NPs through two types of interactions between HMPAM chains and NPs; weak interactions and strong interactions. When the hybrid is exposed to a shear-flow field, first at low shear rates, the weak interactions are continuously broken which results in the first shear-thinning regime. In intermediate shear rates, only strong interactions play a role in NPs-induced bridging between HMPAM chains which are not yet broken. As a result, a Newtonian regime is observed for the HMPAM–NPs hybrid at intermediate shear rates. At high shear rates, however, strong interactions are also broken which leads to the second shear-thinning regime. It should be noted that the hybrid of PAM–NPs did not show a shear-thinning behaviour at low shear rates which is again an indication of lack of effective interactions between PAM and NPs.
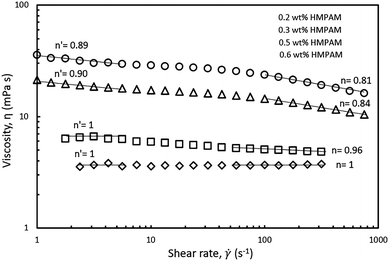
The shear-thinning behaviour was also investigated in different HMPAM concentration regimes. The selected hybrids contained constant NPs concentration of 4 wt% and the concentration of HMPAM varied from 0.2 to 0.6 wt% (i.e. from dilute to the semi-dilute regime). As can be seen in Fig. 8, at low shear rates, for the hybrids with HMPAM in the dilute regime, there was no shear-thinning regime, whereas for the hybrids with HMPAM in the semi-dilute regime we observed a shear-thinning behaviour and the power-law slope was around 0.9 (0.9 and 0.89 for 0.5 and 0.6 wt% HMPAM respectively). At high shear rates, for the hybrids with HMPAM in the dilute regime, the power-law slope was close to unity (1 and 0.96 for 0.2 and 0.3 wt% respectively), whereas when HMPAM was in the semi-dilute regime, the power-law slope was around 0.8 (0.84 and 0.81 for 0.5 and 0.6 wt% respectively). This increase in the power-law slope of the hybrids from dilute to semi-dilute regime is attributed to bridging between different HMPAM chains by NPs in the semi-dilute regime. In a shear-flow field, these bridges are broken and a more shear-thinning behaviour is expected. Formation of such bridges in the dilute regime is not expected as the HMPAM chains are not in close proximity of each other.
Dynamic rheological behaviour of the hybrids at different NPs concentration
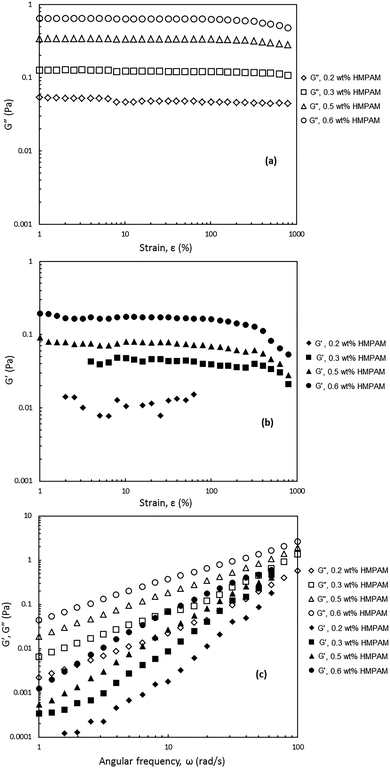
In order to shed light on the viscoelastic response of HMPAM–NPs hybrids, the dynamic viscoelasticity was examined. For this purpose two oscillatory tests were performed: (i) the amplitude sweep test to measure the storage modulus (G′) and loss modulus (G′′) as a function of strain (ε) and (ii) the frequency sweep test to assess the frequency dependence of the storage and loss moduli. The hybrids for which this analysis was performed contained constant NPs concentration of 4 wt% and the concentration of HMPAM varied from 0.2 to 0.6 wt% (i.e. from dilute to semi-dilute regime). This was to investigate the viscoelastic response of the hybrids in the different HMPAM concentration regimes.As can be seen in Fig. 9a and b, for the amplitude sweep test performed on the hybrids, the loss modulus is larger than the storage modulus over the range of strains up to 1000% regardless of HMPAM concentration, implying that even for HMPAM in the semi-dilute regime the rheological response of the hybrids is controlled by the viscous component. The loss modulus was almost constant for the hybrids with 0.2 and 0.3 wt% HMPAM (i.e. when the polymer is in the dilute regime) but it slightly decreased for hybrids containing 0.5 and 0.6 wt% HMPAM (i.e. when the polymer is in the semi-dilute regime) at high strains. The storage modulus of these hybrids, however, showed a sharper decrease at high strains (note that accurate values of storage modulus were not measured for the hybrid with 0.2 wt% HMPAM at low and high strains due to the limitations of the rheometer). The stronger decrease of the storage modulus for these hybrids as compared to hybrids with HMPAM in the dilute regime is an indication of more effective interaction between HMPAM and NPs.
Fig. 9c shows that for all the tested frequencies, from 1 to 100 rad s−1, all the hybrids exhibited predominantly viscous behaviour over elastic behaviour irrespective of HMPAM concentration. It can be seen that with the increase in HMPAM concentration, G′ and G′′ became stronger. The slope of G′ over the slope of G′′ in a log–log plot was calculated for these four hybrids. It was found that for the hybrids containing 0.2 and 0.3 wt% HMPAM (i.e. dilute regime) the slope ratio was 2.0 ± 0.1 and 1.9 ± 0.1 Pa s rad−1 respectively indicating the hybrids behave like a liquid. Nonetheless, for the hybrids containing 0.5 and 0.6 wt% HMPAM (i.e. semi-dilute regime) the slope ratio was 1.7 ± 0.1 and 1.6 ± 0.1 Pa s rad−1 respectively. This decrease in slope ratio with increasing HMPAM concentration indicates that in the semi-dilute regime some degree of bridging between HMPAM chains induced by NPs occurs.
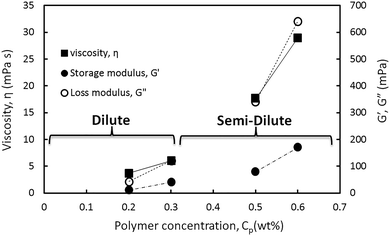
In Fig. 10 the viscosity and storage and loss moduli of the hybrids are plotted within the linear viscoelastic regime. This regime was obtained from the amplitude sweep test at a constant angular frequency of 20 rad s−1 in different HMPAM concentration regimes from dilute to semi-dilute. As can be observed for all three parameters the slope of the data points obtained in the semi-dilute regime became larger than their slope in the dilute regime. It can be concluded that the addition of 4 wt% NPs to HMPAM has a stronger viscoelastic effect when HMPAM is in the semi-dilute concentration regime.
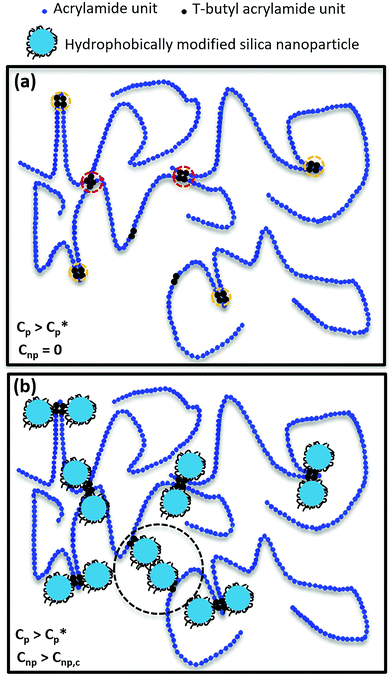
To illustrate various interactions in HMPAM–NPs hybrids, the molecular scenario as indicated in Fig. 11 was drawn. The distribution of hydrophobic groups on HMPAM is random and HMPAM chains have a radius of gyration of approximately 80 ± 5 nm (see eqn (S4) in the ESI†), while the size of silica NPs is approximately 7 nm. The contour length of HMPAM was estimated to be 9.9 ± 1.9 μm which is much larger than the estimated persistence length of 2.2 ± 0.6 nm (see eqn (S5) in the ESI†). Therefore, our long-chain polymer behaves like a random coil. As indicated in Fig. 11a, for HMPAM chains in the semi-dilute regime in absence of NPs, two types of interactions are possible: (a) intra-chain hydrophobic association within an HMPAM chain (orange circles) and (b) inter-chain hydrophobic association between HMPAM chains (red circles). Fig. 11b represents the interaction of hydrophobic groups on HMPAM and hydrophobically modified silica NPs and how silica NPs can play as bridging sites between the HMPAM chains. As discussed before, based on the viscosity results, bridging between HMPAM chains occurs only when the concentration of NPs is above Cnp,c. At concentrations lower than Cnp,c, hydrophobic groups present in the HMPAM are anchored onto hydrophobically modified NPs and there are no free NPs in the dispersant. Nonetheless, beyond the Cnp,c, free NPs come to be available and a further increase in Cnp will result in bridging between different HMPAM chains by NPs (black circle). The existence of the Cnp,c is in agreement with observations of Hu et al.36 and Zhu et al.38 who argued that interaction between polymer and silica NPs occurs by hydrogen bonding. It should be noted that the reason why the synergic effect between HMPAM and NPs is more significant when Cp > Cp*, is because the inter-chain association between some HMPAM chains has occurred previously and the chains are in closer proximity to each other. Consequently, the probability of bridging between HMPAM chains by NPs becomes higher compared to the dilute regime where HMPAM chains are distant from each other. As a result of bridging between HMPAM chains, the movement of HMPAM chains is limited and the hydrodynamic radius of the hybrid increases which eventually results in an increase in the viscosity.
It should be noted that regardless of the concentration of HMPAM and NPs, all the developed hybrids were transparent and no phase separation was observed (see Fig. S3, ESI†). This demonstrates an important aspect of HMPAM–NPs hybrid as an alternative for conventional cEOR polymers at harsh conditions as the enhanced stability is achieved. As long-term thermal stability is another imperative aspect of water-soluble polymers for cEOR, further complementary experiments such as the study of the colloidal stability and change in the hybrids viscosity over time are recommended to investigate the effectiveness of the hybrids at high temperature in a long-term.
Conclusions
We investigated an innovative hybrid system using a combination of a hydrophobically modified polyacrylamide (HMPAM) and hydrophobically modified silica nanoparticles (NPs). This system exhibited enhanced stability in high total dissolved solids (TDS) content and high hardness brines and improved the rheological properties of HMPAM at elevated temperatures. The silica NPs that had been modified by grafting an organic ligand (gamma-glycidoxypropyltrimethoxysilane) onto their surface showed good colloidal stability against aggregation at high salinity, due to the increased potential barrier as compared to bare silica NPs. Viscosity measurements at different HMPAM and NPs concentrations showed that the improved rheological behaviour was more pronounced when the concentration of HMPAM was more than the overlap concentration (Cp* ∼ 0.3 wt%). This occurred because in the semi-dilute regime HMPAM chains are in closer proximity and they can be bridged by NPs which in turn increases the hydrodynamic radius of the hybrid. Results also showed that for a given concentration of HMPAM in the semi-dilute regime, there was a critical concentration of NPs above which the bridging between HMPAM chains by NPs occurred and increased the viscosity more substantially. Dynamic rheological tests indicated that the hybrids were viscous dominated and storage and loss moduli had a stronger increase with HMPAM concentration in the semi-dilute regime compared to the dilute regime due to NPs-induced bridging between HMPAM chains. The results of this study provide insights into the interaction of polymer molecules and NPs in hybrid systems with the end result of enhancing the stability and improving the rheological properties, thus opening a pathway for developing other polymer-based systems for use in harsh conditions.Conflicts of interest
The authors declare no conflict of interest.Acknowledgements
This study is the result of collaboration between Delft University of Technology, The Netherlands Organisation for Applied Scientific Research (TNO) and Kuwait Oil Company. We are grateful to Kuwait Oil Company for funding this project. We are grateful to Filip Neele (TNO) for fruitful comments and valuable discussions. Michiel Slob (TU Delft), Ben Norder (TU Delft), Jacco Eversdijk (TNO) and Jelle Rohlfs (TNO) are greatly acknowledged for their technical support. We are thankful to Sian Jones (TU Delft) for proofreading the paper and to Stephen Eustace (TU Delft) and Guilhem Zwart for assistance with NMR analysis.References
- U. Eduok, R. Suleiman, M. Khaled and R. Akid, Prog. Org. Coat., 2016, 93, 97–108 CrossRef CAS.
- M. Fadil, D. S. Chauhan and M. A. Quraishi, Russ. J. Appl. Chem., 2018, 91, 1721–1728 CrossRef CAS.
- R. Suleiman, H. Dafalla and B. El Ali, RSC Adv., 2015, 5, 39155–39167 RSC.
- A. A. Keller, H. Wang, D. Zhou, H. S. Lenihan, G. Cherr, B. J. Cardinale, R. Miller and Z. Ji, Environ. Sci. Technol., 2010, 44, 1962–1967 CrossRef CAS.
- N. Saleh, T. Phenrat, K. Sirk, B. Dufour, J. Ok, T. Sarbu, K. Matyjaszewski, R. D. Tilton and G. V. Lowry, Nano Lett., 2005, 5, 2489–2494 CrossRef CAS.
- V. K. Sharma, K. M. Siskova, R. Zboril and J. L. Gardea-Torresdey, Adv. Colloid Interface Sci., 2014, 204, 15–34 CrossRef CAS.
- S. Akbari, S. M. Mahmood, I. M. Tan, H. Ghaedi and O. L. Ling, Polymers, 2017, 9(12), 647 CrossRef.
- M. Algharaib, A. Alajmi and R. Gharbi, J. Pet. Sci. Eng., 2014, 115, 17–23 CrossRef CAS.
- T. Yuan, Z. Liu, R. Gao, G. Hu, G. Zhang and J. Zhao, J. Appl. Polym. Sci., 2018, 135, 46086 CrossRef.
- J. E. O. Mayne, J. Appl. Chem., 1959, 9, 673–680 CrossRef CAS.
- R. J. L. W. Lake, W. Rossen and G. Pope, Fundamentals of enhanced oil recovery, Society of Petroleum Engineers, 2014 Search PubMed.
- K. S. Sorbie, Polymer-Improved Oil Recovery, Springer, Netherlands, 1991 Search PubMed.
- J. Sheng, Modern Chemical Enhanced Oil Recovery: Theory and Practice, Gulf Professional Publishing, 2010 Search PubMed.
- M. Mirzaie Yegane, E. Battistutta and P. Zitha, presented in part at the SPE Europec featured at 81st EAGE Conference and Exhibition, London, England, UK, 2019/6/3, 2019.
- B. Al-Shakry, T. Skauge, B. Shaker Shiran and A. Skauge, Energies, 2019, 12(1), 49 CrossRef CAS.
- G. Chauveteau, Water-Soluble Polymers, American Chemical Society, 1986, ch. 14, vol. 213, pp. 227–267 Search PubMed.
- S. Peng and C. Wu, Macromolecules, 1999, 32, 585–589 CrossRef CAS.
- I. Ohmine and T. Tanaka, J. Chem. Phys., 1982, 77, 5725 CrossRef CAS.
- A. Moradi-Araghi and P. H. Doe, SPE, 1987, 2(2), 189–198 CAS.
- D. N. Schulz, J. J. Kaladas, J. J. Maurer, J. Bock, S. J. Pace and W. W. Schulz, Polymer, 1987, 28, 2110–2115 CrossRef CAS.
- C. Senan, J. Meadows, P. T. Shone and P. A. Williams, Langmuir, 1994, 10, 2471–2479 CrossRef CAS.
- A. Durand and D. Hourdet, Polymer, 1999, 40, 4941–4951 CrossRef CAS.
- D. Levitt and G. A. Pope, presented in part at the SPE Symposium on Improved Oil Recovery, Tulsa, Oklahoma, USA, 2008/1/1, 2008.
- P. H. Doe, A. Moradi-Araghi, J. E. Shaw and G. A. Stahl, SPE Reservoir Eng., 1987, 2, 461–467 CrossRef CAS.
- R. Klucker, F. Candau and F. Schosseler, Macromolecules, 1995, 28, 6416–6422 CrossRef CAS.
- E. C. M. Vermolen, M. J. T. Van Haasterecht, S. K. Masalmeh, M. J. Faber, D. M. Boersma and M. A. Gruenenfelder, presented in part at the SPE Middle East Oil and Gas Show and Conference, Manama, Bahrain, 2011/1/1, 2011.
- F. G. C. Tessarolli, S. T. S. Souza, A. S. Gomes and C. R. E. Mansur, Gels, 2019, 5, 7 CrossRef CAS.
- L. Petit, L. Bouteiller, A. Brûlet, F. Lafuma and D. Hourdet, Langmuir, 2007, 23, 147–158 CrossRef CAS.
- D. Portehault, L. Petit, N. Pantoustier, G. Ducouret, F. Lafuma and D. Hourdet, Colloids Surf., A, 2006, 278, 26–32 CrossRef CAS.
- D. Hourdet and L. Petit, Macromol. Symp., 2010, 291–292, 144–158 CrossRef CAS.
- W.-C. Lin, W. Fan, A. Marcellan, D. Hourdet and C. Creton, Macromolecules, 2010, 43, 2554–2563 CrossRef CAS.
- D. Portehault, L. Petit and D. Hourdet, Soft Matter, 2010, 6, 2178–2186 RSC.
- M. Kamibayashi, H. Ogura and Y. Otsubo, Ind. Eng. Chem. Res., 2006, 45, 6899–6905 CrossRef CAS.
- P. Bhardwaj, S. Singh, V. Singh, S. Aggarwal and U. K. Mandal, Int. J. Polym. Mater. Polym. Biomater., 2008, 57, 404–416 CrossRef CAS.
- A. Maghzi, R. Kharrat, A. Mohebbi and M. H. Ghazanfari, Fuel, 2014, 123, 123–132 CrossRef CAS.
- Z. Hu, M. Haruna, H. Gao, E. Nourafkan and D. Wen, Ind. Eng. Chem. Res., 2017, 56, 3456–3463 CrossRef CAS.
- J. Cao, T. Song, Y. Zhu, X. Wang, S. Wang, J. Yu, Y. Ba and J. Zhang, RSC Adv., 2018, 8, 38056–38064 RSC.
- D. Zhu, L. Wei, B. Wang and Y. Feng, Energies, 2014, 7, 3858–3871 CrossRef.
- P. Greenwood, Pigm. Resin Technol., 2011, 40, 275–284 CrossRef CAS.
- S. R. Saunders, M. R. Eden and C. B. Roberts, J. Phys. Chem. C, 2011, 115, 4603–4610 CrossRef CAS.
- S. Skoglund, T. A. Lowe, J. Hedberg, E. Blomberg, I. O. Wallinder, S. Wold and M. Lundin, Langmuir, 2013, 29, 8882–8891 CrossRef CAS.
- T. Phenrat, N. Saleh, K. Sirk, H.-J. Kim, R. D. Tilton and G. V. Lowry, J. Nanopart. Res., 2008, 10, 795–814 CrossRef CAS.
- X. Y. Wu, D. Hunkeler, A. E. Hamielec, R. H. Pelton and D. R. Woods, J. Appl. Polym. Sci., 1991, 42, 2081–2093 CrossRef CAS.
- I. Blute, R. J. Pugh, J. van de Pas and I. Callaghan, J. Colloid Interface Sci., 2007, 313, 645–655 CrossRef CAS.
- F. Book, M. T. Ekvall, M. Persson, S. Lönnerud, T. Lammel, J. Sturve and T. Backhaus, NanoImpact, 2019, 13, 100–111 CrossRef.
- R. Aveyard, B. P. Binks and J. H. Clint, Adv. Colloid Interface Sci., 2003, 100–102, 503–546 CrossRef CAS.
- D. N. Benoit, H. Zhu, M. H. Lilierose, R. A. Verm, N. Ali, A. N. Morrison, J. D. Fortner, C. Avendano and V. L. Colvin, Anal. Chem., 2012, 84, 9238–9245 CrossRef CAS.
- L. C. F. Andrade, J. A. Petronílio, C. E. de A. Maneschy and D. O. de A. Cruz, J. Braz. Soc. Mech. Sci. Eng., 2007, 29, 162–167 Search PubMed.
- E. M. Hotze, T. Phenrat and G. V. Lowry, J. Environ. Qual., 2010, 39, 1909–1924 CrossRef CAS.
- J. Israelachvili, Intermolecular and Surface Forces, Academic Press, 3rd edn, 2011 Search PubMed.
- S. R. Raghavan, J. Hou, G. L. Baker and S. A. Khan, Langmuir, 2000, 16, 1066–1077 CrossRef CAS.
- H. Ohshima, J. Colloid Interface Sci., 1995, 174, 45–52 CrossRef CAS.
- T. Tadros, General Principles of Colloid Stability and the Role of Surface Forces, 2014, pp. 1–22, DOI:10.1002/9783527631193.ch1.
- B. Vincent, J. Edwards, S. Emmett and A. Jones, Colloids Surf., 1986, 18, 261–281 CrossRef CAS.
- A. Jones and B. Vincent, Colloids Surf., 1989, 42, 113–138 CrossRef CAS.
- M. Moskovits and B. Vlčková, J. Phys. Chem. B, 2005, 109, 14755–14758 CrossRef CAS.
- J. C. Berg, An Introduction to Interfaces & Colloids, The Bridge to Nanoscience, World Scientific Publishing Co. Pte. Ltd, Singapore, 2010 Search PubMed.
- C. O. Metin, R. T. Bonnecaze, L. W. Lake, C. R. Miranda and Q. P. Nguyen, Appl. Nanosci., 2014, 4, 169–178 CrossRef CAS.
- C. Omurlu, L. Lake, C. Miranda and Q. P. Nguyen, J. Nanopart. Res., 2011, 13, 839–850 CrossRef.
- A. J. Worthen, V. Tran, K. A. Cornell, T. M. Truskett and K. P. Johnston, Soft Matter, 2016, 12, 2025–2039 RSC.
- C. A. Silvera Batista, R. G. Larson and N. A. Kotov, Science, 2015, 350(6257), 1242477 CrossRef.
- A.-R. Mahdavian, M. Abdollahi and H. R. Bijanzadeh, J. Appl. Polym. Sci., 2004, 93, 2007–2013 CrossRef CAS.
- B. Al-Shammari, T. Al-Fariss, F. Al-Sewailm and R. Elleithy, J. King Saud Univ., Eng. Sci., 2011, 23, 9–14 Search PubMed.
- A. Ait-Kadi, P. J. Carreau and G. Chauveteau, J. Rheol., 1987, 31, 537 CrossRef CAS.
- S. Berg and J. van Wunnik, Transp. Porous Media, 2017, 117, 229–246 CrossRef CAS.
Footnote |
| † Electronic supplementary information (ESI) available: Calculation of the volume fraction of the ligand, pictures of samples to observe the stability of nanoparticles and hybrids over time, details of TEM performed on nanoparticles, tables which include the fitting parameters for Carreau–Yasuda model (eqn (4)), molecular weight estimation of HMPAM and PAM, estimation of overlap concentration, radius of gyration and persistence length for HMPAM and 1H NMR spectrum for t-butyl acrylamide. See DOI: 10.1039/d0sm01254h |
| This journal is © The Royal Society of Chemistry 2020 |

