 Open Access Article
Creative Commons Attribution 3.0 Unported Licence
A lubrication replenishment theory for hydrogels†
Elze
Porte‡
 *ab,
Philippa
Cann
a and
Marc
Masen
a
aTribology Group, Department of Mechanical Engineering, Imperial College London, SW7 2AZ, UK
bDepartment of Mechanical Engineering and Materials Science, Yale University, New Haven, CT 06511, USA. E-mail: elze.porte@yale.edu
First published on 13th October 2020
Abstract
Hydrogels are suggested as less invasive alternatives to total joint replacements, but their inferior tribological performance compared to articular cartilage remains a barrier to implementation. Existing lubrication theories do not fully characterise the friction response of all hydrogels, and a better insight into the lubrication mechanisms must be established to enable optimised hydrogel performance. We therefore studied the lubricating conditions in a hydrogel contact using fluorescent imaging under simulated physiological sliding conditions. A reciprocating configuration was used to examine the effects of contact dimension and stroke length on the lubricant replenishment in the contact. The results show that the lubrication behaviour is strongly dependent on the contact configurations; When the system operates in a ‘migrating’ configuration, with the stroke length larger than the contact width, the contact is uniformly lubricated and shows low friction; When the contact is in an ‘overlapping’ configuration with a stroke length smaller than the contact width, the contact is not fully replenished, resulting in high friction. The mechanism of non-replenishment at small relative stroke length was also observed in a cartilage contact, indicating that the theory could be generalised to soft porous materials. The lubrication replenishment theory is important for the development of joint replacement materials, as most physiological joints operate under conditions of overlapping contact, meaning steady-state lubrication does not necessarily occur.
1. Introduction
Hydrogels are considered as articular cartilage (AC) replacement materials for the treatment of local joint damage.1,2 Hydrogels are polymeric materials with a biphasic, porous structure, are often biocompatible, and can be made with appropriate stiffness to mimic cartilage.2 Using hydrogels to replace damaged AC would provide a less intrusive and cheaper alternative to total joint replacement procedures. Articular joints have to withstand millions of motion cycles,3 and whilst the number of clinical studies into the durability of hydrogels as AC replacement materials is limited, some implanted hydrogels have shown early loosening and surface wear.4,5 In addition, research has shown that the frictional performance of hydrogels is lacking compared to AC.6–8 Developing hydrogels with appropriate tribological properties requires a detailed understanding of the governing lubrication mechanisms under a range of loading and motion conditions.The fluid load support theory is one of the foremost lubrication theories for both cartilage and hydrogel lubrication.7–11 This lubrication theory relates the friction of AC to the interstitial fluid pressure.12 Upon loading of the AC matrix, the interstitial fluid pressurises, and consequently carries part of the applied load. The sharing of load between the solid and fluid phase at the contact interface determines the friction coefficient.12 The evidence for fluid load support in hydrogels comes mostly from friction measurements: a low friction value is interpreted as a high level of fluid load support, and a high friction value is interpreted as a low level of fluid load support.7,8 However, friction measurements alone do not provide sufficient evidence for fluid load support. In previous work13 the authors used photoelastic stress measurements of hydrogels during reciprocating frictional testing to show that the observed frictional behaviour could not be related to fluid load support in the material, and it was hypothesized that the replenishment of lubricant in the contact governs the tribological behaviour of the hydrogel.
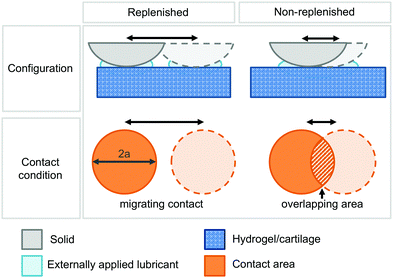
Fig. 1 illustrates the distinction between the hypothesized replenished and non-replenished regimes, dependent on the contact conditions.13 When the stroke length is larger than the contact width (>2a), the system has a migrating contact condition. This configuration was identified as a replenished state, as the motion likely ensures sufficient lubricant supply in the contact, either by a lubricating film or direct re-exposure to the externally applied lubricant, to maintain low friction. When the stroke length is shorter than the contact width (<2a), an overlapping area in the contact is continuously loaded. This condition was identified as a non-replenished state, as it is thought to relate to insufficient lubricant supply in the contact and consequently high friction.
Considering these two different states is important for biotribological testing protocols. In many interactions the area of contact is often relatively large compared to the motion amplitude, which means the lubrication condition can be classified as a non-replenished contact. For example, a continuously loaded area was identified in a hip joint during a full gait cycle14 and the range of motion in a knee joint was estimated to be of the same order of magnitude as the contact width.15 This physiological condition is very similar to the overlapping contact configuration, i.e. when the stroke <2a.
Reduced-scale experimental tests involving cartilage or hydrogels, e.g. those using typical laboratory-based tribometer setups, are often performed employing a contact width of several millimetres.16,17 The stroke length can therefore be of a similar order of magnitude to the contact width. For example, whilst investigating the effects of sliding velocity, Accardi et al.18 changed the stroke length of the reciprocating motion, and consequently changed the contact conditions from a migrating to an overlapping contact configuration, without specifically taking this into account.
The contact kinematics are known to affect potential starvation of lubricated systems.19 However, few studies take the stroke length into account as a cause of lubricant starvation.20,21 In total knee replacements the friction coefficient was shown to increase with reduced rotation angles, which was thought to relate to lubricant starvation due to stroke length effects.21 An increasing friction coefficient with decreasing stroke lengths was also observed in cartilage–cartilage contacts,22 but the underlying mechanism was explained by the level of fluid load support provided by the cartilage. The number of studies that specifically consider the lubrication conditions in overlapping contacts is limited, and more evidence of the governing lubrication mechanism in these contact configurations is required.
One of the aspects that should be considered in hydrogel tribology is the role of interfacial friction from polymeric interactions.23–25 Friction forces in a contacting polymer system are due to the stretching and relaxation of the polymer chains.24,26,27 The number of polymer interactions increases with the polymer chain density, and the friction coefficient of hydrogel systems has been related to the probability of chain–chain interactions.28 The local water content in the contact of hydrogels has also been found to affect friction forces, where friction was observed to increase due to fluid drainage from the contact area.23,29
The friction coefficient of the polymer system can be expressed in terms of the contact area and interfacial shear stress. The interfacial friction force in a circular contact between a spherical probe and flat surface can be described as:30,31
| FF = τA = τπa2 | (1) |
 | (2) |
Substituting eqn (1) and (2) into Coulomb's friction law results in the following proportionality for the coefficient of friction:
 | (3) |
In the non-replenished regime we expect the contact area to be composed of a poorly lubricated part (the overlapping area in Fig. 1) and a well-lubricated part. The friction force in the contact can be described as:
| FF = τnrAnr + τrAr | (4) |
| FF ≈ τnrAnr. | (5) |
Replacing the term for FF in eqn (3) by the term in eqn (5) gives the expected proportionality for the friction coefficient in a non-replenished contact:
 | (6) |
In this manuscript, we aim to test the replenishment hypothesis by providing experimental evidence for the lubricant replenishment of an overlapping contact and relating this to measured friction values.
2. Experimental
2.1 Hydrogels
Hydrogels were prepared following the method reported previously.13 In summary, for the ‘base’ hydrogel, an optically transparent gel was obtained by dissolving 15 wt% poly(vinyl alcohol) pellets (PVA, 146![[thin space (1/6-em)]](https://www.rsc.org/images/entities/char_2009.gif) 000–186
000–186![[thin space (1/6-em)]](https://www.rsc.org/images/entities/char_2009.gif) 000 Mw, 99+% hydrolysed, Sigma Aldrich, UK) in a mixture of 80 wt% di-methyl sulfoxide (DMSO, ≥99%, FG, Sigma-Aldrich, UK) and 20 wt% ultra-pure water.36 The mixture was moulded into a 45 × 120 × 8 mm rectangle and frozen at −23 °C for 20 hours. After freezing, the samples were cut to smaller rectangles of 45 × 24 × 8 mm and stored in ultra-pure water, which was regularly changed over the course of at least a week to rinse the DMSO from the samples. The elastic modulus of this hydrogel in unconfined compression was found to be between 0.1–0.25 MPa, depending on the applied strain.13
000 Mw, 99+% hydrolysed, Sigma Aldrich, UK) in a mixture of 80 wt% di-methyl sulfoxide (DMSO, ≥99%, FG, Sigma-Aldrich, UK) and 20 wt% ultra-pure water.36 The mixture was moulded into a 45 × 120 × 8 mm rectangle and frozen at −23 °C for 20 hours. After freezing, the samples were cut to smaller rectangles of 45 × 24 × 8 mm and stored in ultra-pure water, which was regularly changed over the course of at least a week to rinse the DMSO from the samples. The elastic modulus of this hydrogel in unconfined compression was found to be between 0.1–0.25 MPa, depending on the applied strain.13
A more compliant hydrogel was included in this study to test the general applicability of the replenishment theory. This ‘soft’ hydrogel had a lower compressive stiffness (0.05–0.08 MPa) compared to the base hydrogel, which was achieved by using a lower polymer content (5%) compared to the base material (15%). The preparation procedure was the same as for the base hydrogel.
2.2 Tribological testing
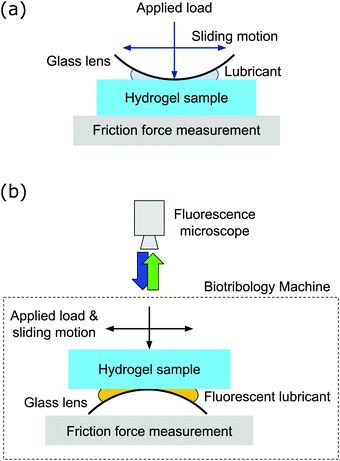
Friction tests were performed on the Biotribology Machine (BTM, PCS Instruments, UK) in two different configurations. Fig. 2 shows a schematic overview of the two setups. The configuration in Fig. 2a has a convex glass lens (20 × 20 mm, #45-237, Edmund Optics, UK) in the upper position, rubbing in reciprocating motion against a stationary lower sample of hydrogel. The configuration in Fig. 2b consists of a transparent hydrogel sample in the upper position rubbing in reciprocating motion against a stationary glass lens (20 × 20 mm, #45-237, Edmund Optics, UK) in the lower position. Recordings of the fluorescent lubricant were taken in this configuration using a stereo microscope (SMZ1270, Nikon, Japan). Specimens in the lower position were glued to a glass slide that can be attached to the lower stationary platform. Force transducers are attached to this platform to record the friction forces.The configuration in Fig. 2a was used for all tests that did not require fluorescence observations, because setting-up the test and changing the specimens is much easier and controllable in this configuration compared to the one in Fig. 2b, which was therefore used only for the fluorescence measurements. The measurement of the friction force did not observably change between the configurations. The friction coefficient is calculated by taking an average value of the friction force over the middle 50% of each stroke to exclude effects of the turning point. The average difference between the maximum/minimum values and the calculated average over a stroke varied between 0.03–0.06 N, depending on the measured friction value.
Tests were performed with controlled normal loads of 0.5, 0.9, and 1.8 N on the base hydrogel and 0.9 N on the soft hydrogel. The resulting contact pressures ranging between 10 and 50 kPa are relatively low compared to contact pressures in joints (several MPa peak pressure14,37), because the maximum pressure was limited by the size and shape of the lens and force restrictions of the experimental setup. All tests were performed at an average sliding velocity of 20 mm s−1, which is a representative physiological condition with other studies identifying physiological sliding velocities varying between 1–60 mm s−1.16,17,38,39Table 1 summarises the contact conditions of the tests. Stroke lengths ranging between 3–10 mm and 6–16 mm were used on the base and soft hydrogel respectively to perform tests for both migrating and overlapping conditions. To ensure the average sliding velocity was 20 mm s−1 for each test, regardless of chosen stroke length, the motion frequency was adapted between 0.6–3.3 Hz.
| Test conditions | Base | Soft |
|---|---|---|
| Applied load | 0.5–1.8 N | 0.9 N |
| Sliding velocity | 20 mm s−1 | 20 mm s−1 |
| Approx. contact width (2a) | ≈4.8–6.7 mm | ≈9.9 mm |
| Approx. contact pressure | ≈0.03–0.05 MPa | ≈0.01 MPa |
| Stroke length | 3–10 mm | 6–16 mm |
| Frequency | 1–3.3 Hz | 0.6–1.7 Hz |
2.3 Fluorescent measurements and analysis
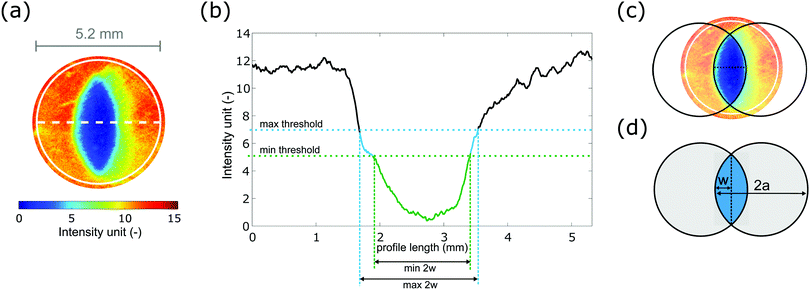
To visualise the lubricant in the contact, fluorescein sodium salt (used as fluorescent tracer, Sigma Aldrich, UK) was dissolved in ultra-pure water at a 0.05% w/w concentration to create a fluorescent lubricant. The stereo microscope was fitted with a P-EFL Epi-fluorescence attachment with GFP-L filter (Nikon, Japan). A blue light source (420–500 nm, pE-300 white, CoolLED, UK) was used to excite the fluorescein at its excitation wavelength of 460 nm. The emitted light at 515 nm passed through the GFP-L filter and the fluorescent emission images were captured using a Grasshopper 3 camera (2.3 MP, Point Grey Research, Canada). A 10 μl drop of lubricant was applied to the glass lens before each test. A new hydrogel test sample was used for every test, as the fluorescent dye diffuses into the porous hydrogel sample during tests.To investigate the relationship between friction and contact replenishment the size of the poorly lubricated non-replenished area was quantified from the fluorescent contact images. Fig. 3a shows a representative fluorescent intensity map of a contact with a clear non-replenished area. The contact area is indicated by the white circle, and the blue area in the centre of the contact indicates an area with a low fluorescence intensity that relates to a lack of lubricant. The size of this non-replenished area was quantified by taking an intensity profile through the centre of the contact, as indicated by the dashed line. The intensity profile is shown in Fig. 3b.
Minimum and maximum intensity thresholds were set to approximate the width 2w of the non-replenished area. The lower threshold was set at a level of 5 intensity units, because this was the lowest at which the non-replenished area could be distinguished in all images. The upper threshold was set at 7 intensity units, because this was the highest value at which no values clearly outside the non-replenished area would be included for all images. These thresholds are indicated in Fig. 3b with the corresponding minimum and maximum non-replenished width highlighted in green and blue respectively. The average width between the minimum and maximum width was used to calculate the average non-replenished area size.
Fig. 3c shows the fluorescence measurement of Fig. 3a, with the two black circles representing the size of the contact superimposed. The curvature of the non-replenished area fits the curvature of the contact area, meaning that the size of the non-replenished area can be calculated as the overlapping area of the two black circles. The non-replenished area was calculated from the measurements of the non-replenished width 2w and the contact width 2a, as schematically represented in Fig. 3d, as the area of a circle segment:40
 | (7) |
As shown previously15 this relationship can be approximated by:
 | (8) |
Inserting this approximation for the non-replenished contact size into eqn (6) provides the following proportional relationship for the expected coefficient of friction for a contact operating in the non-replenished regime:
 | (9) |
3. Results and discussion
3.1 Typical friction traces and fluorescent images
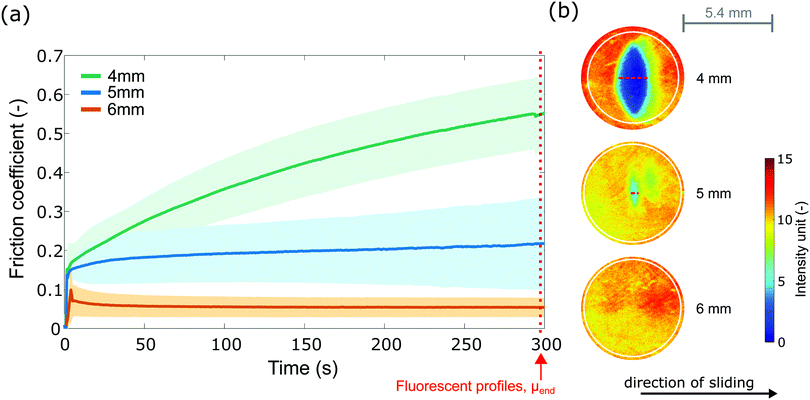
Fig. 4a shows the average friction traces for three stroke lengths with 0.9 N load on the base hydrogel, using the configuration shown in Fig. 2a. These traces are representative for the different contact conditions, which can be catergorised based on the relative stroke length Srel, defined as Srel = stroke/2a; a 4 mm stroke with an overlapping contact (Srel < 1, green line), a 6 mm stroke with a migrating contact (Srel > 1, orange line), and a 5 mm stroke in between the overlapping and migrating conditions (Srel ≈ 1, blue line). The graph shows that the 4 mm stroke resulted in a clearly rising friction coefficient over time and the 6 mm stroke resulted in a stable and low friction coefficient over time. This is in agreement with results obtained in previous work13 with a similar distinction between short and long stroke lengths. The average friction coefficient for the 5 mm stroke lies between the low friction of the 6 mm stroke and the high friction of 4 mm stroke. Further analysis will use the friction coefficient and fluorescent profiles taken towards the end of a test as indicated by the arrow and dotted line in Fig. 4a.The lubricant replenishment in the contact was monitored using the stereomicroscope throughout the duration of the tests (300 s) using the configuration shown in Fig. 2b. Fluorescent images were taken immediately after the starting the test and every subsequent 50 s, and each test condition was repeated on three samples. Fig. 4b shows representative images of the fluorescent intensity in the contact towards the end of the test for the base hydrogel at 0.9 N at 4 mm stroke length (Srel < 1), 5 mm stroke length (Srel ≈ 1), and 6 mm stroke length (Srel > 1). Images of all tests on the base hydrogel are included in the ESI† (Fig. S1). The approximate contact area is shown in the images with a white line, and the width of the non-replenished area is indicated with a red dashed line. The images show that the replenishment of the contact relates to the stroke length: the 4 mm stroke length shows a clear area with very low fluorescent intensity, indicating non-replenishment of the contact. The 6 mm stroke length shows uniform fluorescent intensity throughout the contact and therefore a fully replenished contact. A low intensity area is visible in the contact for the 5 mm stroke, albeit much less pronounced than for the 4 mm stroke. These fluorescence results can be directly linked to observed variations in the friction results: low friction values were measured for all tests that showed a fully replenished contact, and high friction values were measured for all tests with a non-replenished area.
3.2 Relationship between friction and replenishment
Friction measurements were performed for 300 s for all experimental variations using the configuration shown in Fig. 2a and at the same sliding speed of 20 mm s−1. All measured friction traces showed similar behaviour as shown in Fig. 4a: non-replenished contacts resulted in elevated friction levels at the end of the tests and replenished contact conditions showed low friction levels throughout the tests. The current study uses the friction coefficient μend, which was calculated as the average friction coefficient over the last 5 cycles before the end of a test at 300 s, in combination with a relative stroke length to investigate the replenishment of the different hydrogels and loading conditions.Fig. 5 shows the friction coefficient at the end of the test μend plotted against the relative stroke length for all experiments done on both the base hydrogel and the soft hydrogel. The first point of interest is the transition between the replenished and non-replenished regimes, which is indicated by the vertical dashed black line at Srel ≈ 1. The graph shows that for all test conditions the friction was relatively low for values Srel > 1, and the friction increased strongly with decreasing stroke length for values Srel < 1. This means the overlapping contact condition (Srel < 1) provides a good indication of the transition into the non-replenished regime for all test variations.
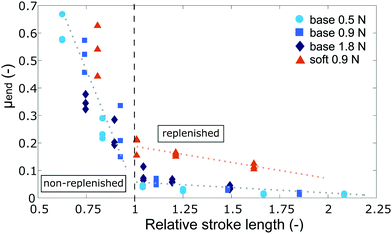 | ||
| Fig. 5 Friction coefficient μend and relative stroke length for all test variations. Dotted lines were added to guide the reader. | ||
The second point of interest is the frictional behaviour in the non-replenished regime (Srel < 1). The grey dotted lines were added in Fig. 5 to highlight the dependence between the relative stroke length and the friction coefficient in both friction regimes. In the non-replenished regime, the friction coefficient increases rapidly with decreasing stroke length. The finding that the frictional behaviour increases strongly with decreasing relative stroke length confirms that the tribological behaviour is likely driven by the size of the overlapping area. The relationship between friction and non-replenished area is further investigated in part (a) of this section, and part (b) further discusses the lubricant loss mechanism in the non-replenished regime.
The third point of interest is the frictional behaviour in the replenished regime (Srel > 1). All test variations in the replenished regime show a relatively low friction compared to the non-replenished regime, and the friction coefficient decreases slightly with increasing stroke length. The friction coefficient in the replenished regime shows higher values for the soft hydrogel (>0.1) compared to the base hydrogel (<0.1). The mechanisms of replenished lubrication thought responsible for this frictional behaviour are further discussed in part (c) of this section.
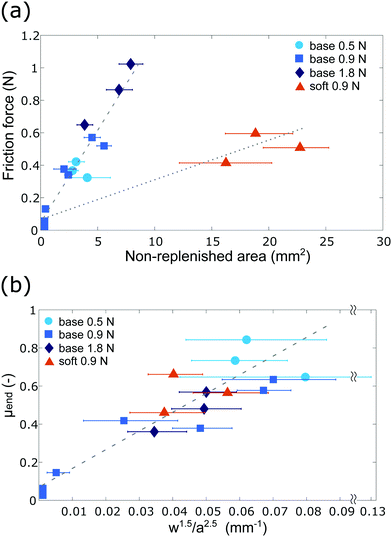
The graph in Fig. 6a shows that the measured friction force increased with increasing size of the non-replenished area. The different dotted lines indicate that the increase of the friction force with increasing non-replenished area is much steeper for the base hydrogel than for the soft hydrogel. The friction force is relatively low for the soft hydrogel, since the non-replenished area is about 4 to 5 times larger than for the base hydrogel at similar friction forces. When converting these forces and areas to the coefficient of friction and the non-replenished area measure w1.5/a2.5, as shown in Fig. 6b, the results obtained for both hydrogels align.
The observation that the soft hydrogel showed a lower friction force, but a similar friction coefficient compared to the base hydrogel highlights the role of contact mechanics. For hydrogels with different stiffness the full derivation of the friction coefficient from eqn (3)–(9) should be considered:
 | (10) |
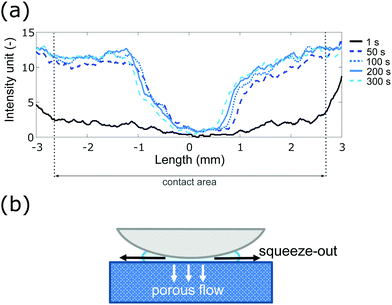 | ||
| Fig. 7 (a) Fluorescent profiles tracking time evolution of non-replenished area; (b) schematic of suggested lubricant loss mechanisms. | ||
Fig. 7b illustrates the two lubricant loss mechanisms that are suggested for the hydrogel contact: squeeze-out of lubricant from the contact region and loss due to fluid flow into the porous hydrogel structure.43,44 This resembles the mechanism of squeeze film lubrication, where a lubricating film initially forms due to the fast approach of two surfaces, thus ‘trapping’ the lubricant. Since the fluorescent profiles show an initial presence of the lubricant, such a film was likely formed in the contact. The film subsequently diminishes because of the squeeze-out flow from contact and fluid flow into the porous material.43,44 This loss of lubricant can explain the rapid increase in friction in the first few seconds of a test.
The further increase of friction throughout the test could relate to a local reduction of water content of the hydrogel in the non-replenished area. Because the non-replenished area did not show significant changes over time to explain the friction increase, the continuous load on the non-replenished area could have contributed to the increasing friction. Continued loading results in fluid exudation from the contact, reducing the local water content in both hydrogels and cartilage contacts.23,45 This fluid dwell due to extended loading has been directly related to an increase in friction in hydrogels.23,29 It is likely that once a non-replenished area was established due to the lack of lubricant, the friction coefficient further increased due to fluid dwell from the non-replenished area.
• the friction coefficient is relatively low in the replenished regime compared to the non-replenished regime;
• the friction coefficient in this regime decreases slightly with increasing stroke length;
• the friction coefficient measured for the soft hydrogel is higher than the base hydrogel.
These observations will be discussed in the following paragraphs.
The system is well-lubricated in the replenished regime, as evidenced by the low friction values. Additional experiments were carried out in a so called stationary contact configuration, with a hydrogel lens sliding across a flat glass microscope slide, to identify the contribution of contact rehydration by contact exposure to the lubricant and elastohydrodynamic lubrication (EHL). In this stationary contact configuration the contact on the hydrogel lens is continuously loaded and its surface is not directly exposed to the lubricant. The friction coefficient of the experiments with a 6 mm stroke length in this configurations was comparable (μ < 0.05) to experiments in the migrating contact configuration. This indicates that the contact likely operated in the EHL regime, where a lubricating film forms due to the relative motion of the surfaces, rather than by direct exposure of the hydrogel surface to the lubricant.
The observed trends, such as a decreasing friction with increasing load, match typical EHL behaviour,11,46 but the observation that the friction coefficient decreased slightly with increasing stroke length is not covered by EHL theory. This mismatch could be due to the assumption in EHL of sufficient presence of lubricant in the contact, and to EHL not accounting for any changes in the stroke length. It is known that for relatively short strokes, the development of the fluid film is related to the stroke length20,47 and this may explain the observed frictional behaviour.
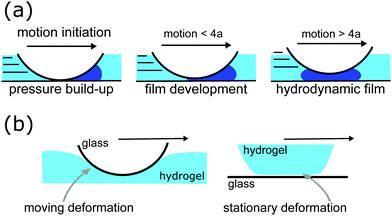
Fig. 8a schematically illustrates how the lubricating film develops in the contact. The images show that the pressure build-up starts to develop when motion is initiated but will only be fully developed after a sufficiently long sliding distance. In literature, a stroke length larger than twice the contact width (4a) has been reported as the threshold for full film development in a reciprocating contact.47 It is expected that the friction coefficient will decrease for more developed films, and reach a minimum when full separation of the surfaces occurs.48 In the current study the fluid film was very likely not fully developed, as evidenced by the decreasing average friction coefficient with increasing stroke length that was observed for all tests.
Once the film is fully developed, its thickness will be independent of the stroke length, and depend on the sliding velocity, applied load, and the elastic modulus following the relationship established for EHL of isoviscous fluids:49
 | (11) |
The third observation was that the soft hydrogel showed higher friction in the replenished regime than the stiffer base hydrogel. This was likely caused by the relatively larger deformation of the softer hydrogel under load. To confirm this hypothesis, an additional test was performed using a soft hydrogel lens-shaped specimen sliding against a glass slide, using a stroke length of 16 mm. Fig. 8b schematically shows the original setup (left), in which a glass lens slides against a flat hydrogel sample, and (right) the inverted setup in which a hydrogel lens slides against a flat glass slide. In the original setup the hydrogel continuously deforms and recovers, whereas in the inverted setup the deformation of the hydrogel is stationary. The average friction coefficient was 0.10 for the moving deformation setup and 0.03 for the stationary deformation setup, due to the contribution of deformation losses to the friction force.50,51 These losses appear in the elastic recovery in the wake of the sliding motion and increase with indentation depth.51 Since the stress-relaxation responses for all hydrogels used in this study were similar, the increased friction coefficient can be related to the larger deformations of the soft hydrogel. The friction coefficient in the replenished regime depends therefore on both the formation of a hydrodynamic film and the in-contact deformation of the hydrogel.
3.3 Replenishment in cartilage lubrication
Because of the similarities between hydrogels and articular cartilage, the effect of a non-replenished area should also be considered when investigating AC lubrication. The effects of the contact configuration on the tribological behaviour of cartilage have been studied before,16,39 but the effect of an overlapping contact configuration is not often taken into consideration. Here, additional tests were performed on bovine AC samples to investigate the relevance of the replenishment theory to AC lubrication.Cartilage plugs, including subchondral bone, of ∅ 14 mm were extracted from bovine femur, obtained from a local butcher and frozen until required. The plugs were secured on a glass slide using bone cement and used as the lower sample on the BTM. Because of the different mechanical properties of cartilage compared to the hydrogel samples used in this study, the test conditions had to be changed in order to obtain both overlapping and migrating contact conditions. Tests on the cartilage plugs were performed at 5 N loads using a glass lens with a larger radius of 31.01 mm (compared to 15.70 mm on the hydrogel), a 2 mm stroke length for the non-replenished condition, and an 8 mm stroke length for the replenished condition. The same 0.05% w/w fluorescein solution as used in the hydrogel experiments was used as the lubricant.
Fig. 9a shows example friction traces for the cartilage tests at 2 and 8 mm stroke lengths. All friction traces are included in the ESI† (Fig. S2). For the 2 mm stroke the friction increases gradually over time, whilst it remains low for the 8 mm stroke. Averages of the non-replenished and replenished results obtained on hydrogel (4 mm and 6 mm at 0.9 N) are shown in the graph in grey for comparison. Although the friction coefficient values obtained for cartilage are lower than for the hydrogels the trends and behaviour are similar, showing a strong friction increase for overlapping contact conditions. In-contact fluorescent measurements could not be performed as cartilage is non-transparent, but Fig. 9b shows the remaining fluorescent stain on the cartilage surface after a 2 mm test. The image shows an area with low fluorescence in the contact that closely resembles the non-replenished area on the hydrogel surface. The combination of the friction results and the fluorescent stain suggest that the cartilage and hydrogel samples behave similarly with respect to the replenishment of the contact.
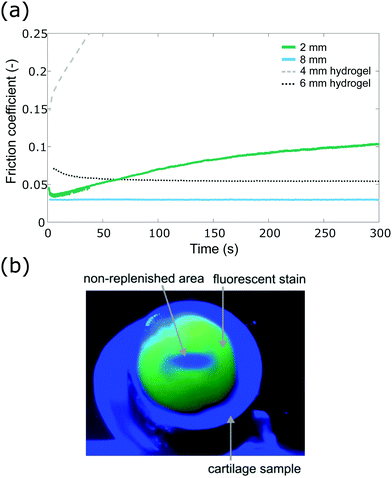 | ||
| Fig. 9 (a) Example friction coefficients measured on bovine cartilage; (b) fluorescent stain on cartilage surface. | ||
The similar qualitative behaviour between hydrogels and cartilage indicates that the overlapping contact configuration should be a factor to take into account for tribological tests of soft porous materials in general. It also means hydrogels could offer opportunities to better understand cartilage lubrication. Although the pore size in hydrogels is often much greater (∼0.5–40 μm)8,15,52 compared to several nanometres (∼2–14 nm) in cartilage,53,54 hydrogels can offer controlled parameter variations that are not possible with cartilage, such as pore size control to alter permeability.8 Permeability may be a key factor in cartilage lubrication55 and a larger pore size has been shown to be beneficial in hydrogel lubrication,15 indicating that the microstructure likely influences lubricating properties by fluid flow through the matrix. Controlled variations in the microstructure of hydrogels can be used to further understand the role of permeability and fluid transport in the lubrication of soft porous materials.
3.4 General applicability of the replenishment theory
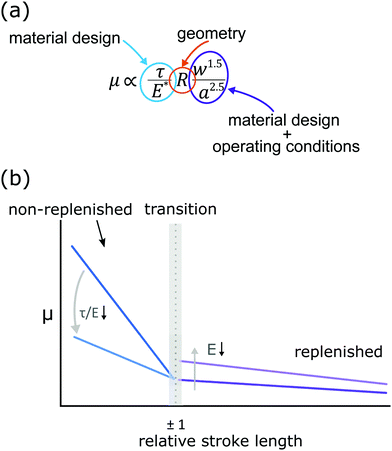
The obtained results can be used to develop a general replenishment theory that is applicable for various porous biphasic materials under a range of operational conditions. Tests performed at different applied loads and for various material characteristics all showed that the frictional behaviour depends on the relative stroke length of the reciprocating motion and can be divided into two regimes: a non-replenished regime with relatively high friction that further increases with decreasing stroke length and a replenished regime with relatively low friction that slightly decreases further with increasing stroke length. The transition between these regimes is closely related to the transition from the migrating contact condition to the overlapping contact condition. Whilst the exact value of the frictional behaviour depends on the operating conditions and the properties of the materials in contact, the above ‘rules and trends’ were observed in all performed tests and are therefore likely to be generally applicable for compliant soft porous materials.Eqn (10), which is repeated in Fig. 10a, related the friction coefficient in the non-replenished regime to the contact characteristics. The figure highlights which terms are related to the material design and which to the operating conditions of the contact. The most important parameters related to material design are the interfacial shear stress τ and the elastic modulus E*. Fig. 10b shows this theory of replenishment schematically and includes the expected frictional behaviour based on the material design parameters. It shows that the friction coefficient in the non-replenished regime decreases with decreasing τ/E and in the replenished regime increases with decreasing E. The replenishment theory emphasizes the importance to test and optimize cartilage replacements for poorly lubricated conditions, where the friction coefficient can increase rapidly compared to a well-lubricated system. The suggested guidelines for the tribological optimisation of hydrogels for articular cartilage replacements are a high elastic modulus and low interfacial shear stress. The interfacial shear stress is an important parameter affecting the friction in the non-replenished regime, whereas the elastic modulus is important for the optimisation in both the non-replenished and replenished regimes.
The friction coefficient scaled as μ ∝ w1.5/a2.5, which is a term that depends on the combination of stroke length, applied load, and elastic modulus. The width w of the non-replenished area is determined by the stroke length and the contact radius a, and a is determined by the applied load and the elastic modulus of the material. For given operating conditions the elastic modulus can be optimised to reduce the friction coefficient by minimising a. In the current work the elastic modulus was increased by increasing the polymer content of the hydrogels. The modulus of hydrogels can also be increased by increasing the number of freeze–thaw cycles42 during preparation of the hydrogel. An increased elastic modulus may also be beneficial in the replenished area, since the friction coefficient was shown to be lower for materials with higher stiffness. In addition, the transition between replenished and non-replenished regimes at a relative stroke length Srel ≈ 1 will occur at shorter stroke lengths for smaller contact areas since Srel ∝ 1/a. This increases the range of operating conditions that lead to a replenished and thus low friction system.
The interfacial shear stress is the other material parameter that could be optimised to improve performance. Although no direct relationship between friction and wear of hydrogels is known,56,57 reduced shear stresses could prevent early loosening of the implant. The shear stress was reduced in the current work by reducing the polymer content. Choosing a different polymer will alter the frictional behaviour,17,25 as this relates to polymeric interactions at the surface. A better understanding of how the surface chemistry of hydrogels affects the interfacial shear strength is required to enable a systematic optimisation of the tribo-system. Cartilage surfaces in natural joints are covered by a boundary layer of lipids and proteins and this is thought to ensure low friction and act as a sacrificial layer when the opposing surfaces are in direct contact. It should be investigated if a similar boundary lubrication mechanism is possible to minimise the friction coefficient of hydrogel-based systems and increase their durability as cartilage implants.
4. Conclusion
The lubrication of a reciprocating hydrogel–glass contact was investigated for a range of stroke lengths that were of similar magnitude to the contact size, which is a relevant physiological condition in joint lubrication. Based on the presented results, three main conclusions can be drawn. First, in short-stroke reciprocating contacts, two possible lubrication regimes may occur: non-replenished and replenished. The transition between these two regimes is related to the transition with reducing stroke length from a migrating contact condition to an overlapping contact condition. Second, the non-replenished lubrication regime is characterised by relatively high friction that strongly increases with reducing stroke length, and a direct relationship between the size of the non-replenished area and the friction force was found. The replenished lubrication regime shows a relatively low friction that decreases slightly with increasing stroke length. Third, lubricant replenishment and the occurrence of an overlapping contact should be considered when determining the experimental test conditions for soft porous materials. The contact configuration strongly influences the resulting friction and lubrication results.Conflicts of interest
There are no conflicts to declare.References
- G. D. O’Connell, E. G. Lima, L. Bian, N. O. Chahine, M. B. Albro, J. L. Cook, G. A. Ateshian and C. T. Hung, J. Knee Surg., 2012, 25, 187–196 CrossRef.
- K. L. Spiller, S. A. Maher and A. M. Lowman, Tissue Eng., Part B, 2011, 17, 281–299 CrossRef CAS.
- M. Silva, E. F. Shepherd, W. O. Jackson, F. J. Dorey and T. P. Schmalzried, J. Arthroplasty, 2002, 17, 693–697 CrossRef.
- J. Lange, N. Follak, T. Nowotny and H. Merk, Unfallchirurg, 2006, 109, 193–199 CrossRef CAS.
- C. Meyer, U. Horas, R. Hörbelt and R. Schnettler, Unfallchirurg, 2005, 108, 163–166 CrossRef CAS.
- M. M. Blum and T. C. Ovaert, Mater. Sci. Eng., C, 2013, 33, 4377–4383 CrossRef CAS.
- F. Li, Y. Su, J. Wang, G. Wu and C. Wang, J. Mater. Sci.: Mater. Med., 2010, 21, 147–154 CrossRef CAS.
- M. Parkes, C. Myant, D. Dini and P. Cann, Tribol. Int., 2015, 89, 9–18 CrossRef CAS.
- E. D. Bonnevie, V. J. Baro, L. Wang and D. L. Burris, J. Biomech., 2012, 45, 1036–1041 CrossRef CAS.
- R. Krishnan, M. Kopacz and G. A. Ateshian, J. Orthop. Res., 2004, 22, 565–570 CrossRef.
- D. Baykal, R. J. Underwood, K. Mansmann, M. Marcolongo and S. M. Kurtz, J. Mech. Behav. Biomed. Mater., 2013, 28, 263–273 CrossRef CAS.
- G. A. Ateshian, H. Wang and W. M. Lai, J. Tribol., 1998, 120, 241–248 CrossRef.
- E. Porte, P. Cann and M. Masen, J. Mech. Behav. Biomed. Mater., 2019, 90, 284–294 CrossRef CAS.
- G. Wang, W. Huang, Q. Song and J. Liang, Asian J. Surg., 2017, 40, 463–469 CrossRef.
- E. M. Porte, PhD thesis, Imperial CollegeLondon, 2019.
- A. C. Moore and D. L. Burris, Osteoarthr. Cartil., 2017, 25, 99–107 CrossRef CAS.
- P. E. Milner, M. Parkes, J. L. Puetzer, R. Chapman, M. M. Stevens, P. Cann and J. R. T. Jeffers, Acta Biomater., 2018, 65, 102–111 CrossRef CAS.
- M. A. Accardi, D. Dini and P. M. Cann, Tribol. Int., 2011, 44, 565–578 CrossRef CAS.
- P. M. E. Cann, B. Damiens and A. A. Lubrecht, Tribol. Int., 2004, 37, 859–864 CrossRef CAS.
- M. Kaneta, H. Todoroki, H. Nishikawa, Y. Kanzaki and Y. Kawahara, J. Tribol., 2000, 122, 787–795 CrossRef.
- T. Stewart, Z. M. Jin and J. Fisher, Proc. Inst. Mech. Eng., Part H, 1997, 211, 451–465 CrossRef CAS.
- J. Katta, Z. Jin, E. Ingham and J. Fisher, Med. Eng. Phys., 2008, 30, 1349–1363 CrossRef.
- E. R. Reale and A. C. Dunn, Soft Matter, 2017, 13, 428–435 RSC.
- A. A. Pitenis, J. M. Urueña, K. D. Schulze, R. M. Nixon, A. C. Dunn, B. A. Krick, W. G. Sawyer and T. E. Angelini, Soft Matter, 2014, 10, 8955–8962 RSC.
- J. P. Gong, Soft Matter, 2006, 2, 544–552 RSC.
- T. Tominaga, T. Kurokawa, H. Furukawa, Y. Osada and J. P. Gong, Soft Matter, 2008, 4, 1645–1652 RSC.
- A. C. Dunn, A. A. Pitenis, J. M. Urueña, K. D. Schulze, T. E. Angelini and W. G. Sawyer, Proc. Inst. Mech. Eng., Part H, 2015, 229, 889–894 CrossRef.
- A. C. Dunn, W. G. Sawyer and T. E. Angelini, Tribol. Lett., 2014, 54, 59–66 CrossRef CAS.
- T. Shoaib and R. M. Espinosa-Marzal, ACS Appl. Mater. Interfaces, 2019, 11, 42722–42733 CrossRef CAS.
- A. Arvanitaki, B. J. Briscoe, M. J. Adams and S. A. Johnson, Tribol. Ser., 1995, 30, 503–511 CAS.
- B. J. Briscoe, A. Arvanitaki, M. J. Adams and S. A. Johnson, Tribol. Ser., 2001, 39, 661–672 Search PubMed.
- K. L. Johnson, Contact Mechanics, Cambridge University Press, Cambridge, 1985, pp. 84–106 Search PubMed.
- K. L. Johnson, K. Kendall and A. D. Roberts, Proc. R. Soc. A, 1971, 324, 301–313 CAS.
- K. L. Johnson and J. A. Greenwood, J. Colloid Interface Sci., 1997, 192, 326–333 CrossRef CAS.
- K. D. Schulze, S. M. Hart, S. L. Marshall, C. S. O’Bryan, J. M. Urueña, A. A. Pitenis, W. G. Sawyer and T. E. Angelini, Biotribology, 2017, 11, 3–7 CrossRef.
- S. H. Hyon, W. I. Cha and Y. Ikada, Polym. Bull., 1989, 22, 119–122 CrossRef CAS.
- W. A. Hodge, R. S. Fijan, K. L. Carlson, R. G. Burgess, W. H. Harris and R. W. Mann, Proc. Natl. Acad. Sci. U. S. A., 1986, 83, 2879–2883 CrossRef CAS.
- E. D. Bonnevie, V. J. Baro, L. Wang and D. L. Burris, Tribol. Lett., 2011, 41, 83–95 CrossRef CAS.
- M. Caligaris and G. A. Ateshian, Osteoarthr. Cartil., 2008, 16, 1220–1227 CrossRef CAS.
- E. W. Weisstein, Circular Segment, http://mathworld.wolfram.com/CircularSegment.html, accessed 18 April 2019.
- J. M. Urueña, A. A. Pitenis, R. M. Nixon, K. D. Schulze, T. E. Angelini and W. G. Sawyer, Biotribology, 2015, 1–2, 24–29 CrossRef.
- J. L. Holloway, A. M. Lowman and G. R. Palmese, Soft Matter, 2013, 9, 826–833 RSC.
- J. S. Hou, V. C. Mow, W. M. Lai and M. H. Holmes, J. Biomech., 1992, 25, 247–259 CrossRef CAS.
- D. J. Knox, S. K. Wilson, B. R. Duffy and S. McKee, IMA J. Appl. Math., 2013, 80, 376–409 CrossRef.
- M. Parkes, P. Cann and J. Jeffers, J. Biomech., 2017, 60, 261–265 CrossRef.
- M. Arjmandi, M. Ramezani, A. Nand and T. Neitzert, Wear, 2018, 406–407, 194–204 CrossRef CAS.
- K. Ikeuchi, S. Fujita and M. Ohashi, Tribol. Int., 1998, 31, 613–618 CrossRef.
- J. P. Gleghorn and L. J. Bonassar, J. Biomech., 2008, 41, 1910–1918 CrossRef.
- M. Ratoi and H. A. Spikes, Tribol. Trans., 1999, 42, 479–486 CrossRef CAS.
- J. A. Greenwood and D. Tabor, Proc. Phys. Soc., 1958, 71, 989–1001 CrossRef.
- M. J. Adams, B. J. Briscoe and S. A. Johnson, Tribol. Lett., 2007, 26, 239–253 CrossRef CAS.
- J. L. Holloway, A. M. Lowman and G. R. Palmese, Acta Biomater., 2010, 6, 4716–4724 CrossRef CAS.
- D. Majda, A. Bhattarai, J. Riikonen, B. D. Napruszewska, M. Zimowska, A. Michalik-Zym, J. Töyräs and V. P. Lehto, Microporous Mesoporous Mater., 2017, 241, 238–245 CrossRef CAS.
- V. C. Mow, A. Ratcliffe and A. R. Poole, Biomaterials, 1992, 13, 67–97 CrossRef CAS.
- B. T. Graham, A. C. Moore, D. L. Burris and C. Price, Osteoarthr. Cartil., 2017, 1–8 Search PubMed.
- M. E. Freeman, M. J. Furey, B. J. Love and J. M. Hampton, Wear, 2000, 241, 129–135 CrossRef CAS.
- J. K. Katta, M. Marcolongo, A. Lowman and K. A. Mansmann, J. Biomed. Mater. Res., Part A, 2007, 83, 471–479 CrossRef.
Footnotes |
| † Electronic supplementary information (ESI) available. See DOI: 10.1039/d0sm01236j |
| ‡ The work in this article was conducted at Imperial College London. The author is now based at Yale University. |
| This journal is © The Royal Society of Chemistry 2020 |

