
 Open Access Article
 This Open Access Article is licensed under a
 Creative Commons Attribution 3.0 Unported Licence
Unfolding mechanism and free energy landscape of single, stable, alpha helices at low pull speeds†
Ana Elisa
Bergues-Pupo‡
 ,
Reinhard
Lipowsky
and
Ana
Vila Verde§
*
,
Reinhard
Lipowsky
and
Ana
Vila Verde§
*
Max Planck Institute of Colloids and Interfaces, Department of Theory & Bio-Systems, Am Mühlenberg 1, 14476 Potsdam, Germany. E-mail: ana.vilaverde@mpikg.mpg.de; Fax: +49 (331) 567 9602; Tel: +49 (331) 567 9601
First published on 30th September 2020
Abstract
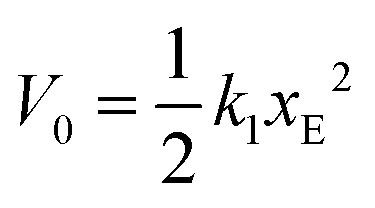
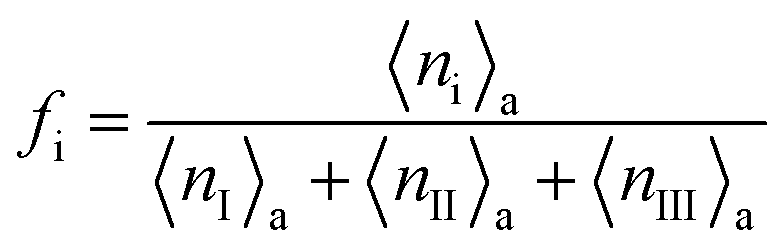
Single alpha helices (SAHs) stable in isolated form are often found in motor proteins where they bridge functional domains. Understanding the mechanical response of SAHs is thus critical to understand their function. The quasi-static force–extension relation of a small number of SAHs is known from single-molecule experiments. Unknown, or still controversial, are the molecular scale details behind those observations. We show that the deformation mechanism of SAHs pulled from the termini at pull speeds approaching the quasi-static limit differs from that of typical helices found in proteins, which are stable only when interacting with other protein domains. Using molecular dynamics simulations with atomistic resolution at low pull speeds previously inaccessible to simulation, we show that SAHs start unfolding from the termini at all pull speeds we investigated. Unfolding proceeds residue-by-residue and hydrogen bond breaking is not the main event determining the barrier to unfolding. We use the molecular simulation data to test the cooperative sticky chain model. This model yields excellent fits of the force–extension curves and quantifies the distance, xE = 0.13 nm, to the transition state, the natural frequency of bond vibration, ν0 = 0.82 ns−1, and the height, V0 = 2.9 kcal mol−1, of the free energy barrier associated with the deformation of single residues. Our results demonstrate that the sticky chain model could advantageously be used to analyze experimental force–extension curves of SAHs and other biopolymers.
1 Introduction
Single alpha helices (SAHs) differ from most helices found in proteins: whereas most protein helices are metastable and short-lived in the absence of intra- or intermolecular interactions with other protein domains, SAHs maintain a stable helical configuration in aqueous solution in the absence of interactions with other biomacromolecules. SAHs have been found in the proteomes of bacteria, archaea and eukaryotes.1–4 They are typical components of motor proteins, where they act as spacer or connector segments between globular domains,1,2,5,6 and could realize similar functions in artificial materials. Clarifying the properties of SAHs is thus important to understand the functioning of motor proteins and for their targeted application in materials science.Natural SAHs typically contain a large fraction of positively and negatively charged amino acids, and (i, i + 3) or (i, i + 4) salt bridges (where i denotes the position of an amino acid in the linear amino acid sequence) are thought to be particularly important for their thermodynamic stability.7,8 The pattern of positively and negatively charged amino acids is not indispensable for SAH formation, however: polyglutamic acid9 and polylysine10,11 also form SAHs at pH levels where the side chain residues are uncharged.
The mechanical response to tensile forces has been investigated using single molecule force spectroscopy (SMFS) or optical tweezers experiments for only a few SAHs.9–13 Current evidence suggests that both the magnitude of the unfolding force and the qualitative features of the force–extension curve depend on the amino acid sequence, for reasons that are not yet understood. Single molecule experiments show that the stretching of the six turn (≈22 amino acids) helical linker connecting the My12 and My13 domains of muscle protein myomesin occurs around 40 pN in a reversible way.13 A comparable unfolding force (F < 30 pN) was also observed for the much longer SAH domain (97 residues) from myosin 10.12 Substantially more intense forces, however, have been reported from atomic force microscopy for unfolding of homopolypeptide SAHs: 150 < F/pN < 200 for polylysine (in the form Cys3–Lys30–Cys)10,11 and up to 1000 pN for polyglutamic acid (Glu80–Cys).9 For the natural SAHs, for polylysine and for coiled coils under tension, experimental evidence indicates that unfolding takes place at constant force, making these structures important force absorbers.10–14 In contrast, for polyglutamic acid the force increases monotonically with extension.9
Steered molecular dynamics simulations can provide great mechanistic insight about the deformation of single helices under tension. To date, most simulations have focused on metastable helices (either homopolypeptides or natural sequences);15–18 whether SAHs respond as metastable helices remains an open question. A constant force plateau was observed in atomistic, explicit solvent simulations of a 52-residue helix belonging to the vimentin AH1 domain simulated isolated in solution (i.e., in a metastable state).18 Hydrogen bond breaking was proposed to be the key barrier to unfolding, in a velocity-dependent manner: at low pull speeds helices appeared to unfold turn-by-turn via the simultaneous breaking of 3-to-4 hydrogen bonds, whereas at large pull speeds (>1 nm ns−1) hydrogen bonds appeared to break individually and helices unfold residue-by-residue. This velocity-dependent mechanism was thought to be behind the two regimes of dependence of the unfolding force on pulling speed that were observed in the simulations. Unfolding started randomly throughout the helix and not just at the pulled ends, i.e., cooperativity was low.17,18 To date we are aware of only a single simulation study of a SAH, with 97 residues.12 That study, with atomistic resolution and implicit solvent representation, indicated this helix unfolds at constant force, consistent with experiments on the same system and with simulations of metastable helices.17,18 In contrast with simulations of metastable helices, unfolding started predominantly from the ends of the SAH suggesting that the cost of creating an interface between helical and unfolded domains is high, i.e., cooperativity in SAHs is high. Hydrogen bond breaking was identified as the key barrier to unfolding, but in a velocity-independent manner. The plateau force observed in simulations at the lowest simulated pull speed (0.01 nm ns−1) was ≈50 pN, comparable to the experimentally detected force (<30 pN) for the same SAH12 despite the large difference in pull speed between experiment and simulation.
There is a clear need to clarify the mechanism of unfolding of SAHs, the extent to which it is cooperative, its dependency on the pull speed and the dominant interactions behind the barrier to unfolding, among other open questions; here we address some of these issues using all-atom molecular simulation studies of a short SAH. Reliable and complete understanding, however, can only be obtained with a strong connection between experiment and simulation. But, how to facilitate this connection given that pull speeds rarely overlap? Both simulation and experimental studies suggest that, for helices as well as for many other polymers under tension, rupture events are well described by a 1-dimensional free energy landscape consisting of two stability wells separated by a barrier.19–21 Coarse insight into this free energy landscape is often extracted, for experimental and for simulation data, via dynamic force spectroscopy models: most often the Bell–Evans,22 Yoreo23 and Dudko24 models. These models yield the distance, xE, from the first stable state to the transition state, and the zero-force off rate, koff, of the rupture event; the Yoreo model in addition includes the equilibrium unfolding force. One way, albeit indirect, of connecting experiment and simulation is by comparing these parameter values. In addition, for a given estimate of the natural vibration frequency, the height, V0, of the free energy barrier can be calculated from koff. This procedure results in estimates of V0 with substantial uncertainty, though. This uncertainty is problematic because our ability to predict the mechanical response of helices – and thus directly connect experiments and simulations – depends critically on this parameter. Bad estimates of V0 lead to predictions of the mechanical response that are not even qualitatively correct.25–27 Another issue with using these models to treat data is that both the Bell–Evans and the Dudko models assume refolding does not take place, an assumption that is not met at low pulling speeds. A final issue is that the models do not consider the case of cooperative helix unfolding.
The sticky chain model proposed by Jäger28 can resolve these issues and thus provide a better connection between SMFS experiments and molecular simulations. This model, based on a 1-dimensional free energy landscape as the Bell and Yoreo models, can in principle be used to fit the full force–extension curve of a polymer under tension and yields, among other parameters, reliable values of V0. It is a kinetic model that allows for unfolding and refolding and is for that reason valid also at low pull speeds, where the Bell–Evans model may fail.20 It comes in two flavors – cooperative or not – enabling insight into this point. It is simple to implement, and thus advantageous relative to Monte Carlo models that could also be used for the same purpose.19 The greater detail of the sticky chain model relative to Bell–Evans-like models thus offers a pathway to connect experimental and simulation force–extension curves. To our knowledge, however, this model has only been used to fit force–extension curves of bacterial pili;29 its suitability for SAHs has not yet been tested.
In this work we combine atomistic, implicit solvent simulations of a SAH with the sticky chain model, to gain insight into the deformation mechanism of SAHs under tension and to test the potential of the sticky chain model to fit force–extension curves of protein helices. We use steered molecular dynamics and umbrella sampling simulations to systematically characterize the mechanical response and deformation mechanism of a short SAH in a range of pull speeds, starting from the high-speed, non-equilibrium unfolding regime all the way to quasi-static unfolding; our lowest pull speed (10−3 nm ns−1) is one order of magnitude lower than reported all-atom simulation studies. We then use the simulation data to test the extent to and conditions under which the sticky chain model28 can be used to fit force–extension curves of SAHs. We evaluate how the parameters of the 1-dimensional free energy landscape associated with residue unfolding obtained from the fit compare with expectations, and with values obtained from fits of the Bell–Evans and the Yoreo models.
2 Methods
2.1 Atomistic simulations of the alpha helix
We choose a de novo designed SAH of length 28 amino acids, consisting of four repeats of the basic sequence AEEEKRK, see Fig. 1. This sequence was designed synthetically with longer repeats, and contains numerous salt bridges between acidic and basic residues which likely contribute to its thermal stability.30 All the simulations were conducted in implicit solvent in GROMACS 5.1.1, using the Amber99SB-ILDN force field.31 The implicit solvent uses the Generalized Born (GB) and surface area algorithms. The Still approximation was used for calculating the GB part. Born radii were calculated at every time step, and a 1 nm cutoff was used for this calculation. The distance for the dielectric offset when calculating the Born radii was 0.009 nm. The non-polar surface area algorithm used an Ace-type approximation and the surface tension was set to 0.0049 kcal mol−1 Å−2. The dielectric constant of the implicit solvent was set to 80 and the implicit salt concentration was 0.137 mol dm−3. The initial helical structure was generated manually using Chimera,32 and was minimized for 50![[thin space (1/6-em)]](https://www.rsc.org/images/entities/char_2009.gif) 000 steps with the steepest descent algorithm. Equilibration was conducted in three steps of 200 ps each: the unrestrained system was heated from 10 K (step 1), to 150 K (step 2) and finally to 300 K (step 3). All subsequent simulations were conducted at T = 300 K. All simulations used a velocity rescaling thermostat that includes a stochastic term and thus samples the correct canonical ensemble; the coupling time constant was 2 ps. Constraints on all covalent bonds were applied with the LINCS algorithm, with 4th order expansion of the constraint coupling matrix and the number of iterative corrections set to 1. These settings enable using an integration time step of 2 fs. The cutoff distances for the Coulomb and the van der Waals interactions were 5 nm and 1 nm, respectively, and a charge group cutoff scheme was used.
000 steps with the steepest descent algorithm. Equilibration was conducted in three steps of 200 ps each: the unrestrained system was heated from 10 K (step 1), to 150 K (step 2) and finally to 300 K (step 3). All subsequent simulations were conducted at T = 300 K. All simulations used a velocity rescaling thermostat that includes a stochastic term and thus samples the correct canonical ensemble; the coupling time constant was 2 ps. Constraints on all covalent bonds were applied with the LINCS algorithm, with 4th order expansion of the constraint coupling matrix and the number of iterative corrections set to 1. These settings enable using an integration time step of 2 fs. The cutoff distances for the Coulomb and the van der Waals interactions were 5 nm and 1 nm, respectively, and a charge group cutoff scheme was used.
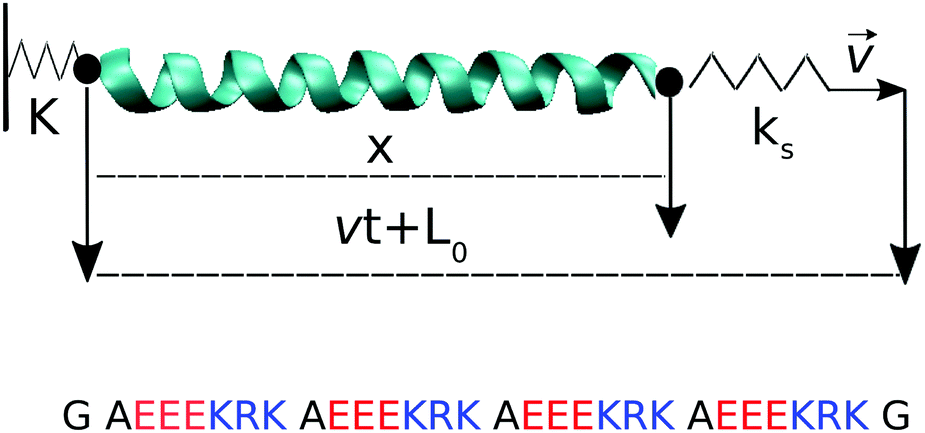 | ||
| Fig. 1 (top) Pulling geometry of the alpha helix. The distance x is the end-to-end distance of the chain measured from the terminal Cα atoms, projected along the pull axis; its value at t = 0 is L0 = 3.46 nm. (bottom) Amino acid sequence in one-letter code. Two glycine residues (G) are added at either end of the helix. Positively and negatively charged amino acids are colored in blue and red respectively. | ||
Pulling simulations were conducted at constant speed, v ∈ {10−3, 10−2, 10−1, 1} nm ns−1. For the three highest pull speeds, thirty independent runs were started from the same initial configuration, with velocity reassignment at t = 0. For the lowest pull speed, only four independent runs were performed because of their high computational cost. Force–extension curves averaged over 4 runs already overlap with the 30-run average for each of the two intermediate pull speeds (comparison not shown). The 4 runs done for the lowest pull speed should thus be sufficient. Pulling was done via a virtual spring of constant ks connected to the Cα carbon of glycine at the C-terminus of the helix; the Cα of the glycine at the N-terminus was restrained via a virtual spring of constant K, see Fig. 1. The virtual springs had values K = 10ks = 1000 kJ mol−1 nm−2. Configurations were saved every vt = 0.01 nm unless otherwise noted, resulting in 1000 saved configurations per simulation run. For the analysis of the hydrogen bond breaking events, simulations at the lowest pull speed were repeated to save configurations every 10 ps (i.e., the same as for the highest pull speed) but using a limited strain range, 0.5 < ε = vt/L0 < 0.8, to avoid excessively large trajectory files.
Umbrella sampling simulations were performed to build the potential of mean force as a function of the extension. Starting conformations were obtained from a pulling trajectory at v = 10−2 nm ns−1, by selecting configurations at equally spaced displacements (vt = 0.2 nm), yielding 30 separate umbrella simulations. The umbrella restraint was applied to the Cα of the terminal amino acids and the restraint constant was 100 kJ mol−1 nm−2. Each umbrella was simulated for 50 ns.
2.2 Two-state chain model
The sticky chain model by Jäger28 is a velocity-dependent mesoscopic model that describes the structural transition of a one-dimensional chain under a stretching force. In contrast with other helix–coil transition models (e.g., the Zimm–Bragg model33), the sticky chain model describes non-equilibrium properties like the dependence of the force–extension curves on the pulling velocity. Each link of the chain can be in two states characterized by equilibrium lengths b0 and b0 + ΔL, respectively, see Fig. 2. The deformation basin of each state is harmonic with elastic constants k1 and k2, respectively.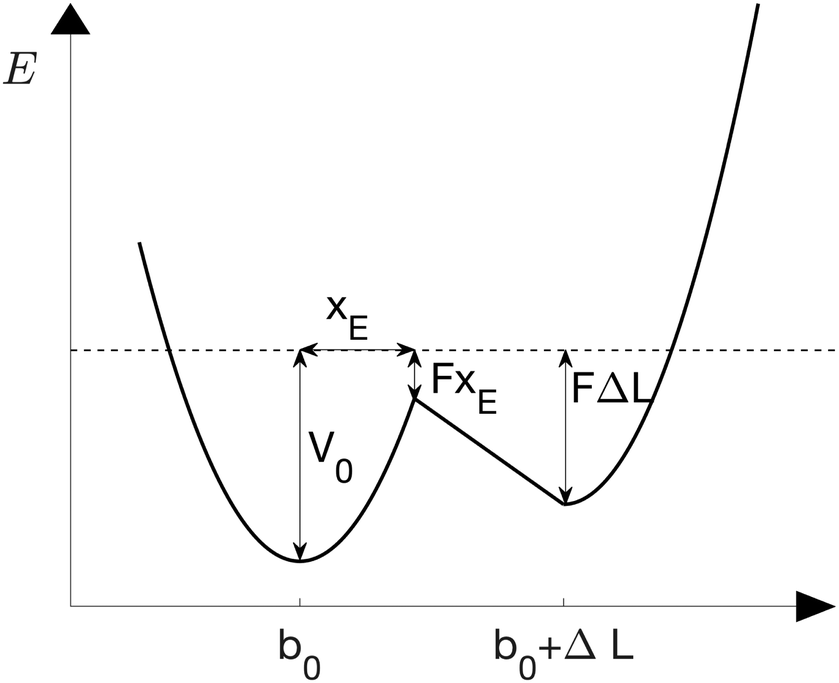 | ||
| Fig. 2 Double well potential of the chain model under a constant force F.28 The folded and unfolded states have equilibrium distances b0 and b0 + ΔL, respectively and elastic constants k1 and k2. The position of the unfolding barrier is xE and is force-independent. | ||
The transitions between the two states are thermally activated and are described by Bell-like kinetics, namely the transition rate depends exponentially on the external force. The equations describing the model are for the force–strain curve:
 | (1) |
 | (2) |
| ε = vt/L0, | (3) |
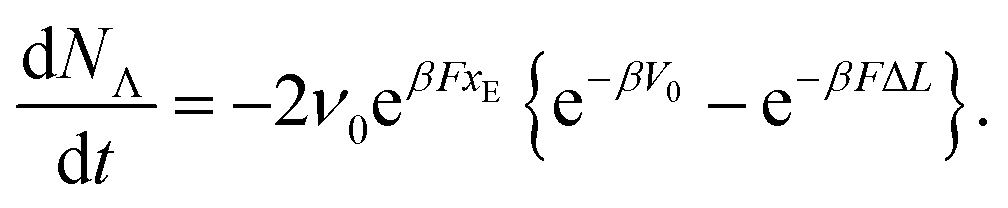
A particularity of this double-well potential model is that at zero force, the energy of the unfolding barrier V0 coincides with the energy of the unfolded state, i.e., the barrier to refolding at zero force is zero. This choice has negligible impact on the dependence of the unfolding force on the pulling speed20 but has the advantage of allowing a direct determination of the attempt frequency of opening of each link:
| koff = ν0 × exp−βV0. | (4) |
 | (5) |
For the conditions of our simulations, only 3 parameters of the two state model (k1, k2 and ν0) are obtained from fitting the force–extension curves obtained in the atomistic simulations, because the remaining parameters can be inferred from the atomistic model as explained below.
3 Results and discussion
3.1 Atomistic simulations in implicit solvent
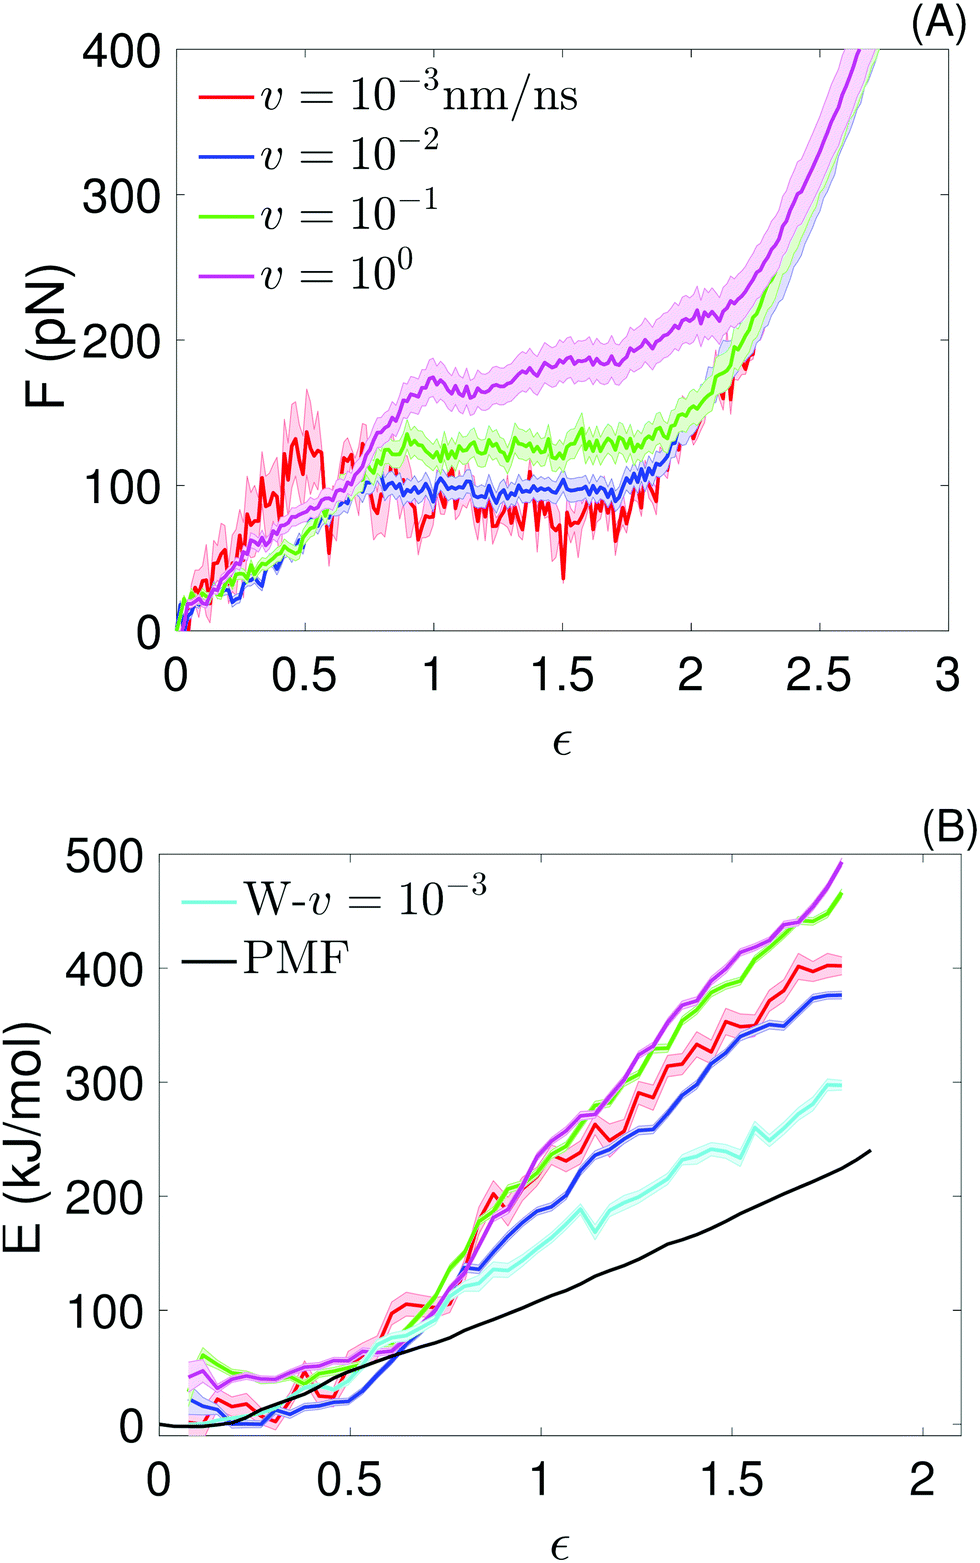 | ||
| Fig. 3 Atomistic simulations: (A) average force–strain curves at the indicated pull speeds, obtained from the molecular dynamics simulations. For the lowest pull speed, the average is over 4 force traces; for the other pull speeds, it is over 30 force traces. The strain is defined as ε = vt/L0. Average values of the plateau forces are shown in Table 1. (B) Potential of mean force from umbrella sampling (black), work (W–v = 10−3; cyan) realized at the lowest pull speed, and potential energy for the 4 pull velocities (same colors as in (A)), as a function of the chain strain (ε = x/L0), obtained from the molecular dynamics simulations. The different definition of strain used here is necessary to directly compare the PMF with the quantities extracted from the pull simulations. Every (E,ε) point of the potential energy curves is obtained by binning E(t) values of all simulation runs performed for each v in the corresponding strain bin and averaging over the number of E-points per bin (this number is not constant); the shadow show the standard error of the mean. An analogous procedure is used to obtain the W–v = 10−3 curve. | ||
Analytical and numerical models have demonstrated that force plateaus naturally arise from a two-state free energy landscape associated with extension of links in a chain; the extent of cooperativity determines whether the force remains truly constant or increases slowly with extension in the plateau or quasi-plateau region.21,28 Force plateaus have also been seen in simulations and experiments of different molecules under tension and in a wide range of pulling velocities, suggesting two-state free energy landscapes associated with stretching are common to many (bio)polymers. For example, force plateaus have been observed in simulations of helices in tension, even at higher pulling velocities16,18,35 or under adiabatic conditions;34,36,37 in single molecule measurements of polylysine SAHs,10 of helical segments connected by joints,37,38 of coiled coils,14,39 of dextran19 and of double stranded DNA;40,41 in steered molecular dynamics simulations of duplex DNA,42 and simulations of coiled coils in tension39 and shear.43,44
The average plateau force (Fp; see Table 1), increases substantially with increasing pull speed, varying between 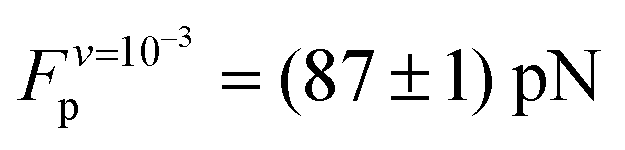 at the lowest pull speed up to ≈200 pN at the highest pull speed. The plateaus at the two lowest pull speeds, v ∈ {10−3, 10−2} nm ns−1, almost overlap, suggesting that unfolding at the lowest pull speed may take place under quasi-static conditions. To test this possibility, we calculated the work realized on the helix at the lowest pull speed and compare it with the potential of mean force (PMF) as a function of strain calculated using the umbrella sampling simulations. Both curves (light blue and black) are shown in Fig. 3(B) and clearly do not overlap, indicating that unfolding at the lowest velocity in fact does not proceed under quasi-static conditions.
| v (nm ns−1) | ||
|---|---|---|
| 10−1 | 10−2 | 10−3 |
| 126 ± 0.5 | 97 ± 0.5 | 87 ± 1 |
The difference between the PMF and the work realized at v = 10−3 nm ns−1 (Fig. 3(B)) together with the fact that the plateau forces at the two lowest pulling velocities are very similar, suggest that there is a timescale separation between the processes playing a significant role at equilibrium and those important for v ≥ 10−3 nm ns−1. We attempted to gain insight into these processes by plotting the secondary structure as a function of time for two fixed values of strain of the umbrella simulations. The results, shown in ESI,† Fig. S8, indicate that the secondary structure substantially changes as a function of time in some parts of the peptide and that some of the changes occur only once within the simulated 50 ns. We speculate that these infrequent but substantial structural changes increase the chain entropy in the PMF calculations and thus soften the helix. These rare events are not well-sampled even at the slowest pull speed used in the pull simulations, which would explain why the work to extend the helix realized at this pull speed is larger than the PMF.
A plateau force <30 pN was reported from experiment for a SAH rich in negative and positive charged amino acids;12 quasi-static experiments done on a SAH of comparable composition reported a similar unfolding force.13 Those forces are significantly lower than  . This difference between experiment and simulation may be an artifact of the simulations, such as the limited timescales accessed as discussed above, or shortcomings of the force field. Alternatively, it may reflect true differences between the helix simulated here and those studied experimentally. Clarifying this point requires closer connection between experiment and simulation setups and is beyond the scope of this work. Investigating the non-equilibrium mechanical response of SAHs to applied tension, which will likely require high-speed SMFS setups,45 will be an important step towards this aim.
The large contribution of entropy to the mechanical response of helices under tension may have substantial implications: if unfolding is cooperative – i.e., the price to create multiple interfaces between folded and unfolded sections throughout the helix is high, so the helix unfolds residue-by-residue starting from the termini – then the entropic contribution arises at the level of individual amino acids. This contribution is by definition included in 1-dimensional models of the free energy landscape of amino acid stretching, and so these models should be sufficient to model the mechanical response of helices under tension. On the contrary, if unfolding under tension is non-cooperative – i.e., multiple unfolding/refolding events occur randomly throughout the length of the helix – then chain entropy plays a role, and models of the mechanical response of helices under tension must include it. We note that the random opening version of the sticky chain model indeed allows for unfolding/refolding throughout the helix but does not correctly account for chain entropy.28
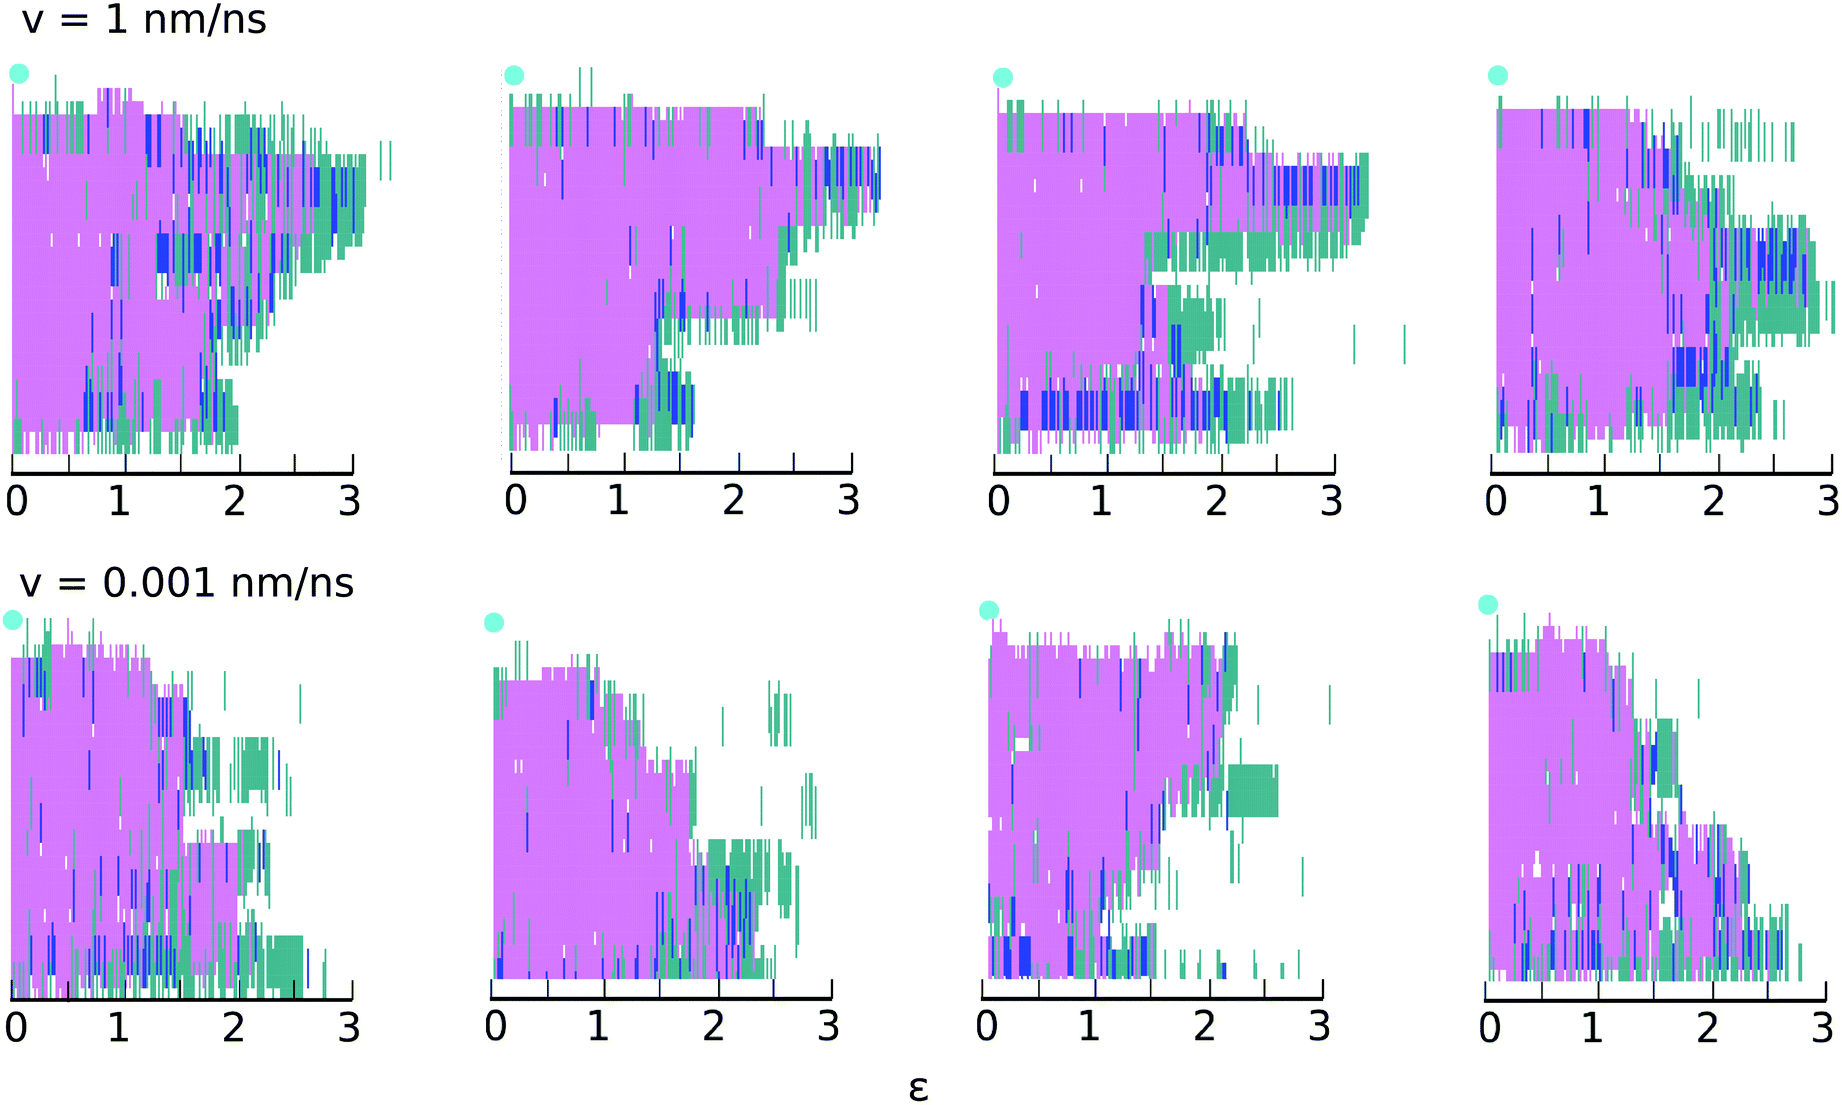 | ||
| Fig. 4 Secondary structure changes as a function of strain at the highest (top) and lowest (bottom) velocities for four different realizations. The y-axis shows the secondary structure of each amino acid in the chain, determined using STRIDE:48 turn (turquoise); α-helix (pink); 310-helix (dark blue) and coil (white). The light blue circle indicates the restrained end of the helix (amino terminus); the acid terminus, connected to the traveling virtual spring, is at y = 0. | ||
Fig. 4 gives the impression that unfolding occurs in clusters of 3 or 4 consecutive amino acids. This impression is misleading and results from the manner in which STRIDE assigns secondary structures. For example, if amino acids i + 1, i + 2, i + 3 and i + 4 initially meet all the criteria used to define a α-helix, but the hydrogen bond between i and i + 4 subsequently breaks, all four amino acids will lose their α-helix status. To ascertain whether unfolding occurs in clusters or residue-by-residue, we examined the backbone ϕ and ψ angles of each amino acid as a function of time. Results for selected residues are shown in ESI,† Section S3. The results confirm that at both speeds, unfolding occurs predominantly residue-by-residue.
 | (6) |
| v (nm ns−1) | I | II | III |
|---|---|---|---|
| 1 | 0.10 ± 0.02 | 0.26 ± 0.02 | 0.64 ± 0.03 |
| 10−3 | 0.13 ± 0.02 | 0.28 ± 0.03 | 0.59 ± 0.04 |
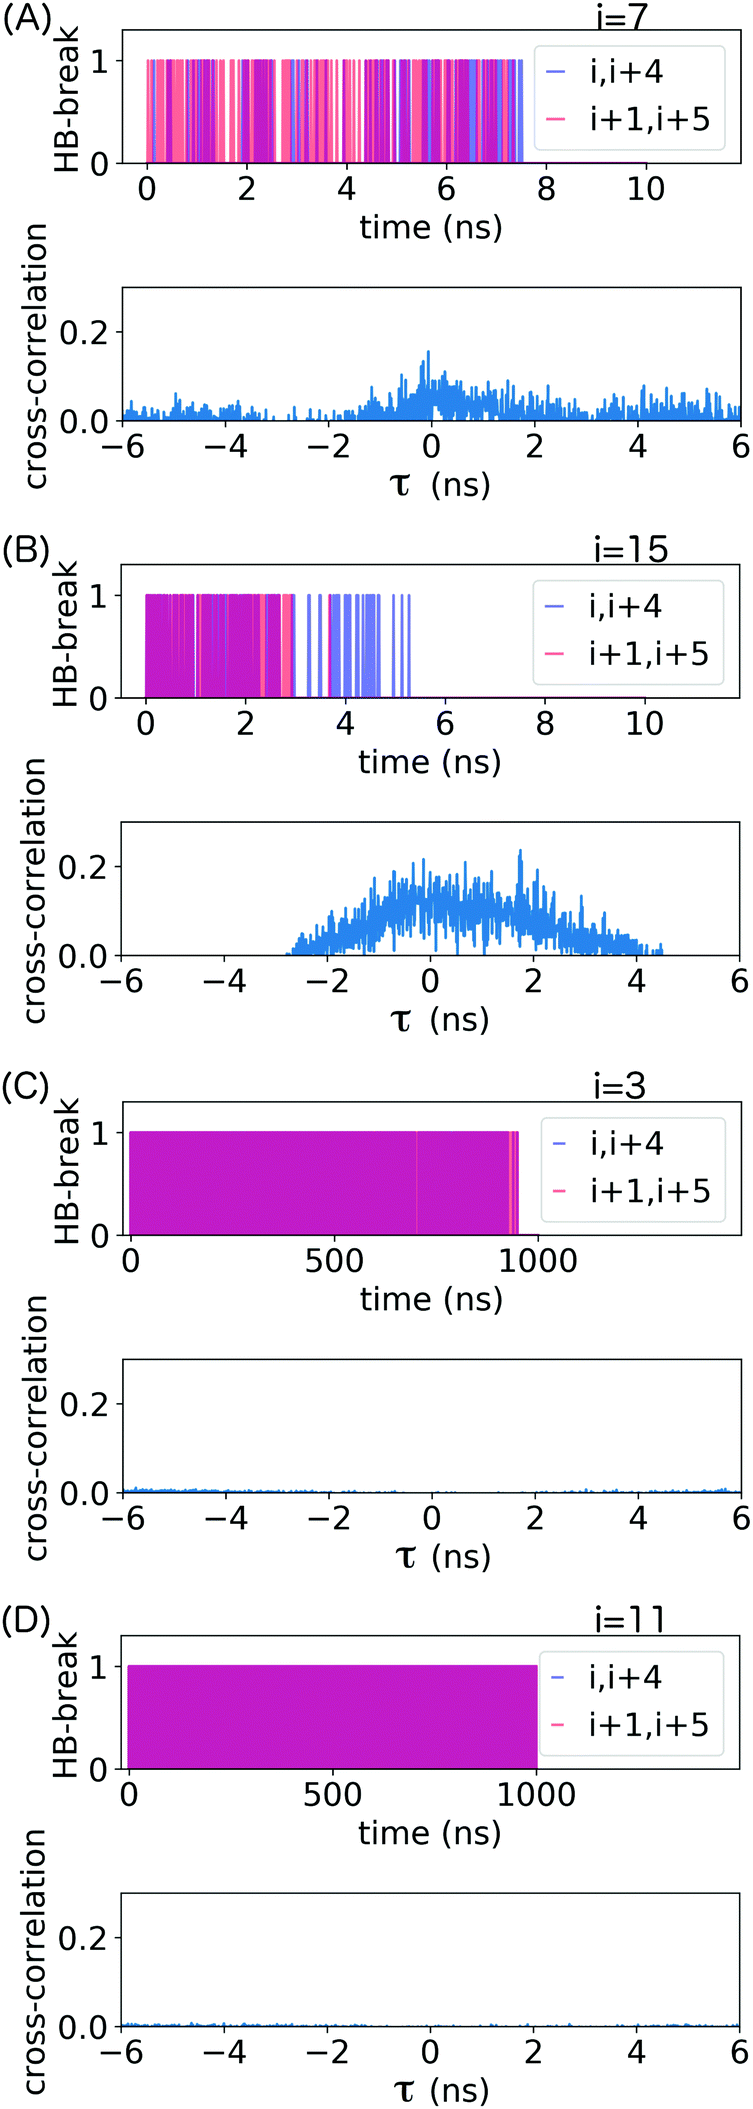 | ||
| Fig. 5 Hydrogen bond breaking events (HB-break) for selected pairs of consecutive backbone hydrogen bonds, identified by the residue number i, and their respective time cross-correlation, from molecular dynamics simulations at (A and B) v = 1 nm ns−1 (t = [0,10] ns corresponds to ε = [0,2.9]) and (C and D) v = 10−3 nm ns−1 (t = [0,1000] ns correspond to ε = [0.5,0.8]). The time resolution for analysis was 10 ps for both pull speeds. A hydrogen-bond breaking event occurs if the donor–acceptor distance becomes larger than 0.35 nm or the donor–hydrogen–acceptor angle becomes smaller than 140°. The HB-break time series represents each event using points with drop lines for ease of viewing; purple indicates simultaneous events within image resolution. | ||
α-Helical structure is determined by backbone angles ϕ and ψ. To assess whether the frequent hydrogen bond breaking events seen in the HB-break time series in Fig. 5 are accompanied by loss of helical structure, we plotted these angles as Ramachandran plots for all residues forming the loop stabilized by the backbone hydrogen bonds (i, i + 4) indicated in that figure. These results are shown in ESI,† Fig. S4–S7. The Ramachandran plots confirm that transient hydrogen bond breaking is not accompanied loss of α-helical structure. Permanent destruction of backbone (i, i + 4) hydrogen bonds only occurs after at least one of the relevant ϕ and ψ transitions out of α-helical configuration.
These results demonstrate that hydrogen bonds, while clearly contributing to the thermodynamic stability of helices, are not the main barrier to helix stretching. We (and others)52 propose that this conclusion is general because experiments do not suggest a substantial dependence between the strength of intrahelical hydrogen bonds and amino acid identity,53 but polylysine, polyglutamate and SAHs have very different mechanical response under tension as discussed in the introduction. Which interaction(s) contribute the most to the free energy barrier to unfolding of helices under tension remains for now an open question and is being investigated by our group.
 | (7) |
The cross-covariance functions are shown in the bottom plot of each panel in Fig. 5. A large peak at t = 0 is never observed, which demonstrates that consecutive hydrogen bonds along the helical backbone do not preferentially break simultaneously at any pull speed. Instead, all cross-covariance functions show distributions of time lags of several nanoseconds. These distributions are, as expected, narrower for the low pull speed because strain values leading to substantial loss of helical structure and thus permanent breakage of hydrogen bonds (see also discussion in ESI,† Section S2) are reached faster.
3.2 Parameters of the chain model for the cooperative opening
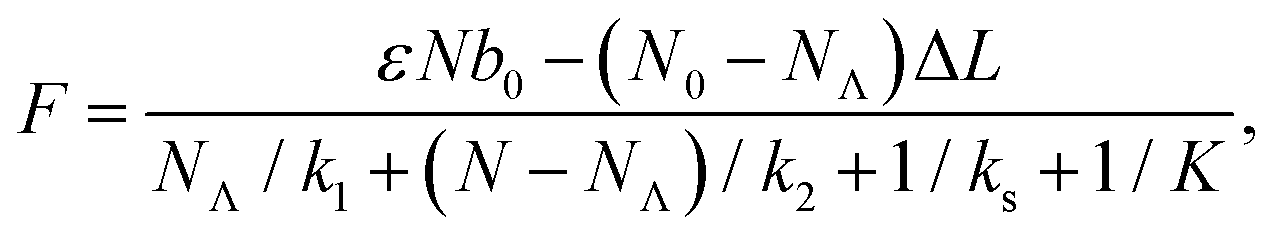
Analysis of the simulation trajectories indicate that the SAH unfolds cooperatively. The cooperative version of the sticky chain model proposed by Jäger should thus be the most appropriate to fit the force–strain curves as a function of pull speed. Before doing the actual fit, we determine several of the parameter values for the mesoscopic model directly from the atomistic simulations, and from equilibrium conditions derived within the mesoscopic model; these parameters are show in Table 3. The atomistic simulations show that the unfolding units are the individual amino acids rather than the helical turns. The number of links in the mesoscopic model is set at N = 30 − 2 − 1 = 27. The two terminal glycines are excluded from the number of links; each link in the mesoscopic model is defined by the presence of a peptide bond, so 28 non-glycine amino acids define 27 links. The parameter b0 was estimated from known geometrical parameters for α-helices: the helical pitch is 0.54 nm and comprises 3.6 amino acids, corresponding to a distance b0 = 0.15 nm between consecutive Cα atoms projected along the helical axis. We calculated the parameter ΔL from the average distance between consecutive Cα atoms from multiple simulations at constant velocity, using configurations beyond the force plateau. Under these conditions the helix is unfolded and the Cα atoms are aligned with the pull axis so the distance between them is equal to the projected distance, b0 + ΔL = 0.38 nm, corresponding to ΔL = 0.23 nm. V0 was calculated from the force plateau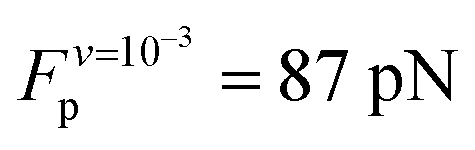 value as
  (eqn (A3) in ref. 28). This equality assumes that
  is in the quasi-static limit which, as discussed above, is not true. However, the timescale separation between processes important under quasi-static conditions and those important for v > 10−3 nm ns−1 and the fact that the plateaus at v ∈ {10−3, 10−2} nm ns−1 are very close mean that, for the purpose of applying the mesoscopic model in the range 10−3 < v/(nm ns−1) < 1, the lowest v can be considered in the quasi-static limit. We obtain V0 = 4.8kBT = 2.9 kcal mol−1, a value substantially lower than the 11.1 kcal mol−1 reported by Buehler et al.18 for a metastable helix; below we discuss possible origins of this discrepancy. Because
  (eqn (5)), the parameters that remain to be obtained from the fit are the natural vibration frequency, ν0, and the bond constants k1 and k2 associated with the potential basins of the folded and unfolded states.
| Parameter | Value |
|---|---|
| N | 27 |
| b 0 | 0.15 nm |
| ΔL | 0.23 nm |
| V 0 | 20 pN nm (4.8kBT) |
3.3 Fitting the force–strain curves from all-atom simulations
We fit the average force–strain curves from the all-atom simulations using eqn (1) and (2) and the parameters in Table 3. Fitting is done by substituting eqn (1) in eqn (2) and numerically integrating eqn (2) to get the number, NΛ, of folded links as a function of the time. The fitting parameters are varied automatically with the function fmincon of MATLAB2016b in order to minimize |Fm − Fs|, where Fm and Fs are the values of the force obtained by the model and the force obtained in the all-atom simulations, respectively. To test the accuracy of the fitting procedure, we make two implementation attempts: (1) fitting one curve (v = 10−1 nm ns−1), or (2) simultaneously fitting two curves (v ∈ {10−1, 10−3} nm ns−1). In both cases we use the parameters obtained from the fit to generate the force extension curves at the remaining pull velocities of the atomistic simulations.The fitting parameters obtained in each case are shown in Table 4, and the corresponding curves are shown in Fig. 6. Both fitting attempts yield comparable fitting parameters and reasonable force–strain curves for the 4 pull speeds, confirming that the model and fitting procedure are robust. These results indicate that reliable insight into the 1-dimensional free energy landscape associated with helix unfolding under tension may be obtained already with one quasi-static and one non-equilibrium force–strain curve. Fits using curves at more than one pull speed are nevertheless expected to yield better estimates of the fit parameters, so the following discussion focuses on the results of the two-curve fit.
| Parameter | v (nm ns−1) | |
|---|---|---|
| 10−1 | {10−1, 10−13} | |
| k 1 (pN nm−1) | 1321 | 2118 |
| k 2 (pN nm−1) | 5188 | 4792 |
| ν 0 (ns−1) | 0.23 | 0.82 |
| k off (s−1) | 0.18× 10⁷ | 0.63× 10⁷ |
| x E (nm) | 0.17 | 0.13 |
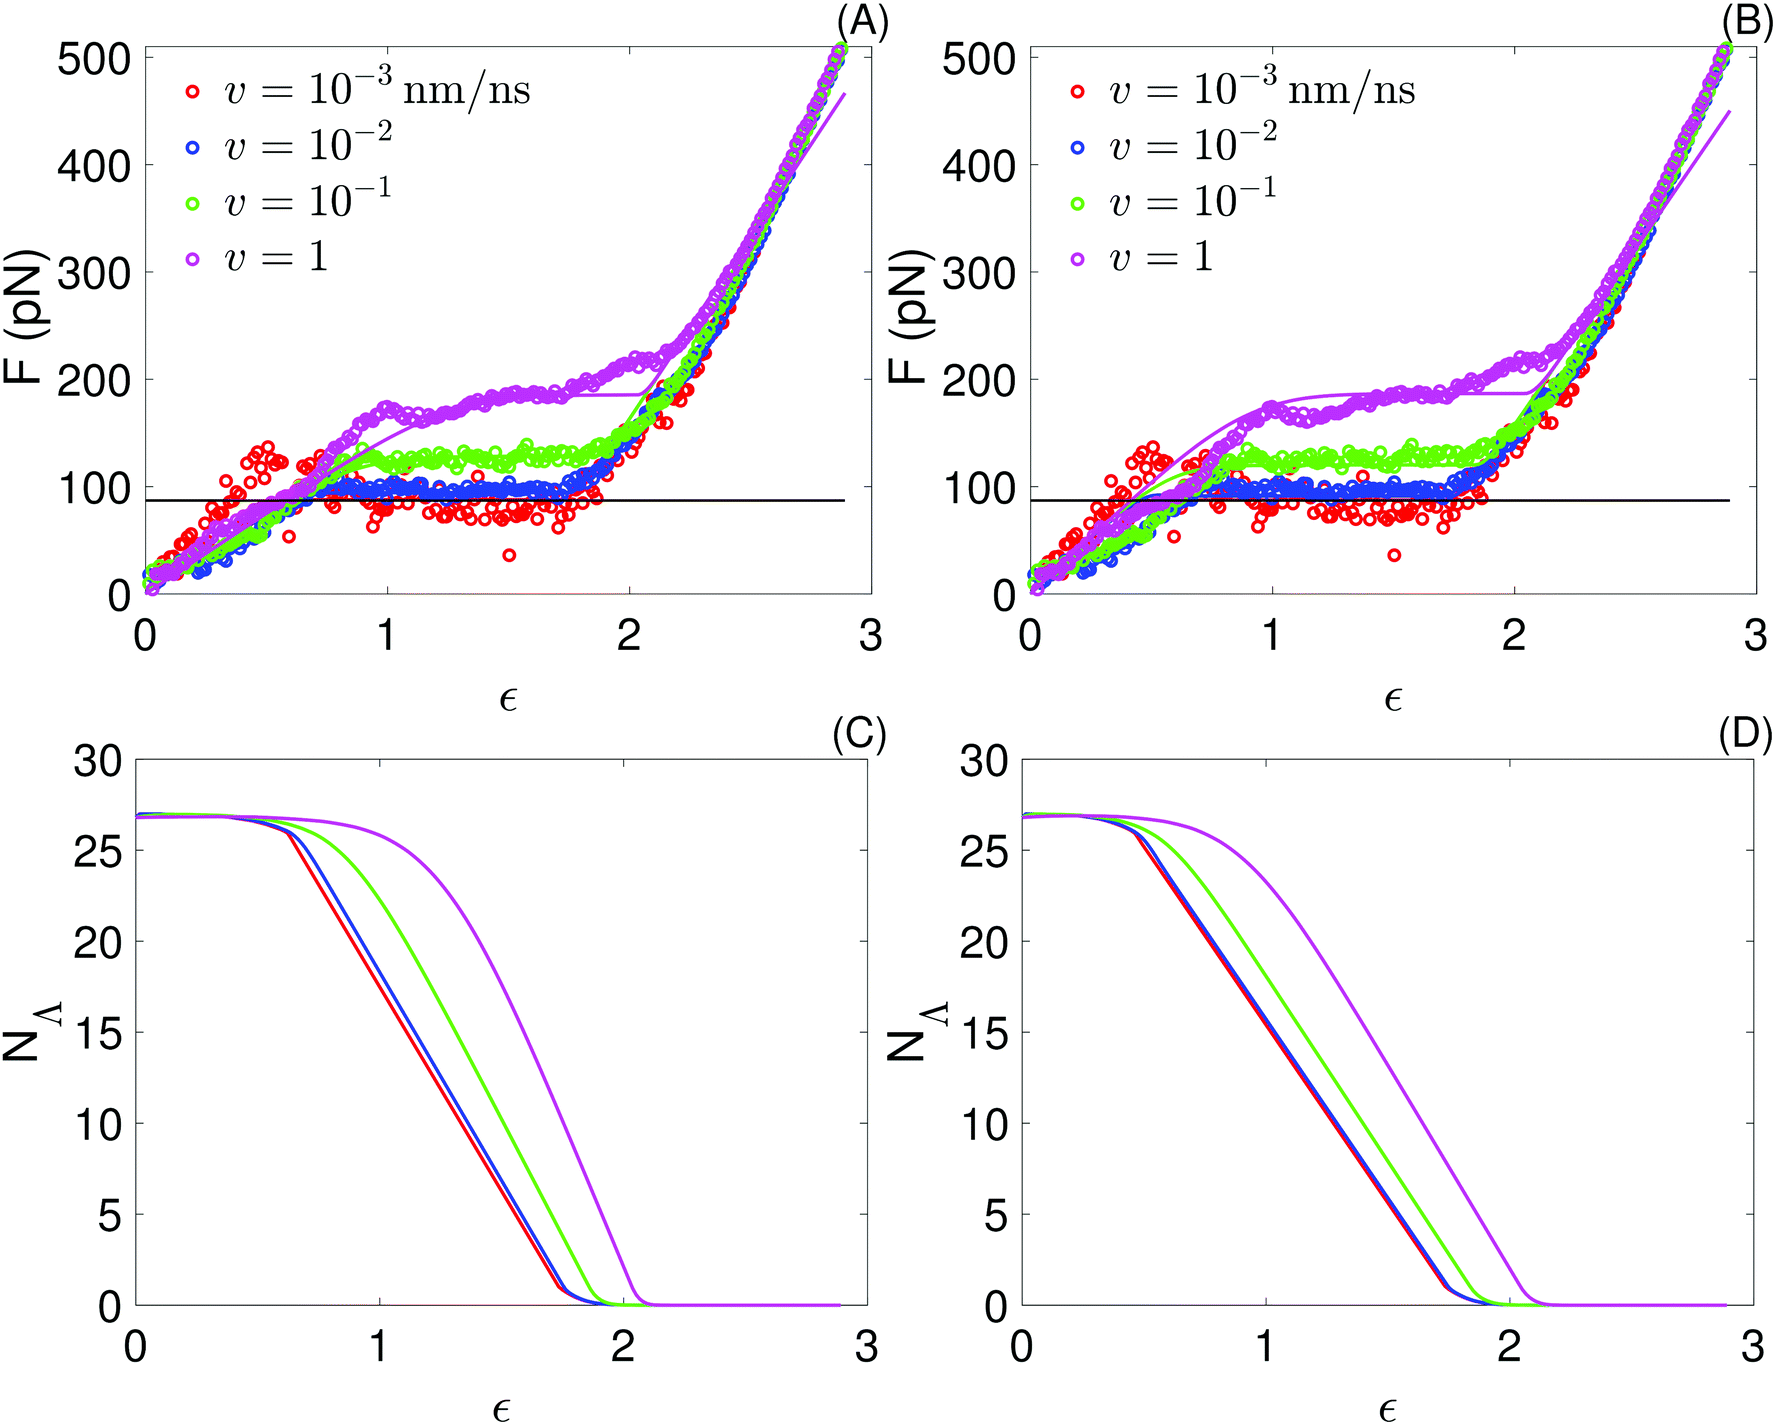 | ||
| Fig. 6 Top: Force as a function of strain obtained with the sticky chain model (lines) using the two set of parameters in Table 3; to facilitate comparisons, the force–strain curves from all-atom simulations, already presented in Fig. 3, are repeated here (points). (A) Fitting one curve, v = 10−1 nm ns−1. (B) Fitting 2 curves, at v ∈ {10−1, 10−3} nm ns−1. Bottom: Number of folded links as a function of strain obtained from the sticky chain model. (C) Fitting one curve. (D) Fitting 2 curves. | ||
The bond constant, k2 = 4792 pN nm−1, characterizing the free energy basin of the unfolded state is substantially larger than k1 = 2118 pN nm−1, which characterizes the free energy basin of the folded state. This difference is consistent with the fact that stretching an extended amino acid chain involves deforming angle potentials (bonds are constrained in our model), which are substantially stiffer than any stabilizing contribution to the folded state (dihedrals, hydrophobic effect, hydrogen bonds and salt bridges).
The natural vibration frequency, ν0 = 0.82 ns−1, obtained from the fit is substantially lower than the typical value of 104 ns−1 used as estimate of this quantity.55 This difference demonstrates that the commonly used estimate of ν0 is in fact far from suitable in this case, where each link has much higher mass and much lower bond stiffness (k1) than covalent bonds between 2 atoms, for which the estimate was originally made. A reliable value of ν0 is indispensable to calculate V0 from values of koff (eqn (4)), which can be easily obtained from Bell–Evans fits of rupture force vs. velocity data. This was the procedure followed by Buehler et al.18 to analyze force–strain curves from simulation; from a kBuehleroff = 0.807 × 10⁵ s−1 they obtain VBuehler0 = 11.1 kcal mol−1 for a metastable helix and the same pull speed range investigated here. Using our estimate of ν0 would result in VBuehler0 = 5.5 kcal mol−1. This value is still substantially higher than our own estimate, V0 = 4.8kBT = 2.9 kcal mol−1, because kBuehleroff is 2 orders of magnitude lower than what we obtain (see Table 4). Whether these differences reflect true differences between the SAH investigated here and the AH1 helix from the vimentin intermediate filament investigated by Buehler et al., or are instead artifacts arising from the different force fields used, remains unclear.
3.4 How do typical analysis procedures used in dynamic force spectroscopy compare with the sticky chain model?
To answer this question, we simulate force–strain curves using the sticky chain model and the parameters in Tables 3 and 4. Subsequently we analyze the value of the plateau force as a function of the loading rate with two of the models most often used in dynamic force spectroscopy: the Bell–Evans model, which is valid for velocities at which refolding can be neglected, and the Yoreo model, which is an extension of the first that captures the quasi-static region where both unfolding and refolding take place. The Bell–Evans model56 relates the most probable value F* of the rupture force and the loading rate r = dF/dt as: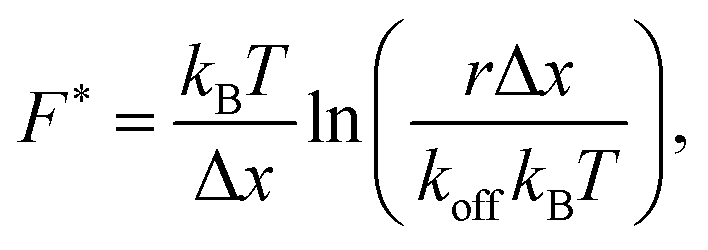 | (8) |
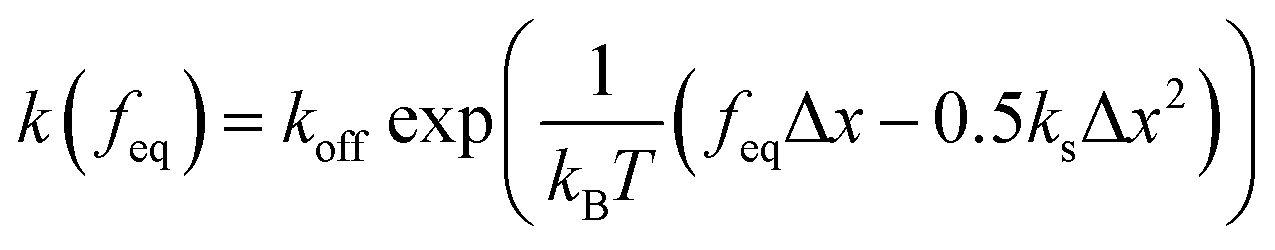
The Yoreo model23 relates the same two observables,
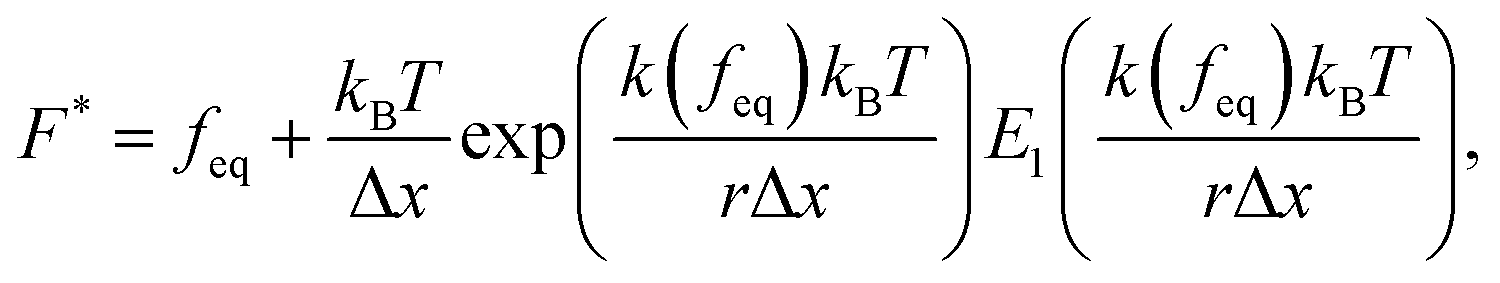 | (9) |
 and
and  is the exponential integral. We note that Δx has the same physical significance as xE.
In the top panel of Fig. 7 we show force–strain curves obtained with the sticky chain model and the parameters in Tables 3 and 4 (for fits done at v ∈ {10−1, 10−3} nm ns−1) for a wide range of pull velocities. Values of the plateau force at each pull speed, indicated by the black markers, are re-plotted as a function of the loading rate in the bottom panel of the same figure. We fit the Bell–Evans model to the 3 points with higher loading rate, for which re-binding is expected to be minimal, and fit the Yoreo model to the entire curve. The Bell–Evans model is linearized for the fit (F = p1 × x + p2), with Δx and koff obtained as Δx = kBT/p1 and koff = (p1exp(−p2/p1))−1.
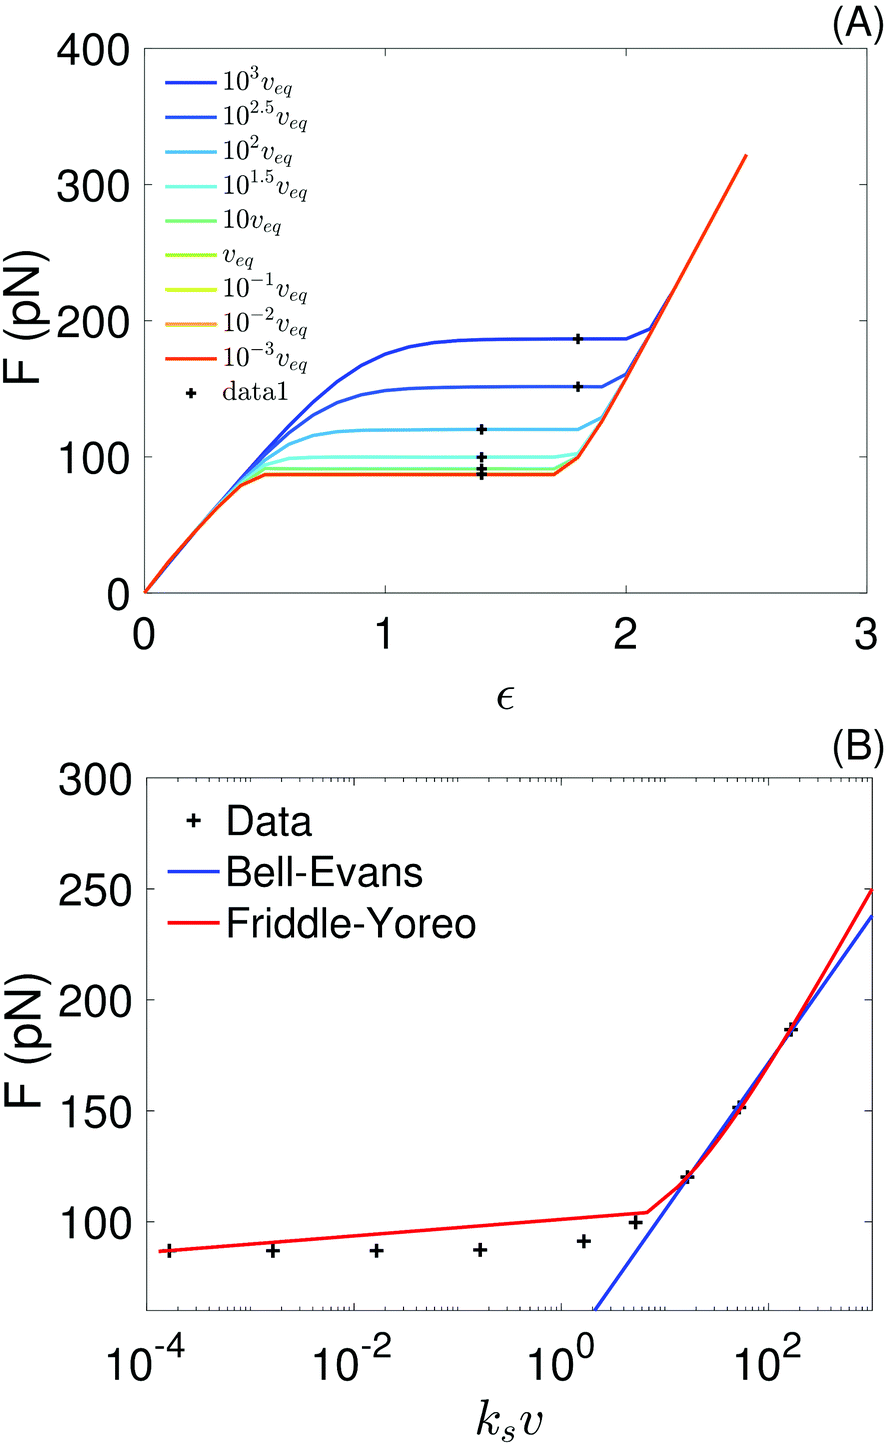 | ||
| Fig. 7 (A) Force–strain curves generated from the sticky chain model using the parameters in Tables 3 and 4 (for fits using the curves at v ∈ {10−1, 10−3} nm ns−1); the black crosses indicate the values taken as the plateau force shown in panel (B). The pull speed is indicated as a multiple of the quasi-static velocity, veq = 10−3 nm ns−1. (B) Plateau force vs. loading rate, ksv, from the sticky chain model (points) and fits using the Bell–Evans and Friddle–Yoreo model (lines). | ||
The parameter values obtained from the fits are shown in Table 5. Parameters extracted with both models are comparable, but not identical, to those used as input (Table 4) to the sticky chain model, indicating that both the Yoreo and the Bell–Evans models are reasonable choices for initial analyses, but yield only coarse estimates of Δx and koff. These results illustrate that, for helical systems where a (quasi-)force plateau can be observed as a function of strain, fits using the sticky chain model are preferable.
| Bell–Evans | Yoreo | |
|---|---|---|
| Δx (nm) | 0.14 ± 0.06 | 0.11 ± 0.01 |
| k off (s−1) | (0.09 ± 0.2) × 108 | (0.19 ± 0.04) × 108 |
4 Concluding remarks
Our simulations indicate that the deformation mechanism of SAHs under applied tension is highly cooperative at all pull speeds tested: because the free energy penalty for creating multiple interfaces between folded and unfolded domains is high, helix unraveling starts from the termini. This response is consistent with the high thermodynamic stability of SAHs. In contrast, the typical α-helices found in proteins are stabilized partly by interactions with other protein domains, i.e., in the absence of those interactions the helical conformation is only metastable. Simulation studies indicate that, when metastable α-helices are stretched in solution, unfolding starts randomly along the helix.17,18 The main barrier to unfolding of residues cannot be hydrogen bond breaking as several literature reports suggest, because hydrogen bond breaking is both extremely frequent and does not per se induce loss of helical structure. Instead, we found that the opposite occurs: loss of helical structure determines the permanent breakage of backbone hydrogen bonds. We also found that hydrogen bonds overwhelmingly break individually rather than in clusters. The unraveling of individual residues occurs via multiple pathways, and may include transitions to turn or to metastable 310-helix configurations. These transitions are stick-slip events; their presence is consistent with the appearance of peaks in individual force–strain curves. Entropy clearly softens the mechanical strength of the helix and the cooperative nature of the unfolding process suggests that the contribution of entropy arises at amino acid level. For uncooperative unfolding processes this will not be the case, and adequately modeling force–extension curves under those conditions must account for chain entropy. At present, experimental data on the mechanical response of SAHs to tension is scarce under quasi-static conditions, and does not exist for non-equilibrium pull speeds. Our results using the sticky chain model28 to fit the force–extension curves obtained using the simulations point to the importance of obtaining non-equilibrium data. If that data exists, the sticky chain model can be used to fit the experimental data and should yield unprecedented insight into the free energy landscape and mechanism associated with unfolding of SAHs. Such insight is critical to understand the role of SAHs in biology and their potential applications in materials science.Conflicts of interest
There are no conflicts of interest to declare.Acknowledgements
We gratefully acknowledge Marco Ehlert and René Genz from the IT team of Max Planck Institute of Colloids and Interfaces (MPIKG) for their help with computational facilities. Open Access funding provided by the Max Planck Society.Notes and references
- B. J. Spink, S. Sivaramakrishnan, J. Lipfert, S. Doniach and J. A. Spudich, Nat. Struct. Mol. Biol., 2008, 15, 591–597 CrossRef CAS.
- D. Süveges, Z. Gáspári, G. Tóth and L. Nyitray, Proteins, 2009, 74, 905–916 CrossRef.
- M. Peckham and P. J. Knight, Soft Matter, 2009, 5, 2493–2503 CAS.
- Z. Gáspári, D. Süveges, A. Perczel, L. Nyitray and G. Tóth, Biochim. Biophys. Acta, Proteins Proteomics, 2012, 1824, 637–646 CrossRef.
- D. Simm, K. Hatje and M. Kollmar, PLoS One, 2017, 12, e0174639 CrossRef.
- C. A. Barnes, Y. Shen, J. F. Ying, Y. Takagi, D. A. Torchia, J. R. Sellers and A. Bax, J. Am. Chem. Soc., 2019, 141, 9004–9017 CrossRef CAS.
- P. Lyu, P. J. Gans and N. R. Kallenbach, J. Mol. Biol., 1992, 223, 343–350 CrossRef CAS.
- C. A. Olson, E. J. Spek, Z. Shi, A. Vologodskii and N. R. Kallenbach, Proteins, 2001, 44, 123–132 CrossRef CAS.
- A. Idiris, M. T. Alam and A. Ikai, Protein Eng., Des. Sel., 2000, 13, 763–770 CrossRef CAS.
- M. A. Lantz, S. P. Jarvis, H. Tokumoto, T. Martynski, T. Kusumi, C. Nakamura and J. Miyake, Chem. Phys. Lett., 1999, 315, 61–68 CrossRef CAS.
- M. Kageshima, M. A. Lantz, S. P. Jarvis, H. Tokumoto, S. Takeda, A. Ptak, C. Nakamura and J. Miyake, Chem. Phys. Lett., 2001, 343, 77–82 CrossRef CAS.
- M. Wolny, M. Batchelor, P. J. Knight, E. Paci, L. Dougan and M. Peckham, J. Biol. Chem., 2014, 289, 27825–27835 CrossRef CAS.
- F. Berkemeier, M. Bertz, S. Xiao, N. Pinotsis, M. Wilmanns, F. Gräter and M. Rief, Proc. Natl. Acad. Sci. U. S. A., 2011, 108, 14139–14144 CrossRef CAS.
- I. Schwaiger, C. Sattler, D. R. Hostetter and M. Rief, Nat. Mater., 2002, 1, 232 CrossRef CAS.
- G. Ozer, S. Quirk and R. Hernandez, J. Chem. Theory Comput., 2012, 8, 4837–4844 CrossRef CAS.
- N. Bavi, O. Bavi, M. Vossoughi, R. Naghdabadi, A. P. Hill, B. Martinac and Y. Jamali, Channels, 2017, 11, 209–223 CrossRef CAS.
- T. Ackbarow and M. J. Buehler, J. Mater. Sci., 2007, 42, 8771–8787 CrossRef CAS.
- T. Ackbarow, X. Chen, S. Keten and M. J. Buehler, Proc. Natl. Acad. Sci. U. S. A., 2007, 104, 16410–16415 CrossRef CAS.
- M. Rief, J. M. Fernandez and H. E. Gaub, Phys. Rev. Lett., 1998, 81, 4764–4767 CrossRef CAS.
- J. Bertaud, J. Hester, D. D. Jimenez and M. J. Buehler, J. Phys.: Condens. Matter, 2010, 22, 035102 CrossRef.
- A. V. Savin, I. P. Kikot, M. A. Mazo and A. V. Onufriev, Proc. Natl. Acad. Sci. U. S. A., 2013, 110, 2816–2821 CrossRef CAS.
- M. L. Hughes and L. Dougan, Rep. Prog. Phys., 2016, 79, 076601 CrossRef.
- R. W. Friddle, A. Noy and J. J. De Yoreo, Proc. Natl. Acad. Sci. U. S. A., 2012, 109, 13573–13578 CrossRef CAS.
- O. K. Dudko, G. Hummer and A. Szabo, Phys. Rev. Lett., 2006, 96, 108101 CrossRef.
- B. Chakrabarti and A. J. Levine, Phys. Rev. E: Stat., Nonlinear, Soft Matter Phys., 2005, 71, 031905 CrossRef.
- B. Chakrabarti and A. J. Levine, Phys. Rev. E: Stat., Nonlinear, Soft Matter Phys., 2006, 74, 031903 CrossRef.
- Z. Qin and M. J. Buehler, Phys. Rev. Lett., 2010, 104, 198304 CrossRef.
- I. L. Jäger, Biophys. J., 2001, 81, 1897–1906 CrossRef.
- M. Andersson, E. Fällman, B. E. Uhlin and O. Axner, Biophys. J., 2006, 91, 2717–2725 CrossRef CAS.
- M. Wolny, M. Batchelor, G. J. Bartlett, E. G. Baker, M. Kurzawa, P. J. Knight, L. Dougan, D. N. Woolfson, E. Paci and M. Peckham, Sci. Rep., 2017, 7, 44341 CrossRef CAS.
- K. Lindorff-Larsen, S. Piana, K. Palmo, P. Maragakis, J. L. Klepeis, R. O. Dror and D. E. Shaw, Proteins: Struct., Funct., Bioinf., 2010, 78, 1950–1958 CrossRef CAS.
- E. F. Pettersen, T. D. Goddard, C. C. Huang, G. S. Couch, D. M. Greenblatt, E. C. Meng and T. E. Ferrin, J. Comput. Chem., 2004, 25, 1605–1612 CrossRef CAS.
- B. H. Zimm and J. K. Bragg, J. Chem. Phys., 1959, 31, 526–535 CrossRef CAS.
- M. Cieplak, T. X. Hoang and M. O. Robbins, Proteins: Struct., Funct., Genet., 2002, 49, 104–113 CrossRef CAS.
- F. C. Zegarra, G. N. Peralta, A. M. Coronado and Y. Q. Gao, Phys. Chem. Chem. Phys., 2009, 11, 4019–4024 RSC.
- R. Rohs, C. Etchebest and R. Lavery, Biophys. J., 1999, 76, 2760–2768 CrossRef CAS.
- R. Afrin, I. Takahashi, K. Shiga and A. Ikai, Biophys. J., 2009, 96, 1105–1114 CrossRef CAS.
- J. P. Renn, S. Bhattacharyya, H. Bai, C. He, H. Li, A. F. Oberhauser, J. F. Marko, D. E. Makarov and A. Matouschek, Sci. Rep., 2019, 9, 11101 CrossRef CAS.
- D. D. Root, V. K. Yadavalli, J. G. Forbes and K. Wang, Biophys. J., 2006, 90, 2852–2866 CrossRef CAS.
- S. B. Smith, Y. Cui and C. Bustamante, Science, 1996, 271, 795–799 CrossRef CAS.
- P. Cluzel, A. Lebrun, C. Heller, R. Lavery, J.-L. Viovy, D. Chatenay and F. Caron, Science, 1996, 271, 792–794 CrossRef CAS.
- S. A. Harris, Z. A. Sands and C. A. Laughton, Biophys. J., 2005, 88, 1684–1691 CrossRef CAS.
- M. Goktas, C. Luo, R. M. A. Sullan, A. E. Bergues-Pupo, R. Lipowsky, A. Vila Verde and K. G. Blank, Chem. Sci., 2018, 9, 4610–4621 RSC.
- A. E. Bergues-Pupo, K. G. Blank, R. Lipowsky and A. Vila Verde, Phys. Chem. Chem. Phys., 2018, 20, 29105–29115 RSC.
- C. Valotteau, F. Sumbul and F. Rico, Biophys. Rev., 2019, 11, 689–699 CrossRef CAS.
- S. Park, F. Khalili-Araghi, E. Tajkhorshid and K. Schulten, J. Chem. Phys., 2003, 119, 3559–3566 CrossRef CAS.
- A. Torres-Sánchez, J. M. Vanegas, P. K. Purohit and M. Arroyo, Soft Matter, 2019, 15, 4961–4975 RSC.
- D. Frishman and P. Argos, Proteins: Struct., Funct., Bioinf., 1995, 23, 566–579 CrossRef CAS.
- M. Post, S. Wolf and G. Stock, J. Chem. Phys., 2019, 150, 204110 CrossRef.
- P. E. Mason, P. Jungwirth and E. Duboue-Dijon, J. Phys. Chem. Lett., 2019, 10, 3254–3259 CrossRef CAS.
- H. Adalsteinsson, A. H. Maulitz and T. C. Bruice, J. Am. Chem. Soc., 1996, 118, 7689–7693 CrossRef CAS.
- A. Ikai, Biopolymers: Lignin, Proteins, Bioactive Nanocomposites, 2010, vol. 232, pp. 65–96 Search PubMed.
- J. M. Scholtz, H. Qian, E. J. York, J. M. Stewart and R. L. Baldwin, Biopolymers, 1991, 31, 1463–1470 CrossRef CAS.
- R. E. Thomson and W. J. Emery, in Data Analysis Methods in Physical Oceanography, ed. R. E. Thomson and W. J. Emery, Elsevier, Boston, 3rd edn, 2014, pp. 425–591 Search PubMed.
- G. Bell, Science, 1978, 200, 618–627 CrossRef CAS.
- E. Evans and K. Ritchie, Biophys. J., 1997, 72, 1541–1555 CrossRef CAS.
Footnotes |
| † Electronic supplementary information (ESI) available: Individual force–strain traces at the lowest pull speed; hydrogen bonds and salt bridges vs. strain; Ramachandran plots as a function of time; secondary structure vs. time from umbrella sampling simulations. See DOI: 10.1039/d0sm01166e |
| ‡ Present address: Max Delbrück Center for Molecular Medicine, Hannoversche Str. 28, 10115 Berlin, Germany. |
| § Present address: University of Duisburg-Essen, Faculty of Physics, Lotharstr. 1, 47057 Duisburg, Germany. |
| This journal is © The Royal Society of Chemistry 2020 |