
 Open Access Article
 This Open Access Article is licensed under a Creative Commons Attribution-Non Commercial 3.0 Unported Licence
Interparticle attraction controls flow heterogeneity in calcite gels†
Teresa
Liberto
 ab,
Marie
Le Merrer
a,
Sébastien
Manneville
c and
Catherine
Barentin
*ad
ab,
Marie
Le Merrer
a,
Sébastien
Manneville
c and
Catherine
Barentin
*ad
aUniversité de Lyon, Université Claude Bernard Lyon 1, CNRS, Institut Lumière Matière, F-69622, Villeurbanne, France. E-mail: catherine.barentin@univ-lyon1.fr
bInstitute of Materials Technology, Building Physics and Construction Ecology, Faculty of Civil Engineering, Vienna University of Technology, Karlsplatz 13, 1040 Vienna, Austria
cUniv Lyon, ENS de Lyon, Univ Claude Bernard, CNRS, Laboratoire de Physique, F-69342 Lyon, France
dInstitut Universitaire de France, France
First published on 4th September 2020
Abstract
We couple rheometry and ultrasonic velocimetry to study experimentally the flow behavior of gels of colloidal calcite particles dispersed in water, while tuning the strength of the interparticle attraction through physico-chemistry. We unveil, for the first time in a colloidal gel, a direct connection between attractive interactions and the occurrence of shear bands, as well as stress fluctuations.
1 Introduction
Calcium carbonate, including its most stable polymorph, calcite, is one of the most abundant minerals on Earth.1 It is found in rocks like limestone, chalk or marble, and is one of the largest carbon repositories.2 Calcium carbonate has been used for thousands of years as construction material, and more recently as a raw material in the chemical industry and as filler in pharmaceutical, paper or cement industries.Adding calcite to water leads to the formation of colloidal gels which are often used to mimic early age cementitious materials,3–6 whose mechanical properties depend on the calcite solid fraction, the interparticle forces and the addition of superplasticizers4,5,7 or of specific ions.3,8 For pure calcite gels, large solid fraction and/or attraction between calcite particles result in the formation of a gel whose mechanical response depends on the applied stress. Below a critical stress referred to as the yield stress, the system responds like an elastic solid while above this critical stress, it flows like a liquid.9 This observed intermediate behavior between a liquid and a solid is interesting for applications but makes the understanding of calcite gels more complex. Recent works have explored the links between elasticity and microstructure10 and between elasticity and interparticle forces8 in calcite gels over a wide range of volume fractions. In particular, the dependence of the elastic modulus on the calcite concentration is well described by the classical fractal model for colloidal gels proposed by Shih.11 This suggests that the microstructure of the calcite gel consists of a dense suspension of jammed fractal flocs.10 Yet, the understanding of their flow characteristics, including spatial homogeneity and temporal stability, and of their link with the microstructure and with the interparticle forces is still an open question.
From the experimental point of view, this question has been addressed with dense emulsions12,13 which belong to the wider category of jammed suspensions of soft elastic particles, together with foams or microgels. By playing on the interactions between emulsion droplets through depletion12 or bridging,13 these studies have shown that purely repulsive emulsions behave as simple yield stress fluids characterised by homogeneous flows, whereas attractive emulsions behave as thixotropic fluids characterised by a critical shear rate, ![[small gamma, Greek, dot above]](https://www.rsc.org/images/entities/i_char_e0a2.gif) c, below which heterogeneous flows are observed where the sample separates into a flowing liquid-like region and an arrested, unsheared region. Such a phenomenon reveals the underlying non-monotonic nature of the flow curve:9 below c, the mean shear stress is a decreasing function of the shear rate. This corresponds to a system which is mechanically unstable. In this range of shear rates, the system separates macroscopically into two dynamical phases, one sheared and one arrested, a situation referred to as shear banding. Critical shear rates, non-monotonic flow curves and—possibly transient— shear banding have been reported in a wide variety of colloidal gels14–19 as well as a number of other yield stress materials beside emulsions,20 including clay suspensions,15 two-dimensional foams,21,22 granular suspensions,23 cement pastes24,25 or drilling muds26 as well as star polymers,27 hard-sphere colloidal glasses,28,29 and microgels.30–32 Yet, the influence of interparticle forces on the flow properties and on the existence of shear bands has not yet been explored experimentally in colloidal gels.
c, below which heterogeneous flows are observed where the sample separates into a flowing liquid-like region and an arrested, unsheared region. Such a phenomenon reveals the underlying non-monotonic nature of the flow curve:9 below c, the mean shear stress is a decreasing function of the shear rate. This corresponds to a system which is mechanically unstable. In this range of shear rates, the system separates macroscopically into two dynamical phases, one sheared and one arrested, a situation referred to as shear banding. Critical shear rates, non-monotonic flow curves and—possibly transient— shear banding have been reported in a wide variety of colloidal gels14–19 as well as a number of other yield stress materials beside emulsions,20 including clay suspensions,15 two-dimensional foams,21,22 granular suspensions,23 cement pastes24,25 or drilling muds26 as well as star polymers,27 hard-sphere colloidal glasses,28,29 and microgels.30–32 Yet, the influence of interparticle forces on the flow properties and on the existence of shear bands has not yet been explored experimentally in colloidal gels.
From the theoretical point of view, two main physical interpretations have been proposed to explain the non-monotonic nature of the flow curves: inertial effects33,34 or strong coupling between flow and microstructure associated to a long restructuring time.35–37 Inertial effects are relevant for suspensions of non-Brownian particles (typically larger than 10–100 μm) which are not within the scope of the present article. The second interpretation makes no assumption about the particle size and is based on the competition between shear rejuvenation and aging associated respectively to the relaxation time and to the restructuring time of the system. As the latter exceeds the relaxation time, the flow curves show an unstable region with negative slope.35,36 However, the link between the restructuring time and the microscopic physics, such as gel network topology and the interparticle potential, is not straightforward, as underlined by simulations on soft jammed systems by Chaudhuri et al.38 and on dense particle gels in the vicinity of jamming by Irani et al.39
The aim of this work is then to explore experimentally the link between the interparticle forces in a colloidal gel made of calcite nanoparticles and its mechanical response as suggested by the work of Irani et al.39 More precisely, we tune the strength of the attraction between calcite colloids and measure the resulting velocity profiles under steady shear. Our study provides the first experimental evidence for a direct link between attraction and shear banding in a colloidal gel, which generalizes previous results on dense, jammed systems such as emulsions.12,13
The paper is organized as follows. Section 2 describes the preparation of calcite gels and the way we tune the interparticle interaction. We concentrate our study on two well-controlled calcite gels: a pure sample which is weakly attractive and a sample with added sodium and calcium hydroxide which is characterised by a stronger attraction. We use a rheometer combined with an ultrasound velocimetry technique to investigate simultaneously the global rheology and the local flow field. In Section 3, results are presented that show a strong influence of the colloidal interactions on the velocity profiles, on the existence of flow heterogeneities and stress fluctuations. In Section 4, we discuss our results and quantify the degree of flow heterogeneity for the two systems under study. In the case of the more attractive gel, we also correlate the fluctuations of the shear stress to those of velocity profiles and of the size of the shear band.
2 Materials and methods
2.1 Materials
In order to explore the effect of the interparticle potential on the flow behaviour of calcite gels, we mainly focus on two different samples: (i) a dispersion of calcite particles in pure deionized water at a solid volume fraction ϕ = 10% and (ii) a dispersion of calcite particles at ϕ = 7% in an aqueous solution of 94 mM of sodium hydroxide (NaOH, Sigma Aldrich) and 3 mM of calcium hydroxide (Ca(OH)2, Sigma Aldrich). At these moderate concentrations, the two suspensions exhibit shear elastic (storage) moduli much larger than the viscous (loss) ones, revealing the attractive nature of interparticle forces and the gel-like structure of the calcite suspension.The change of solution physico-chemistry, due to the introduction of sodium and calcium hydroxide at these concentrations, leads to an increase of attraction between the calcite particles, which has been characterized in ref. 8 for the physico-chemical conditions used in this study. The authors found that incorporating 97 mM sodium hydroxide and 3 mM calcium hydroxide in a pure calcite paste leads to a decrease of both the zeta potential, from ζ = 9.3 ± 1 mV to ζ = −2.4 ± 1, and the Debye length, from λD = 11 nm to λD = 1 nm. As a consequence, the electrostatic repulsion between the calcite particles is strongly screened in the samples with sodium and calcium hydroxide, resulting in a stronger attraction between the particles and in a larger elastic shear modulus by a factor of order 2 when the solid volume fraction is fixed (ϕ = 10%). As shown by Shi et al.,11 such an increase of the elastic modulus may result from an increase of the fractal dimension of the flocs composing the calcite gel and/or a decrease of the floc size. In the following, in order to distinguish between the two gels, we refer to the pure calcite gel as “weakly attractive” and to the calcite gel containing sodium and calcium hydroxide as “strongly attractive”. Note that this denomination is unrelated to the weak-link and strong-link regimes defined by Shi et al.11
In the present study, we choose to work with two different volume fractions so that the calcite dispersions result in colloidal gels with similar elastic properties at rest. We can then focus on the differences in the local response for comparable global properties. We nevertheless found that our results are robust when the solid volume fraction is kept fixed instead of the shear modulus (see Appendix B).
Our calcite particles (Socal 31 powder from Solvay, now available from Imerys) have an average diameter a = 70 nm (primary particle size as provided by the producer), a density of 2710 kg m−3 and a specific surface area of 17 m2 g−1. The powder is homogeneously dispersed at volume fraction ϕ in about 20 mL of suspending medium in two steps. It is first mixed for 10 min using a vortex stirrer (IKA RW20 digital) at a mixing rate of 1200 rpm. Immediately after this first mixing, the dispersion is exposed to high-power ultrasound (Hielscher UP200St transducer operating at 26 kHz with an electrical power of 100 W and a sonotrode of length 95 mm and tip diameter 7 mm) for up to 3 min while making sure that the temperature remains lower than 35 °C. This second step ensures a thorough, homogeneous dispersion of the calcite powder.
2.2 Rheological measurements
Rheological measurements are performed in a stress-imposed rheometer (ARG2, TA instruments) equipped with a transparent concentric-cylinder (or Taylor–Couette) cell composed of a rotating bob (inner cylinder) and fixed cup (outer cylinder). Both cylinders are made of poly(methyl methacrylate) (PMMA). Most experiments presented below are performed with smooth walls (polished PMMA with a typical roughness of ≈15 nm). Rough walls (sandblasted PMMA with a typical roughness of ≈1 μm) are also considered in Appendix C to test for the possible influence of boundary conditions.40 The radii of the bob and cup are R1 = 23 mm and R2 = 25 mm respectively, leaving a gap of e = R2 − R1 = 2 mm between the two cylinders. In such a small-gap cylindrical geometry, the shear stress decreases only by 17% from the rotating bob to the fixed cup and we shall assimilate the imposed flow to a simple shear flow. The Taylor–Couette cell is filled by the calcite dispersion to a height of 60 mm and closed by a homemade lid which reduces the contact with atmosphere, so that experiments can be conducted on the same sample for at least 4 h without any significant impact of evaporation or carbon dioxide exchange with the atmosphere.8The rheological protocol starts with a long preshear step of 90 min under an imposed shear rate of = 100 s−1. This allows us to drastically reduce the subsequent evolution of the sample mechanical properties over time and/or strain accumulation. After preshear, a small-amplitude oscillatory strain is applied for 3 min with frequency f = 1 Hz and amplitude γ = 0.05% within the linear viscoelastic regime.8 During this so-called “restructuring” step, which is systematically repeated after any other step, the elastic modulus G′ and the viscous modulus G′′ are recorded to check that no significant drift occurs in the linear viscoelasticity of the gel once brought at rest for 3 min. As a first measuring step, we record a flow curve, shear stress σ vs. shear rate , by sweeping logarithmically the shear rate from 100 s−1 down to 0.1 s−1 then up again to 100 s−1 with 10 points per decade within 10 min. We then impose a series of typically 12 steps at constant values of the shear rate decreasing between 100 and 1 s−1 and we record the corresponding shear stress response σ(t) for durations ranging from 2 min per step at larger shear rates to 35 min per step at smaller shear rates. For each of these steps, once the shear stress has reached a steady state (typically 20–100 s after shear start-up), local velocity profiles are measured simultaneously to the rheological data as described in the next paragraph. At the end of the measurements, we repeat the “restructuring” step and the flow curve measurement in order to check that both the viscoelastic moduli and the flow curve do not change by more than 10% over the course of the whole protocol.
A crucial point in our protocol for velocity profile measurements is that we decrease the shear rate step by step starting from = 100 s−1. This high shear rate first rejuvenates the sample, which leads to a reproducible initial condition where the gel is fluidized, although the gel microstructure is most probably not completely broken down into primary calcite particles but rather constituted of small colloidal flocs. Decreasing progressively the shear rate then allows us to follow the competition between shear rejuvenation and re-aggregation of the colloidal flocs as a function of .
2.3 Flow velocimetry through ultrasound imaging
Rheological measurements under a constant shear rate are complemented by simultaneous velocimetry thanks to ultrafast ultrasound imaging. Coupling ultrasound velocimetry to rheometry has proved very useful to get deeper insights into the flow of complex fluids, first through one-dimensional velocity profiles41,42 then through two-dimensional velocity maps.43 In particular, this technique gives access to time-resolved local velocity measurements with a spatial resolution of 40–100 μm which is well suited for mesoscale studies of flow heterogeneities such as shear banding.44 Note that this spatial resolution is much larger that the typical floc size of 1 μm so that no microstructural information on the gel network can be inferred from ultrasound imaging.Here, we use an array of 128 piezoelectric transducers working at 15 MHz arranged along the vertical direction over 32 mm, i.e., roughly half the height of the Taylor–Couette cell. To provide acoustic coupling and maintain both the ultrasonic probe and the sample at a constant temperature of 20.2 ± 0.1 °C, the whole cell is immersed in a large water tank connected to a water bath. Full technical details about our ultrasound imaging setup are given in ref. 43. In brief, it outputs a map of the tangential velocity component v at time t as a function of r the radial distance to the rotating bob, i.e., along the velocity gradient direction, and as a function of z the position along the axis of the Taylor–Couette cell (pointing downwards with z = 0 taken at roughly 15 mm from the top surface of the sample), i.e., along the vorticity direction. The local velocity is measured by cross-correlating successive ultrasound images of the calcite gels. Such images are constructed from the ultrasonic echoes scattered by the largest clusters constituting the gel after one plane pulse is transmitted through the gel by the transducer array, which is also used in the receive mode to collect the backscattered signal. The time interval between two successive images is inversely proportional to the applied shear rate, starting at 0.5 ms for = 100 s−1. To get statistically reliable estimates, velocity data are further time-averaged over 50 successive cross-correlations. The resulting velocity maps, hereafter noted v(r,z,t), are acquired every 1 or 2 s for typically 400 s.
3 Results
3.1 Global flow behaviour
As can be checked in the inset of Fig. 1, the elastic modulus of the weakly attractive gel is comparable to that of the strongly attractive system and stabilizes around 10 kPa after a few minutes following preshear. The flow curves of those two calcite gels (main panel of Fig. 1) point to a similar apparent yield stress of 6 Pa. However, the flow behaviours significantly differ for ≳ 1 s−1.
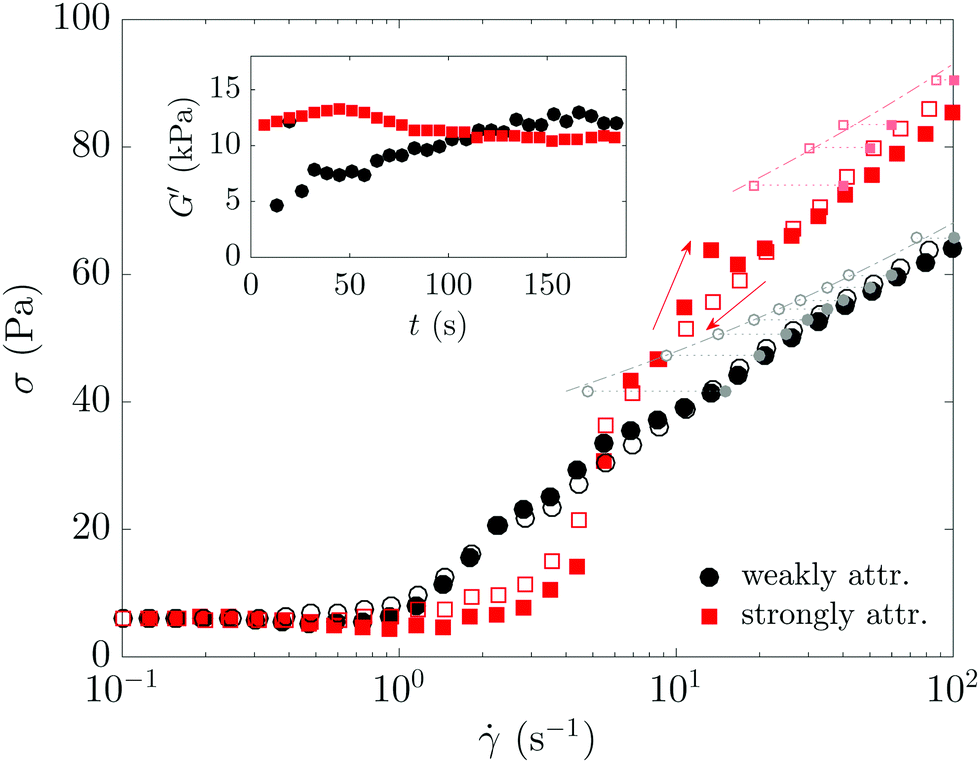 | ||
| Fig. 1 Flow curves, shear stress σ vs. shear rate , of a weakly attractive calcite gel [ϕ = 10% in pure water (black circles)] and of a strongly attractive calcite gel [ϕ = 7% in a sodium (94 mM) and calcium (3 mM) hydroxide solution (red squares)]. The shear rate is first swept down (open symbols) then up (filled symbols). Small symbols with light colors correspond to the data recorded during velocimetry experiments that show no arrested band, using filled symbols for raw data and empty symbols for slip-corrected data as defined in Section 4.3. The gray (resp. light red) dash-dotted line shows the best fit by a shear-thinning behaviour σ = An with n = 0.15 (resp. n = 0.13) and A = 33.7 Pa sn (resp. A = 50.6 Pa sn) for the weakly (resp. strongly) attractive gel and for “true” shear rates larger than 10 s−1. Inset: Evolution of the storage modulus G′ as a function of time t after preshear for the two samples using the same symbols as in the main graph. Experiments performed in a smooth Taylor–Couette geometry. See Section 2.2 for detailed rheological protocol. | ||
On the one hand, the weakly attractive gel (black symbols in Fig. 1) shows a monotonic increase of the shear stress with the shear rate with insignificant hysteresis between downward and upward sweeps. The kink around ≃ 2 s−1 is typical of a transition from shear flow for > 2 s−1 to total wall slip for < 2 s−1. Besides this signature of wall slip, which has already been reported many times in the literature,45–47 the flow behaviour of the weakly attractive gel is indicative of a “simple” yield stress fluid for which the steady-state flow is expected to remain homogeneous.9,35,48
On the other hand, the strongly attractive gel displays a more complex flow curve (red symbols in Fig. 1). The viscosity of this system at high shear rate is larger than the weakly attractive one by about 30% but its flow curve is not simply shifted by such an amount over the whole range of shear rates. Indeed, upon decreasing the shear rate, the transition from a monotonic branch to a plateau at low stress starts around ≃ 10 s−1, much larger than the onset of total wall slip in the dispersion in pure water. Moreover, the strongly attractive gel shows a larger degree of hysteresis with a noticeable bump around ≃ 10–20 s−1 along the upward sweep (see arrows in Fig. 1). Such features, although rather weak, hint at stronger slippage and time-dependent effects and/or instability.49,50 In order to elucidate the local flow behaviour and fully compare the two calcite gels, we turn to velocimetry coupled to rheometry.
3.2 Time-averaged flow profiles
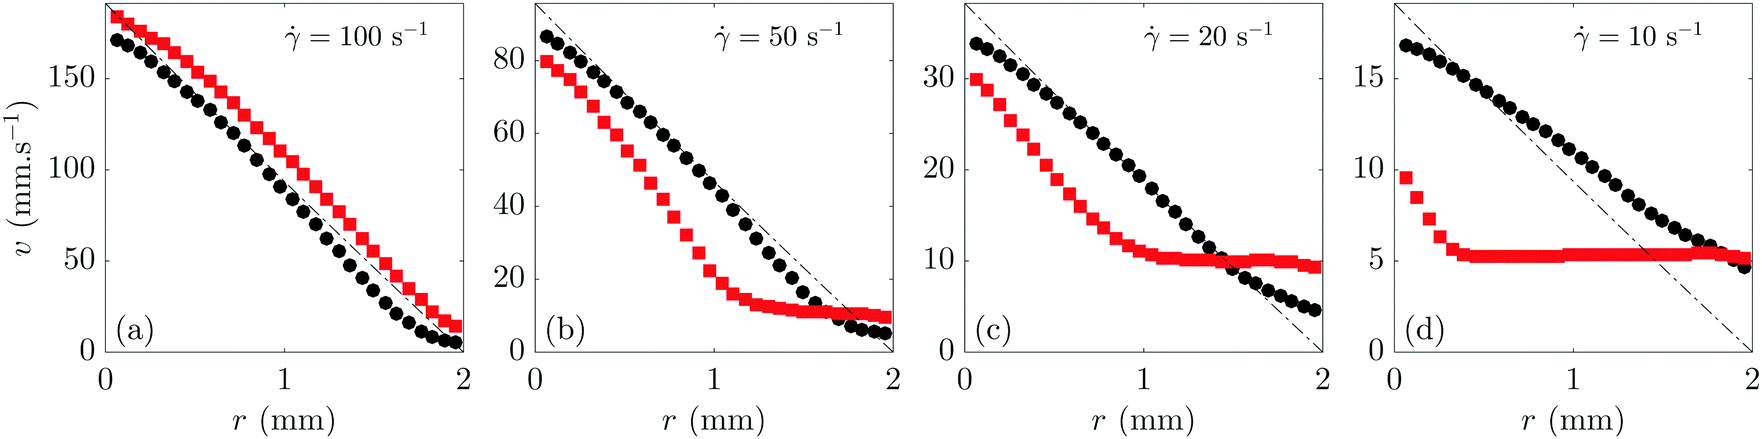
In order to explore the influence of the interparticle attraction on the flow behaviour, we first consider velocity profiles averaged over time t and over the vertical position z, v(r) = 〈v(r,z,t)〉z,t. The temporal dependence of the velocity profiles will be presented in Section 3.3. Regarding the z-dependence, the comparison of velocity profiles at different heights z shows that, for both gels, the flow can be considered as homogeneous along the vorticity direction (see Fig. 8 in Appendix A). Therefore, we report in Fig. 2 the averaged velocity profiles v(r) recorded in both the weakly attractive gel (black symbols) and the strongly attractive gel (red symbols) at different shear rates ranging from 100 to 15 s−1. | ||
| Fig. 2 Time-averaged velocity profiles v(r) = 〈v(r,z,t)〉z,t for a weakly attractive calcite gel [ϕ = 10% in pure water (black circles)] and for a strongly attractive calcite gel [ϕ = 7% in a sodium (94 mM) and calcium (3 mM) hydroxide solution (red squares)] for various decreasing shear rates: (a) = 100, (b) 60, (c) 35, (d) 25 and (e) 15 s−1. Experiments performed in a smooth Taylor–Couette geometry. See Section 2.3 for detailed velocimetry protocol. The rotating bob is located at r = 0 while the fixed cup lies at r = e = 2 mm. Velocity data were averaged over the full height of the ultrasonic transducer, i.e., from z = 0 to 32 mm, and over 400 s after steady state is achieved. Error bars correspond to the standard deviation of the velocity data over the z-direction. The dash-dotted lines show the velocity profiles expected for a Newtonian fluid in the absence of wall slip. The gray solid lines in (a)–(e) are the theoretical velocity profiles computed in the presence of wall slip using eqn (2) with the best power-law fit of the “true” flow curve of the weakly attractive gel (gray open symbols in Fig. 1). The light red solid lines in (a) and (b) show the corresponding shear-thinning velocity profiles computed for the strongly attractive gel (light red open symbols in Fig. 1). The blue lines in (c) highlight the fitting procedure used for shear-banded velocity profiles: linear fits are performed within each shear band (over the intervals indicated with thick lines) and extrapolated to extract the fluid velocity at both walls and the position δ of the interface between the two bands. | ||
At = 100 s−1, the velocity profiles in both gels are homogeneous and almost indistinguishable [Fig. 2(a)], which confirms that both samples are fully fluidized and behave like liquids at the highest, initial shear rate. However, they strikingly differ at lower values of . At = 60 s−1 [Fig. 2(b)], the velocity profile of the strongly attractive gel clearly deviates from the smooth, curved profile of the weakly attractive gel and shows a kink at r ≃ 1 mm. Even more remarkably, for < 40 s−1, the strongly attractive gel displays a heterogeneous, shear-banded flow characterized by the coexistence of a sheared, flowing region close to the rotating bob and an arrested, solidlike region close to the fixed cup. As the shear rate is decreased, the flowing region shrinks [Fig. 2(c) and (d)] down to the point where a fully arrested, pluglike flow is observed for ≲ 15 s−1 [Fig. 2(e)]. The onset of such total wall slip roughly corresponds to the beginning of the sharp kink in the flow curve during the downward shear rate sweep. Across the whole range of shear rates, the velocity profiles of the weakly attractive gel always remain homogeneously sheared with no obvious separation into shear bands. We checked that this sample flows as a plug for applied shear rates smaller than about 5 s−1.
The differences unveiled above in the flow behaviour of a weakly and a strongly attractive calcite gel are robust to changes in the surface roughness of the walls of the shearing device. Although the degree of wall slip depends on the boundary conditions, we checked that calcite dispersions in pure water with volume fractions ϕ = 8–10% always undergo homogeneous shear while dispersions at ϕ = 6–10% made strongly attractive by the addition of sodium and calcium hydroxide always display heterogeneous flows (see Fig. 9 in Appendix B and Fig. 10 in Appendix C).
3.3 Time-resolved flow profiles
In order to get further insight into the differences in flow behaviour evidenced in the previous section, we now focus on the time-resolved data v(r,t) and compare the two systems sheared over a few minutes under the same shear rate = 30 s−1 in Fig. 3 and 4 and in Movie S1 (ESI†). In both cases, a stationary state is reached, in the sense that the shear stress and the local velocity fluctuate around a well-defined average with no systematic drift over long times. However, fluctuations are much larger in the strongly attractive gel than in the weakly attractive gel, as seen both from the temporal variations of the stress in Fig. 4(a) and (b) and from those of an iso-velocity line in the spatiotemporal diagrams v(r,t) in Fig. 4(c) and (d). Examples of individual velocity profiles recorded at different times are shown in Fig. 3 to further highlight the widely different degree of velocity fluctuations in the two samples. Moreover, the large fluctuations of the shear-banded flow in the strongly attractive gel persist at least for ∼1 h (see Fig. 11 in Appendix D and Movie S2, ESI†).
 | ||
| Fig. 3 Individual velocity profiles v(r,t) = 〈v(r,z,t)〉z at three different times t in (a) a weakly attractive calcite gel [ϕ = 10% in pure water] and (b) a strongly attractive calcite gel [ϕ = 7% in a sodium (94 mM) and calcium (3 mM) hydroxide solution] for a fixed shear rate = 30 s−1. Experiments performed in a smooth Taylor–Couette geometry. | ||
 | ||
| Fig. 4 Time-resolved analysis of the flow of a weakly attractive calcite gel [ϕ = 10% in pure water (left panels)] and of a strongly attractive calcite gel [ϕ = 7% in a sodium (94 mM) and calcium (3 mM) hydroxide solution (right panels)] for a fixed shear rate = 30 s−1. (a) and (b) Shear stress σ as a function of time t. (c) and (d) Spatiotemporal maps of the z-averaged velocity v(r,t) = 〈v(r,z,t)〉z. The white lines correspond to a fixed velocity v = 32 mm s−1 in (c) and v = 16 mm s−1 in (d). Experiments performed in a smooth Taylor–Couette geometry. Every “instantaneous” velocity map corresponds to an average over 50 successive ultrasonic acquisitions performed over a total duration of 83 ms. Such a map is recorded every 1 s in (c) and every 2 s in (d). The time origin t = 0 corresponds to the beginning of ultrasound acquisitions, which start with a delay of 60 s in (a), (c) and of 100 s in (b), (d) relative to start-up of shear. See also Movie S1 (ESI†). | ||
4 Discussion
4.1 General physical considerations
Our main result is that increasing the degree of attraction between calcite particles by decreasing the electrostatic barrier strongly impacts the flow: weakly attractive gels exhibit homogeneous flows whereas strongly attractive gels exhibit shear banding for a given range of shear rates. We recall that in our experiments, initial conditions are set by imposing a high shear rate such that the systems under study are initially fully fluidized, at least within our spatial resolution. Therefore, as we decrease, the flow that we measure results from a competition between two mechanisms: the re-aggregation of small aggregates of attractive particles and the shear-induced breakup of the floc network. Our results strongly suggest that the interparticle attraction has a deep influence on such a competition. To explain such a remarkable effect of the interactions, we may examine separately the two mechanisms at play. First, the aggregation mechanism is expected to depend on the interparticle forces. For instance, it is well known that higher attraction leads to faster aggregation times and to significant structural differences in the gel network topology at rest, e.g. in its fractal dimension.51
On the other hand, under shear, the link between the second mechanism, namely the breaking up of the gel network by shear, and the details of the attractive interactions between primary particles composing the gel is not obvious, in spite of many works on the effect of flow on the floc structure.52–54 In particular, once in contact, the forces needed to separate two aggregated colloids should be essentially dominated by van der Waals attraction in both types of gels. A possible explanation for differences in shear-induced break up between strongly and weakly attractive gels can be inferred from the theoretical work of Shih et al.55 who showed that yielding of the gel network may occur through lateral motions between particles rather than radial motions. Under that condition, Shih et al.55 found that the yield strain depends on the electrostatic barrier, even when the contact is dominated by van der Waals attraction. Our results suggest that the breaking up of calcite gel networks mainly occurs through relative lateral motions of the particles and that the strength of the weakest links is impacted by interparticle attraction and electrostatic effects.
Still, the above considerations do not provide any clear-cut explanation for the occurrence of a shear-banding instability when attraction is made strong enough. This question remains an open issue and obviously requires further theoretical efforts. In order to pave the way for such future research, we now proceed to quantify thoroughly the differences in the flows reported in the weakly and strongly attractive calcite gels. In the rest of this section, we analyze in more details the velocity profiles by calculating for each of them a flow heterogeneity parameter that measures the distance between the measured velocity profiles and the homogeneous profile inferred from the global rheology. In such an approach, we first need to subtract wall slip from the velocity profiles in order to focus on the bulk flow only. We also compare the features of the shear-banding scenario revealed in the strongly attractive gel to classical results from the literature. Finally, we highlight the presence of strong fluctuations that go along with these heterogeneous flows.
4.2 Wall slip determination
As mentioned above, both calcite gels show a significant degree of wall slip. We measure the slip velocities at both walls by extrapolating linear fits of the time-averaged velocity profiles v(r) close to each wall [see Fig. 2(c)]. Adding up the slip velocity v(r = e) at the fixed cup and the slip velocity v0 − v(r = 0) at the rotating bob, where v0 is the velocity of the bob, leads to the total slip velocity vs. As shown in the inset of Fig. 5(a), the relative amount of wall slip vs/v0 is a decreasing function of the applied shear rate. Interestingly, both gels show a very similar evolution of vs/v0, although the strongly attractive system shows total wall slip (vs/v0 ≃ 1) over a larger range of shear rates, as already pointed out in Sections 3.1 and 3.2. Together with the sudden observation of shear-banded velocity profiles in the strongly attractive gel below ≃ 40 s−1, this continuous dependence of wall slip on suggests that the behaviour of the lubricating layers that are responsible for slippage is mostly decoupled from the bulk flow behaviour.
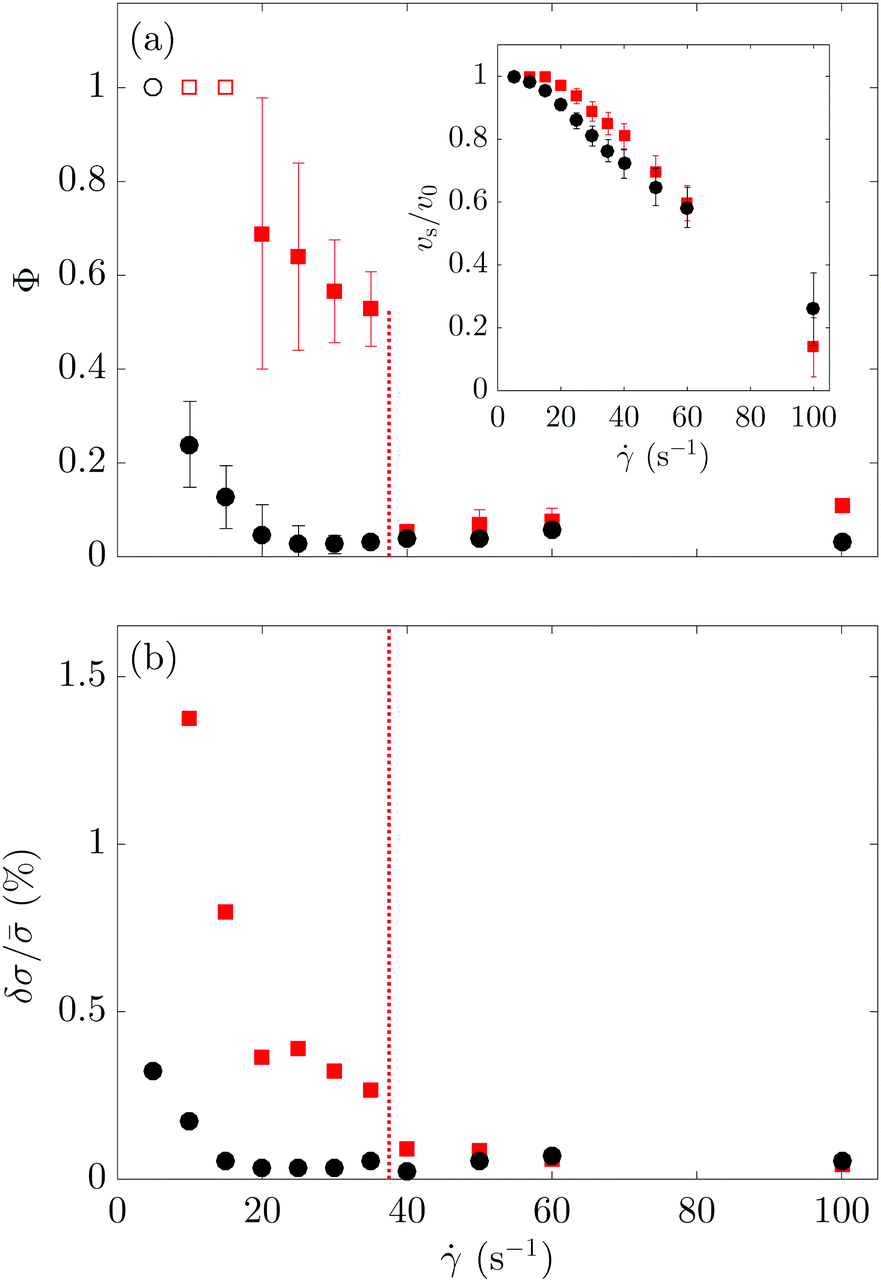 | ||
Fig. 5 (a) Degree of bulk flow heterogeneity Φ [defined in eqn (4)] and (b) relative amplitude of the stress fluctuations δσ/![[small sigma, Greek, macron]](https://www.rsc.org/images/entities/i_char_e0d2.gif) as a function of the applied shear rate for the weakly attractive calcite gel [ϕ = 10% in pure water (black circles)] and the strongly attractive calcite gel [ϕ = 7% in a sodium (94 mM) and calcium (3 mM) hydroxide solution (red squares)]. In (a), error bars on Φ are computed by allowing v(e) to vary by 10% in eqn (2)–(4). In (b), δσ/ is computed as the ratio of the standard deviation of the stress δσ to the average stress taken over the last 120 s of each step. The red vertical dashes indicate the shear rate below which an arrested band is observed in the strongly attractive gel. Open symbols in (a) indicate total wall slip. The inset in (a) shows the relative slip vs/v0, where vs is the total slip velocity and v0 is the velocity of the rotating bob, as a function of for both calcite gels (same symbols as in the main panels). as a function of the applied shear rate for the weakly attractive calcite gel [ϕ = 10% in pure water (black circles)] and the strongly attractive calcite gel [ϕ = 7% in a sodium (94 mM) and calcium (3 mM) hydroxide solution (red squares)]. In (a), error bars on Φ are computed by allowing v(e) to vary by 10% in eqn (2)–(4). In (b), δσ/ is computed as the ratio of the standard deviation of the stress δσ to the average stress taken over the last 120 s of each step. The red vertical dashes indicate the shear rate below which an arrested band is observed in the strongly attractive gel. Open symbols in (a) indicate total wall slip. The inset in (a) shows the relative slip vs/v0, where vs is the total slip velocity and v0 is the velocity of the rotating bob, as a function of for both calcite gels (same symbols as in the main panels). | ||
4.3 Predicting velocity profiles from slip-corrected flow curves
As already proposed in various previous works on the flow of complex fluids,12,31,56–58 we may combine wall slip measurements and rheological data to predict velocity profiles. To this aim, we first compute the “true” average shear rate in the bulk fluid from the fluid velocities extrapolated at both wall through | (1) |
The shear stress σ recorded simultaneously to velocity profiles and averaged over the last 120 s of each step is then plotted as a function of true to yield the slip-corrected flow curve. As seen in Fig. 1, while the raw rheological data precisely match the flow curve measured from shear rate sweeps, the slip-corrected data point to a significantly different rheology. Restricting the analysis to shear rates where no shear bands are observed, the σ vs. true curve can be well-fitted by a power-law behaviour σ = Atruen with exponents n = 0.15 and n = 0.13 respectively for the weakly and the strongly attractive gel. Such values indicate strong shear-thinning of the bulk material.
Finally, in the presence of a slip velocity v(e) at the fixed wall, one may compute the full theoretical velocity profile for such a shear-thinning behaviour as56
 | (2) |
Note that the choice of a purely shear-thinning fit σ = Atruen does not imply that the gels have no yield stress but only that the ranges of stresses considered in these fits lie too far above the yield stress. In particular, one may get a similar fit quality by fitting the data using a model with a yield stress, such as the Herschel–Bulkley model, but the confidence on the three parameters would be too poor. In the absence of data close enough to the yield stress, we therefore use eqn (2) with the fitting parameters n and A inferred from Fig. 1 together with the experimental slip velocity at the fixed wall.
As can be expected from the presence of heterogeneous flows at lower shear rates, eqn (2) only describes correctly the velocity profiles of the strongly attractive gel at the highest shear rates = 60 and 100 s−1 [see light red lines in Fig. 2(a) and (b)]. Still, even for the highest shear rate, the predicted profile seems to underestimate the curvature. For the weakly attractive gel (see gray lines in Fig. 2), however, the theoretical velocity profiles provide a very good description of all measured velocity profiles. In particular, they nicely capture the large curvature of v(r) indicative of strong shear-thinning. This curvature shows up here due to the small yet non-negligible decrease of the local shear stress from the inner cylinder to the outer cylinder by Δσ/σ ≃ 2e/R1 = 17%, which gets enhanced by the rather small value of the exponent n = 0.15.
4.4 Bulk flow heterogeneity
Next, in order to quantify bulk flow heterogeneity only, we consider the following slip-corrected velocity profile normalized between ṽ = 1 at the moving wall and ṽ = 0 at the fixed wall: | (3) |
 | (4) |
As reported in the main panel of Fig. 5(a), the degree of heterogeneity Φ remains negligible for the weakly attractive gel down to ≲ 10 s−1 where the flow transitions directly from homogeneous shear to total wall slip. This confirms that the flow in the weakly attractive system can be described by a homogeneous shear-thinning flow throughout the whole range of shear rates under study. On the other hand, upon decreasing in the strongly attractive system, Φ abruptly jumps to values larger than 0.4 for ≲ 40 s−1 and further increases up to 1 as the arrested band grows in size. Meanwhile, no such abrupt transition is observed on the slip velocity [inset of Fig. 5(a)], suggesting that the shear-banding phenomenon is not directly linked to slip at the walls. Finally, Φ quantitatively confirms the strikingly different flow behaviours of the two calcite gels and the sharp transition from quasi-homogeneous flow to shear-banded flow at low shear rates in the strongly attractive gel.
4.5 Shear-banding scenario in the strongly attractive gel
In order to fully investigate the heterogeneous flow regime of the strongly attractive system, we now turn our attention to the analysis of the shear-banded profiles recorded below ≃ 40 s−1. As usually done in such analysis,30,31 we focus on the local shear rate loc in the two different shear bands and on the distance δ of the interface between the bands from the rotating bob, i.e., the width of the sheared region. As indicated with blue lines in Fig. 2(c), loc is measured as the slope of linear fits of the velocity profiles in the two bands and δ is given by the position where the two fits intersect.
One could first argue that shear localization may be due to the combination of the gel yield stress and the stress heterogeneity inherent to the Taylor–Couette geometry, where the local shear stress decreases by 17% from the rotating bob to the fixed cup, as σ(r) ∼ 1/(R1 + r)2. Even if the global stress σ is larger than the yield stress σc, the portion of material close to the fixed cup can then be arrested if σ(r) ≤ σc, i.e., for r ≥ δ with
 | (5) |
This equation is valid as long as δ < e. However, this does not correspond to the observed dependence of δ(σ) [inset of Fig. 6(b)]. We therefore rule out this explanation, all the more since the estimated σc ≈ 58 Pa is much larger than the one estimated by viscoelastic measurements,10 of the order of 10 Pa.
 | ||
| Fig. 6 Analysis of the time-averaged velocity profiles in the strongly attractive calcite gel. (a) Local shear rate loc in the flowing band (filled symbols) and in the arrested band (open symbols) as a function of the slip-corrected shear rate true. The dotted line shows the scaling loc ∼ true3/4. (b) Position δ of the interface between the flowing band and the arrested band normalized by the gap width e as a function of true. The dotted line is δ ∼ true0.35. δ is measured from the rotating bob so that δ/e reflects the proportion of the flowing band. Error bars indicate a ±50 μm uncertainty on δ. Inset: δ/e as a function of the shear stress σ measured simultaneously to the velocity measurements. The dashed line is eqn (5) with σc = 57.7 Pa. | ||
Second, by plotting loc and δ/e as a function of the “true” shear rate true in Fig. 6, we show that our strongly attractive gel displays a strikingly non-standard shear-banding scenario. Indeed, contrary to the classical shear-banding scenario governed by a critical shear rate c and recalled in the introduction, the shear rate in the flowing region does not remain constant but rather strongly increases with true. Furthermore, the normalized width of the flowing band does not increase linearly from 0 to 1 when increasing the shear rate as expected from the classical “lever rule”.9,17,19,35 Here, δ/e rather increases sublinearly with true and seems to saturate at a value of about 0.3 for true ≃ 15 s−1. For true ≳ 15 s−1 (or equivalently for ≳ 40 s−1), δ/e effectively jumps to 1 since no arrested band is observed at larger shear rates.
To the best of our knowledge, such an original shear-banding scenario has not been reported so far and raises important theoretical issues. In particular, whether or not the power laws shown in Fig. 6 can be modelled and interpreted remains an open question. Although the sudden onset of shear banding is not linked to an abrupt change in the slip velocity [see Fig. 5(a)], a subtle interplay between shear banding and wall slip61 may also explain some of the unusual features of the shear banding reported here.
4.6 Temporal fluctuations and instability in the strongly attractive gel
Besides the shear banding revealed by time-averaged velocity data, another striking difference between the strongly and the weakly attractive calcite gels lies in the fluctuations of the flow. As evidenced in Fig. 4(b) for = 30 s−1 and as further analysed in Fig. 5(b), the strongly attractive gel displays large stress fluctuations below ≃ 40 s−1, namely in the shear-banding regime. At the lowest shear rates, these fluctuations increase in both gels concomitantly to the transition to pluglike flow. We note that for both gels, the amplitude of the stress fluctuations follows an evolution with that is qualitatively similar to that of the degree of heterogeneity Φ in Fig. 5(a).
The slow time scales revealed by the stress fluctuations in the strongly attractive gel hint at an instability of the shear-banded flow. Shear banding often goes along with fluctuations and flow instability due, for instance, to the coupling between microstructure and water release in multilamellar vesicles,62 to the elastic instability of the shear-induced phase in viscoelastic surfactant wormlike micelles63,64 or to avalanche-like behaviours in silica gels.19 Here, in order to try to uncover the origin of the fluctuating behaviour, we report in Fig. 7 a thorough analysis of the shear-banded velocity profiles recorded at = 30 s−1 during the experiment presented in Fig. 3(b) and 4(b), (d). This analysis is based on the observables δ and vs defined above for time-averaged velocity profiles but computed here in a time-resolved fashion on individual velocity profiles.
 | ||
| Fig. 7 Time-resolved analysis of local velocity measurements in the strongly attractive calcite gel sheared at = 30 s−1. (a) Normalized shear stress (σ − )/ recorded by the rheometer, with the time average of σ taken over the whole data set, (b) fraction 1 − δ/e of the gap occupied by the arrested band and (c) relative slip vs/v0 as a function of time t. The corresponding velocity data are shown in Fig. 4(d). The vertical dotted lines at t = 40 and 250 s indicate the location of the two main maxima in σ(t). | ||
Fig. 7 shows that both the shear heterogeneity quantified by 1 − δ(t)/e and the wall slip characterized by vs(t)/v0 are correlated to the shear stress σ(t). The values of the corresponding Pearson correlation coefficients are 0.68 and 0.73 respectively, meaning that larger stresses correspond to larger slip velocities but also to more heterogeneous flow profiles, i.e., to a greater extension of the arrested band. Such a strong increase of flow fluctuations with attraction has also been reported in simulations of jammed systems with tunable interaction,38 showing that heterogeneous velocity profiles and slip strongly fluctuate both in space and time as soon as the interparticle attraction is turned on. In the present experiments, the anti-correlation between σ and δ may be expected since a system with more arrested material (i.e., smaller δ) should be more viscous and thus show an increased stress under a fixed global shear rate. However, the correlation between σ and vs seems highly non-trivial and suggests that whenever the sample builds up a larger stress, i.e., a larger arrested region, more water gets expelled from the gel network, which contributes to larger and/or less viscous lubrication layers, leading to an increase in apparent wall slip. Clearly, more experimental work, including a microstructural investigation of the sliding layers, is required to uncover the full physics of the correlation between wall slip and bulk dynamics.
More generally, we emphasize that strong fluctuations seem inherent to the shear-induced dynamical transitions of soft materials. Indeed, dense suspensions of frictional particles that undergo discontinuous shear thickening also display large temporal variations of global and local quantities, both in experiments6,65–69 and in simulations.70,71 Thus, fluctuations are not restricted to shear-banding systems, whether yield stress fluids or shear-thinning fluids, but appear as much more widespread. Although models for such “rheochaos” have been proposed for a long time,72,73 a complete physical picture for such unstable behaviours is still lacking. In particular, it remains unclear whether a general coarse-grained approach can be developed or whether system-dependent details are important to understand the complex interplay between local bulk and interfacial observables and their impact on the global rheological response.
5 Conclusion
We have explored the influence of interparticle forces on the mechanical and flow properties of colloidal gels made of calcite particles. We have considered two systems: a pure calcite gel and a calcite gel containing sodium and calcium hydroxide. Adding sodium and calcium hydroxide to calcite dispersions reduces both the Debye length and the zeta potential, leading to the complete screening of the electrostatic repulsion between particles which interact only through van der Waals attraction. By measuring the local velocity profiles, we have shown that the weakly attractive pure calcite gels always undergo homogeneous flows, well predicted by the global rheology, whereas the strongly attractive calcite gel containing sodium and calcium hydroxide exhibit shear bands within a given range of applied shear rates. Associated with shear banding, we reported large fluctuations in both stress and velocity profiles, that were shown to be strongly correlated in time. The increase of fluctuations with the attraction between particles is in good agreement with simulations of sheared jammed systems.38 The local characterization of the flow field also revealed that both gels undergo wall slip and the detailed analysis of the velocity profiles allowed us to assert that slippage is mostly decoupled from the bulk flow and is not obviously linked to shear bands.Finally, a question that remains open is to determine the experimental conditions, such as the volume fraction or the attraction range, for which the attractive gel exhibits shear banding corresponding to underlying non-monotonic flow curves. At low solid fraction, the dispersion is no longer a percolated gel displaying a yield stress, while at high volume fraction, the flow curve becomes monotonic again39 or the shear bands are hidden by other experimental features such as total slippage or gel fracture. More generally, understanding the origin of the shear-banding instability in colloidal gels remains a challenge. In this direction, it will prove crucial to obtain detailed information on the gel microstructure under flow. Coupling rheometry to spatially and temporally resolved scattering techniques such as small-angle X-ray (rheo-SAXS) or neutron (rheo-SANS) scattering is a vital first step to identify structural differences between the sheared and unsheared regions. Moreover, one should also characterize the local heterogeneities in the colloid volume fraction and in the gel connectivity.39 While the former has recently become accessible through time-resolved X-ray measurements,74,75 the latter can in principle be characterized through fast confocal microscopy in dedicated colloidal systems.76–79 Another interesting issue is whether shear banding is involved in the hysteresis observed in the flow curve of the strongly attractive gel and how the gel microstructure evolves during such hysteresis. We anticipate that the present results coupling global rheometry and local velocity measurements will serve as a basis for such microstructural investigations as well as further numerical modelling and theoretical approaches of shear banding in attractive colloidal systems.
Conflicts of interest
There are no conflicts of interest to declare.Appendix A: flow homogeneity in the vorticity direction
Fig. 8 compares the velocity profiles v(r) obtained at different heights z for two different times and for the two types of calcite gels. We find that there is no significant variations of the velocity profiles along the vorticity, except perhaps at the top and bottom of the ultrasonic transducer array. Therefore, for both gels, the flow can be considered as homogeneous along the vorticity direction and we may focus only on velocity profiles averaged over the z-direction, v(r,t) = 〈v(r,z,t)〉z. | ||
| Fig. 8 Individual velocity profiles v(r,z,t) at different heights z in the weakly attractive sample [ϕ = 10% in pure water] at time (a) t = 30 s and (b) t = 90 s and the strongly attractive sample [ϕ = 7% in a sodium (94 mM) and calcium (3 mM) hydroxide solution] at time (c) t = 230 s and (d) t = 290 s. Experiments performed at a fixed shear rate = 30 s−1 in a smooth Taylor–Couette geometry. | ||
Appendix B: influence of interparticle forces at fixed solid volume fraction
Fig. 9 compares the velocity profiles obtained at various shear rates for two samples at the same solid volume fraction ϕ = 10% with physico-chemical conditions leading to either weakly [pure calcite] or strongly [3 mM Ca(OH)2 + 97 mM NaOH] attractive gels. Under these conditions, we find the same results as when keeping the shear modulus constant, i.e., we observe shear banding for the strongly attractive gel (in the range = 10–50 s−1) but not for the weakly attractive one. Here, the sample was presheared at = 10 s−1 for 1 min then in the reverse direction at = −10 s−1 for 1 min, after which steps of constant shear rate were applied. Note that at fixed ϕ = 10%, the shear modulus for the strongly attractive gel is G′ ≃ 20 kPa, about twice the value measured for the weakly attractive gel. We also emphasize that the experiments in Fig. 9 were performed under rough boundary conditions. Although sandblasting strongly mitigates wall slip when compared to Fig. 2, it does not fully eliminate slippage, especially when shear banding is present. Still, as also shown in Appendix C below, our main findings are robust to a change of the roughness of the cell walls.
 | ||
| Fig. 9 Velocity profiles v(r) = 〈v(r,z,t)〉z,t for a weakly attractive calcite gel [ϕ = 10% in pure water (black circles)] and for a strongly attractive calcite gel [ϕ = 10% in a sodium (94 mM) and calcium (3 mM) hydroxide solution (red squares)] for various decreasing shear rates: (a) = 100, (b) 50, (c) 20 and (d) 10 s−1. Experiments performed in a rough Taylor–Couette geometry. Velocity data were recorded at steady state and averaged over a short duration corresponding to 1000 successive ultrasonic acquisitions (from 0.25 s for = 100 s−1 to 2.5 s for = 10 s−1) and from z = 2 to z = 24 mm to remove end effects at the top and bottom of the cell. The dash-dotted lines show the velocity profiles expected for a Newtonian fluid in the absence of wall slip. | ||
Appendix C: robustness of shear banding under various boundary conditions
Fig. 10 reports supplementary experiments performed under different conditions of wall roughness and for a weakly attractive gel with a lower calcite volume fraction than in the main text. These measurements confirm that the flow of the weakly attractive gel remains homogeneous with a highly curved velocity profile typical of strong shear thinning. On the other hand, the strongly attractive gel displays a shear-banding regime as well as large slippage at the rotating bob whatever the boundary conditions. At this stage, however, it is not fully clear whether the arrested band actually extends all the way to the fixed cup or whether a small sheared region exists close to the cup wall [see also Fig. 11(b) below for mixed boundary conditions under a different shear rate]. In particular, the slope of the velocity profile for r ≳ 1.7 mm could also result from a systematic underestimation of the velocity due to the presence of the fixed echo of the cup when the ultrasonic speckle intensity is low.43 Still, from the present data and in view of the complex shear-banding scenario reported in Section 4.5, we cannot exclude the existence of a three-banded state similar to that reported previously in the flow of copolymer micelles.80 | ||
| Fig. 10 Influence of boundary conditions on the velocity profiles of calcite gels sheared between (a) a rough cup and a rough bob at = 20 s−1 and (b) a smooth cup and a rough bob at = 30 s−1. Black circles correspond to a weakly attractive gel [ϕ = 8% in pure water] while red squares correspond to a strongly attractive gel [ϕ = 7% in a sodium (94 mM) and calcium (3 mM) hydroxide solution]. Velocity data v(r) = 〈v(r,z,t)〉z,t are averaged over both z and t as in Fig. 2. The dash-dotted lines show the velocity profiles expected for a Newtonian fluid in the absence of wall slip. | ||
 | ||
Fig. 11 Long-time evolution of the flow of a strongly attractive calcite gel [ϕ = 7% in a sodium (94 mM) and calcium (3 mM) hydroxide solution]. (a) Stress response σ(t) for a fixed shear rate = 35 s−1 recorded over 2800 s. (b) Corresponding velocity profiles averaged over the three time intervals Δt1, Δt2 and Δt3 indicated respectively in red, orange and green in (a). (c) Spatiotemporal map of the z-averaged velocity v(r,t) = 〈v(r,z,t)〉z over Δt1. Experiment performed with a smooth cup and a rough bob. The white line corresponds to a fixed velocity v = 20 mm s−1. (d) Modulus of the Fourier transform ![[small sigma, Greek, circumflex]](https://www.rsc.org/images/entities/i_char_e111.gif) of the shear stress shown in (a). The Fourier transform is computed by excluding the first 100 s and by subtracting a quadratic fit to the data in order to remove the slow stress increase over time. The dashed line is a power law with exponent −0.8. See also Movie S2 (ESI†). of the shear stress shown in (a). The Fourier transform is computed by excluding the first 100 s and by subtracting a quadratic fit to the data in order to remove the slow stress increase over time. The dashed line is a power law with exponent −0.8. See also Movie S2 (ESI†). | ||
Appendix D: persistent flow fluctuations in the strongly attractive calcite gel
Fig. 11 and Movie S2 (ESI†) show that shear banding and fluctuations persist over long times in the strongly attractive gel. Note that the data in Fig. 11 were obtained using a smooth cup and a rough bob, thereby providing another confirmation that boundary conditions do not play a crucial role in the flow of calcite gels. Fig. 11(b) displays the velocity profiles averaged over the various time intervals shown with different colors on the stress signal of Fig. 11(a). These averages are indistinguishable from each other. This indicates that the shear-banded state is a stationary state. Moreover, sharp peaks with a relative amplitude of about 1% are observed in the shear stress σ(t) for over 40 min, involving characteristic time scales of 50–200 s. In the Fourier spectrum of σ(t) [Fig. 11(d)], faster time scales also appear as broad maxima around 0.08 Hz and 0.2 Hz superimposed to an f−0.8 decay. The slow overall increase of σ(t) for t ≳ 1500 s is most likely due either to solvent evaporation or to calcite cluster sedimentation at long times. Finally, the spatiotemporal map v(r,t) in Fig. 11(c) highlights the correlation between flow and stress fluctuations over 2000 s. As investigated in more details in Section 4.6, a stress maximum is associated with a transient growth of the arrested region and with a drop in the velocity close to the rotating bob.Acknowledgements
This project has received funding from the European Union Horizon 2020 research and innovation program under the Marie Skłodowska-Curie grant agreement No. 642976-NanoHeal Project. The results of this article reflect only the authors’ view and the Commission is not responsible for any use that may be made of the information it contains. Catherine Barentin acknowledges support from Institut Universitaire de France. Teresa Liberto acknowledges support from Vienna University of Technology (TU Wien). We thank Brice Saint-Michel and Vincent Dolique for help with ultrasound imaging and for stimulating discussions. This work also benefited from meetings within the French working group GDR CNRS 2019 “Solliciter LA Matière Molle” (SLAMM).Notes and references
- A. Putnis, An introduction to mineral sciences, Cambridge University Press, 1992 Search PubMed.
- K. G. Knauss, J. W. Johnson and C. I. Steefel, Chem. Geol., 2005, 217, 339–350 CrossRef CAS.
- S. Pourchet, I. Pochard, F. Brunel and D. Perrey, Cem. Concr. Res., 2013, 52, 22–30 CrossRef CAS.
- N. Mikanovic and C. Jolicoeur, Cem. Concr. Res., 2008, 38, 907–919 CrossRef CAS.
- F. Dalas, S. Pourchet, A. Nonat, D. Rinaldi, S. Sabio and M. Mosquet, Cem. Concr. Res., 2015, 71, 115–123 CrossRef CAS.
- G. Bossis, P. Boustingorry, Y. Grasselli, A. Meunier, R. Morini, A. Zubarev and O. Volkova, Rheol. Acta, 2017, 56, 415–430 CrossRef CAS.
- R. J. Flatt, Cem. Concr. Res., 2004, 34, 399–408 CrossRef CAS.
- T. Liberto, C. Barentin, J. Colombani, A. Costa, D. Gardini, M. Bellotto and M. Le Merrer, J. Colloid Interface Sci., 2019, 553, 280–288 CrossRef CAS.
- D. Bonn, M. M. Denn, L. Berthier, T. Divoux and S. Manneville, Rev. Mod. Phys., 2017, 89, 035005 CrossRef.
- T. Liberto, M. Le Merrer, C. Barentin, M. Bellotto and J. Colombani, Soft Matter, 2017, 13, 2014–2023 RSC.
- W.-H. Shih, W. Y. Shih, S.-I. Kum, J. Liu and I. A. Aksay, Phys. Rev. A: At., Mol., Opt. Phys., 1990, 42, 4772–4779 CrossRef CAS.
- L. Bécu, S. Manneville and A. Colin, Phys. Rev. Lett., 2006, 96, 138302 CrossRef.
- A. Ragouilliaux, G. Ovarlez, N. Shahidzadeh-Bonn, B. Herzhaft, T. Palermo and P. Coussot, Phys. Rev. E: Stat., Nonlinear, Soft Matter Phys., 2007, 76, 051408 CrossRef CAS.
- F. Pignon, A. Magnin and J.-M. Piau, J. Rheol., 1996, 40, 573–587 CrossRef CAS.
- P. Coussot, J. S. Raynaud, F. Bertrand, P. Moucheront, J. P. Guilbaud, H. T. Huynh, S. Jarny and D. Lesueur, Phys. Rev. Lett., 2002, 88, 218301 CrossRef CAS.
- T. Gibaud, C. Barentin, N. Taberlet and S. Manneville, Soft Matter, 2009, 5, 3026–3037 RSC.
- P. C. F. Møller, S. Rodts, M. A. J. Michels and D. Bonn, Phys. Rev. E: Stat., Nonlinear, Soft Matter Phys., 2008, 77, 041507 CrossRef.
- V. Grenard, T. Divoux, N. Taberlet and S. Manneville, Soft Matter, 2014, 10, 1555–1571 RSC.
- A. Kurokawa, V. Vidal, K. Kurita, T. Divoux and S. Manneville, Soft Matter, 2015, 11, 9026–9037 RSC.
- A. Fall, A. Lemaître, F. Bertrand, D. Bonn and G. Ovarlez, Phys. Rev. Lett., 2010, 105, 268303 CrossRef.
- A. Kabla and G. Debrégeas, Phys. Rev. Lett., 2003, 90, 258303 CrossRef.
- K. Krishan and M. Dennin, Phys. Rev. E: Stat., Nonlinear, Soft Matter Phys., 2008, 78, 051504 CrossRef.
- A. Fall, F. Bertrand, G. Ovarlez and D. Bonn, Phys. Rev. Lett., 2009, 103, 178301 CrossRef.
- S. Jarny, N. Roussel, S. Rodts, R. L. Roy and P. Coussot, Cem. Concr. Res., 2005, 35, 1873–1881 CrossRef CAS.
- G. Ovarlez, S. Rodts, X. Chateau and P. Coussot, Rheol. Acta, 2009, 48, 831–844 CrossRef CAS.
- A. Ragouilliaux, B. Herzhaft, F. Bertrand and P. Coussot, Rheol. Acta, 2006, 46, 261–271 CrossRef CAS.
- S. A. Rogers, D. Vlassopoulos and P. T. Callaghan, Phys. Rev. Lett., 2008, 100, 128304 CrossRef CAS.
- R. Besseling, L. Isa, P. Ballesta, G. Petekidis, M. E. Cates and W. C. K. Poon, Phys. Rev. Lett., 2010, 105, 268301 CrossRef CAS.
- P. Ballesta, G. Petekidis, L. Isa, W. Poon and R. Besseling, J. Rheol., 2012, 56, 1005–1037 CrossRef CAS.
- T. Divoux, D. Tamarii, C. Barentin and S. Manneville, Phys. Rev. Lett., 2010, 104, 208301 CrossRef.
- T. Divoux, D. Tamarii, C. Barentin, S. Teitel and S. Manneville, Soft Matter, 2012, 8, 4151–4164 RSC.
- M. Dinkgreve, M. Fazilati, M. Denn and D. Bonn, J. Rheol., 2018, 62, 773–780 CrossRef CAS.
- K. Karimi and J.-L. Barrat, Phys. Rev. E, 2016, 93, 022904 CrossRef.
- A. Nicolas, J.-L. Barrat and J. Rottler, Phys. Rev. Lett., 2016, 116, 058303 CrossRef.
- P. Coussot and G. Ovarlez, Eur. Phys. J. E: Soft Matter Biol. Phys., 2010, 33, 183–188 CrossRef CAS.
- K. Martens, L. Bocquet and J.-L. Barrat, Soft Matter, 2012, 8, 4197–4205 RSC.
- V. Mansard, A. Collin, P. Chauduri and L. Bocquet, Soft Matter, 2011, 7, 5524–5527 RSC.
- P. Chaudhuri, L. Berthier and L. Bocquet, Phys. Rev. E: Stat., Nonlinear, Soft Matter Phys., 2012, 85, 021503 CrossRef.
- E. Irani, P. Chaudhuri and C. Heussinger, Phys. Rev. Lett., 2014, 112, 188303 CrossRef.
- T. Gibaud, C. Barentin and S. Manneville, Phys. Rev. Lett., 2008, 101, 258302 CrossRef.
- S. Manneville, L. Bécu and A. Colin, Eur. Phys. J.: Appl. Phys., 2004, 28, 361–373 CrossRef.
- S. Manneville, Rheol. Acta, 2008, 47, 301–318 CrossRef CAS.
- T. Gallot, C. Perge, V. Grenard, M.-A. Fardin, N. Taberlet and S. Manneville, Rev. Sci. Instrum., 2013, 84, 045107 CrossRef.
- T. Divoux, M. A. Fardin, S. Manneville and S. Lerouge, Annu. Rev. Fluid Mech., 2016, 48, 81–103 CrossRef.
- S. P. Meeker, R. T. Bonnecaze and M. Cloitre, Phys. Rev. Lett., 2004, 92, 198302 CrossRef.
- J. R. Seth, C. Locatelli-Champagne, F. Monti, R. T. Bonnecaze and M. Cloitre, Soft Matter, 2012, 8, 140–148 RSC.
- X. Zhang, E. Lorenceau, P. Basset, T. Bourouina, F. Rouyer, J. Goyon and P. Coussot, Phys. Rev. Lett., 2017, 119, 208004 CrossRef CAS.
- P. C. F. Møller, A. Fall, V. Chikkadi, D. Derks and D. Bonn, Philos. Trans. R. Soc., A, 2009, 367, 5139–5155 CrossRef.
- T. Divoux, V. Grenard and S. Manneville, Phys. Rev. Lett., 2013, 110, 018304 CrossRef.
- R. Radhakrishnan, T. Divoux, S. Manneville and S. M. Fielding, Soft Matter, 2017, 13, 1834–1852 RSC.
- J. Mewis and N. J. Wagner, Colloidal suspension rheology, Cambridge University Press, 2012 Search PubMed.
- R. C. Sonntag and W. B. Russel, J. Colloid Interface Sci., 1986, 113, 399–413 CrossRef CAS.
- R. Wessel and R. C. Ball, Phys. Rev. A: At., Mol., Opt. Phys., 1992, 46, R3008–R3011 CrossRef CAS.
- A. A. Potanin, R. D. Rooij, D. V. den Ende and J. Mellema, J. Chem. Phys., 1995, 102, 5845–5853 CrossRef CAS.
- W. Y. Shih, W.-H. Shih and I. A. Aksay, J. Am. Ceram. Soc., 1999, 82, 616–624 CrossRef CAS.
- J.-B. Salmon, S. Manneville and A. Colin, Phys. Rev. E: Stat., Nonlinear, Soft Matter Phys., 2003, 68, 051503 CrossRef.
- J. Goyon, A. Colin, G. Ovarlez, A. Ajdari and L. Bocquet, Nature, 2008, 454, 84–87 CrossRef CAS.
- B. Géraud, L. Bocquet and C. Barentin, Eur. Phys. J. E: Soft Matter Biol. Phys., 2013, 36, 1–13 CrossRef.
- C. J. Dimitriou, G. H. McKinley and R. Venkatesan, Energy Fuels, 2011, 25, 3040–3052 CrossRef CAS.
- Y. Wei, M. J. Solomon and R. G. Larson, Soft Matter, 2019, 15, 7956–7967 RSC.
- M. P. Lettinga and S. Manneville, Phys. Rev. Lett., 2009, 103, 248302 CrossRef.
- S. Manneville, J.-B. Salmon and A. Colin, Eur. Phys. J. E: Soft Matter Biol. Phys., 2004, 13, 197–212 CrossRef CAS.
- M.-A. Fardin, D. Lopez, J. Croso, G. Grégoire, O. Cardoso, G. H. McKinley and S. Lerouge, Phys. Rev. Lett., 2010, 104, 178303 CrossRef CAS.
- M.-A. Fardin, T. J. Ober, V. Grenard, T. Divoux, S. Manneville, G. H. McKinley and S. Lerouge, Soft Matter, 2012, 8, 10072–10089 RSC.
- D. Lootens, H. V. Damme and P. Hébraud, Phys. Rev. Lett., 2003, 90, 178301 CrossRef.
- S.-I. Nagahiro, H. Nakanishi and N. Mitarai, Europhys. Lett., 2013, 104, 28002 CrossRef.
- M. Hermes, B. M. Guy, W. C. Poon, G. Poy, M. E. Cates and M. Wyart, J. Rheol., 2016, 60, 905–916 CrossRef CAS.
- V. Rathee, D. L. Blair and J. S. Urbach, Proc. Natl. Acad. Sci. U. S. A., 2017, 114, 8740–8745 CrossRef CAS.
- B. Saint-Michel, T. Gibaud and S. Manneville, Phys. Rev. X, 2018, 8, 031006 CAS.
- M. Grob, A. Zippelius and C. Heussinger, Phys. Rev. E, 2016, 93, 030901 CrossRef.
- R. N. Chacko, R. Mari, M. E. Cates and S. M. Fielding, Phys. Rev. Lett., 2018, 121, 108003 CrossRef CAS.
- S. M. Fielding and P. D. Olmsted, Phys. Rev. Lett., 2004, 92, 084502 CrossRef CAS.
- A. Aradian and M. E. Cates, Europhys. Lett., 2005, 70, 397–403 CrossRef CAS.
- M. Gholami, A. Rashedi, N. Lenoir, D. Hautemayou, G. Ovarlez and S. Hormozi, J. Rheol., 2018, 62, 955–974 CrossRef CAS.
- M. Sarabian, M. Firouznia, B. Metzger and S. Hormozi, J. Fluid Mech., 2019, 862, 659–671 CrossRef CAS.
- H. Chan and A. Mohraz, Rheol. Acta, 2013, 52, 383–394 CrossRef CAS.
- N. Koumakis, E. Moghimi, R. Besseling, W. C. Poon, J. F. Brady and G. Petekidis, Soft Matter, 2015, 11, 4640–4648 RSC.
- E. Moghimi, A. R. Jacob, N. Koumakis and G. Petekidis, Soft Matter, 2017, 13, 2371–2383 RSC.
- G. Colombo, R. Massaro, S. Coleman, J. Läuger, P. Van Puyvelde and J. Vermant, Korea Aust. Rheol. J., 2019, 31, 229–240 CrossRef.
- S. Manneville, A. Colin, G. Waton and F. Schosseler, Phys. Rev. E: Stat., Nonlinear, Soft Matter Phys., 2007, 75, 061502 CrossRef.
Footnote |
| † Electronic Supplementary Information (ESI) available: Movie 1 compares the time-resolved ultrasound flow imaging of a weakly attractive calcite gel [ϕ = 10% in pure water (left)] and of a strongly attractive calcite gel [ϕ = 7% in a sodium (94 mM) and calcium (3 mM) hydroxide solution (right)] at = 30 s−1. Movie 2 shows ultrasound flow imaging of a strongly attractive [ϕ = 7% in a sodium (94 mM) and calcium (3 mM) hydroxide solution] at = 35 s−1. See accompanying text for details. See DOI: 10.1039/d0sm01079k |
| This journal is © The Royal Society of Chemistry 2020 |