
 Open Access Article
 This Open Access Article is licensed under a Creative Commons Attribution-Non Commercial 3.0 Unported Licence
Step-wise linking of vesicles by combining reversible and irreversible linkers – towards total control on vesicle aggregate sizes
N.
de Lange
 *,
F. A. M.
Leermakers
and
J. M.
Kleijn
*,
F. A. M.
Leermakers
and
J. M.
Kleijn
Physical Chemistry & Soft Matter, Wageningen University and Research, Stippeneng 4, 6708 WE, Wageningen, The Netherlands. E-mail: frans.leermakers@wur.nl
First published on 26th June 2020
Abstract
Small vesicle aggregates as a model for primitive cellular assemblies or for application as multi-compartment drug delivery systems recently received a lot of interest, yet controlling the aggregation of vesicles to predetermined aggregate sizes remains quite a challenge. We show that this type of control is possible by using a combination of two different linker systems: streptavidin–biotin and C18-pNIPAm. The latter linker is a thermoresponsive surfactant, which below its lower critical solution temperature (LCST) of 32 °C acts as barrier on the outside of the vesicles preventing aggregation, even in the presence of other linkers. Above the LCST however, C18-pNIPAm collapses, becomes sticky and thus acts as a linker inducing aggregation. By working at low vesicle concentrations and tuning the C18-pNIPAm/lipid ratio, the aggregation is by design limited. When the temperature drops below the LCST again, the aggregation is reversed. However, this is not the case if other linkers are present. The collapse of C18-pNIPAm above the LCST provides close contact between vesicles, allowing other linker molecules to connect them. By combining the reversible 'switch-like' aggregation properties of C18-pNIPAm, with the irreversible linkage between biotinylated lipids and streptavidin, it is possible to control the size of the aggregates step by step using a simple temperature program.
Aggregation of colloidal particles is a widely popular research field where recently the interests have shifted towards controlled or directed self-assembly into pre-designed structures. Aggregation of liposomes (lipid vesicles) is of special interest as it provides a model system for cell–cell or cell–organelle interactions. Liposomes have been used for various applications like drug delivery,1,2 bioreactors,3,4 and to study chemical reactions under confinement and biologically relevant conditions.5 Controlled assembly of these vesicles into small aggregates further expands the possible applications, for example for multi-compartment drug delivery.2 More recently, vesicle aggregates have gained much interest as a platform to create synthetic cells.6 A special challenge is making synthetic cell tissues from vesicles, where they need to be attached together as small aggregates. Successful strategies however are sparse.7
Control over the aggregation of colloidal particles has been achieved in different ways such as using symmetrically arranged patches,8 specific shapes,9 and surface functionalisation with linkers like DNA10–13 or biotin and streptavidin.14
Aggregation of vesicles has been studied extensively as well. Linkers such as biotin and streptavidin,15–17 DNA with sticky ends,18 polyelectrolytes (with charged vesicles),19–21 and recently a thermosensitive surfactant, C18-pNIPAm,15 have all been used to induce vesicle aggregation. However, control of the size of vesicle aggregates remains limited, or very hard to accomplish. In previous work we achieved to restrict the aggregation to the level of mainly vesicle pairs using either biotin and streptavidin or C18-pNIPAm as the linker system.15 The key factor allowing such limited aggregation resulting in relatively sharp aggregate size distributions, is that the membrane-bound linker molecules diffuse to the contact area between two vesicles, depleting the rest of the membrane, before collision with another vesicle occurs. We therefore defined this as “self-limiting aggregation”. As a prerequisite, the vesicle concentration needs to be low, so that the time scale on which vesicles collide, is much smaller than the typical diffusion time of the linker molecules along the membrane. While this concept of self-limiting aggregation can be applied using C18-pNIPAm or streptavidin–biotin, these two linker systems are very different from one another. Aggregation of biotinylated vesicles using streptavidin is practically irreversible and happens immediately after adding streptavidin. In contrast, addition of C18-pNIPAm stabilizes the vesicles at room temperature, and initiates aggregation only at temperatures above the LCST (32 °C). Upon lowering of the temperature below the LCST again, the collapsed pNIPAm chains take up water again and the vesicles dissociate. The formation of vesicle pairs or other small vesicle aggregates using C18-pNIPAm is thus reversible with respect to temperature.15
In this paper we show that combining the two linker types, C18-pNIPAm and streptavidin–biotin, and applying temperature cycles (25 °C/40 °C), it is possible to induce a step-wise growth of vesicle aggregates and obtain small aggregates of a predetermined size. In addition, we discuss ways to control the increase in aggregation number, defined as the number of single vesicles per aggregate, that occurs during each temperature cycle. This involves variation of the added amount of linker molecules (biotinylated lipids, streptavidin and C18-pNIPAm) or, in specific cases, changing the time span of the 40 °C step. Throughout this step-wise process of aggregation, individual vesicles remain intact and do not show signs of fusion. We prove this using an assay by which lipid exchange between vesicles is monitored using FRET (Förster resonance energy transfer).
In addition to the relevance for the above-mentioned applications, the ability to create stable, small vesicle aggregates paves the way for investigation of intricate phenomena related to inter-membrane interactions, such as fusion and the formation of membrane handles.
1 Materials and methods
1.1 Materials
All chemicals are analytical grade and were used without further purification. Chloroform solutions of the phospholipids 1,2-dioleoyl-sn-glycero-3-phosphocholine (DOPC), 1,2-dioleoyl-sn-glycero-3-phosphoethanolamine-N-(cap biotinyl) (DOPE-biotin), 1,2-dioleoyl-sn-glycero-3-phosphoethanolamine-N-(lissamine rhodamine B sulfonyl) (Rhod-PE) and 1,2-dioleoyl-sn-glycero-3-phosphoethanolamine-N-(7-nitro-2-1,3-benzoxadiazol-4-yl) (NBD-PE) were purchased from Avanti Polar Lipids Inc. Streptavidin was purchased from Jackson ImmunoResearch. N-Isopropylacrylamide (NIPAm) was obtained from TCI Europe N.V. Other chemicals were acquired from Sigma-Aldrich. This includes 1-octadecatonethiol, 2,2′-azobis(2-methylpropionitrile (AIBN)) and all chemicals used to make the buffer solutions.Buffer solutions were prepared using ultrapure water (resistivity > 18 MΩ cm). Unless otherwise mentioned, they contained 10 mM tris(2-amino-2-(hydroxymethyl)propane-1,3-diol) and 50 mM NaCl. The pH was adjusted to 7.5 using 1 M HCl or 1 M NaOH. All buffer solutions were filtered through 0.2 μm pores before use.
1.2 Vesicle preparation
Large unilamellar vesicles have been prepared by extrusion following the procedure as described by De Lange et al.15 First, phospholipids dissolved in chloroform were mixed in the right composition in a round-bottom flask and dried in the vacuum oven for two hours. The obtained lipid film was then re-suspended in buffer solution to a final lipid concentration of Cl ≈ 2.0 × 10⁻² M and hydrated for about one hour in a rotary evaporator (no vacuum, 323 K, 100 rpm). The obtained (giant) multilamellar vesicles underwent eight freeze–thaw cycles using liquid nitrogen to freeze and a 40 °C water bath to thaw to gain unilamellar vesicles. Afterwards, the vesicles were extruded 21 times using a mini-extruder (Avanti Polar Lipids, Inc) equipped with a polycarbonate membrane with 0.2 μm pore sizes, which gave vesicles of approximately 75 nm in radius. The vesicles were subsequently collected and stored in the fridge until further use. The maximum storage time was 1 week.Characterization of the vesicles was performed using dynamic light scattering (DLS).22,23 A cumulant analysis,24 showed the vesicles to be spherical, with a hydrodynamic radius Rh between 65 and 75 nm and a polydispersity index (PDI) of ≈0.1. For a detailed overview of the cumulant analysis and the calculated PDI, see the supported information of previous work.15
See Table 1 for an overview of the prepared vesicles.
| Vesicle code | Molar membrane composition [DOPC / DOPE-biotin / Rhod-PE / NBD-PE] | Radius [nm] ± st. dev. | PDI [−] ± st. dev. |
|---|---|---|---|
| B-0.08% | 999.2 / 0.8 / 0 / 0 | 73.6 ± 1.4 | 0.10 ± 0.04 |
| B-0.4% | 996 / 4 / 0 / 0 | 74.6 ± 2.0 | 0.11 ± 0.04 |
| B-2% | 980 / 20 / 0 / 0 | 76.9 ± 1.6 | 0.13 ± 0.05 |
| Rhod-1% | 986 / 4 / 0 / 10 | 70.8 ± 1.5 | 0.12 ± 0.06 |
| NBD-1% | 986 / 4 / 10 / 0 | 71.3 ± 1.2 | 0.11 ± 0.04 |
| NBD-Rhod | 986 / 4 / 5 / 5 | 72.1 ± 1.5 | 0.12 ± 0.05 |
| NBD25-Rhod75 | 986 / 4 / 7.5 / 2.5 | 69.1 ± 3.1 | 0.26 ± 0.04 |
| NBD75-Rhod25 | 986 / 4 / 2.5 / 7.5 | 66.5 ± 2.0 | 0.22 ± 0.04 |
1.3 C18-pNIPAm surfactant synthesis
We used the same C18-pNIPAm surfactants as in previous work,15 which were synthesized following the protocol as published by Kodger et al.25 In short, 1-octadecanethiol (1.03 g, ∼3.5 mmol), NIPAm (29.36 g, ∼262.5 mmol) and AIBN (1.14 g, ∼7.0 mmol) in a molar ratio of 1![[thin space (1/6-em)]](https://www.rsc.org/images/entities/char_2009.gif) :75:2 were dissolved in 100 ml THF. After bubbling the solution with nitrogen for 30 minutes, the free radical chain-transfer polymerization was run overnight at 55 °C. Purification was done by precipitation into cold hexane, with subsequent centrifugation. The precipitate was dried under vacuum, collected and stored for further use. The average molecular weight 〈Mn〉 of the surfactant was characterized by gel permeation chromatography (GPC) with HFIP (hexafluoro-2-propanol) as the running solvent; this gave 〈Mn〉 = 5708 g mol−1, with a polydispersity index (PDI) of 2.8 and a degree of polymerization of approximately 50.
:75:2 were dissolved in 100 ml THF. After bubbling the solution with nitrogen for 30 minutes, the free radical chain-transfer polymerization was run overnight at 55 °C. Purification was done by precipitation into cold hexane, with subsequent centrifugation. The precipitate was dried under vacuum, collected and stored for further use. The average molecular weight 〈Mn〉 of the surfactant was characterized by gel permeation chromatography (GPC) with HFIP (hexafluoro-2-propanol) as the running solvent; this gave 〈Mn〉 = 5708 g mol−1, with a polydispersity index (PDI) of 2.8 and a degree of polymerization of approximately 50.
1.4 Vesicle aggregation experiments
Standard DLS measurements consisted of continuous measurements of 10 s recorded at a 90° angle. During the recording, the samples underwent a temperature program. Unless otherwise mentioned, this involved an initial 10 minutes at 25 °C, after which several temperature cycles were performed of 45 minutes at 40 °C and subsequently 30 minutes back at 25 °C.
1.5 Determination of lipid exchange between vesicles
To check for potential vesicle fusion a simple FRET assay was applied to observe phospholipid exchange between vesicles during aggregation experiments. As FRET pairs, we used fluorescently labeled lipids, NBD-PE as the donor and Rhod-PE as the acceptor.:1 mixtures of NBD-1% vesicles and Rhod-1% vesicles were used (see Table 1). After adding C18-pNIPAm and streptavidin, aggregation during the temperature program was monitored with DLS as before, now taking out 1.5 ml of sample at several stages, generally after 0, 1, 5 and 13 temperature cycles, to be measured using fluorimetry. As controls we performed the same experiments adding only C18-pNIPAm, only streptavidin or no linkers at all to the vesicle mixtures.
:1 mixture of NBE-1% vesicles and Rhod-1% vesicles, NBD-Rhod vesicles and a 1:1 mixture of NBD75-Rhod25 with NBD25-Rhod75 vesicles. The emission spectra are shown in Fig. 1.
 | ||
| Fig. 1 Emission spectra of control vesicle mixtures used to calculate the fraction of phospholipid exchange. These include NBD-1% vesicles (blue), Rhod-1% vesicles (green), a 1:1 mixture of NBD-1% and Rhod-1% (orange), NBD-Rhod vesicles (purple) and a 1:1 mixture of NBD75-Rhod25 with NBD25-Rhod75 vesicles (red). The total vesicle concentration was kept at Cv = 5 × 10⁻¹⁰ M. Excitation wavelength λex = 460 nm. | ||
We calculated the fraction of lipid exchange as follows. First, the FRET efficiency (E) of each sample was obtained from its emission spectrum:
 | (1) |
:1 mixture of NBD-1% and Rhod-1% (orange curve, Fig. 1), of the NBD-Rhod vesicles (purple curve, Fig. 1) and of a 1:1 mixture of NBD75-Rhod25 with NBD25-Rhod75 vesicles (red curve, Fig. 1), which were defined as 0%, 100% and 50% lipid exchange respectively. Using this calibration curve, the lipid exchange was estimated for the samples drawn during the aggregation experiments with fluorescently labeled phospholipids.
2 Results and discussion
2.1 The first temperature cycle
 | ||
| Fig. 2 Schematic representation of the individual vesicles with added C18-pNIPAm and added streptavidin before the temperature cycle. The carbon tail of the C18-pNIPAm inserts itself into the membrane, while the swollen pNIPAm polymer block forms a corona around the vesicle. Streptavidin is not able to reach the biotin due to steric hindrance of the C18-pNIPAm. | ||
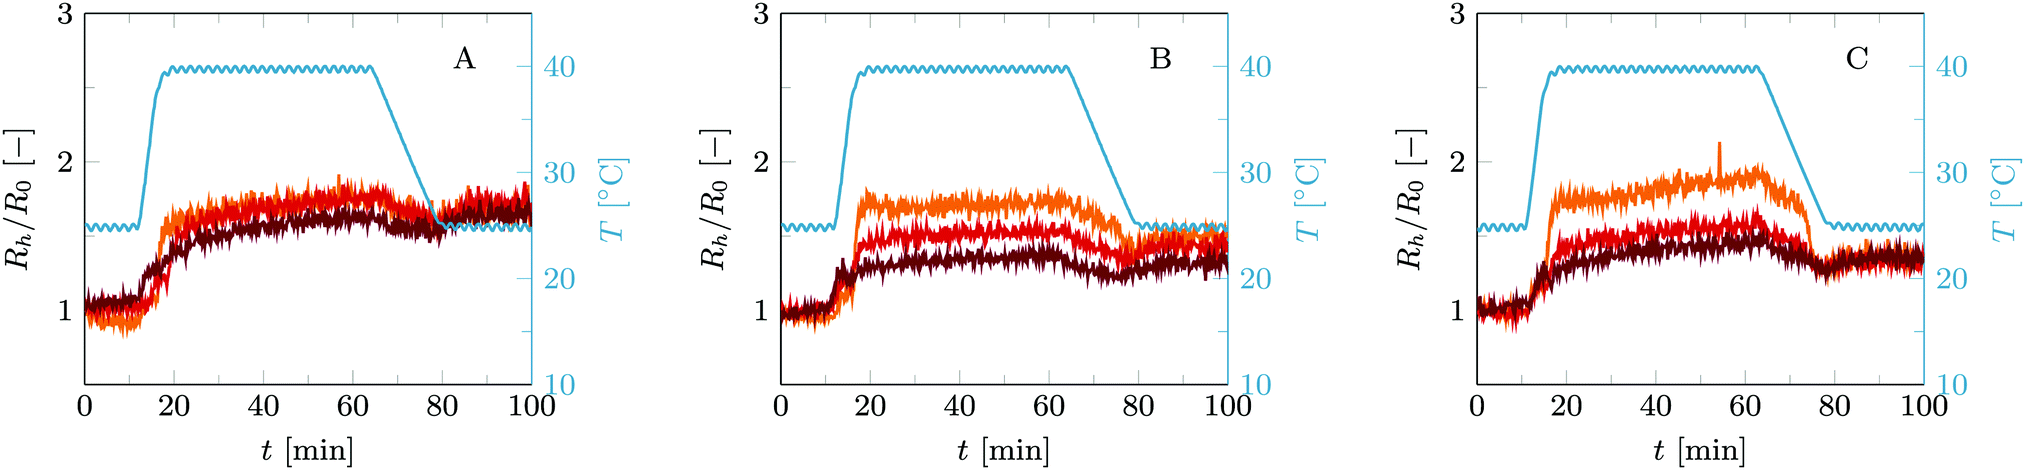
This first temperature cycle already shows the differences between these two cases, see Fig. 3. In short, vesicles with only C18-pNIPAm added as linkers show reversible self-limiting aggregation triggered by temperature, as was shown before,15 whereas the combination of C18-pNIPAm and streptavidin–biotin linkers leads to self-limiting aggregation upon increasing the temperature as well, but now this process is irreversible. To explain the differences in detail, we will describe the general picture, going chronologically through the three stages of this temperature cycle. These stages are (1) 10 minutes at 25 °C, (2) 45 minutes at 45 °C, and (3) 20 minutes back at 25 °C.
 | ||
| Fig. 3 Normalized hydrodynamic radius Rh/R0 over time for (A) B-0.08% vesicles, (B) B-0.4% vesicles and (C) B-2% vesicles. All vesicles underwent a standard temperature cycle of 10 min at 25 °C, 45 min at 40 °C and 20 min back at 25 °C. The C18-pNIPAm/phospholipid fraction is fixed to fC18-pNIPAM/lipid = 0.05. The blue curves represent the temperature. The yellow curves show the results for vesicles without added streptavidin. The other curves are for cases where streptavidin is added as well and each color represents a particular amount of streptavidin added. The resulting streptavidin/biotin ratios (fs/b) are: (A) 1/4 (orange), 1/2 (red) and 1 (purple); (B) 1/20 (orange), 1/10 (red) and 1/5 (purple); (C) 1/100 (orange), 1/50 (red) and 1/25 (purple). | ||
No aggregation occurs during the first stage, regardless of whether streptavidin is present or not. C18-pNIPAm is thus blocking the aggregation that biotin and streptavidin would initiate otherwise.15 Either the swollen pNIPAm corona around the vesicles prevents streptavidin from binding to the biotin on the vesicles (as illustrated in Fig. 2), or if streptavidin does bind to biotin on individual vesicles, these cannot come in close enough contact to allow streptavidin to connect them. Important to note is that for all experiments reported here, streptavidin is added after addition of C18-pNIPAm. When added in opposite order, some aggregation already takes place before addition of C18-pNIPAm, and after adding C18-pNIPAm the measured particle size is stable but higher than that of individual vesicles (data not shown).
In stage 2, aggregation occurs as the temperature is above the LCST of C18-pNIPAm. At this temperature the pNIPAm chains collaps and start to attract each other. All C18-pNIPAm molecules, including those that exist as micelles in the solution, assemble into sticky patches onto the surface of the vesicles. This initiates the aggregation, which happens rapidly and, in case no streptavidin is present, stops abruptly once there are mainly vesicle pairs in the solution. This self-limiting aggregation has been described in detail in previous work.15 As explained in the introduction, at relatively low vesicle concentrations as used in the experiments described here, when a vesicle has aggregated with one or two other vesicles, the still remaining linkers diffuse to the formed contact area(s) before collisions with other vesicles happen, so that further aggregation does not occur. With added streptavidin the initial fast aggregation generally leads to somewhat larger aggregates compared to using only C18-pNIPAm. This is simply because the collapse of C18-pNIPAm allows streptavidin to bind to biotin, so more linkers are available and successful collisions between vesicles with subsequent linking happen more often. In most cases, aggregation remains limited to small vesicle aggregates. Based on a simple model describing vesicle pairs as prolate ellipsoids, the hydrodynamic radius of a vesicle pair is about 1.3 times that of a single vesicle, depending on the size of the contact zone.15 As our current experiments show a Rh/R0 between 1.5 and 2, we estimate the aggregation number in the order of 2–4 vesicles.
The most outstanding difference between the vesicle aggregation with and without added streptavidin becomes apparent in the third stage. At this stage, the temperature is back below the LCST of C18-pNIPAm, which swells again and is no longer sticky. In the absence of streptavidin therefore the small aggregates fall apart again into individual vesicles. However, when streptavidin was added, the links formed between biotin and streptavidin during the 40 °C step keep the small vesicle aggregates intact. Further aggregation through to biotin and streptavidin is however not possible, due the swollen pNIPAm chains preventing vesicles and small aggregates to come into close contact.
Using streptavidin–biotin in combination with C18-pNIPAm results into similar trends in vesicle aggregation as found without C18-pNIPAm. This means that in the streptavidin-limited regime (fs/b < 1/8), adding a higher amount of streptavidin results in higher aggregate sizes after a single temperature cycle, see Fig. 3B and C. For the biotin-limited regime, the opposite effect is visible: adding more streptavidin slightly lowers the final aggregate size after one temperature cycle, as shown in Fig. 3A. Interestingly, even at a very high streptavidin biotin ratio of fs/b ≈ 1 (purple curve in Fig. 3A), vesicle aggregates remain intact after a full temperature cycle which shows that still a sufficient amount of streptavidin–biotin links could be established between vesicles. This is a strong indication that during the initial temperature step at 25 °C, the C18-pNIPAm not only hinders vesicles to come in close contact with each other, but also blocks binding of streptavidin to biotin. Otherwise, streptavidin would have covered all available biotin before aggregation started at 40 °C.
 | ||
| Fig. 4 Normalized hydrodynamic radius Rh/R0 over time for B-0.4% vesicles undergoing a standard temperature cycle of 10 min at 25 °C, 45 min at 40 °C and 20 min back at 25 °C. Streptavidin is added to obtain a ratio fs/b = 1/5 (A), fs/b = 1/10 (B) and fs/b = 1/20 (C). The amount of C18-pNIPAm is varied: fC18-pNIPAM/lipid = 0.05 (orange), fC18-pNIPAM/lipid = 0.025 (red) and fC18-pNIPAM/lipid = 0.0125 (purple). | ||
2.2 Multiple temperature cycles
While tuning the amount of linkers already allows controlling the aggregate size in the first temperature cycle, repeating the temperature cycle a number of times expands the options on obtained aggregate sizes extensively. After the first temperature cycle, aggregates on the level of vesicle pairs or vesicle trimers have been formed (Rh/R0 generally in the range 1.5 to 2). While the aggregation is triggered by the collapse of C18-pNIPAm at elevated temperature, streptavidin–biotin bonds keep the aggregates intact as the temperature is dropped again. C18-pNIPAm swells and loses its stickiness, and is presumably driven out of the confined contact zones. As such, it is available again on the outside of the vesicle aggregates and can trigger further aggregation when the temperature goes above the LCST again. Provided there are still enough free biotin and streptavidin molecules in the system, newly formed contact zones will again be consolidated. This offers a simple way to increase step by step the aggregate size.As can be seen in Fig. 5 and 6, in the presence of streptavidin the size of the aggregates seems to increase exponentially with the number of temperature cycles. This reflects that vesicle aggregates start aggregating with each other rather than with single vesicles, which are not abundantly present anymore, and that this aggregation is again self-limiting.
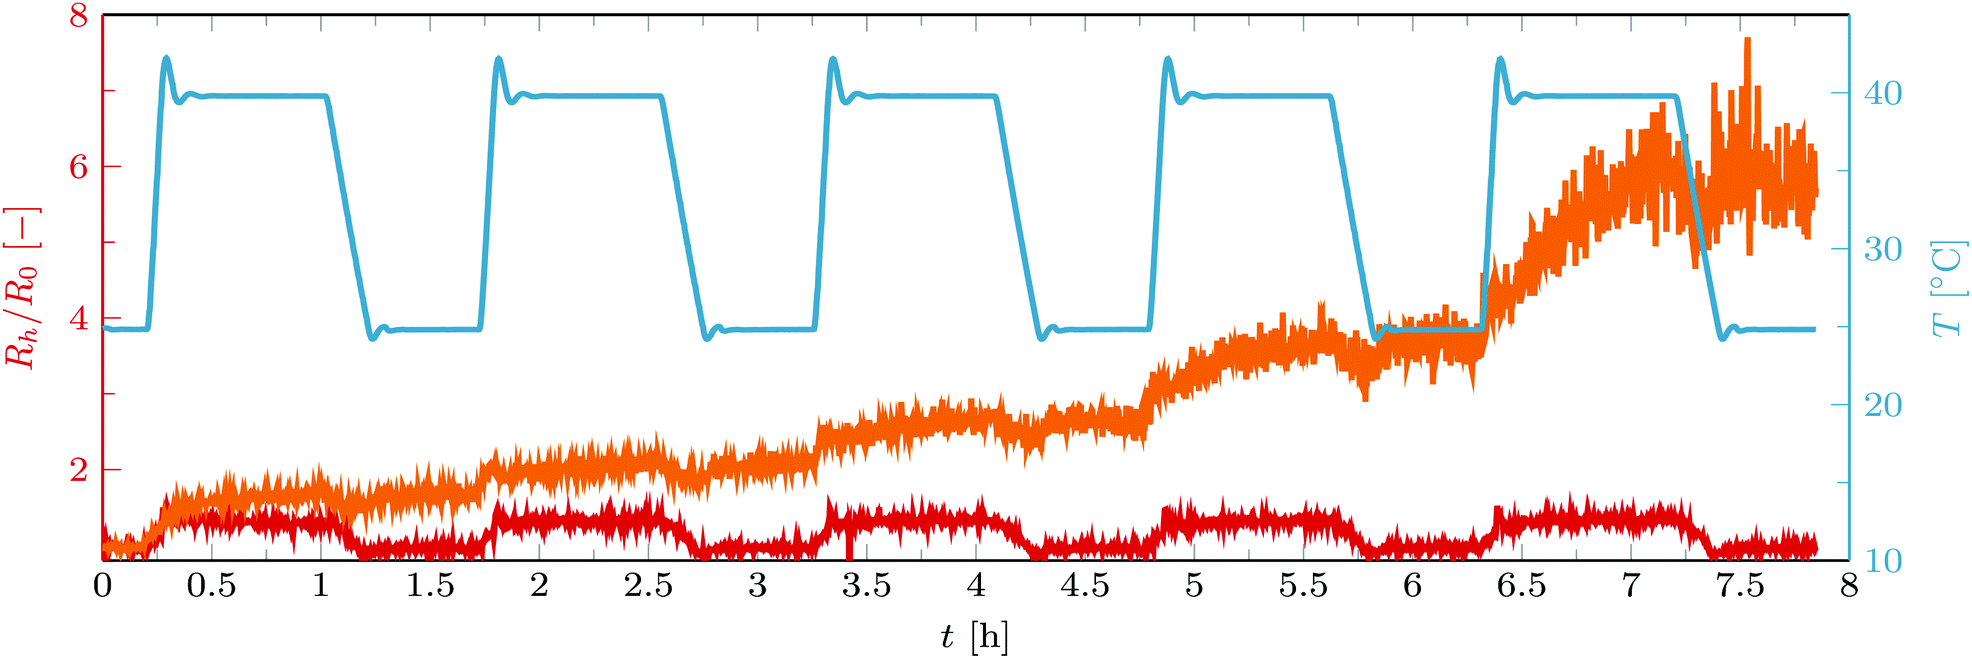 | ||
| Fig. 5 Normalized hydrodynamic radius Rh/R0 of B-0.4% vesicles containing C18-pNIPAM with streptavidin (fs/b ≈ 0.2, orange), and without streptavidin (red) as they undergo multiple temperature cycles. The blue curve shows the temperature. For the red curve fC18-pNIPAM/fphospholipids = 0.05 and for the orange one fC18-pNIPAM/fphospholipids = 0.0125. | ||
 | ||
| Fig. 6 Normalised hydrodynamic radius (Rh/R0) as a function of number of temperature cycles n for B-0.4% vesicles containing fC18-pNIPAm/lipid = 1/160 (blue), fC18-pNIPAm/lipid = 1/80 (red), fC18-pNIPAm/lipid = 1/40 (orange) and fC18-pNIPAm/lipid = 1/20 (purple). To all samples, streptavidin was added to a fs/b≈1/5. Rh was measured at 25 °C after each full temperature cycle (45 min at 40 °C and 30 min back at 25 °C). | ||
As the size of the aggregates increases step-wise with each temperature cycle, control on the final (average) aggregate size can thus be achieved by tuning the amount of cycles the sample goes through. It should be noted however that after the first temperature cycle the aggregate size distribution is still narrow, but with each cycle it becomes wider, since aggregates of different sizes randomly collide and are linked together. The consequence is that for obtaining aggregates of rather well-defined sizes, one should not apply too many temperature cycles, say up to four or five. We will come back to the aggregate size distributions later in the discussion.
Further control on the increase of aggregate sizes with each temperature cycle can be achieved by optimizing the amount of C18-pNIPAm linkers and the amounts and ratios of streptavidin and biotin. These ways to influence the aggregation process will be explored in the following subsections. In addition, the duration of the 40 °C step in the temperature cycles can be used as control parameter. As visible in Fig. 5, during this step the aggregate size gradually increases, a phenomenon that becomes significant after a few temperature cycles. This may be explained by a reduction in the frequency of the number of successful collisions between aggregates, due to their increasing size (decreasing diffusion coefficient) and declining number concentration. As a result the average aggregate size does not show a fast increase at the beginning of the 40 °C step anymore, but a more gradual growth during the whole period of elevated temperature. Anyway, it is evident that aggregate sizes can be tuned by changing the time span of this step.
In principle, when working in the streptavidin-limited regime (fs/b < 1/8), the more streptavidin added, the higher the increase in aggregate size per temperature cycle (Fig. 7A). However, a threshold amount of linkers is needed to obtain further aggregation with more temperature cycles: the red and blue curves in Fig. 7A represent cases below this threshold. Fig. 7B shows that for vesicles with only 0.08% biotinylated lipids the threshold amount of linkers is hardly reached at fs/b = 1/8 (orange curve). In this case, increasing fs/b only lowers the total amount of links that can be formed, because the excess of streptavidin leads to blocking of the limited available biotin. This aggregation behaviour clearly illustrates that the task of biotin and streptavidin is to keep the aggregated vesicles together through the temperature cycles, rather than to initiate the aggregation. If the amount of streptavidin–biotin linkers is below the threshold, they are effectively used up in the first cycle, which is clearly illustrated by the inset in Fig. 7B.
 | ||
| Fig. 7 Normalised hydrodynamic radius (Rh/R0) as a function of number of temperature cycles n for B-2% vesicles (A) and for B-0.08% vesicles (B). (A) fs/b = 1/204.8 (blue), fs/b = 1/102.4 (red), fs/b = 1/51.2 (orange), fs/b = 1/25.6 (purple) and fs/b = 1/12.8 (green). (B) No streptavidin added (blue), fs/b = 1/8 (red), fs/b = 1/4 (orange), fs/b = 1/2 (purple) and fs/b = 1 (green). For all samples fC18-pNIPAm/lipid = 1/20. Rh was measured at 25 °C after each full temperature cycle (45 min at 40 °C and 30 min back at 25 °C). The change in the normalized radius with each temperature cycle (ΔRh/R0) is shown in the insets of the graphs. | ||
2.3 Lipid exchange between vesicles
During the 40 °C step C18-pNIPAm is in a collapsed form in the contact areas between vesicles and swells again when the temperature drops below the LCST. Biotin and streptavidin however hold the contact areas and consequently the vesicle membranes might be subjected to various stresses as C18-pNIPAm is driven out of these areas. Different scenarios are imaginable for what happens with the vesicles as a result. One such scenario is that vesicles fuse rather than stay intact in the vesicle aggregates. To check this we performed FRET measurements on vesicles in which fluorescently labelled lipids NBD-PE and Rhod-PE were incorporated during preparation. In this FRET pair, NBD is the donor while Liss-Rhod is the acceptor. As shown in Fig. 1, when both NBD-PE and Rhod-PE are incorporated in the same vesicles, the amount of energy transfer between the donor and acceptor is substantial. In contrast, a mixture of vesicles containing only NBD-PE and vesicles containing only Rhod-PE do not show any FRET. Using the latter vesicle mixture in the aggregation experiments, an increase in FRET, i.e. an increase in the intensity at 583 nm with respect to the intensity at 535 nm, is expected if lipid exchange due to vesicle fusion occurs. The results of such an experiment are shown in Fig. 8. | ||
| Fig. 8 Emission spectra for a 1:1 mixture of NBD-1% and Rhod-1% vesicles containing C18-pNIPAm (fC18-pNIPAm = 0.0125) and with streptavidin added (fs/b = 1/5). The total vesicle concentration is Cv = 5 × 10⁻¹⁰ M. The spectra were obtained after 0 (blue), 1 (red), 5 (orange) and 13 (purple) temperature cycles of 10 min at 25 °C, 30 min at 40 °C and back at 25 °C. Excitation wavelength λ = 460 nm. The intensities are normalized to the intensity at λ = 535 nm. | ||
As can be seen from Fig. 8, an increase in FRET is observed for vesicle aggregates undergoing several temperature cycles. However, even after 13 cycles the total amount of FRET is still much lower than the maximum amount of FRET that is expected when vesicles mix completely. Since full-scale vesicle fusion would eventually lead to complete mixing, this is ruled out of the possibilities. Four other scenarios remain plausible: (1) it is well known that lipid exchange occurs more frequently at higher temperatures26 and bringing the vesicles close together, e.g. by vesicle aggregation, speeds up this process even more; (2) in the contact areas between vesicles the membranes are close enough together to allow FRET to happen between labelled lipids of different vesicles; in each temperature cycle more contact areas are formed, which increases the amount of FRET that occurs; (3) at 40 °C, C18-pNIPAm accumulates in the contact areas, including C18-pNIPAm that exists in micelles in solution. Upon cooling, a fraction of C18-pNIPAm forms micelles again, pulling out with it and solubilizing some of the lipids, which promotes lipid exchange between vesicles in each temperature cycle; (4) C18-pNIPAm allows for the formation of membrane handles between vesicles allowing for mixing of their lipids; this mixing occurs faster as the aggregates become larger. In addition, in a vesicle pair there is only a 50% chance to have both a donor- and an acceptor-containing vesicle, whereas in larger vesicle aggregates, the chances are higher that donor and acceptor vesicles are bound together. As a result, FRET would increase with each successive temperature cycle.
To determine which scenario is most likely, several control experiments were performed in which the amount of FRET was determined after various temperature cycles. The fraction of lipid exchange that occurred with each temperature cycle is presented in Fig. 9. The procedure to calculate the fraction of lipid exchange from the amount of FRET has been described in the Materials and methods section.
 | ||
| Fig. 9 Percentage of lipid exchange as a function of n temperature cycles of 10 min at 25 °C, 30 min at 40 °C and back at 25 °C. Samples measured are 1:1 mixtures of NBD-1% and Rhod-1% vesicles, without added linkers (yellow), with streptavidin only (green), with C18-pNIPAm only (purple), and with both streptavidin and C18-pNIPAm (blue, red and orange). The orange curve is a duplicate measurement of the blue curve and the red curve is for the exact same sample as the blue curve after a 2 day incubation period in the fridge. For the cases in which streptavidin is added, fs/b = 0.2, and for the cases in which C18-pNIPAm is added, fC18-pNIPAm = 0.0125. The dashed lines through the data serve as guidelines. | ||
Fig. 9 shows that some lipid exchange already happens in the control experiment without added streptavidin or C18-pNIPAm (yellow curve). Additionally, the degree of lipid exchange that occurs during the temperature cycles for vesicles to which only streptavidin is added (green curve), is similar to this control. Adding streptavidin does cause limited aggregation and thus brings vesicles close together, but this apparently does not result into more FRET or lipid exchange. This rules out both scenarios 1 and 2. The figure furthermore shows, that a significant increase in lipid exchange to approximately the same extent is seen in all cases in which C18-pNIPAm is added to the vesicles, with or without streptavidin. However, even after 13 cycles the phospholipids are still far from being mixed completely. Therefore, scenario 4, i.e. the formation of membrane handles, is also unlikely, since that would lead eventually to complete mixing of the lipids. Because this process might be slow, the sample with both streptavidin and C18-pNIPAm was stored in the fridge and measured again after two days. However, even after two full days of incubation, the amount of lipid exchange is still the same (compare the red and blue curves in Fig. 9).
 | ||
| Fig. 10 Size distributions measured for B-0.4% vesicles with added C18-pNIPAm and streptavidin (fC18-pNIPAm = 0.00625; fs/b = 1/5) after 0 (circles), 2 (squares), 4 (triangle), 6 (diamond) and 8 (pentagon) temperature cycles (45 min at 40 °C and back at 25 °C). | ||
The CONTIN analysis reveals that besides the expected widening in the size distribution, each temperature cycle caused a clear shift of the peak of the distributions to higher sizes. This confirms that aggregation happens in clear steps, in which self-limiting aggregation takes place by linkers that can diffuse to newly formed contact zones. In comparison, only a widening in the size distribution is seen during vesicle aggregation using linkers for which diffusion to the contact area is not possible, as previously shown for negatively charged vesicles linked by the positively charged polyelectrolyte polylysine.15
3 General discussion and outlook
While aggregation of vesicles into small aggregates can be achieved using several methods, controlling the size of these aggregates remains a challenge. For some methods the various aggregate sizes that can be produced are very limited,15,16 while in other methods only the speed of aggregation can be controlled,17 or requires precise timing of the addition of polymer to stop the aggregation process.20 In addition, on the odd chance previous methods succeed in producing vesicle aggregates of specific sizes, subsequent modifications such as a controlled continuation of the aggregation, is usually not an option.20 Our approach offers a simple, universal and effective alternative to obtain small vesicle aggregates of sizes to one's choice.In short, our approach involves a step-wise increase in vesicle aggregate size by using a reversible, temperature triggered linker (C18-pNIPAm) and an irreversible linker system (streptavidin–biotin) to secure the formed contact zones, and applying a number of temperature cycles. We have shown that depending on the number of temperature cycles, stable and fairly monodisperse vesicle aggregates of predetermined sizes up to about eight times the hydrodynamic radius of single vesicles can be prepared. The protocol to obtain small vesicle aggregates of a desired size can be optimized by tuning the amount of linkers added, the amount of temperature cycles, or in some cases the duration of the temperature steps.
Based on the experimental results, we sketch the following picture regarding the details of the aggregation process. See Fig. 11. The starting point is a solution with individual vesicles in which swollen C18-pNIPAm surfactants prevent any vesicle aggregation due to steric hindrance. At the same time, streptavidin present in solution is not able to bind to biotin on the vesicle surface. During the first temperature cycle, once the temperature rises above the LCST of around 32 °C, C18-pNIPAm collapses into sticky patches onto the vesicle surface. Subsequently, upon a successful collision with another vesicle this causes aggregation. Once a contact area is formed, extra C18-pNIPAm molecules migrate to the contact area, depleting the rest of the vesicle membranes which limits the aggregation to mainly vesicle pairs or trimers, as was previously found.7 Increasing the amount of C18-pNIPAm added causes larger sticky patches to form, increasing the chance of successful collisions which results into (on average) larger aggregates. Meanwhile, streptavidin is able to reach the surface of the vesicle and bind to the available biotin. At the edges of the already formed contact areas, streptavidin–biotin links can be formed between the two vesicles that consolidate the binding of the two vesicles. If relatively high amounts of streptavidin and biotin are present in the right ratio (fs/b ≈ 1/8), they also contribute in the aggregation, leading to higher average aggregation sizes during the elevated temperature step. Upon lowering the temperature, C18-pNIPAm swells and forces itself out of the contact area, which are kept intact by the streptavidin–biotin links. Any further aggregation is again prevented by steric hindrance of the swollen C18-pNIPAm on the outside of the vesicle aggregates. Subsequent temperature cycles proceed in a similar way: C18-pNIPAm collapses, becomes sticky and binds a few (two or three) vesicle aggregates together. Given that there is enough biotin and streptavidin, the newly formed contact areas are irreversibly connected. As with each temperature cycle, self-limiting aggregation happens between increasingly larger aggregates, the growth in aggregate size happens in a exponential fashion.
 | ||
| Fig. 11 Schematic overview of the step-wise vesicle aggregation process using reversible, temperature triggered linkers and irreversible linkers. (A) The first temperature cycle; (B) vesicle aggregate sizes during the first 3 temperature cycles. In the drawings (1–4) biotin is depicted in red, streptavidin in blue and C18-pNIPAm in green. See the text for a detailed explanation. | ||
We envision that that the ability to create stable, small vesicle aggregates using our approach will serve as a stepping stone for creating synthetic primitive cellular tissues, for which controlling the vesicle aggregate size is a prerequisite. In addition, our approach will be a useful tool for studying various inter-membrane interactions. With simple changes in for example lipid composition, or by adding membrane targeting molecules such as antimicrobial peptides,29 it can be used to investigate relevant physical properties and typical membrane phenomena. For example, we anticipate our approach provides an ideal tool to study membrane fusion or membrane topology changes such as the formation of stable inter-membrane handles. Furthermore, it can be extended to bind giant vesicles together for which it is possible to visualize the size and shape of the contact zones using confocal microscopy and other microscopy methods. From there, the strength and nature of the membrane adhesion could be determined as well as various physical properties of the membrane, such as bilayer bending rigidities. This is something we aspire to do ourselves in a follow-up study.
Conflicts of interest
There are no conflicts to declare.Acknowledgements
We thank Remco Fokkink (Physical Chemistry and Soft Matter, Wageningen University) for assistance with the light scattering experiments. We also thank Thomas Kodger and Joris Sprakel (Physical Chemistry and Soft Matter, Wageningen University) for reading the manuscript and share helpful insights and comments.Notes and references
- G. V. Betageri and M. B. Yatvin, Liposome drug delivery, US Pat., 6761901, 2004 Search PubMed.
- E. Kisak, B. Coldren, C. Evans, C. Boyer and J. Zasadzinski, Curr. Med. Chem., 2004, 11, 199–219 CrossRef CAS PubMed.
- M. Michel, M. Winterhalter, L. Darbois, J. Hemmerle, J. C. Voegel, P. Schaaf and V. Ball, Langmuir, 2004, 20, 6127–6133 CrossRef CAS PubMed.
- V. Noireaux and A. Libchaber, Proc. Natl. Acad. Sci. U. S. A., 2004, 101, 17669–17674 CrossRef CAS PubMed.
- D. T. Chiu, C. F. Wilson, F. Ryttsén, A. Strömberg, C. Farre, A. Karlsson, S. Nordholm, A. Gaggar, B. P. Modi and A. Moscho, et al. , Science, 1999, 283, 1892–1895 CrossRef CAS PubMed.
- P. Stano, R. Marangoni and F. Mavelli, International Meeting on Computational Intelligence Methods for Bioinformatics and Biostatistics, 2017, pp. 171–185.
- T. P. de Souza, G. V. Bossa, P. Stano, F. Steiniger, S. May, P. L. Luisi and A. Fahr, Phys. Chem. Chem. Phys., 2017, 19, 20082–20092 RSC.
- Y. Wang, Y. Wang, D. R. Breed, V. N. Manoharan, L. Feng, A. D. Hollingsworth, M. Weck and D. J. Pine, Nature, 2012, 491, 51 CrossRef CAS PubMed.
- Q. Chen, S. C. Bae and S. Granick, Nature, 2011, 469, 381 CrossRef CAS PubMed.
- Y. Zhang, A. McMullen, L.-L. Pontani, X. He, R. Sha, N. C. Seeman, J. Brujic and P. M. Chaikin, Nat. Commun., 2017, 8, 21 CrossRef PubMed.
- U. Jakobsen, A. C. Simonsen and S. Vogel, J. Am. Chem. Soc., 2008, 130, 10462–10463 CrossRef CAS PubMed.
- C. A. Mirkin, R. L. Letsinger, R. C. Mucic and J. J. Storhoff, Nature, 1996, 382, 607 CrossRef CAS PubMed.
- M.-P. Valignat, O. Theodoly, J. C. Crocker, W. B. Russel and P. M. Chaikin, Proc. Natl. Acad. Sci. U. S. A., 2005, 102, 4225–4229 CrossRef CAS PubMed.
- S. Sacanna, W. Irvine, P. M. Chaikin and D. J. Pine, Nature, 2010, 464, 575 CrossRef CAS PubMed.
- N. de Lange, F. Leermakers and J. M. Kleijn, Soft Matter, 2020, 16, 2379–2389 RSC.
- E. Kisak, M. Kennedy, D. Trommeshauser and J. Zasadzinski, Langmuir, 2000, 16, 2825–2831 CrossRef CAS.
- S. A. Walker and J. A. Zasadzinski, Langmuir, 1997, 13, 5076–5081 CrossRef CAS.
- M. Hadorn and P. E. Hotz, PLoS One, 2010, 5, e9886 CrossRef PubMed.
- G. V. Bossa, T. P. de Souza and S. May, Soft Matter, 2018, 14, 3935–3944 RSC.
- J. Yao, Y. Feng, Y. Zhao, Z. Li, J. Huang and H. Fu, J. Colloid Interface Sci., 2007, 314, 523–530 CrossRef CAS PubMed.
- D. Volodkin, V. Ball, P. Schaaf, J.-C. Voegel and H. Mohwald, Biochim. Biophys. Acta, Biomembr., 2007, 1768, 280–290 CrossRef CAS PubMed.
- W. Brown, Light scattering: Principles and development, Clarendon Press, Oxford, 1996 Search PubMed.
- B. J. Berne and R. Pecora, Dynamic light scattering: with applications to chemistry, biology, and physics, Courier Corporation, 2000 Search PubMed.
- D. E. Koppel, J. Chem. Phys., 1972, 57, 4814–4820 CrossRef CAS.
- T. E. Kodger and J. Sprakel, Adv. Funct. Mater., 2013, 23, 475–482 CrossRef CAS.
- J. Kremer, M. Kops-Werkhoven, C. Pathmamanoharan, O. Gijzeman and P. Wiersema, Biochim. Biophys. Acta, Biomembr., 1977, 471, 177–188 CrossRef CAS.
- S. W. Provencher, Comput. Phys. Commun., 1982, 27, 229–242 CrossRef.
- S. W. Provencher, Comput. Phys. Commun., 1982, 27, 213–227 CrossRef.
- N. G. Júnior, M. H. Cardoso, E. S. Cândido, D. van den Broek, N. de Lange, N. Velikova, J. M. Kleijn, J. M. Wells, T. M. Rezende and O. L. Franco, et al. , Sci. Rep., 2018, 8, 11127 CrossRef PubMed.
| This journal is © The Royal Society of Chemistry 2020 |