 Open Access Article
Creative Commons Attribution 3.0 Unported Licence
Simulations of structure formation by confined dipolar active particles
Vitali
Telezki
 * and
Stefan
Klumpp

Institute for the Dynamics of Complex Systems, Georg August University Göttingen, Friedrich-Hund-Platz 1, 37077 Göttingen, Germany. E-mail: vitali.telezki@theorie.physik.uni-goettingen.de; Tel: +49551 3926946
First published on 20th October 2020
Abstract
Dipolar active particles describe a class of self-propelled, biological or artificial particles equipped with an internal (typically magnetic) dipole moment. Because of the interplay between self-propulsion and dipole–dipole interactions, complex collective behavior is expected to emerge in systems of such particles. Here, we use Brownian dynamics simulations to explore this collective behavior. We focus on the structures that form in small systems in spatial confinement. We quantify the type of structures that emerge and how they depend on the self-propulsion speed and the dipolar (magnetic) strength of the particles. We observe that the dipolar active particles self-assemble into chains and rings. The dominant configuration is quantified with an order parameter for chain and ring formation and shown to depend on the self-propulsion speed and the dipolar magnetic strength of the particles. In addition, we show that the structural configurations are also affected by the confining walls. To that end, we compare different confining geometries and study the impact of a reorienting ‘wall torque’ upon collisions of a particle with a wall. Our results indicate that dipolar interactions can further enhance the already rich variety of collective behaviors of active particles.
1 Introduction
Self-propelled active particles that convert energy from their environment into directed motion are known to exhibit rich collective behavior such as self-organized pattern formation or swarming due to an interplay between various interaction forces.1–3 Microscopic active particles in fluids, so-called microswimmers, have been a particular focus of research both because of their rich dynamics4 and because of their potential in biomedical applications.5,6From an application point of view, an important feature of active particles is their accessibility to remote control. In that respect, magnetic active particles, which possess a magnetic dipole moment, specifically magnetic microswimmers, are of interest as they can be controlled by external magnetic fields. A biological example of a dipolar microswimmer is given by magnetotactic bacteria.7–11 These bacteria orient in external magnetic fields12 with the help of the magnetosome chain, a chain of iron-oxide nanocrystals inside their cell body.13 Proof-of-principle applications have demonstrated that magnetotactic bacteria can be utilized in drug delivery applications and cancer treatment.14–16 Examples for artificial dipolar microswimmers are magnetic Janus particles that can self-assemble into various structures that are controllable with external magnetic fields17,18 and various types of magnetic microrobots.19,20 While the dipole moment of these active particles provides a way to address them externally for steering, it generally also introduces dipole–dipole interactions between the active particles and can thus give rise to new forms of collective behavior, including spatial patterns.
Self-assembly of dipolar passive particles in small systems21 and in large systems has been studied theoretically,22–24 partly motivated by observations in ferrofluids.25–27 Small passive systems are known to form chains (N ≤ 3), rings (3 < N ≤ 17) or more complex, concentric multi-shell hexagonal patterns (N ≥ 18) as energetically favorable configurations in two dimensions.28–32
Dipolar coupling between active dipolar particles has recently been studied by several groups. Guzmán-Lastra et al. have investigated the hydrodynamic flow fields of self-assembled microswimmers. In particular, they studied how hydrodynamic and magnetic interactions affect cluster formation.33 In another study by Liao et al. the effect of motility and dipolar interactions on cluster formation has been investigated. In their Brownian dynamics simulations, they observed formation of chain-like structures and that motility-induced phase separation (MIPS) is generally suppressed by dipolar interactions.24
Most of these studies have focused on the collective behavior in spatially homogeneous environments. However, the motion of active microswimmers is often confined either by their natural environment like interfacial barriers or by complex experimental setups like microfluidic devices. Such confinement has been shown to affect the motion of active particles via steric and/or hydrodynamic interactions34–39 and to result in novel patterns of motion.40–42 Moreover, in many scenarios for applications, the number of active particles is typically rather small.
Therefore, here we study structure formation of dipolar active particles in small systems that are spatially confined. To that end, we use an active Brownian particle model and equip the particles with a dipole moment and dipole–dipole interactions. The corresponding Langevin equations for the position and orientation of the active particles are solved numerically in two dimensions. We do not consider hydrodynamic interactions between the particles, but hydrodynamic interactions with the confining walls may be included via a phenomenological wall torque. Using this model, we ask what structures (such as chains and rings) emerge and how these structures are affected by motility and magnetic interactions as well as by the geometry of the confining chamber and by the interactions of the swimmer with the confining walls.
2 Model
2.1 Equations of motion
In our model, we consider active Brownian spheres in two dimensions that have a permanent dipole moment μi = μêi with the magnetic strength μ at the particle center. Here and in the following, the superscript ‘hat’ denotes a unit vector. The magnetic moment is aligned with the orientation of the particle êi, which defines the direction of self-propulsion with speed v0. The equations of motion for a particle i with position ri and orientation êi are given by | (1) |
 | (2) |
| 〈ξT,R〉 = 0 |
| 〈ξT,R(t)·ξT,R(t′)〉 = 1δ(t − t′). |
The pairwise forces between two particles i, j separated by the distance rij = |rij| = |ri − rj| consist of dipolar forces and excluded volume interactions. The dipolar forces are given by43
The excluded volume interactions are modeled by the Weeks–Chandler–Anderson (WCA)44 pair potential with the interaction energy ε and the particle diameter σ
Forces resulting from interactions with the confinement Fwalli are described by the same WCA potential by calculating the shortest distance to the wall and applying the repulsive force for a virtual wall particle with its surface at the point of shortest distance (i.e. outside the wall at a distance  ). The torques τi acting on the particle i result from the pairwise dipolar interactions and the interactions with the confining walls of the system
with the vacuum permeability μ0.
Active particles may behave differently when approaching a solid boundary. A combination of hydrodynamic effects, steric interactions between the wall and the swimmers' body or, possibly, their flagella can lead to a reorientation of the swimmer at the wall.3,41,46,47 To model the reorientation of the swimmers near a wall, we introduce a wall torque τwalli that can be modified with the tuning parameter α
| τwalli = αêi × Fwalli. | (3) |
2.2 Simulation method
We solve the equations of motion in two dimensions by using overdamped Brownian dynamics (BD) simulations. In two dimensions, we can simplify eqn (2) by describing the orientation of the particle with an angle φ in the 2d plane. This leads to | (4) |
Throughout all simulations the temperature of the system was set to T = 1, while varying the self-propulsion speed v0 and the magnetic strength μ of the swimmers. To investigate the effect of the geometry of the confinement, the simulations were run both in squared confinement with a side length L = 50 and circular confinement with a radius  to match the area of the squared confinement. The simulations were performed for N = 36 (filling fraction Φ = 0.01) and N = 81 particles (Φ = 0.03) respectively, while varying the geometry of the confinement and the wall torque parameter α. To investigate the effect of density, the side length of the quadratic confinement with α = 0 was reduced to L = 33.3 (Φ = 0.03, matching the density of N = 81 particles) and L = 16.8 (Φ = 0.1). The particles were initially placed on a regular quadratic grid. For statistical analysis the first 1 × 10⁶ time steps of the trajectories were omitted. The trajectories were analyzed every 6000 time steps.
3 Results
3.1 Assembly of chain and ring structures
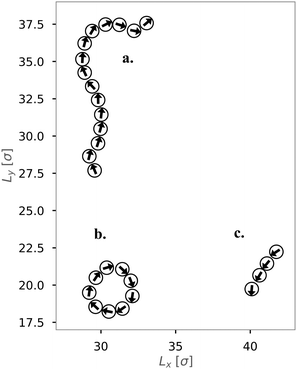
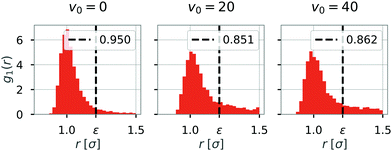
We first investigated the dynamics of dipolar swimmers in a squared confinement (i.e., with repulsive walls) without wall-induced torques (α = 0) for a small number of swimmers (N = 36). A cut-out of a typical snapshot of the simulation is shown in Fig. 1. In the simulations we observed that for certain parameters dipolar swimmers self-assemble into polymers. These polymers can mainly adopt two structural formations: chains (Fig. 1a and c) and rings (Fig. 1b). We observed that individual dipolar swimmers usually first self-assemble into a chain which then eventually catches its own tail and forms a ring. These structures are dynamic; rings and chains can disassemble again into chains, smaller chains or individual monomers. The number of dipolar swimmers in one structure varies. Generally, we observed that the structure depends on the magnetic strength μ, the self-propulsion speed v0 and the boundary conditions.To quantify the formation of these structures, we asked what the probability of structure formation ps is and how it depends on the magnetic strength μ and the self-propulsion speed v0. To answer that question, we identified particle clusters using a density based cluster algorithm (DBSCAN50), where the closest neighbor distance was set to ε = 1.21σ and the minimal number of particles in a neighborhood to form a cluster was set to N = 3 which is similar to other studies.24,51 The value of ε was determined by analysing the nearest neighbor distance g1(r), for μ = 1 (see Fig. 2). This choice of the magnetic strength μ = 1 corresponds to a dipolar coupling strength of λ = μ2/T = 1 where the pair-wise dipole interactions start becoming relevant. The histograms indicate that the closest neighbor distance weakly depends on the self-propulsion speed v0. Here, ε = 1.21σ is highlighted by the dotted line. This value of ε was chosen as more than 85% of the particles lay in this region for all three choices of the self-propulsion velocity.
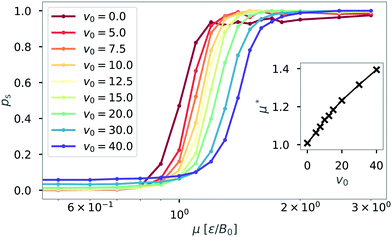
The probability of structure formation is then defined as the number of particles associated with a cluster divided by the total number of particles in the simulation per snapshot, averaged over 10 realizations. This parameter is also known as the degree of polymerization.51–53 The result is shown in Fig. 3 for different self-propulsion speeds v0. Here, we observe a steep increase of the probability of structure formation ps with increasing magnetic strength μ. This steep increase suggests that a critical value μ* for the magnetic strength can be defined. We estimate such critical value by calculating ps(μ*) = 0.5 via linear interpolation between the two data points closest to ps = 0.5. The inset shows that the critical magnetic strength μ* increases approximately linearly with the self-propulsion speed v0. We note that the critical value of μ* ≈ 1.0 for passive particles (v0 = 0) corresponds to a dipolar coupling strength of λ = μ*2/T = 1. For passive particles, the ratio between pairwise dipolar coupling energy and thermal energy is the only relevant parameter for structure formation. Structures begin to dominate (ps > 0.5) exactly when dipolar coupling energy between two particles matches the thermal energy of the system (μ*2 = T). Adding activity to the system increases the drive towards disorder and thus requires stronger dipolar interactions for structures to form. The linear dependence seen in Fig. 3 suggests a correction to the critical magnetic coupling strength which is linear in first order  with a constant γ. Such a correction is obtained quite generally if the balance condition λ = 1 or μ*2 = T is modified to μ*2 = T + f(v0), where the second term (with f′(0) = γ) describes the additional ‘noise’ due to active motion.
3.2 Classification of structures
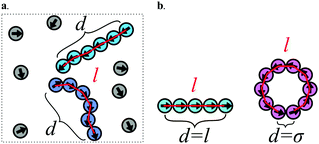
After determining the probability that a structure assembles, we classified the types of structures (i.e. chains and rings) that are observed. To classify the type of structures in a quantitative manner, we introduce the order parameter C. Fig. 4 illustrates how the order parameter C is calculated. After each cluster has been identified (see Fig. 4a shades of blue), a shortest-path algorithm54 was used to determine the contour length l (red) of the cluster as well as the head–tail distance d of the cluster. The order parameter C describes the distance d between head and tail of the cluster normalized to its contour length l while accounting for excluded volume interactions which lead to a minimal possible distance of σ between two particles: | (5) |
Following this definition, a completely straight chain (Fig. 4b turquoise) with minimal neighbor distance σ results in the order parameter C = 0, while a fully closed ring (pink) results in C = 1.
Here, we ask the question what value of the order parameter represents the system the best for given self-propulsion speed and magnetic strength. Do we observe structures and if yes, are they more likely to be chains or rings?
To answer this question, we investigate the distribution of the order parameter C while varying the magnetic strength and the self-propulsion speed of the dipolar swimmer. Fig. 5 shows examples of the cluster size weighted histograms for different simulation parameters. Each histogram is based on 10 independent realizations. We observed that the maxima of the distributions are binary, located at either C = 0 or C = 1 for the case of quadratic confinement with α = 0.
To find the most representative state, we first determined whether more states without a structure than with a structure were counted. If we counted more states with a structure (ps > 0.5), we determined which structure occurred most frequently by calculating the maximum Cmax (e.g. colored bar in Fig. 5 for μ = 1.5, v0 = 0: turquoise, and μ = 1.5, v0 = 10: pink). This structure is then assumed to be the best representation of the system for given parameters. If ps < 0.5 we did not calculate the maximum (e.g.Fig. 5 for μ = 1.0, v0 = 0: all bars gray). Here, the system is predominantly in an unstructured state.
We then continued to calculate Cmax while varying the self-propulsion speed v0 and the magnetic strength μ and display Cmax in a diagram of states (Fig. 6). The diagram of states shows that the structure depends on both the magnetic strength μ and the self-propulsion speed v0 of the particles. For low magnetic strengths (μ ≤ 1.0) we observed no structure formation independent of the self-propulsion speed (as already shown in Fig. 3). For higher magnetic strengths, we observed chain and ring formation, depending on the self-propulsion speed. The results shown in Fig. 6 are qualitatively similar to bigger systems of dipolar active swimmers without confinement.24 Importantly, by distinguishing the structured state more carefully (i.e. chains and rings) we can show that by changing the self-propulsion speed while keeping the magnetic strength constant one can influence the configuration of the dipolar swimmers. For example, the structure changes from a chain (v0 = 0) to a ring (v0 = 5) and back to a chain structure (v0 = 20) while keeping the magnetic strength constant at μ = 1.5.
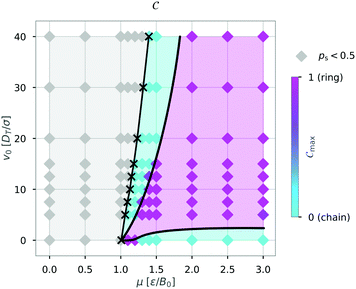 | ||
| Fig. 6 Diagram of states for N = 36 particles in a quadratic box with L = 50 and α = 0 according to the maximum of the order parameter Cmax. Here, the magnetic strength μ and the self-propulsion speed v0 are varied. The crosses indicate the critical magnetic moment μ* for structure formation (ps = 0.5) from Fig. 3. The colored areas and the lines were added as visual aids. | ||
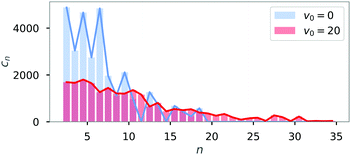
One striking feature of the diagram of states is that there are two regions where chain structures are formed (for fixed μ these occur for small and large velocities, respectively). To study the differences between these two scenarios for chains, i.e. between the passive (v0 = 0) and the active (v = 20) chain configurations, we analyzed the cluster-size distribution cn sorted by the cluster size n.
The distribution of cluster sizes is shown in Fig. 7 for fixed magnetic strength (μ = 1.5). Passive particles (blue) tend to form many small clusters, while active particles (red) also form larger clusters of up to size N = 36.
3.3 Influence of wall geometry and its properties
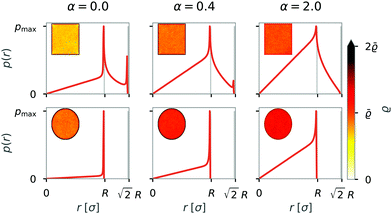
In movies of the simulation, we noticed that the formation of rings is often initiated by collisions with walls. Therefore, we asked next how the formation of structures is affected by the walls of the system. We varied both the geometry and the type of interactions between the swimmer and the walls. Specifically, we considered that active particles tend to reorient at walls and added a wall torque, as previously introduced in eqn (3).To analyze how the variation of the boundary conditions affects a single dipolar swimmer, we first simulated a single swimmer and analyzed the probability density. The results of ensemble and time averages over 243 × 106 snapshots are shown in Fig. 8 for squared and circular confinement and for three different torque parameters α = 0.0; 0.4; 2.0.
We can identify two regions; a homogeneous probability density in the interior of the confinement (r < R), where the radial probability density is linear, and a second region directly at the side walls (r = R) or at the corners ( ) of the confinement where the radial probability density drastically increases and shows peaks. With an additional wall induced torque (α ≠ 0), the relative probability density is increased in the interior with decreased peaks at the walls (r = R) or in the corners (
 ).
).
The relative probability density of one swimmer shows that active particles without a reorienting torque tend to get trapped at the boundaries, especially in the corners of a box. Introducing a wall torque results in a more homogeneous probability density, irrespective of the geometry. In the case of squared confinement, a high wall induced torque (α = 2) prevents trapping in the corners. Trapping at the walls and in corners is reduced by the wall torque, as particles do not have to rely on thermal fluctuations for their reorientation.
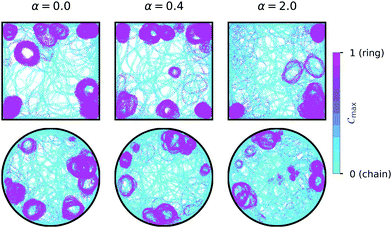
To test the hypothesis that ring formation is initiated by the walls of the confinement, we calculated the local order parameter Cmax(r) for each position r on a 250 by 250 grid in the confinement over 10 realizations. The results for moderate swimming speed v0 = 15 and magnetic strength μ = 2 for different wall interactions and geometries are shown in Fig. 9. Rings (pink) form predominantly at the walls for the squared (top row) and the circular (bottom row) confinement, irrespective of the wall torque α. In the case of the squared confinement, ring formation also occurs in the corners of the confinement. These results illustrate that ring formation is predominantly caused by interactions with the walls of the confinement and that this mechanism is not strongly affected by the geometry or wall induced torques.
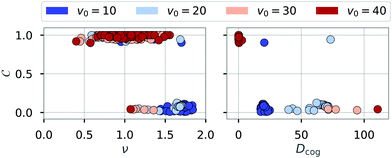
In addition, Fig. 9 suggest that rings are rather stationary, while chains remain motile. To analyze the dynamics of clusters systematically, we tracked the trajectories of individual clusters in chain (C < 0.2) or ring configuration (C > 0.8) and calculated the mean-squared displacement (MSD) of the center of geometry (cog) of these clusters. To extract the type of motion, we fitted the function f(t) = 4Dcogtν to these MSD curves,55,56 using a least-squares method.57 The MSD curves were obtained using a fast Fourier transform based implementation of a moving window algorithm.58 To reduce the noise contributed by short-lived clusters on the MSD calculation, we analyzed configurations with a life time greater than tmin = 3.6. Fig. 10 shows the fitted exponent ν and the prefactor Dcog against the order parameter C of the tracked clusters. For rings (C > 0.8), the exponent is mainly evenly distributed between 0.5 and 1.5, revealing that rings show diffusive behavior (ν = 1) with some rings being sub- (ν < 1) and superdiffusive (ν > 1). For chains (C < 0.2) the exponent is distributed between 1 and 2 (while occurring more frequently at higher values of ν) which shows the superdiffusive behavior of chains. We note that truly ballistic motion (ν = 2) is not reached. Since the exponent ν was determined over all available time scales, the typical diffusive behavior of active particles for short times contributes to reducing the measured exponents to ν < 2. The low proportionality constant for rings proves together with the exponent ν that rings diffusive slowly or can be considered stationary (Dcog ≈ 0) for the analyzed time scales. Chains on the other hand show superdiffusive motion where the factor Dcog increases with the self-propulsion velocity v0, as expected.
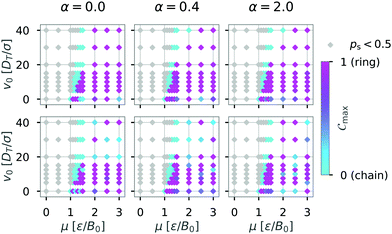
Next, we ask the question how do these different wall geometries and wall properties affect structures globally? To answer that question we are again interested in the most representative structure formed by the dipolar swimmers. We therefore determined diagrams of states based on the maximum of the order parameter Cmax while varying the boundary conditions. The results are shown in Fig. 11. The rows shows the dependence on the geometry (top row box, bottom row circle) and the columns the effect of the additional wall torque (α = 0.0; 0.4; 2.0). The comparison between the diagrams of states shows that boundary conditions affect structure formation to some extent. Even though the mechanism of structure formation is not strongly affected by the geometry and wall induced torques, the relative frequency of chain and ring formation is affected.
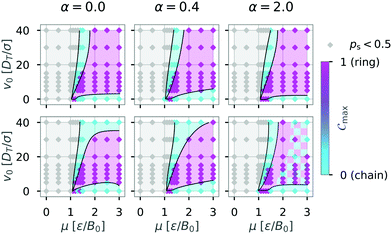 | ||
Fig. 11 Influence of the boundary conditions on the diagrams of states for N = 36 particles: The shape of the confinement (first row box L = 50, second row circle  ) and the interactions with the walls (columns left to right: α = 0.0; 0.4; 2.0) were varied and the diagram of states determined as in Fig. 6. The colored areas and the lines were added as visual aids. The hatched area indicates that no clear assignment to a dominant structure could be made for these parameters. Top left diagram shows same data as Fig. 6. ) and the interactions with the walls (columns left to right: α = 0.0; 0.4; 2.0) were varied and the diagram of states determined as in Fig. 6. The colored areas and the lines were added as visual aids. The hatched area indicates that no clear assignment to a dominant structure could be made for these parameters. Top left diagram shows same data as Fig. 6. | ||
Changing the geometry of the confinement while keeping the boundary conditions purely repulsive (α = 0.0) seems to have the biggest impact on structure formation of dipolar swimmers. Here, we observe formation of chains (turquoise area) in the circular confinement for swimmers with high motility (v0 = 40). The absence of corners in the circular environment removes the possibility for an already formed chain to get stuck in a corner and catch its own tail to form a ring. Hence, we observe fewer ring structures in a circular environment than in a squared one. Increasing the wall torque (α = 0.4; 2.0) has no strong effect on structure formation in a squared confinement (top row). Yet, the diagram of states changes qualitatively with increasing wall torque for the case of the circular confinement (bottom row) where rings become more predominant with increasing wall torque. For large induced wall torques (α = 2.0) a clear separation of ring and chain states can no longer be made in the case of circular confinement (hatched area).
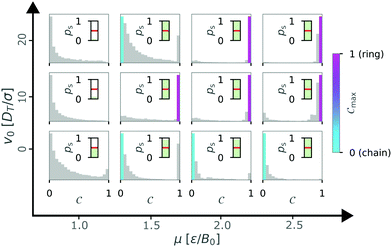
To gain more information about this hatched area, we took a closer look at the histograms of the order parameter for a circular confinement with a wall torque parameter α = 2.0 (see Fig. 12). Here, we observed maxima of chain configurations with Cmax ≠ 0 as well as bimodal distributions with two peaks for chain and ring configurations of approximately the same height (v0 = 20, μ = 2.5). These observations can explain the heterogeneity of the order parameter in the hatched area.
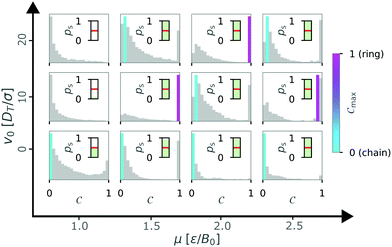 | ||
Fig. 12 Overview of the state weighted histograms of the order parameter C for circular confinement with  and α = 2.0 for N = 36 particles. The self-propulsion velocity v0 and the magnetic strength μ are varied. The color bar indicates the dominant order parameter Cmax corresponding to a chain (turquoise) or ring (pink) configuration. As in Fig. 5, if probability of structure formation ps < 0.5 (inset) all bars remain gray. Data obtained from 10 independent simulations. and α = 2.0 for N = 36 particles. The self-propulsion velocity v0 and the magnetic strength μ are varied. The color bar indicates the dominant order parameter Cmax corresponding to a chain (turquoise) or ring (pink) configuration. As in Fig. 5, if probability of structure formation ps < 0.5 (inset) all bars remain gray. Data obtained from 10 independent simulations. | ||
3.4 Influence of density
In this section we discuss how density affects cluster formation. We modulated the density by increasing the particle number, as well as by reducing the size of the simulation box. So far all the simulations were done for N = 36 particles. Now, we ask how increasing the density by increasing the particle number affects structure formation. To answer this question, we increased the particle number to N = 81 particles with a box size of L = 50 (Φ = 0.03) for different geometries and wall interactions. For a systematic analysis, we repeated the calculation of the order parameter C and determined diagrams of states (see Fig. 13) as before.We noticed that the diagram of states are similar to the simulations with N = 36 particles (see Fig. 11). Specifically, the transition from no structure (gray) to any structure (turquoise and pink) is approximately the same. However, there are differences in the regions with structures. We no longer see a clear chain regime for the passive case (v0 = 0), instead the Cmax values indicate more heterogeneous structures. Inspection of the histograms of the order parameter C (Fig. 14) shows that for higher particle number the histograms are multi-modal and that maxima can occur at intermediate values of C (cf. μ = 2.0 and v0 = 0). These observations suggest that also intermediate structures like bend chains or almost closed rings can be present.
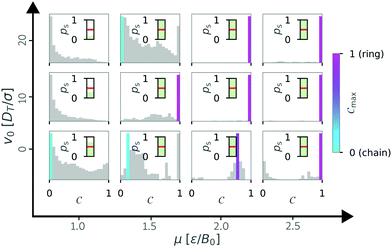 | ||
| Fig. 14 State weighted histograms of the order parameter C for N = 81 particles in squared confinement with L = 50 and α = 0 for varying self-propulsion velocity v0 and the magnetic strength μ. The color bar represents the dominant order parameter Cmax, corresponding to a chain (turquoise) or ring (pink) configuration. As in Fig. 5, if ps < 0.5 (inset) all bars remain gray. | ||
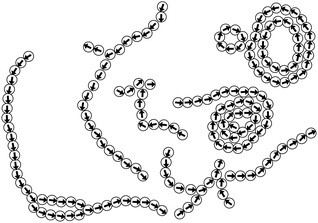
However, we noticed that next to the previously seen chain and ring structures more complex structures, such as branches or loops within a ring can emerge in simulations with N = 81 particles. Selected examples for these complex structures are shown in Fig. 15. Such structures are also known from systems of passive particles28 and indeed they appear to be more frequent for values of v0 = 0, as indicated by the higher occurrence of intermediate values of C in the histograms (see Fig. 14). However, some of these complex structures cannot be properly characterized by our order parameter C, since the head–tail distance is no longer well defined, and other ways of characterizing them have to be developed.
In addition, we modulated the density by reducing the box size of the squared confinement with N = 36 particles and purely repelling walls (α = 0) to L = 33.3 (Φ = 0.03, matching the density of the system with N = 81, L = 50) and L = 16.8 (Φ = 0.1) respectively. Fig. 16 shows how the diagram of states (a) and the critical magnetic strength μ* for structure formation (b) are affected by the reduced box size. In smaller systems (with increasing density) ring structures become dominant for passive particles (v0 = 0). This result is very similar, but not exactly the same as for the system with N = 81 particles and matching density (see Fig. 13 top left, where differences between the two realizations of the same density are seen for small v0). Furthermore, chain structures become dominant for high motilities for μ < 1.0 in the case of Φ = 0.10. This finding is in agreement with the recent results of Liao et al., who showed that the probability of chain formation is increased because of smaller mean separation between the particles for higher densities.24 This explanation is confirmed by the observed shift of the critical magnetic strength with increasing density (Fig. 16b).
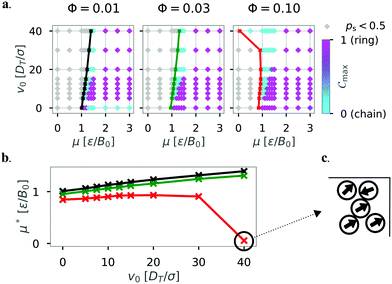 | ||
| Fig. 16 (a) Diagram of states according to the order parameter Cmax for N = 36 particles in squared confinement with α = 0 for different densities Φ by reducing the box size L. The colored line shows the critical magnetic strength in the diagram of states. The color bar represents the order parameter. Data taken over 10 independent simulations. Top left diagram shows same data as Fig. 6. (b) Critical magnetic strength μ* against the self-propulsion velocity v0. The colors indicate the different densities Φ = 0.01 (L = 50, black), Φ = 0.03 (L = 33.3, green), and Φ = 0.10 (L = 16.8, red). (c) Extract from a snapshot showing a disordered cluster formed in the top right corner of the squared confinement for the parameters μ = 0, v0 = 40. | ||
A striking deviation from this linear behavior is seen for high motility in the smallest system (L = 16.8, Φ = 0.10, red line) where structures are formed without magnetic interactions (μ* ≈ 0). This deviation occurs when the persistence length of the swimmers is much greater than the dimensions of the confining walls v0/DR ≫ L. Here, the formed clusters are qualitatively different from the previously observed chains and rings (see Fig. 16c). These particles form rather disordered, finite-sized clusters at the walls of the squared confinement (α = 0). The clusters are similar to clusters observed for active systems that display motility-induced phase separation (MIPS).59,60 In our system, the presence of boundaries seems to take the role of high density clusters during MIPS. We note that the system densities presented in this study are well below the critical density where MIPS is expected.61 It was shown recently that MIPS is repressed by strong dipolar interactions between particles for larger systems with higher densities.24
4 Conclusions
In this study, we used Brownian dynamics simulations to address self-assembly of dipolar active particles in small systems under confinement. We mainly observed chain and ring formation and investigated how self-assembly depends on self-propulsion speed v0 and magnetic strength μ of the particles. In the following, we will summarize our three main results.First, we calculated the probability of the swimmers to self-assemble into structures, also known as the degree of polymerization, while varying those two parameters. We showed that a critical magnetic strength μ* can be defined. This critical magnetic strength increases linearly with the self-propulsion velocity. This finding suggests that, at least to some extent, the activity of the particles might be treated as an effective temperature in further studies.
Second, we then defined an order parameter that is able to distinguish between chain and ring configurations and showed in a diagram of states what configurations are most likely to occur depending on v0 and μ. Generally, the configurations depend on motility and magnetic strength, which is in qualitative agreement with studies of bigger systems.24 In addition, we showed that ring configurations dominate the diagram of states for the analyzed parameters. An analysis of the dynamics of the clusters in chain and ring configuration revealed that chains are motile structures with superdiffusive behavior while rings remain stationary with mainly (sub-)diffusive behavior and a very small diffusion coefficient. When analyzing systems with N = 81 particles, we observed more complex structures like branches or loops within a ring; different order parameters will be needed to characterize these structures properly. Since the considered systems are quite small, we saw that increasing the density by increasing the particle number or by reducing the size of the confinement do not result in exactly the same diagrams of states.
Third, we studied the effect of geometry and wall properties on the structures. We introduced a circular geometry and a reorienting torque at the walls. By calculating a local order parameter, we showed that ring configurations dominantly occur at walls, independent of the geometry or the properties of the wall. This finding suggests that already assembled chains collide with the walls which then causes ring formation. Comparing the diagrams of states, we see that the structure is indeed affected by both the geometry of confinement and the wall torque, but the effect of the geometry is dominant. Chain configurations seem to be preferred for high motility in circular confinement.
Taken together our results show that dipolar interactions of active particles such as in magnetic active particles can lead to a rich variety of structures that self-organize. Interactions with confining walls have an important influence on these structures. Thus an understanding of the interactions in any specific system of active particles is required for understanding and predicting structure formation in that system.
Conflicts of interest
There are no conflicts to declare.Acknowledgements
The authors thank Agnese Codutti, Omar Munoz and Damien Faivre for discussions during the course of this study and Julius Pätzold for help with the implementation of the shortest path algorithm. This work was supported by the DFG (grant number KL818/2-2) within the priority program on Microswimmers (SPP 1726). We acknowledge support by the Open Access Publication Funds of the University of Göttingen.References
- P. Romanczuk, M. Bär, W. Ebeling, B. Lindner and L. Schimansky-Geier, Eur. Phys. J.: Spec. Top., 2012, 202, 1–162 CAS.
- T. Vicsek and A. Zafeiris, Phys. Rep., 2012, 517, 71–140 CrossRef.
- C. Bechinger, R. Di Leonardo, H. Löwen, C. Reichhardt, G. Volpe and G. Volpe, Rev. Mod. Phys., 2016, 88, 45006 CrossRef.
- J. Elgeti, R. G. Winkler and G. Gompper, Rep. Prog. Phys., 2015, 78, 56601 CrossRef CAS.
- K. E. Peyer, L. Zhang and B. J. Nelson, Nanoscale, 2013, 5, 1259–1272 RSC.
- K. Bente, A. Codutti, F. Bachmann and D. Faivre, Small, 2018, 14, 1704374 CrossRef.
- D. A. Bazylinski and R. B. Frankel, Nat. Rev. Microbiol., 2004, 2, 217–230 CrossRef CAS.
- D. Faivre and D. Schüler, Chem. Rev., 2008, 108, 4875–4898 CrossRef CAS.
- R. B. Frankel and D. A. Bazylinski, in Contributions to Microbiology, ed. M. Collin and R. Schuch, Karger, New York, Basel, 2009, vol. 16, pp. 182–193 Search PubMed.
- S. Klumpp and D. Faivre, Eur. Phys. J.: Spec. Top., 2016, 225, 2173–2188 CAS.
- S. Klumpp, C. T. Lefèvre, M. Bennet and D. Faivre, Phys. Rep., 2019, 789, 1–54 CrossRef.
- A. Codutti, K. Bente, D. Faivre and S. Klumpp, PLoS Comput. Biol., 2019, 15, e1007548 CrossRef.
- R. B. Frankel, R. P. Blakemore and R. S. Wolfe, Science, 1979, 203, 1355–1356 CrossRef CAS.
- S. K. Alsaiari, A. H. Ezzedine, A. M. Abdallah, R. Sougrat and N. M. Khashab, OpenNano, 2016, 1, 36–45 CrossRef.
- M. M. Stanton, B.-W. Park, D. Vilela, K. Bente, D. Faivre, M. Sitti and S. Sánchez, ACS Nano, 2017, 11, 9968–9978 CrossRef CAS.
- O. Felfoul, M. Mohammadi, S. Taherkhani, D. De Lanauze, Y. Zhong Xu, D. Loghin, S. Essa, S. Jancik, D. Houle, M. Lafleur, L. Gaboury, M. Tabrizian, N. Kaou, M. Atkin, T. Vuong, G. Batist, N. Beauchemin, D. Radzioch and S. Martel, Nat. Nanotechnol., 2016, 11, 941–947 CrossRef CAS.
- J. Yan, S. C. Bae and S. Granick, Adv. Mater., 2015, 27, 874–879 CrossRef CAS.
- G. Steinbach, M. Schreiber, D. Nissen, M. Albrecht, E. Novak, P. A. Sánchez, S. S. Kantorovich, S. Gemming and A. Erbe, Phys. Rev. E: Stat., Nonlinear, Soft Matter Phys., 2019, 100, 012608 CrossRef CAS.
- R. Dreyfus, J. Baudry, M. L. Roper, M. Fermigier, H. A. Stone and J. Bibette, Nature, 2005, 437, 862–865 CrossRef CAS.
- L. Zhang, J. J. Abbott, L. Dong, B. E. Kratochvil, D. Bell and B. J. Nelson, Appl. Phys. Lett., 2009, 94, 64107 CrossRef.
- J. Hernández-Rojas, D. Chakrabarti and D. J. Wales, Phys. Chem. Chem. Phys., 2016, 18, 26579–26585 RSC.
- A. Kaiser, K. Popowa and H. Löwen, Phys. Rev. E: Stat., Nonlinear, Soft Matter Phys., 2015, 92, 012301 CrossRef.
- S. H. L. Klapp, Curr. Opin. Colloid Interface Sci., 2016, 21, 76–85 CrossRef CAS.
- G.-J. Liao, C. K. Hall and S. H. L. Klapp, Soft Matter, 2020, 16, 2208–2223 RSC.
- D. Levesque and J. J. Ewis, Mol. Phys., 1982, 45, 733–746 CrossRef.
- S. H. L. Klapp, J. Phys.: Condens. Matter, 2005, 17, R525–R550 CrossRef CAS.
- J. J. Weis and D. Levesque, Adv. Polym. Sci., 2005, 185, 163–225 CrossRef CAS.
- P. G. de Gennes and P. A. Pincus, Phys. Kondens. Mater., 1970, 11, 189–198 CAS.
- I. S. Jacobs and C. P. Bean, Phys. Rev., 1955, 100, 1060–1067 Search PubMed.
- R. Messina, L. A. Khalil and I. Stanković, Phys. Rev. E: Stat., Nonlinear, Soft Matter Phys., 2014, 89, 011202 CrossRef.
- R. Messina and I. Stanković, Europhys. Lett., 2015, 110, 46003 CrossRef.
- B. Kiani, D. Faivre and S. Klumpp, New J. Phys., 2015, 17, 43007 CrossRef.
- F. Guzmán-Lastra, A. Kaiser and H. Löwen, Nat. Commun., 2016, 7, 13519 CrossRef.
- J. Toner, Y. Tu and S. Ramaswamy, Ann. Phys., 2005, 318, 170–244 CAS.
- A. P. Berke, L. Turner, H. C. Berg and E. Lauga, Phys. Rev. Lett., 2008, 101, 038102 CrossRef.
- M. B. Wan, C. J. Olson Reichhardt, Z. Nussinov and C. Reichhardt, Phys. Rev. Lett., 2008, 101, 18102 CrossRef CAS.
- G. Li and J. X. Tang, Phys. Rev. Lett., 2009, 103, 078101 CrossRef.
- M. C. Marchetti, J. F. Joanny, S. Ramaswamy, T. B. Liverpool, J. Prost, M. Rao and R. A. Simha, Rev. Mod. Phys., 2013, 85, 1143–1189 CrossRef CAS.
- K. Drescher, Biological Microswimmers, in Microswimmers – From Single Particle Motion to Collective Behaviour, ed. G. Gompper, C. Bechinger, S. Herminghaus, R. Isele-Holder, U. B. Kaupp, H. Löwen, H. Stark and R. G.Winkler, Forschungszentrum Jülich GmbH Zentralbibliothek, Jülich, 2015, B2.5–B2.6 Search PubMed.
- J. P. Hernandez-Ortiz, P. T. Underhill and M. D. Graham, J. Phys.: Condens. Matter, 2009, 21, 204107 Search PubMed.
- T. Ostapenko, F. J. Schwarzendahl, T. J. Böddeker, C. T. Kreis, J. Cammann, M. G. Mazza and O. Bäumchen, Phys. Rev. Lett., 2018, 120, 68002 CAS.
- P. Sartori, E. Chiarello, G. Jayaswal, M. Pierno, G. Mistura, P. Brun, A. Tiribocchi and E. Orlandini, Phys. Rev. E: Stat., Nonlinear, Soft Matter Phys., 2018, 97, 022610 CrossRef CAS.
- K. W. Yung, P. B. Landecker and D. D. Villani, Magn. Electr. Sep., 1998, 9, 39–52 CrossRef.
- D. Chandler, J. D. Weeks and H. C. Andersen, Science, 1983, 220, 787–794 CrossRef CAS.
- K. W. Yung, P. B. Landecker and D. D. Villani, Magn. Electr. Sep., 1999, 10, 29–33 CrossRef.
- G. Volpe, I. Buttinoni, D. Vogt, H. J. Kümmerer and C. Bechinger, Soft Matter, 2011, 7, 8810–8815 RSC.
- V. Kantsler, J. Dunkel, M. Polin and R. E. Goldstein, Proc. Natl. Acad. Sci. U. S. A., 2013, 110, 1187–1192 CrossRef CAS.
- R. L. Honeycutt, Phys. Rev. A: At., Mol., Opt. Phys., 1992, 45, 600–603 CrossRef CAS.
- P. E. Kloeden and E. Platen, J. Stat. Phys., 1992, 66, 283–314 CrossRef.
- F. Pedregosa, G. Varoquaux, A. Gramfort, V. Michel, B. Thirion, O. Grisel, M. Blondel, P. Prettenhofer, R. Weiss, V. Dubourg, J. Vanderplas, A. Passos, D. Cournapeau, M. Brucher, M. Perrot and É. Duchesnay, J. Mach. Learn. Res., 2011, 12, 2825–2830 Search PubMed.
- H. Schmidle, C. K. Hall, O. D. Velev and S. H. Klapp, Soft Matter, 2012, 8, 1521–1531 RSC.
- S. Sarkar Das, A. Ploplis Andrews and S. C. Greer, J. Chem. Phys., 1995, 102, 2951–2959 CrossRef CAS.
- J. Stambaugh, K. Van Workum, J. F. Douglas and W. Losert, Phys. Rev. E: Stat., Nonlinear, Soft Matter Phys., 2005, 72, 031301 CrossRef.
- L. L. C. Gurobi Optimization, Gurobi Optimizer Reference Manual, 2020, http://www.gurobi.com.
- J. P. Bouchaud and A. Georges, Phys. Rep., 1990, 195, 127–293 CrossRef.
- R. Metzler and J. Klafter, Phys. Rep., 2000, 339, 1–77 CrossRef CAS.
- P. Virtanen, R. Gommers, T. E. Oliphant, M. Haberland, T. Reddy, D. Cournapeau, E. Burovski, P. Peterson, W. Weckesser, J. Bright, S. J. van der Walt, M. Brett, J. Wilson, K. J. Millman, N. Mayorov, A. R. Nelson, E. Jones, R. Kern, E. Larson, C. J. Carey, L. Polat, Y. Feng, E. W. Moore, J. VanderPlas, D. Laxalde, J. Perktold, R. Cimrman, I. Henriksen, E. A. Quintero, C. R. Harris, A. M. Archibald, A. H. Ribeiro, F. Pedregosa, P. van Mulbregt, A. Vijaykumar, A. P. Bardelli, A. Rothberg, A. Hilboll, A. Kloeckner, A. Scopatz, A. Lee, A. Rokem, C. N. Woods, C. Fulton, C. Masson, C. Häggström, C. Fitzgerald, D. A. Nicholson, D. R. Hagen, D. V. Pasechnik, E. Olivetti, E. Martin, E. Wieser, F. Silva, F. Lenders, F. Wilhelm, G. Young, G. A. Price, G. L. Ingold, G. E. Allen, G. R. Lee, H. Audren, I. Probst, J. P. Dietrich, J. Silterra, J. T. Webber, J. Slavič, J. Nothman, J. Buchner, J. Kulick, J. L. Schönberger, J. V. de Miranda Cardoso, J. Reimer, J. Harrington, J. L. C. Rodríguez, J. Nunez-Iglesias, J. Kuczynski, K. Tritz, M. Thoma, M. Newville, M. Kümmerer, M. Bolingbroke, M. Tartre, M. Pak, N. J. Smith, N. Nowaczyk, N. Shebanov, O. Pavlyk, P. A. Brodtkorb, P. Lee, R. T. McGibbon, R. Feldbauer, S. Lewis, S. Tygier, S. Sievert, S. Vigna, S. Peterson, S. More, T. Pudlik, T. Oshima, T. J. Pingel, T. P. Robitaille, T. Spura, T. R. Jones, T. Cera, T. Leslie, T. Zito, T. Krauss, U. Upadhyay, Y. O. Halchenko and Y. Vázquez-Baeza, Nat. Methods, 2020, 17, 261–272 CrossRef CAS.
- V. Calandrini, E. Pellegrini, P. Calligari, K. Hinsen and G. Kneller, École thématique de la Société Française de la Neutronique, 2011, 12, 201–232 CrossRef.
- I. Buttinoni, J. Bialké, F. Kümmel, H. Löwen, C. Bechinger and T. Speck, Phys. Rev. Lett., 2013, 110, 238301 CrossRef.
- M. E. Cates and J. Tailleur, Annu. Rev. Condens. Matter Phys., 2015, 6, 219–244 CrossRef CAS.
- P. Digregorio, D. Levis, A. Suma, L. F. Cugliandolo, G. Gonnella and I. Pagonabarraga, Phys. Rev. Lett., 2018, 121, 98003 CrossRef CAS.
| This journal is © The Royal Society of Chemistry 2020 |


![[small rho, Greek, macron]](https://www.rsc.org/images/entities/i_char_e0d1.gif)
