DOI:
10.1039/D0SM00862A
(Paper)
Soft Matter, 2020,
16, 5981-5989
Complex emulsions for shape control based on mass transfer and phase separation†
Received
12th May 2020
, Accepted 8th June 2020
First published on 9th June 2020
Abstract
Complex emulsions are used to fabricate new morphologies of multiple Janus droplets, evolving from non-engulfing to complete engulfing core/shell configuration. The produced droplets contain an aqueous phase of dextran (DEX) solution and an oil phase, which is mixed with ethoxylated trimethylolpropane triacrylate (ETPTA) and poly(ethylene glycol) diacrylate (PEGDA). The PEGDA in the oil phase is transferred into the aqueous phase to form complex morphologies due to the phase separation of PEGDA and DEX. The effects are investigated including the ratio of oil to aqueous phase, the content of initial PEGDA, DEX and surfactants, and the type of surfactants. DEX/PEGDA–ETPTA core/shell-single phase Janus droplets are formed with an increasing engulfed oil droplet into the aqueous droplet while the ratio of oil to aqueous phase increases or the initial PEGDA content increases. The high DEX content leads to the DEX–PEGDA–ETPTA doublet Janus. The use of surfactants polyglycerol polyricinoleate (PGPR) and Span 80 results in the formation of DEX/PEGDA/ETPTA single core/double shell and DEX/PEGDA–ETPTA core/shell-single phase Janus droplets, respectively. These complex emulsions are utilized to fabricate solid particles of complex shapes. This method contributes to new material design underpinned by mass transfer and phase separation, which can be extended to other complex emulsion systems.
1. Introduction
An emulsion is a metastable system but can be stabilized by a suitable surfactant, which generally consists of two immiscible liquid phases with one phase dispersed into the second.1 Recently, complex emulsions, including multiple emulsions1,2 and Janus emulsions,3,4 have promising applications in foods,5 chemical separations,6 sensors,7 drug delivery,8 microcapsules fabrication.9,10 Multiple emulsions are often generated through a two-step method.11,12 Firstly, the inner phase liquid mixes with the middle phase liquid, forming a primary emulsion under a high-shear condition. Subsequently, the primary emulsion mixes with the outer phase liquid to obtain the multiple emulsions, which is always conducted under a near-static condition to avoid rupture of the liquid film between inner phase and outer phase. Janus emulsions can be prepared by one-step emulsification with two immiscible liquids (as dispersed phases) added to the continuous phase, followed by stirring or vibration.13,14
New techniques of microfluidic methods15,16 and phase separation methods17 have been introduced. The microfluidic method is to manipulate liquids to produce monodisperse emulsion droplets in a microchannel, such as glass capillary18,19 and polydimethylsiloxane (PDMS)-based microfluidics.20 For instance, water–oil Janus emulsions are prepared by using a double-bore capillary microfluidic device.21 The phase separation method is to induce phase separations in multicomponent homogeneous droplets which includes stimulus-induced phase separation (temperature22 and light23) and mass-transfer induced phase separation (volatilization,24 extraction25 and diffusion26). The aqueous two-phase system (ATPS) consists of two incompatible polymers.27 When the concentration of a component exceeds a specific value, the solution will spontaneously form two phases. The ATPS can be used to prepare multiple emulsions,28 microcapsules29 or particles.30 These new methods are useful in the preparation of complex emulsions, but still subject to some limitations. For instance, the complicate design of emulsion devices is the main challenge.31 The common PDMS-based microfluidic devices cannot be used in many organic solvents due to the swelling of PDMS.32 The current microfluidic-based phase separation method starts with a homogeneous emulation droplet,17,33,34 and subsequently generates complex emulsions due to phase separation. Usually, mass transfer occurs between the inner phase emulsion droplets and the outer phase or even the external environment.17,24,35 If mass transfer occurs inside the droplets, it would avoid the undesirable escape of the constituents.
Herein, we combine a microfluidic method with a mass-transfer induced phase separation for preparing complex emulsions. The droplets were prepared by using a simple coaxial theta glass capillary device, in which a mixture of ETPTA and PEGDA was the oil phase with a dextran (DEX) solution as the aqueous phase. As PEGDA is miscible with both ETPTA and water, part of PEGDA was rapidly transferred from the oil droplet to the aqueous droplet. When the PEGDA in the aqueous droplet reached a certain concentration, PEGDA and DEX were also separated into two phases. Furthermore, the change of the droplet morphology was achieved by adjusting the flow ratio of the oil phase to the aqueous phase, the initial content of PEGDA, DEX and surfactants, and the type of surfactants. Once the complex emulsions of various morphologies were obtained, the emulsion droplets could be treated by ultraviolet irradiation to obtain complex particles of various shapes.
2. Experimental section
2.1. Chemicals and materials
Poly(ethylene glycol) diacrylate (PEGDA, Mn = 575) monomer, ethoxylated trimethylolpropane triacrylate (ETPTA, Mn = 428) monomer and fluorescein isothiocyanate-dextran (FITC-DEX) were purchased from Sigma-Aldrich. 2-Hydroxy-4′-(2-hydroxyethoxy)-2-methylpropiophenone (photoinitiator 2959), 2-hydroxy-2-methyl-1-phenyl-1-propanone (photoinitiator 1173), dextran (DEX, Mw = 70![[thin space (1/6-em)]](https://www.rsc.org/images/entities/char_2009.gif) 000) and Sudan III were obtained from Aladdin Industrial Corporation. Liquid paraffin was purchased from Shanghai Lingfeng Chemical Reagent Co., Ltd. Cetyl dimethicone copolyol surfactant modified polyether-polysiloxane (EM 90) was purchased from Evonik Industries (Germany). Sorbitane monooleate Span 80 and octanol were purchased from Sinopharm Chemical Reagent Co., Ltd (Shanghai, China). Polyglycerol polyricinoleate (PGPR) was obtained from Hebei Baiwei Biotechnology Co., Ltd (Hebei, China). The theta glass capillary was obtained from World Precision Instruments Shanghai Trading Co., Ltd. The poly(tetrafluoroethylene) (PTFE) tubes with different diameters were purchased from Chukoh Chemical Industries, Ltd. Poly(methyl methacrylate) (PMMA) plate was purchased from HuiFeng Machine & Plastic Co., Ltd (Zhejiang, China). Syringe pumps (Harvard pump33 DDS) used to introduce the solution into the microchannels were purchased from Harvard Apparatus (USA). UV curing system (OmniCure S1500) was purchased from LUMEN DYNAMICS (Canada).
000) and Sudan III were obtained from Aladdin Industrial Corporation. Liquid paraffin was purchased from Shanghai Lingfeng Chemical Reagent Co., Ltd. Cetyl dimethicone copolyol surfactant modified polyether-polysiloxane (EM 90) was purchased from Evonik Industries (Germany). Sorbitane monooleate Span 80 and octanol were purchased from Sinopharm Chemical Reagent Co., Ltd (Shanghai, China). Polyglycerol polyricinoleate (PGPR) was obtained from Hebei Baiwei Biotechnology Co., Ltd (Hebei, China). The theta glass capillary was obtained from World Precision Instruments Shanghai Trading Co., Ltd. The poly(tetrafluoroethylene) (PTFE) tubes with different diameters were purchased from Chukoh Chemical Industries, Ltd. Poly(methyl methacrylate) (PMMA) plate was purchased from HuiFeng Machine & Plastic Co., Ltd (Zhejiang, China). Syringe pumps (Harvard pump33 DDS) used to introduce the solution into the microchannels were purchased from Harvard Apparatus (USA). UV curing system (OmniCure S1500) was purchased from LUMEN DYNAMICS (Canada).
2.2. Preparation of complex emulsion droplets
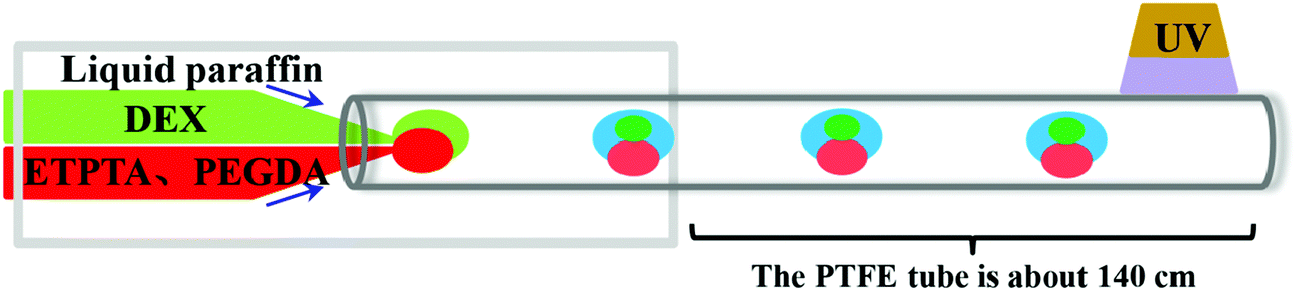
A simple coaxial theta capillary microfluidic device is shown in Fig. 1. The device is assembled with a theta capillary (inner diameter of single hole: 0.03 mm) inserted into a PTFE tube (inner diameter: 0.56 mm). The PTFE tube was extended by about 140 cm outside the device except for different concentrations of surfactant EM 90 or different type of surfactants. The DEX solution was used as the aqueous phase (disperse phase I), and the mixed solution of PEGDA and ETPTA was the oil phase (disperse phase II). Liquid paraffin was used as the continuous phase and sheared dispersion phases to obtain homogeneous complex emulsion droplets. The droplet consists of an oil droplet and an aqueous droplet and takes about 5 minutes to pass through the PTFE tube. For observing the droplet morphology, Sudan III (red color) was added to the oil phase. For recognition of the phase separation of ATPS in the aqueous droplet, FITC-DEX was added to the aqueous phase. The flow rate of continuous phase was fixed at 4 mL h−1, and the total flow rate of the dispersed phases was 150 μL h−1. The droplets were collected in a Petri dish coated with a layer of PDMS.
 |
| | Fig. 1 Schematic illustration of the microfluidic device. The dispersed phase I (light green) is DEX aqueous solution, and the dispersed phase II (red) is a mixture of PEGDA and ETPTA. In the sheared droplets, the light red, light blue, and green portions represent the EPTTA-rich phase, the PEGDA-rich phase, and the DEX-rich phase, respectively. | |
2.3. Preparation of complex particles
For preparation of complex particles, 25 mg g−1 photoinitiator 1173 was added into the oil phase, 5 mg g−1 photoinitiator 2959 was added into the aqueous phase, and an ultraviolet beam was applied over the downstream of the PTFE tube, as shown in Fig. 1. ETPTA and PEGDA monomers were polymerized under UV irradiation and the particles with complex shape were obtained. The samples were collected in a Petri dish. The continuous phase was washed away with n-hexane and the particles were washed with deionized water.
2.4. Characterization
All complex emulsion droplets were observed by an optical microscope (CX31, Olympus) and the process was taken as videos by using a stereomicroscope (SHUNYU SZM45) equipped with a CCD camera (Microview, MVC610DAC-GE110). The size of emulsion droplets was analyzed using MShot analysis system. The shapes of dried particles were examined by Hitachi S-4800 scanning electron microscopy (SEM), and the samples were coated with gold before measurement. The interfacial tensions were measured by an interfacial tension meter using the pendant drop method (Theta, Biolin Scientific AB, Sweden).
3. Results and discussion
3.1. Preparation of complex emulsion droplets
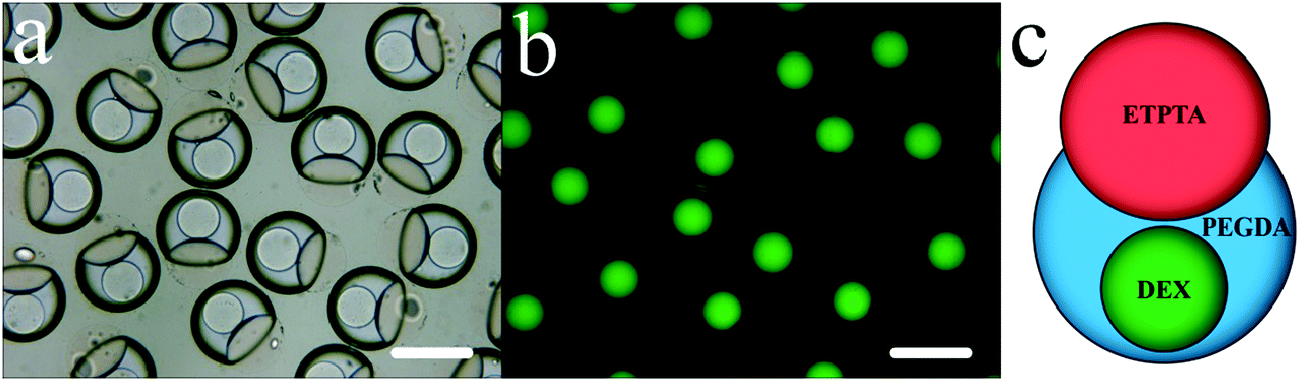
Typically, a mixed solution of 50 wt% ETPTA and 50 wt% PEGDA was used as the oil phase, 10 wt% DEX solution as the aqueous phase, and liquid paraffin (containing 2 wt% EM 90) as the continuous phase. The flow rates of both the aqueous phase and the oil phase were 75 μL h−1, and that of the continuous phase was 4 mL h−1. The complex Janus droplets with irregular structure are formed, composed of an oil droplet and an aqueous droplet (Fig. 2). Specifically, the oil droplet is partially engulfed by the aqueous droplet, while the aqueous droplet itself is a core/shell structure (Fig. 2a). To contrast, the portion with green fluorescence is the DEX-rich phase (Fig. 2b). On the whole it is a DEX/PEGDA–ETPTA core/shell-single phase Janus structure (Fig. 2c). The PTFE tube outlet was only 3 cm length without an extension. When the droplets just came out of the device, the aqueous droplets had phase separation, but not yet to form a core/shell structure (Video VS1 of the ESI†). Furthermore, the droplets were taken in a Petri dish for observation within 40 seconds (Video VS2 of the ESI†). The aqueous droplets became a core/shell structure and had no more changes. To ensure that the droplets reached a steady state, the observation time was selected to be 5 minutes.
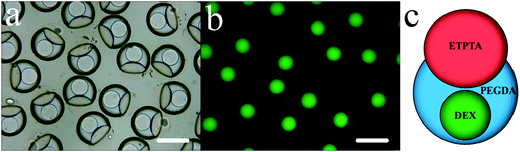 |
| | Fig. 2 (a) The optical microscopic image of complex emulsion droplets. (b) The fluorescence microscopy image of complex emulsion droplets. (c) The schematic model of the DEX/PEGDA–ETPTA complex Janus droplet. Scale bars represent 200 μm. | |
The PEGDA and DEX in the aqueous droplets are completely separated while reaching a certain concentration, and the phase diagram of PEGDA and DEX can be made by the cloud point method (Fig. S1, ESI†). The uniform ATPS droplets were prepared to study the relationship between volume ratios and mass fraction ratios of PEGDA and DEX after phase separation (Fig. S2, ESI†). The volume ratio VP/VD of the PEGDA-rich phase to the DEX-rich phase increases linearly with their mass fraction ratio ωP/ωD (Fig. S3, ESI†):
| | | VP/VD = 1.779(ωP/ωD) − 0.6888 | (1) |
where
VP is the volume of the PEGDA-rich phase,
VD is the volume of the DEX-rich phase,
ωP is the mass fraction of PEGDA, and
ωD is the mass fraction of DEX. Thus, the contents of the oil droplet and the aqueous droplet can be roughly speculated. For the calculation process, see Section 4, ESI.
† In the typical fabrication, the mass fraction (
ωP) of the PEGDA in the aqueous droplet is 0.2681, and the mass fraction (
ωD) of the DEX is 0.07319.
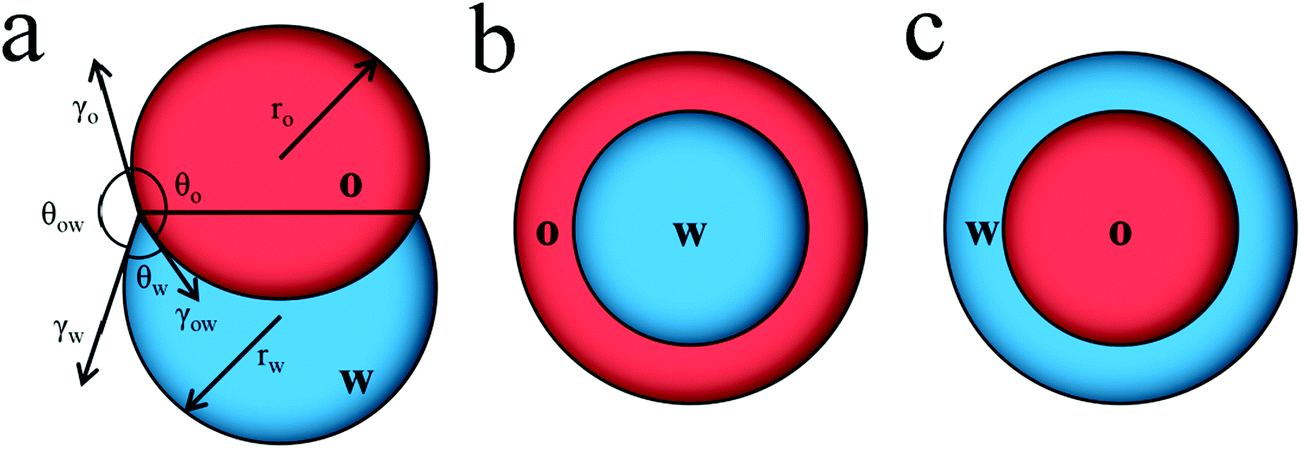
The morphology of this complex emulsion droplet is controlled by interfacial tension within the simple oil–water Janus droplet and the DEX–PEGDA phase separation in aqueous droplet. A Janus droplet (Fig. 3a) consists of an oil droplet (O) and an aqueous droplet (W) in the continuous phase, where rO is the radius of the oil droplet, and rW is the radius of the aqueous droplet. We define the interfacial tensions between oil phase and continuous phase, γO, aqueous phase and the continuous phase, γW, and oil phase and the aqueous phase, γOW. The droplet configuration are characterized by three contact angles, θO, between γO and γOW, θW, between γW and γOW, and θOW, between γO and γW. The bigger θOW is, the more one droplet engulfs another.36 When inequality 2 holds, the oil droplet completely engulfs the aqueous droplet (Fig. 3b). When inequality 3 holds, the aqueous droplet completely engulfs the oil droplet (Fig. 3c). When inequality 4 holds, the aqueous droplet and oil droplet are non-engulfing. In between, the oil droplet and aqueous droplet form a Janus structure (Fig. 3a).37
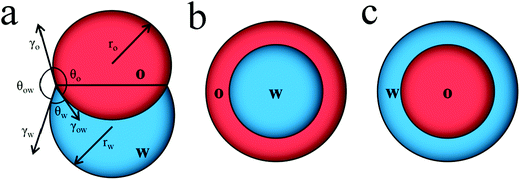 |
| | Fig. 3 Schematic diagram of droplets of different morphological structures composed of oil droplets and aqueous droplets: (a) Janus structure, (b) W/O core/shell structure, (c) O/W core/shell structure. | |
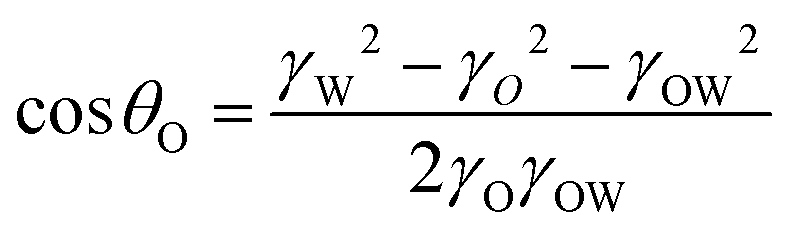
In the case of the Janus structure, the formulas of cos θO and cos θW are as follows.
| |  | (5) |
| |  | (6) |
Since the sum of θO, θW and θOW is 2π, the result of θOW is:
| | | θOW = 2π − θO − θW = 2π − arccosθO − arccosθw | (7) |
Especially for the DEX–PEGDA phase separation in the aqueous droplet, its mechanism is similar to the analysis of oil–water droplet. Suppose that γP is the interfacial tension between the PEGDA-rich phase and the continuous phase, γD is the interfacial tension between the DEX-rich phase and the continuous phase, and γPD is the interfacial tension between the PEGDA-rich phase and the DEX-rich phase. The degree of engulfment between the PEGDA-rich droplet and the DEX-rich droplet can be described by the angle θPD between γP and γD. Let P![[double bond, length as m-dash]](https://www.rsc.org/images/entities/char_e001.gif) O and DW, and replace inequalities 2–4 and eqn (5)–(7). As such the morphology of the aqueous droplet can be analyzed.
O and DW, and replace inequalities 2–4 and eqn (5)–(7). As such the morphology of the aqueous droplet can be analyzed.
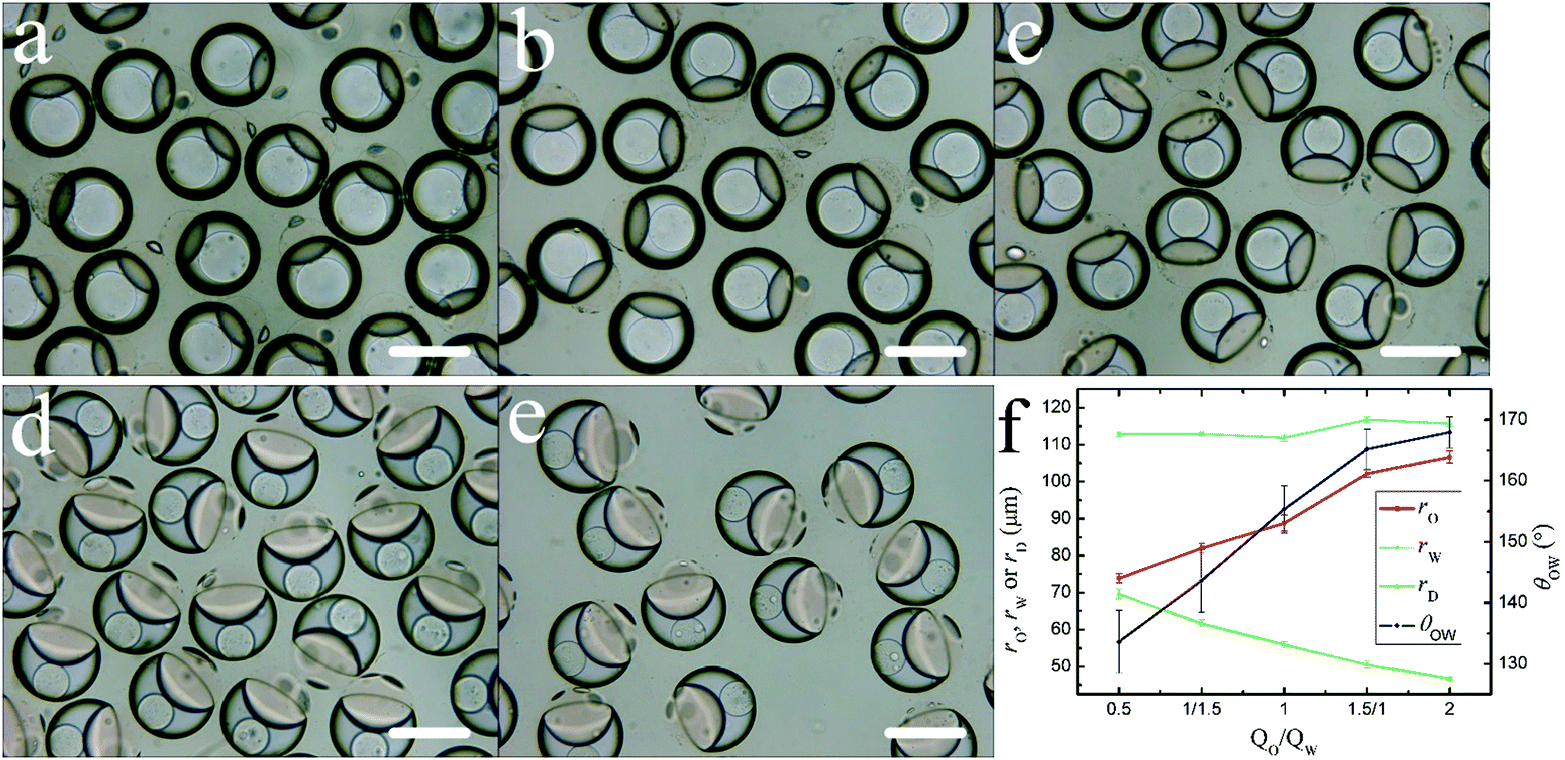
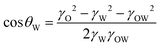
3.2. The effect of flow rate ratio
To study the effect of flow rate ratio on the change of droplet morphology, the total flow rate of dispersed phases was fixed to 150 μL h−1, and the flow ratios of oil phase to aqueous phase were: 1/2, 1/1.5, 1/1, 1.5/1 and 2/1. The morphology of droplets changes as shown in Fig. 4a–e. The flow rate of different fluids does alter the PEGDA content in oil droplets and water droplets, and subsequently affects the interfacial tensions, thus leading to the change of contact angles of emulsion system. The angle θOW increases and the extent to which the oil droplet is engulfed by the aqueous droplet increases (Fig. 4f). The size of droplets is subject to the ingredient content, the engulfment degree of oil–water droplet and the phase separation of PEGDA-DEX. The size of the oil droplet (radius rO) gradually becomes larger and the radius rD of the DEX core becomes smaller (Fig. 4f). In general, the radius rW remains roughly the same (Fig. 4f). This can be attributed to the increased engulfment of oil droplet, although the volume of the aqueous phase decreased (Section S4, ESI†).
 |
| | Fig. 4 (a)–(e) Optical microscopic images of droplets prepared at different flow rate ratios (QO/QW): (a) 1/2, (b) 1/1.5, (c) 1/1, (d) 1.5/1, (e) 2/1. (f) Plots of the relationship of rO, rW, rD, θOW of droplets and the flow rate ratios (QO/QW). Scale bars represent 200 μm. | |
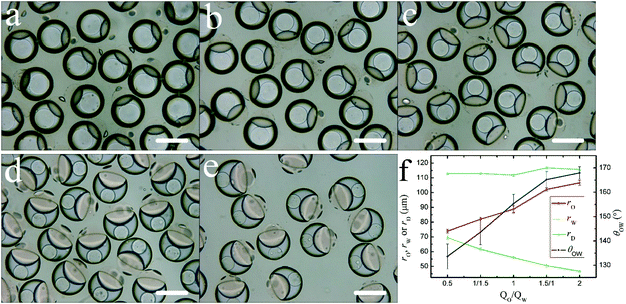
3.3. The effect of PEGDA content
To study the effect of PEGDA content in the oil phase on the change of droplet morphology, the PEGDA contents in the oil phase were set with 10 wt%, 30 wt%, 50 wt%, 70 wt%, 90 wt%, while keeping the other conditions unchanged. At 10 wt%, the oil droplet and the aqueous droplet fail to combine to form a Janus droplet (Fig. 5a). At 30 wt%, the oil droplet and the aqueous droplet are combined to form a Janus droplet (Fig. 5b). As the PEGDA content continues to increase, the oil droplet radius rO decreases and the aqueous droplet radius rW does not change substantially. θOW increases, and the extent of oil droplet engulfed by the aqueous droplet increases (Fig. 5g). The DEX core gradually becomes smaller and its rD value decreases (Fig. 5g), which is caused by an increase of PEGDA in the aqueous droplet. At 90 wt%, the oil droplet is completely engulfed by the aqueous droplet (Fig. 5e). The aqueous droplet is in a Janus structure with an angle θOW of about 170° (Fig. 5f).
 |
| | Fig. 5 (a)–(f) Optical microscopic images of droplets prepared with the oil phase containing different contents of PEGDA: (a) 10 wt%, (b) 30 wt%, (c) 50 wt%, (d) 70 wt%, (e) 90 wt%, (f) 90 wt% – enlarged. (g) Plots of the relationship between rO, rW, rD, θOW of droplets and the PEGDA contents. Scale bars represent 200 μm. | |
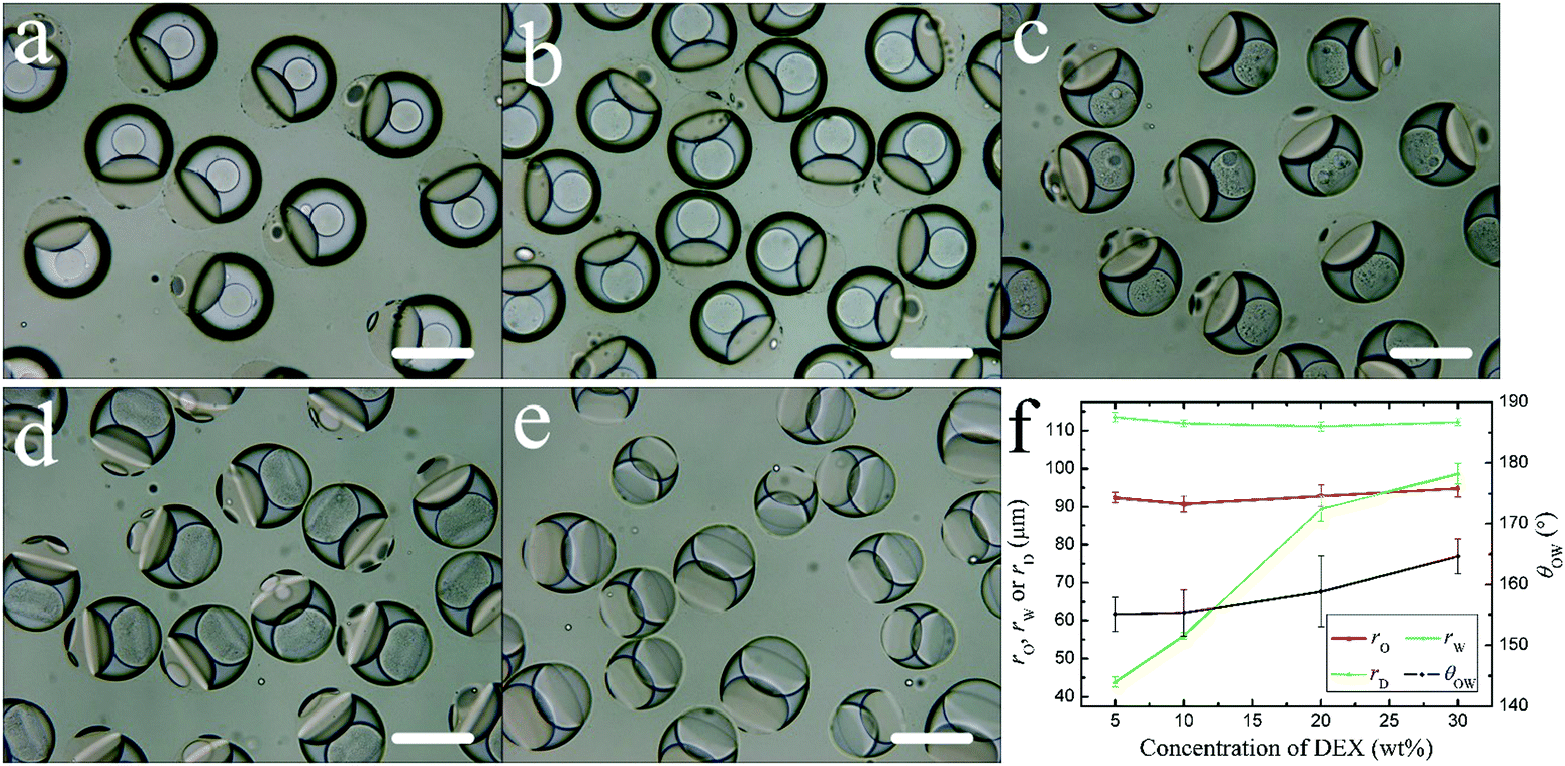
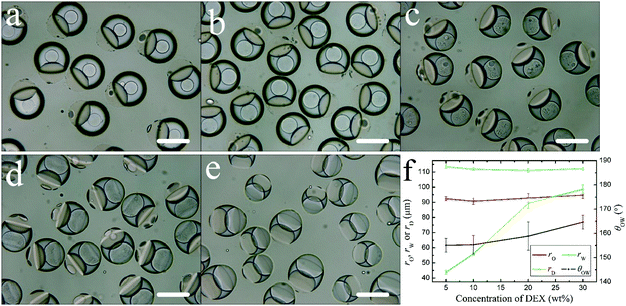
3.4. The effect of DEX content
To study the effect of DEX content in the aqueous phase on the change of droplet morphology, the contents of DEX in the aqueous phase were set with 5 wt%, 10 wt%, 20 wt%, 30 wt%, 40 wt%, while keeping the other conditions unchanged. At 40 wt%, the DEX aqueous solution is viscous and the droplets are not uniform (Fig. 6e). Under other conditions, as the DEX content in the aqueous phase increases, the oil droplet radius (rO) and the aqueous droplet radius (rW) do not change (Fig. 6f). θOW increases, and the extent of the oil droplet engulfed by the aqueous droplet increases (Fig. 6f). At 5 wt% and 10 wt%, the aqueous droplet is a core/shell structure. As the DEX content in the aqueous phase increases, the DEX core size (rD) increases (Fig. 6f). At 20 wt% and 30 wt%, complex emulsions of a DEX–PEGDA–ETPTA double Janus structure are formed (Fig. 6c and d). The PEGDA-rich droplet can no longer completely engulf the DEX-rich droplet and the morphology of the aqueous droplet changes to the Janus structure.
 |
| | Fig. 6 (a)–(e) Optical microscopic images of droplets prepared with the aqueous phase containing different contents of DEX: (a) 5 wt%, (b) 10 wt%, (c) 20 wt%, (d) 30 wt%, (e) 40 wt%. (f) Plots of the relationship between rO, rW, rD, θOW of droplets and the DEX contents. Scale bars represent 200 μm. | |
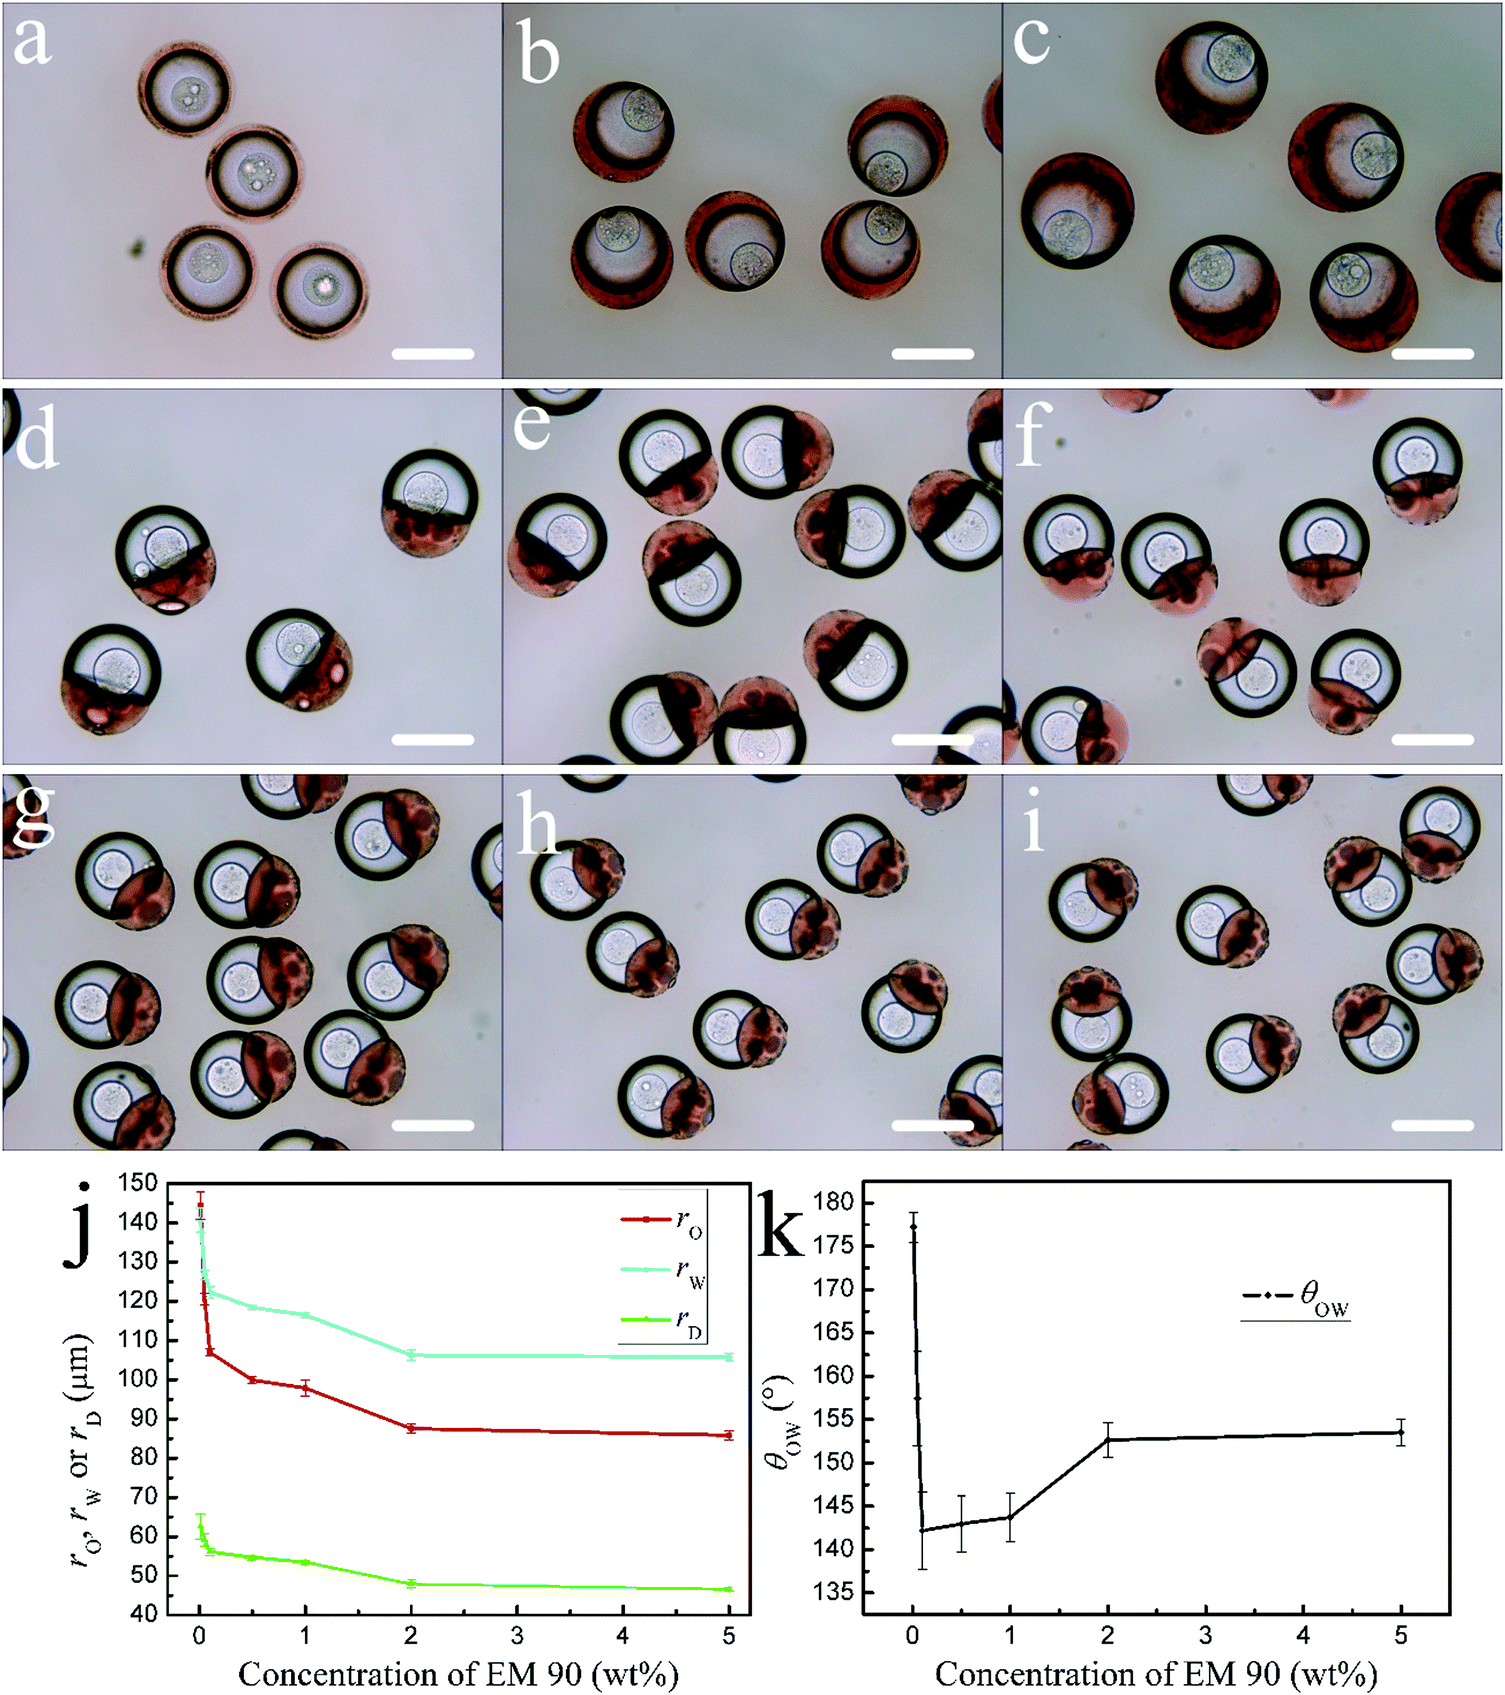
3.5. The effect of surfactant content
To study the effect of the surfactant content, the concentrations of EM 90 in the continuous phase varied from 0 to 5 wt% (Fig. 7). Without EM 90 (0 wt%), the oil droplet completely engulfs the aqueous droplet to form the DEX/PEGDA/ETPTA single core-double shell droplet (Fig. 7a). With EM 90 of 0.005 wt%, the droplet remains as DEX/PEGDA/ETPTA/liquid paraffin triple emulsion, but both the DEX-rich droplet and the PEGDA-rich droplet are eccentric (Fig. 7b). With EM 90 of 0.01 wt%, the droplets starts a DEX/PEGDA–ETPTA core/shell-single phase Janus structure (Fig. 7c). With EM 90 of 0.05 wt%, the degree of separation of aqueous droplet from oil droplet increases, and θOW decreases rapidly (Fig. 7k). With EM 90 of 0.1 wt%, the aqueous droplet engulfs the oil droplet, forming the complex droplet of a DEX/PEGDA–ETPTA core/shell-single phase Janus structure. With the increase of EM 90 from 0.1 wt% to 5 wt%, the morphology of the droplets is steady with the DEX/PEGDA–ETPTA core/shell-single phase Janus structure.
 |
| | Fig. 7 (a)–(i) Optical microscopic images of the droplets prepared with liquid paraffin containing different contents of EM 90: (a) 0 wt%, (b) 0.005 wt%, (c) 0.01 wt%, (d) 0.05 wt%, (e) 0.1 wt%, (f) 0.5 wt%, (g) 1 wt%, (h) 2 wt%, (i) 5 wt%. (j) Plots of the relationship between rO, rW and rD of droplets and the concentrations of EM 90. (k) Relationship between θOW of droplets and the concentrations of EM 90. Scale bars represent 200 μm. | |
For the EM 90 of 0.01 wt% to 0.1 wt%, rO, rW and rD decrease rapidly and subsequently stabilizes gradually (Fig. 7j). However, the extent to which the aqueous droplet engulfs the oil droplet increases with the θOW increase (Fig. 7k). This may be attributed to the interfacial tension changes. The interfacial tension decreases rapidly when the surfactant content initially increases and subsequently remains unchanged.38,39
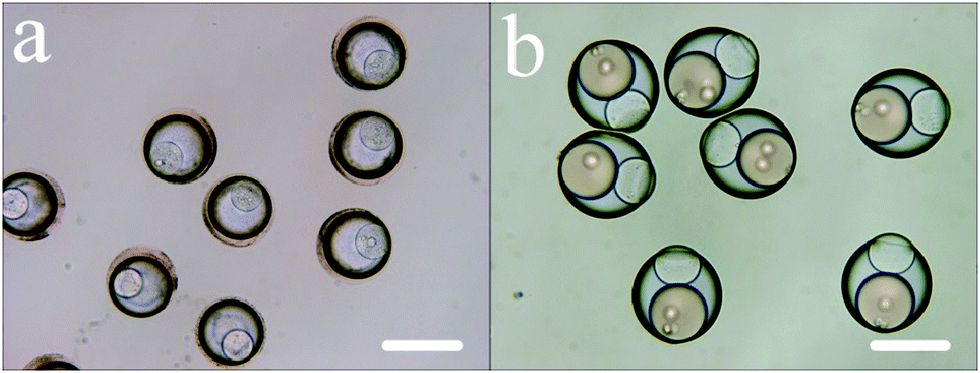
3.6. The effect of surfactant type
To study the effect of different surfactant types on the droplet morphology, Span 80 or PGPR was used as the surfactant instead of EM 90, and their content in the continuous phase was 2 wt%, and other conditions were unchanged. When PGPR is used, the oil droplet completely engulfs the aqueous droplet, forming a DEX/PEGDA/ETPTA single core-double shell droplet (Fig. 8a). When Span 80 is used, the aqueous droplet completely engulf the oil droplet while the PEGDA-rich droplet cannot completely engulf the DEX-rich droplet, forming the ETPTA/PEGDA-DEX core/shell-single phase Janus droplet (Fig. 8b). Above all, the droplet morphology can be tuned by changing the surfactant.
 |
| | Fig. 8 The optical microscopic images. (a) the droplets prepared with liquid paraffin containing PGPR. (b) the droplets prepared with liquid paraffin containing Span 80. Scale bars represent 200 μm. | |
3.7. Mechanism analysis of morphology based on interfacial tensions
The morphology of complex emulsion droplets is controlled by interfacial tensions which vary with the component compositions, contents and surfactants significantly. The interfacial tensions between the different solutions are measured by the pendant drop method (Table S1, ESI†). Take the complex Janus droplets as an example, the continuous phase is liquid paraffin containing 2 wt% EM 90. The solution of EPTTA (50 wt%) and PEGDA (50 wt%) was mixed with the DEX (10 wt%) aqueous solution. The interfacial tension between the PEGDA-rich phase (P-R) and the DEX-rich phase (D-R) is too small to be measured, and the range is between 0.0001 and 0.1 mN m−1.27,40 The interfacial tension (γP/C) between the PEGDA with the continuous phase (C) decreases and the interfacial tension (γE/C) between the ETPTA and the continuous phase increases while the PEGDA content increases. Besides, the interfacial tension (γD/C) between the DEX aqueous solution and the continuous phase decreases with the increasing DEX content. The interfacial tension (γE-R/P-R) between the EPTTA-rich phase solution and the PEGDA-rich phase solution decreases while the initial PEGDA content increases (Fig. S5, ESI† Section 5).
The morphology of the complex emulsion droplets can be analyzed by oil–water droplet and DEX–PEGDA aqueous droplet (Table 1). As γO, γW and γOW are not satisfied with the any inequalities 2, 3 and 4, the oil–water droplet is the Janus structure (Fig. 2a). In addition, we get θOW = 167° (eqn (7)), close to the measured value θOW = 155°. As γD > γP + γDP, the PEGDA-rich droplet engulfs the DEX-rich droplet to form a core/shell droplet, consistent with the experimental results (Fig. 2a). It is worth noting that: γD-R/E-R = 2.77 mN m−1, γP-R/D-R < 0.1 mN m−1, γE-R/P-R = 0.65 mN m−1 (Tabel S1, ESI† Section 5), γD-R/E-R > γP-R/D-R + γE-R/P-R. Therefore, no engulfing occurs between ETPTA-rich droplet and DEX-rich droplet, which is consistent with experimental results.
Table 1 The interfacial tensions of the complex emulsions prepared with liquid paraffin containing 2 wt% EM 90
|
|
Oil–water droplet |
Aqueous droplet |
|
γ
O
|
γ
W
|
γ
OW
|
γ
P
|
γ
D
|
γ
DP
|
| Equal to |
γ
E-R/C
|
γ
P-R/C
|
γ
E-R/P-R
|
γ
P-R/C
|
γ
D-R/C
|
γ
P-R/D-R
|
| Value |
2.65 mN m−1 |
2.9 mN m−1 |
0.65 mN m−1 |
2.9 mN m−1 |
3.36 mN m−1 |
Less than 0.1 mN m−1 |
| Relation |
Out of the inequalities hold |
γ
D > γP + γDP |
When the surfactant PGPR is used as the continuous phase, the interfacial tensions change remarkably: γE-R/C = 4.54 mN m−1, γP-R/C = 7.71 mN m−1, γD-R/C = 7.73 mN m−1 (Table 2). As γO, γW and γOW match the inequality 2, the oil droplet completely engulfs the aqueous droplet to form a core/shell structure, consistent with the experimental results (Fig. 8a). As γD > γP + γDP, the PEGDA-rich droplet completely engulfs the DEX-rich phase, forming a core/shell droplet (Fig. 8a).
Table 2 The interfacial tensions of the complex emulsions prepared with liquid paraffin containing 2 wt% PGPR
|
|
Oil–water droplet |
Aqueous droplet |
|
γ
O
|
γ
W
|
γ
OW
|
γ
P
|
γ
D
|
γ
DP
|
| Value |
4.54 mN m−1 |
7.71 mN m−1 |
0.65 mN m−1 |
7.71 mN m−1 |
7.73 mN m−1 |
Less than 0.1 mN m−1 |
| Relation |
γ
W > γO + γOW |
γ
D > γP + γDP |
3.8. Preparation of complex particles
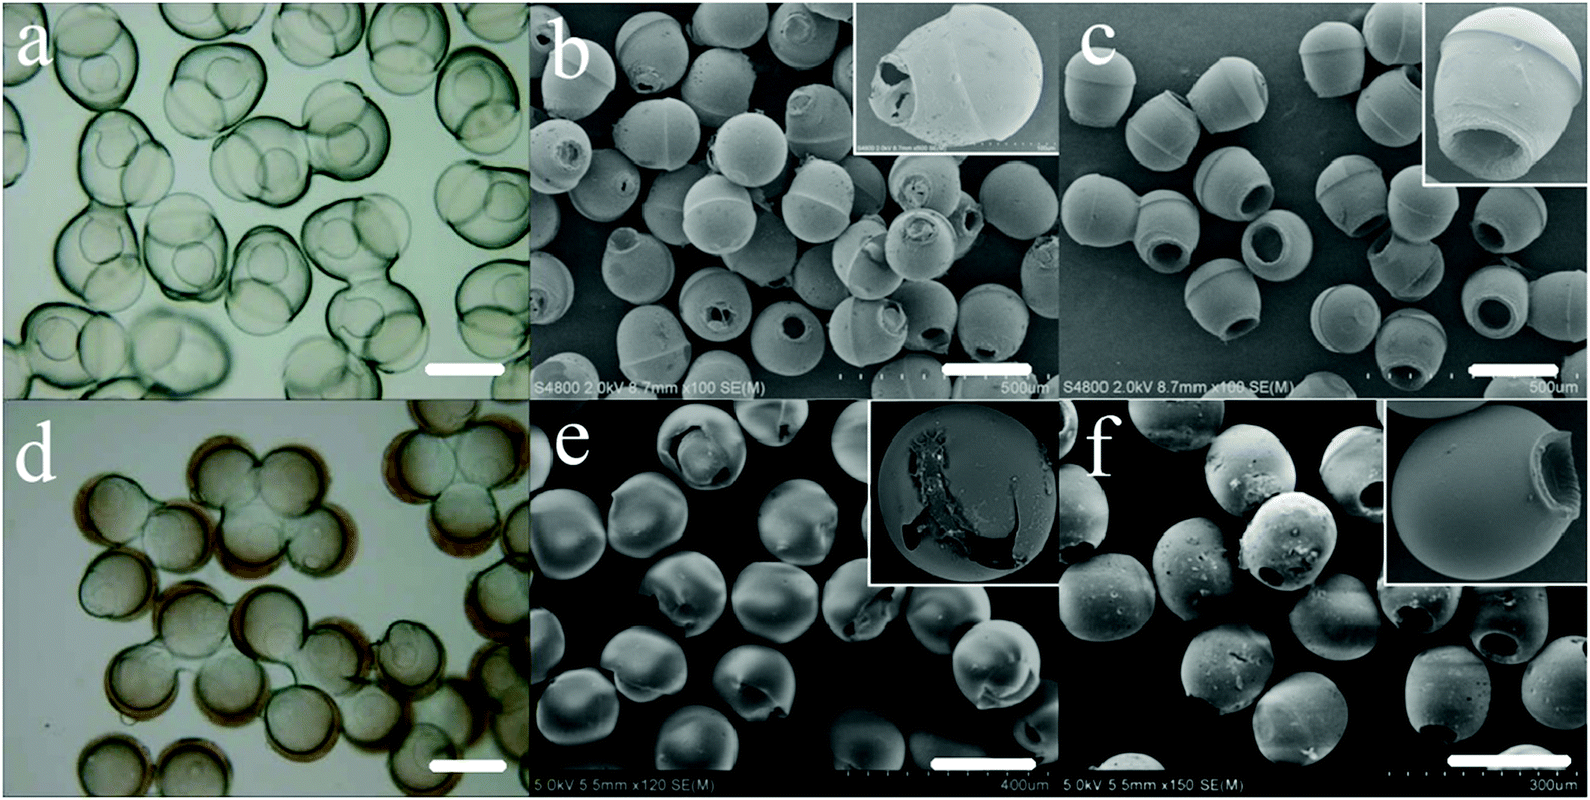
PEGDA monomer and ETPTA monomer could be separately solidified into PEGDA and PETPTA by ultraviolet light irradiation. The complex particles of various shapes were prepared from the complex emulsion droplets. After the droplets of core/shell-single phase Janus (Fig. 2a) are solidified, the PETPTA-PEGDA Janus particles with a hole in the PEGDA portion are obtained (Fig. 9a and b). Since the PEGDA hydrogel shrinks during solidification, the DEX-rich phase solution is extruded and forms the hole (Fig. 9a). The PETPTA-PEGDA Janus particles with a bigger hole (Fig. 9c) are prepared from the double Janus droplets (Fig. 6c). Similarly, spherical particles (Fig. 9d and e) can be prepared by solidifying the droplets of single core-double shell (Fig. 8a). However, due to the extrusion of the DEX-rich phase solution (Fig. 9d), the PETPTA shell ruptures and fails to form a complete sphere (Fig. 9e). In addition, the ellipsoidal particles (Fig. 9f) are obtained by solidifying the complex emulsion droplets (Fig. 8b). In conclusion, complex particles can be obtained from complex emulsion droplets by the UV-treatment.
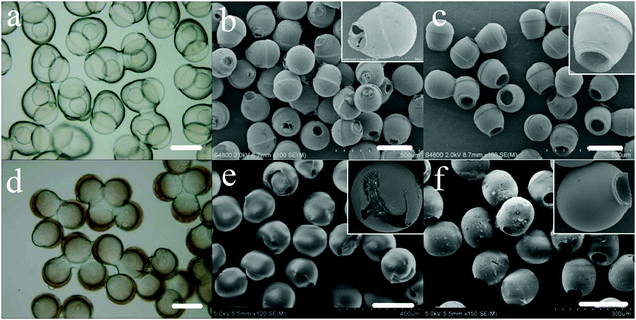 |
| | Fig. 9 (a) The optical image of the droplets core/shell-single phase Janus, (b) the SEM image obtained by treating the droplets of (a). (c) The SEM image of particles obtained by treating double Janus droplets, (d) the optical image of the droplets of single core-double shell, (e) the SEM image obtained by treating the droplets of (d), (f) the SEM image obtained by solidifying the complex emulsion droplets. The insets are scaled-up twice. Scale bars represent 200 μm. | |
4. Conclusions
A new preparation of complex emulsions is reported based on internal mass transfer of droplet and phase separation of aqueous two-phase system (ATPS). The oil–water droplets are prepared by a simple coaxial theta capillary microfluidic device. The PEGDA in the oil droplets enters the aqueous droplets, and the phase separation of PEGDA and DEX occurs in the aqueous droplets, thus forming emulsion droplets of complex morphology.
The morphology can be precisely controlled by adjusting the flow rate ratio of the oil phase to the aqueous phase, the contents of initial PEGDA, DEX and surfactant, and the type of surfactants. The complex emulsion droplet is transformed from the DEX/PEGDA–ETPTA core/shell-single phase Janus structure to the DEX–PEGDA–ETPTA double Janus structure. The preparation of complex emulsions with several morphologies is simple and effective, beneficial to the design and optimization of the complex shapes. The method based on mass transfer and phase separation can be extended to produce complex emulsions of various systems. Furthermore, complex particles of various shapes can be obtained from the emulsion droplets by UV-treatment. These complex emulsions have potential applications in life sciences, functional materials and drug delivery.
Conflicts of interest
There are no conflicts to declare.
Acknowledgements
We are grateful for financial support from the National Natural Science Foundation of China (No. 21476114), Natural Science Key Project of the Jiangsu Higher Education Institutions (No. 12KJA530002), and Priority Academic Program Development of Jiangsu Higher Education Institutions. It is also supported by the State Key Laboratory of Materials-Oriented Chemical Engineering (KL17-04), THYME project (Research England) and EPSRC (EP/S025537/1).
References
- C. H. Choi, J. Kim, J. O. Nam, S. M. Kang, S. G. Jeong and C. S. Lee, ChemPhysChem, 2014, 15, 21–29 CrossRef CAS PubMed.
- G. T. Vladisavljević, Particuology, 2016, 24, 1–17 CrossRef.
- R. R. Raju, F. Liebig, A. Hess, H. Schlaad and J. Koetz, RSC Adv., 2019, 9, 19271–19277 RSC.
- R. R. Raju, F. Liebig, B. Klemke and J. Koetz, RSC Adv., 2020, 10, 7492–7499 RSC.
- G. Muschiolik, Curr. Opin. Colloid Interface Sci., 2007, 12, 213–220 CrossRef CAS.
- Z. Barikbin, M. T. Rahman, P. Parthiban, A. S. Rane, V. Jain, S. Duraiswamy, S. H. S. Lee and S. A. Khan, Lab Chip, 2010, 10, 2458–2463 RSC.
- Q. F. Zhang, S. Savagatrup, P. Kaplonek, P. H. Seeberger and T. M. Swagert, ACS Cent. Sci., 2017, 3, 309–313 CrossRef CAS PubMed.
- M. Nakano, Adv. Drug Delivery Rev., 2000, 45, 1–4 CrossRef CAS PubMed.
- Q. Wu, C. Y. Yang, J. X. Yang, F. S. Huang, G. L. Liu, Z. Q. Zhu, T. Si and R. X. Xu, Appl. Phys. Lett., 2018, 112, 4 Search PubMed.
- L. L. Ge, J. R. Cheng, D. Wei, Y. Sun and R. Guo, Langmuir, 2018, 34, 7386–7395 CrossRef CAS PubMed.
- A. S. Cunha, J. L. Grossiord, F. Puisieux and M. Seiller, J. Microencapsulation, 1997, 14, 311–319 CrossRef CAS PubMed.
- T.-H. Lin and S.-Y. Lin, J. Chin. Chem. Soc., 1988, 35, 463–470 CrossRef CAS.
- H. Hasinovic, S. E. Friberg and G. Rong, J. Colloid Interface Sci., 2011, 354, 424–426 CrossRef CAS PubMed.
- L. L. Ge, S. H. Lu and R. Guo, J. Colloid Interface Sci., 2014, 423, 108–112 CrossRef CAS PubMed.
- R. K. Shah, H. C. Shum, A. C. Rowat, D. Lee, J. J. Agresti, A. S. Utada, L. Y. Chu, J. W. Kim, A. Fernandez-Nieves, C. J. Martinez and D. A. Weitz, Mater. Today, 2008, 11, 18–27 CrossRef CAS.
- X.-h. Ge, Y.-h. Geng, Q.-c. Zhang, M. Shao, J. Chen, G.-s. Luo and J.-h. Xu, Sci. Rep., 2017, 7, 42738 CrossRef CAS PubMed.
- M. F. Haase and J. Brujic, Angew. Chem., Int. Ed., 2014, 53, 11793–11797 CrossRef CAS PubMed.
- P. Guo, C. F. Zeng, C. Q. Wang and L. X. Zhang, AIChE J., 2017, 63, 4115–4123 CrossRef CAS.
- A. S. Utada, E. Lorenceau, D. R. Link, P. D. Kaplan, H. A. Stone and D. A. Weitz, Science, 2005, 308, 537–541 CrossRef CAS PubMed.
- A. R. Abate and D. A. Weitz, Small, 2009, 5, 2030–2032 CrossRef CAS PubMed.
- X. H. Ge, J. P. Huang, J. H. Xu, J. Chen and G. S. Luo, Soft Matter, 2016, 12, 3425–3430 RSC.
- L. D. Zarzar, V. Sresht, E. M. Sletten, J. A. Kalow, D. Blankschtein and T. M. Swager, Nature, 2015, 518, 520–524 CrossRef CAS PubMed.
- S. Lone, J. I. Ahn, M. R. Kim, H. M. Lee, S. H. Kim, T. P. Lodge and I. W. Cheong, Langmuir, 2014, 30, 9577–9583 CrossRef CAS PubMed.
- Q. Q. Zhang, M. Xu, X. J. Liu, W. F. Zhao, C. H. Zong, Y. Yu, Q. Wang and H. W. Gai, Chem. Commun., 2016, 52, 5015–5018 RSC.
- C. Cui, C. F. Zeng, C. Q. Wang and L. X. Zhang, Langmuir, 2017, 33, 12670–12680 CrossRef CAS PubMed.
- C. H. Choi, D. A. Weitz and C. S. Lee, Adv. Mater., 2013, 25, 2536–2541 CrossRef CAS PubMed.
- A. G. Teixeira, R. Agarwal, K. R. Ko, J. Grant-Burt, B. M. Leung and J. P. Frampton, Adv. Healthcare Mater., 2018, 7, 19 Search PubMed.
- M. Yasukawa, E. Kamio and T. Ono, ChemPhysChem, 2011, 12, 263–266 CrossRef CAS PubMed.
- S. Mytnyk, I. Ziemecka, A. G. L. Olive, J. W. M. van der Meer, K. A. Totlani, S. Oldenhof, M. T. Kreutzer, V. van Steijn and J. H. van Esch, RSC Adv., 2017, 7, 11331–11337 RSC.
- S. H. Ma, J. Thiele, X. Liu, Y. P. Bai, C. Abell and W. T. S. Huck, Small, 2012, 8, 2356–2360 CrossRef CAS PubMed.
- T. Y. Lee, T. M. Choi, T. S. Shim, R. A. M. Frijns and S. H. Kim, Lab Chip, 2016, 16, 3415–3440 RSC.
- J. N. Lee, C. Park and G. M. Whitesides, Anal. Chem., 2003, 75, 6544–6554 CrossRef CAS PubMed.
- S. Liang, J. Li, J. Man and H. Chen, Langmuir, 2016, 32, 7882–7887 CrossRef CAS PubMed.
- J. Man, S. Chien, S. Liang, J. Li and H. Chen, ChemPhysChem, 2018, 19, 1995–1998 CrossRef CAS PubMed.
- C. X. Zhao and A. P. J. Middelberg, Angew. Chem., Int. Ed., 2009, 48, 7208–7211 CrossRef CAS PubMed.
- M. Y. Zhang, H. Zhao, J. H. Xu and G. S. Luo, RSC Adv., 2015, 5, 32768–32774 RSC.
- J. Guzowski, P. M. Korczyk, S. Jakiela and P. Garstecki, Soft Matter, 2012, 8, 7269–7278 RSC.
- J. H. Xu, P. F. Dong, H. Zhao, C. P. Tostado and G. S. Luo, Langmuir, 2012, 28, 9250–9258 CrossRef CAS PubMed.
- Y. Chen, J. H. Xu and G. S. Luo, Chem. Eng. Sci., 2015, 138, 655–662 CrossRef CAS.
- J. A. Asenjo and B. A. Andrews, J. Chromatogr. A, 2011, 1218, 8826–8835 CrossRef CAS PubMed.
Footnote |
| † Electronic supplementary information (ESI) available. See DOI: 10.1039/d0sm00862a |
|
| This journal is © The Royal Society of Chemistry 2020 |
Click here to see how this site uses Cookies. View our privacy policy here. 
 Open Access Article
 This Open Access Article is licensed under a
  a,
Xuebin
Ke
a,
Xuebin
Ke