 Open Access Article
Creative Commons Attribution 3.0 Unported Licence
Droplet impacts onto soft solids entrap more air†
Kenneth R.
Langley
 *a,
Alfonso A.
Castrejón-Pita
 b and
Sigurdur T.
Thoroddsen
 a
a
aDivision of Physical Science and Engineering, King Abdullah University of Science and Technology (KAUST), Thuwal, 23955-6900, Saudi Arabia. E-mail: kenneth.langley@kaust.edu.sa
bDepartment of Engineering Science, University of Oxford, Oxford OX1 3PS, UK
First published on 8th June 2020
Abstract
We investigate the effects of surface stiffness on the air cushioning at the bottom of a liquid drop impacting onto a soft solid and the resulting entrapment of a central bubble. This was achieved using ultra-high-speed interferometry at 5 million frames per second and spatial resolution of 1.05 μm per pixel. The soft solid delays the effects of gas compressibility resulting in much larger air discs than corresponding impacts onto rigid surfaces. Using an effective impact velocity equal to half of the actual impact velocity brings the soft solid scaling behavior better in line with rigid substrate scaling. We also observe extended gliding of the drop as it initially avoids contact with the surface spreading over a thin layer of air and investigate the threshold velocity for the transition from gliding to ring contact. Such extended gliding layers have previously been seen for high-viscosity drop impacts, but not for low-viscosity liquids at the impact velocities used herein.
1 Introduction
Droplet impacts are important in a variety of natural and industrial processes, from aircraft icing and inkjet printing, to spray cooling and beyond.1 The physics of the impact at various stages of the impact can enhance or inhibit the desired outcome. For example, in inkjet printing, splashing and satellite formation are undesirable because the print quality will decrease. On the other hand, in atomization applications, splashing and the formation of tiny satellites is desired.In the earliest stages of the impact event, a small, central air bubble is entrapped as first noted by Chandra and Avedisian.2 Over the last several decades many have studied this phenomenon to better understand the various parameters that affect the size and number of bubbles entrapped. As the drop approaches the impact surface, the pressure within the intervening air layer rises due to the viscous drainage of the gas and becomes sufficient to deform the bottom of the drop.3 The dimple that is formed causes the drop to initially make contact around a ring at a radius of L0 entrapping a disc of air that contracts into the central bubble seen by Chandra and Avedisian. Hicks and Purvis4,5 predict L0 independent of gas compressibility as
 | (1) |
![[small script l]](https://www.rsc.org/images/entities/char_e146.gif) is the liquid density, V is the impact velocity, and μg is the gas dynamic viscosity.
is the liquid density, V is the impact velocity, and μg is the gas dynamic viscosity.
At low impact velocities, surface tension and inertial forces compete leading to maximal air entrapment in the transition from surface tension dominated to inertially dominated impacts.6 Beyond this maximum, the height of the air disc, H, scales with the Stokes number, St = μg/ρ![[small script l]](https://www.rsc.org/images/entities/char_e146.gif) RV, to the 1/2 power as proposed by Klaseboer et al.7 or to the 2/3 power as proposed by Mandre, Mani and Brenner.3 The difference between the two competing theories arises due to the different approaches, governing equations, and assumptions used by each group. Klaseboer et al.7 model the pressure inside the drop using the stagnation pressure while Mandre et al.3,8 assume a velocity potential at the bottom of the drop.
RV, to the 1/2 power as proposed by Klaseboer et al.7 or to the 2/3 power as proposed by Mandre, Mani and Brenner.3 The difference between the two competing theories arises due to the different approaches, governing equations, and assumptions used by each group. Klaseboer et al.7 model the pressure inside the drop using the stagnation pressure while Mandre et al.3,8 assume a velocity potential at the bottom of the drop.
As the impact velocity increases, the gas compressibility becomes important. Mandre et al.3,8 introduced the compressibility parameter, ε = P0/(ρ![[small script l]](https://www.rsc.org/images/entities/char_e146.gif) 4V7R/μg)1/3, which is a ratio of the ambient pressure, P0, to the pressure build-up due to viscous drainage. For values of ε ≪ 1, gas compressibility should be taken into account. The centerline height of the air disc when the dimple begins to form, H*, is then predicted as
4V7R/μg)1/3, which is a ratio of the ambient pressure, P0, to the pressure build-up due to viscous drainage. For values of ε ≪ 1, gas compressibility should be taken into account. The centerline height of the air disc when the dimple begins to form, H*, is then predicted as
 | (2) |
Li and Thoroddsen9 using time-resolved interferometery with only 200 ns between frames observed the formation of the dimple in the drop and the rapid expansion after the initial ring contact. They provided empirical corrections to the adiabatic compression theory of Mandre et al. for H* shown in eqn (2). For their highest impact velocities, they observed compression ratios as high as 14 when comparing the final volume of the central bubble to the initial volume of the air disc.
The behavior of the drop and resulting air cushioning can be altered by changing the gas parameters. If the ambient gas pressure is reduced, drop splashing can be suppressed.10 Further, the drop can make double contact with the substrate when the pressure is reduced to 3–10% of atmospheric pressure resulting in the entrapment of both a disc of air and a torus of air that breaks up into a ring of microbubbles, and the radial extent of the air disc can be significantly smaller than predicted values.11 Burzynski and Bansmer12 found that increasing the gas density resulted in a larger than predicted radius of the air disc.
As the viscosity of the liquid increases, the central air disc decreases in height and scales with the liquid Reynolds number, Re![[small script l]](https://www.rsc.org/images/entities/char_e146.gif) = ρ
= ρ![[small script l]](https://www.rsc.org/images/entities/char_e146.gif) RV/μ
RV/μ![[small script l]](https://www.rsc.org/images/entities/char_e146.gif) , where μ
, where μ![[small script l]](https://www.rsc.org/images/entities/char_e146.gif) is the liquid dynamic viscosity. Additionally, for high viscosity liquids, the central dimple freezes and the drop begins to spread or ‘glide’ over a thin layer of air ∼100 nm thick instead of immediately making contact with the substrate.13 A similar behavior was observed for low viscosity liquids at low impact velocities revealing much thinner and short-lived films of air during the initial spreading of the drop.14,15 For very low velocity impacts, V < 0.4 m s−1 for water drops, it is possible for drops to avoid contact with the surface altogether resulting in rebounding even from hydrophilic surfaces.16,17
is the liquid dynamic viscosity. Additionally, for high viscosity liquids, the central dimple freezes and the drop begins to spread or ‘glide’ over a thin layer of air ∼100 nm thick instead of immediately making contact with the substrate.13 A similar behavior was observed for low viscosity liquids at low impact velocities revealing much thinner and short-lived films of air during the initial spreading of the drop.14,15 For very low velocity impacts, V < 0.4 m s−1 for water drops, it is possible for drops to avoid contact with the surface altogether resulting in rebounding even from hydrophilic surfaces.16,17
The properties of the impact surface can also affect the size and number of microbubbles formed. Li, Vakarelski and Thoroddsen18 found that with a surface roughness of only 2 nm RMS a faint ring of microbubbles was entrapped marking the location of the initial contact. Langley et al.19 found that by increasing the roughness to between 70 and 130 nm RMS a significant band of microbubbles was formed and the radius of the central air disc was decreased in comparison to a smooth surface.
For drop impacts onto soft solids, Howland et al.20 found that the soft surfaces can suppress splashing even at high impact velocities. In their study, they noted that in the initial stages of the impact, there were only minor energy losses of a few percent, but at later stages the lamellae was ejected from the surface at slower velocities on the softer surfaces, resulting in the delay of the splashing threshold. Further, they found that the maximum spreading diameter of the drop appears unchanged for impacts onto soft solids compared with impacts onto rigid solids.
Herein, we study the earliest stages of water and ethanol droplets impacting onto soft silicone surfaces using ultra-high-speed interferometry. Our focus is on the formation of a dimple in the droplet, the size of the entrapped air bubble, the dynamics of contact and the subsequent wetting of the substrate.
2 Experimental methods
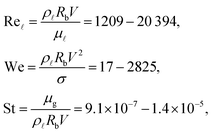
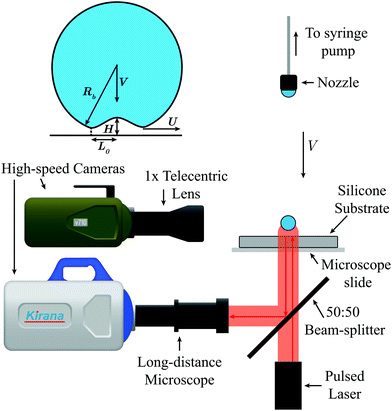
Fig. 1 shows a schematic of the experimental setup. The drop was formed quasistatically on an adjustable height nozzle fed by a syringe pump. In this study, we use both deionized water and ethanol as droplet liquids. The drop pinches off from the nozzle under the force of gravity and accelerates to the impact velocity, V. Silicone surfaces were manufactured in-house and then placed underneath the drop on top of a microscope slide. The impact was viewed from the side with a Phantom v710 high-speed camera using a 1× tele-centric lens at a frame rate of 13![[thin space (1/6-em)]](https://www.rsc.org/images/entities/char_2009.gif) 000 frames per second (fps). The side view images were used to measure the bottom radius of curvature of the drop, Rb, and the impact velocity V which ranged between 0.7 and 4.5 m s−1. The Reynolds, Weber and Stokes numbers can be used to describe the impacts and span the below ranges:
000 frames per second (fps). The side view images were used to measure the bottom radius of curvature of the drop, Rb, and the impact velocity V which ranged between 0.7 and 4.5 m s−1. The Reynolds, Weber and Stokes numbers can be used to describe the impacts and span the below ranges:where σ is the surface tension coefficient. Note that the Stokes number is the inverse of the traditionally defined Stokes number as has been common in recent drop impact studies. Rb is used in the scaling parameters instead of the spherical equivalent radius of the drop to account for oscillations of the large drops and to better match with the theoretical predictions as done in other studies.4,9,21
2.1 Interferometry
Impacts are also viewed from the bottom through a 50![[thin space (1/6-em)]](https://www.rsc.org/images/entities/char_2009.gif) :
:![[thin space (1/6-em)]](https://www.rsc.org/images/entities/char_2009.gif) 50 beam-splitter using the Kirana ultra-high-speed video camera (Specialised Imaging, Pitstone, UK) at frame rates up to 5 million fps with a resolution of 924 × 768 pixels for 180 frames at all frame rates. The Kirana was equipped with a long-distance microscope (Leica Z16 APO) with adjustable magnification up to 29.4× resulting in a spatial resolution of 1.05 μm per pixel. Illumination is provided by red pulsed laser-diodes (SILUX-640, Specialised Imaging), which provides one adjustable length pulse (10–150 ns) per image with a wavelength of λ = 640 nm. This is a low-coherence laser diode with coherence length ≪1 mm, which eliminates interference from various nearby interfaces such as the microscope slide. In practice, we can resolve a maximum film thickness of ∼20–30 μm.
50 beam-splitter using the Kirana ultra-high-speed video camera (Specialised Imaging, Pitstone, UK) at frame rates up to 5 million fps with a resolution of 924 × 768 pixels for 180 frames at all frame rates. The Kirana was equipped with a long-distance microscope (Leica Z16 APO) with adjustable magnification up to 29.4× resulting in a spatial resolution of 1.05 μm per pixel. Illumination is provided by red pulsed laser-diodes (SILUX-640, Specialised Imaging), which provides one adjustable length pulse (10–150 ns) per image with a wavelength of λ = 640 nm. This is a low-coherence laser diode with coherence length ≪1 mm, which eliminates interference from various nearby interfaces such as the microscope slide. In practice, we can resolve a maximum film thickness of ∼20–30 μm.
When the drop gets sufficiently close to the impact surface (∼20–30 μm), interference fringes appear in the bottom view images. In this case we are using reflective interferometry, which means we see interference between the light reflected from the impact surface and that reflected from the drop surface. When the light is incident normal to the air layer, the reflected intensity of the light is proportional to the square of the sine of the air layer thickness divided by half the wavelength of the light,
 | (3) |
In a few cases, we also employ a transmission interferometry scheme, similar to our previous studies,9,11,19,25 where the laser is positioned near the nozzle. The light then shines vertically downward, focusing through the drop and reflecting off of a 45° mirror to the camera. The main difference when analyzing these results is that the fringes are inverted as compared with the reflective interferometry images; therefore, the zero thickness fringe appears bright instead of dark revealing more details where the droplet makes contact with the surface.
2.2 Surface preparation
Silicone surfaces were prepared from pure components following the method of Style et al.26 The surfaces were made by mixing together two chemical components (A and B) in different ratios to adjust the stiffness. Part A consisted of a silicone base, vinyl-terminated polydimethylsiloxane (DMS-V31, Gelest Inc.), and 0.05% by weight of a catalyst, platinum–divinyltetramethyldisiloxane complex in xylene (SIP6831.2, Gelest Inc.). Part B consisted of the same silicone base as Part A, but mixed with 10% by weight of a crosslinker, trimethylsiloxane terminated (25–35% methylhydrosiloxane)–dimethylsiloxane copolymer (HMS-301, Gelest Inc.). After mixing together parts A and B, the mixture was degassed in a vacuum chamber and left to cure at room temperature overnight. The stiffness, Young's modulus E, of the surface was measured using indentation,27 and the values are given in Table 1. Prior work has shown these surfaces to be essentially incompressible with a Poisson's ratio of 0.5.28,29| Surface | Stiffness, E |
|---|---|
Silicone 2![[thin space (1/6-em)]](https://www.rsc.org/images/entities/char_2009.gif) : :![[thin space (1/6-em)]](https://www.rsc.org/images/entities/char_2009.gif) 1 (A 1 (A![[thin space (1/6-em)]](https://www.rsc.org/images/entities/char_2009.gif) : :![[thin space (1/6-em)]](https://www.rsc.org/images/entities/char_2009.gif) B) B) |
460 kPa |
Silicone 4![[thin space (1/6-em)]](https://www.rsc.org/images/entities/char_2009.gif) : :![[thin space (1/6-em)]](https://www.rsc.org/images/entities/char_2009.gif) 1 1 |
330 kPa |
Silicone 9![[thin space (1/6-em)]](https://www.rsc.org/images/entities/char_2009.gif) : :![[thin space (1/6-em)]](https://www.rsc.org/images/entities/char_2009.gif) 1 1 |
15 kPa |
| Hot-melt adhesive | 10.4 MPa |
| Glass | ∼50 GPa |
3 Results and discussion
3.1 Central dimple
Fig. 2 shows interference images comparing an impact of an ethanol drop onto a rigid glass surface (V = 1.99 m s−1, Rb = 1.5 mm) versus an impact onto the softest silicone surface (E = 15 kPa, V = 1.91 m s−1, Rb = 1.5 mm). Both images are set at the same physical scale, and it is clear that the entrapped air disc for the impact on the silicone surface has a larger radius, L0, and has more fringes, meaning a thicker air disc at the centerline, H(L = 0) = H*. Beneath each image is a plot showing the half-profile of the air layer verifying these observations. Impacting onto glass, the centerline height is H* = 1.84 μm and L0 = 150 μm. On the silicone, H* = 2.56 μm and L0 = 192 μm. Therefore, on the silicone surface, H* increased by 40%, L0 increased by 30%, resulting in a 78% increase in the entrapped air disc volume compared to the impact onto glass. These results are similar to that observed by Li, Vakarelski and Thoroddsen18 for a water drop impacting onto an ultra-viscous film of 2 × 10⁷ cSt silicone oil.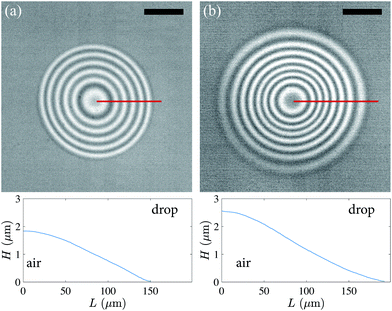 | ||
| Fig. 2 Bottom view interference images comparing entrapped air disc size at the time of first contact for impacts of ethanol drops onto (a) a rigid glass microscope slide (V = 1.99 m s−1, Rb = 1.5 mm, We = 207) versus (b) a soft silicone surface (E = 15 kPa, V = 1.91 m s−1, Rb = 1.4 mm, We = 187). The plots beneath each image show the half-profile of the entrapped air layer calculated along the red solid line drawn on each image. The scale bars in the images are 100 μm long. Supplemental videos (ESI†) are available online. | ||
Fig. 3 shows the H* data from all of the experimental cases scaled using the compressibility parameter ε. We measure H* at the moment of ring contact between the drop and solid. For the cases where the drop initially avoids contact with the solid and instead “glides” on a thin layer of air, we measure H* at the start of the gliding phase. We choose to compare our experimental data with the theory of Mandre et al. since 70% of our data has an ε−1 value greater than 1, meaning that gas compressibility can be important and prior studies of low-viscosity drop impacts onto solid surfaces have shown good agreement with this theory. The solid lines in the plot are the empirical modifications proposed by Li and Thoroddsen9 to the inviscid liquid, compressible gas theory:3,8H*/RbSt2/3 = 3.4 for incompressible cases and H*/RbSt2/3 = 4.2ε0.4 when gas compressibility is important. Here the results from the preceding paragraph are clearly evident. The impacts onto the rigid glass follow the empirical relations well; however, the impacts onto the silicone surfaces deviate significantly, reaching values twice as large as expected in many cases. H* for the silicone surfaces is always underpredicted. As the impact velocity increases, H* increases until ε−1 ≈ 10 at which point it begins to decrease due to compressibility effects in the gas, which is an order of magnitude larger than when compressibility becomes important for impacts onto a rigid surface. Interestingly, there is no clear dependence of H* on the stiffness of the substrate as long as it is below some critical stiffness.
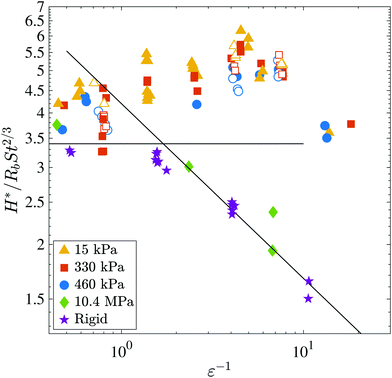 | ||
| Fig. 3 Plot of the normalized centerline height of the air disc H*/RbSt2/3 at the moment of impact versus the inverse of the compressibility parameter ε. Compressibility effects increase to the right. Filled symbols denote substrates thicker than 1 mm and open symbols denote substrates ≤1 mm. The black, solid lines are the empirical corrections presented in Li and Thoroddsen9 for low-viscosity drop impacts onto smooth, rigid surfaces. Note that impacts onto the stiffest polymer used herein, solid green symbols, follow the behavior of the rigid substrate. | ||
The open symbols in Fig. 3 represent impacts onto soft substrates that were ∼1 mm thick whereas the filled symbols represent impacts onto substrates with thicknesses ranging from 5–10 mm. Here, we do not see any significant effect of the thickness of the substrate on the scaled centerline height. As the substrate thickness decreases below the horizontal length scale, L0, we expect that the entrapment dynamics will transition back toward rigid-surface behavior. Howland et al.20 showed that a 3 μm thick layer of a PDMS on a rigid surface did not suppress droplet splashing like an equivalent stiffness layer that was 10 mm thick.
At what stiffness do the dynamics transition from rigid substrate to soft substrate behavior? We do an order of magnitude analysis using the formula for the stiffness obtained via indentation, E = F(1 − ν2)/2Ld, where F is the force applied to the substrate, ν is Poisson's ratio, L is the radius of the contact area, and d is the depth of the indentation.27 Taking the average force applied to be on the order of an atmosphere of pressure, O(105) Pa, multiplied by the area of the air disc with L ∼ O(10−4) m gives a force of F ∼ O(103) N. Now limiting the indentation to be O(10−6) m, which is the approximate thickness of the air layer, the stiffness of the material would need to be E ∼ O(107) Pa.
To verify this estimation, droplets were impacted onto a 2 mm thick solidified layer of hot-melt adhesive, which contains ethylene-vinyl acetate (EVA) and has a measured stiffness of E = 10.4 MPa at 20 °C. Results are included in Fig. 3 represented by solid green diamonds. The data fall nearly in line with the data for impacts onto rigid substrates (glass E ∼ 50 GPa) and do not follow the trend for impacts onto the soft silicone substrates.
Taking a cue from drop impacts onto liquid surfaces, we attempt to unify the scaling relationships for the air disc for both soft and rigid substrates. Recent studies on drop impacts onto liquid surfaces24,30–32 have found that the liquid surface initially deforms at half of the impact velocity, Vs = V/2, where Vs is the velocity of the liquid surface; thus, the effective impact velocity would be the relative velocity between the drop and the impact surface, Ve = V − Vs = V/2. This is readily seen by applying the Bernoulli equation along a vertical streamline in a reference frame moving with the bottom of the drop thus eliminating the unknown stagnation pressure. This yields 1/2ρ(V − Vs)2 = 1/2ρVs2, which solving for Vs results in Vs = V/2 when the densities of the drop and liquid pool match.30 Tran et al.31 arrive at a similar result considering the conservation of the kinetic energy of the drop before impact and the energy of the drop and liquid pool a short time after impact. Essentially, the liquid surface is forced to move in order to absorb the energy from the drop.
Tran et al.31 and Hendrix et al.32 further showed that using Ve in the scaling parameters can unify the scaling relationships for impacts onto solid and liquid surfaces. Langley and Thoroddsen24 empirically extended this to the impact of ultra-viscous liquid droplets (up to 1 × 10⁶ cSt) onto films of the same liquid showing that this relationship holds as long as the thickness of the film was on the order of the horizontal length scale of the air disc, L0, or larger.
We propose that in the earliest moments of the impacts herein that the soft solid deforms as would a liquid surface, and using Ve will appropriately adjust the scaling. Fig. 4(a) shows a plot of the centerline height of the air disc versus the compressibility parameter, εe−1. The subscript e in the Stokes number and ε denote that the effective velocity Ve has been used instead of the impact velocity, where
 | (4) |
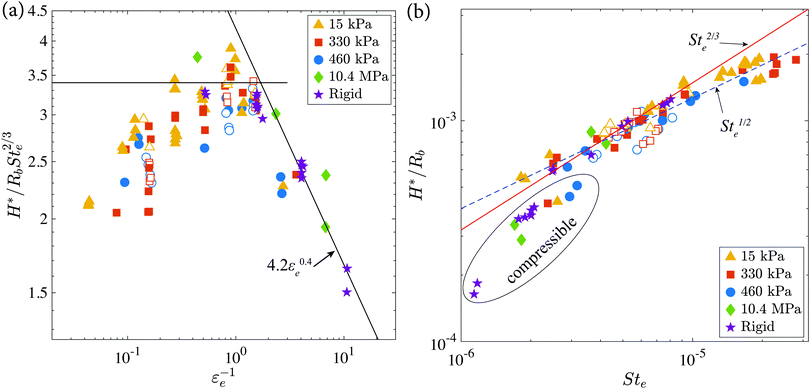 | ||
| Fig. 4 (a) Plot of the scaled centerline height H* versus the compressibility parameter εe−1 using the effective impact velocity Ve given in eqn (4). (b) Plot of the nondimensional centerline height of the air disc H*/Rbversus the effective Stokes number Ste. Impacts onto rigid surfaces scale with Ste2/3 (red solid line), while impacts onto soft surfaces scale with Ste1/2 (blue dashed line) until compressibility effects set in. Open symbols denote impacts onto ≤1 mm thick silicone substrates and filled symbols denote impacts onto thicker substrates. Note that for the two stiffest surfaces (10.4 MPa and Rigid) Ve = V. | ||
Revisiting the incompressible theories from the introduction, in Fig. 4(b) we plot the normalized centerline height of the air disc H*/Rbversus the effective Stokes number Ste. The red, solid line in the plot shows a slope of 2/3, as proposed by Mandre et al.3 and the blue, dashed line shows a slope of 1/2, as proposed by Klaseboer et al.7 Here we can see that the impacts onto rigid surfaces scale with Ste2/3, as also seen in Fig. 4(a); however, the impacts onto the soft solids scale with Ste1/2 until compressibility effects set in. Thus,
 | (5) |
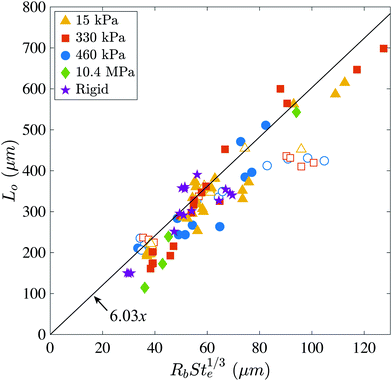 | ||
| Fig. 5 Plot of the measured radial extent of the air disc L0versus the Stokes number using Ve compared with the theory of Hicks and Purvis.4,5 Open symbols denote impacts onto ≤1 mm thick silicone substrates and filled symbols denote impacts onto thicker substrates. Note that for the two stiffest surfaces (10.4 MPa and rigid) Ve = V. | ||
3.2 Extended gliding
For lower impact velocity impacts onto the soft solids, V ≲ 1.7 m s−1, the drop does not immediately make ring contact at the kink of the dimple as is typically seen for low viscosity liquids impacting onto smooth solid surfaces.9 Instead, the drop begins to spread or ‘glide’ on an extended, thin layer of air ≲160 nm thick.Fig. 6 shows bottom view images depicting these extended gliding layers for impacts onto silicone surfaces of different softness: (a)–(d) E = 15 kPa, (e) E = 330 kPa and (f) E = 460 kPa. Gliding is observed on each of the soft surfaces; however, on the softest surface the extent of the gliding layer is typically larger. In each image, dark spots within the bright gliding layer show local ruptures of the air film where the drop liquid has made contact with the surface at random locations. During this gliding phase, the local contacts spread along the surface and eventually merge to fully enclose the air disc and entrap myriad microbubbles. Note that the images shown in Fig. 6 occur in the midst of the gliding phase and the maximum spreading radius of the drop before the air disc is fully enclosed, Lg, is typically measured at a later time than shown in these images. This radius is depicted in each image of Fig. 6 by a dotted red circle. Further, Supplemental videos (ESI†) are available showing the whole gliding and contact process.
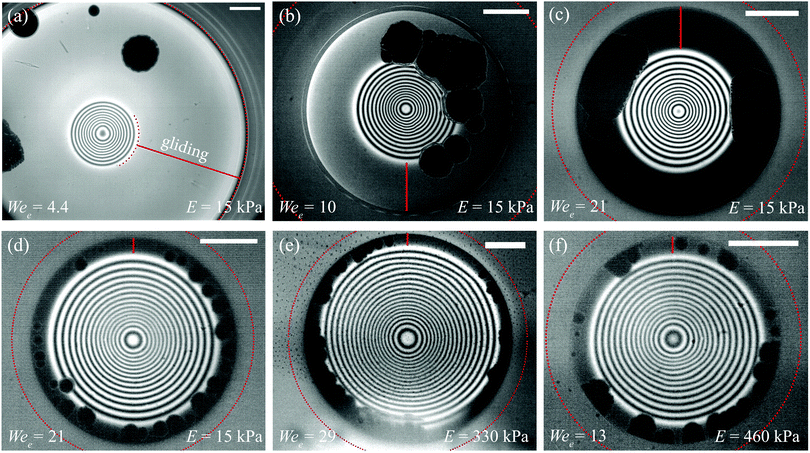 | ||
| Fig. 6 Bottom view reflective interference images during the gliding phase of DI water droplets impacting onto soft silicone solids. The gliding extent visible in each image is demonstrated in panel (a) and shown in subsequent panels by a vertical red line. The maximum gliding extent, Lg, achieved at a later time for each impact is shown as a dotted red circle. In panel (b), this is only visible in the corners of the image. Dark spots in each image are locations of local contact between the drop and solid. (a)–(c) Impacts onto the softest surface (E = 15 kPa) 8 mm thick, for increasing impact velocity from left to right (a) V = 0.7 m s−1, (b) V = 1.1 m s−1, and (c) V = 1.5 m s−1. Notice that as the impact velocity increases the thickness of the gliding layer decreases as denoted by the lower image intensity especially noticeable in panel (c). (d) Impact onto a thinner E = 15 kPa surface only 1 mm thick, with V = 1.1 m s−1. Here the extent of the gliding has been suppressed by the thinness of the surface as compared to (b). (e) and (f) Impacts onto (e) E = 330 kPa and (f) E = 460 kPa silicone surfaces at V = 1.1 m s−1 showing that increasing the surface stiffness also reduces the extent of the gliding. Note that although panels (b) and (d)–(f) all impact with the same velocity, the height of the air disc, and thus visible interference fringes, varies due to differences in drop radius as indicated by Wee. The scale bars in all images are 300 μm long. Supplemental videos (ESI†) are available online. | ||
Fig. 6(a)–(c) compare impacts at increasing impact velocity onto the softest surface. As the impact velocity increases, the extent of the gliding layer, Lg − L0, reduces. At the low end, panel (a), the extent of gliding is at least 1080 μm before the camera memory was filled, whereas in panel (c) the drop ultimately glides for only 344 μm. Note that the image shown in panel (c) occurs 20 μs prior to the air disc being fully entrapped at which time the maximum radius is measured (see ESI† for corresponding videos). Comparing panels (a) and (c), the thickness of the gliding layer is also reduced as seen by the much darker intensity in panel (c) since the reflected interference will have decreasing image intensity as the thickness decreases from the last bright fringe at 160 nm to zero. In panel (c), the gliding layer is nearly as dark as the locally contacted regions, suggesting thickness of only tens of nm. As the surface stiffness increases, the extent of gliding decreases as well. The maximum extent measured for the impact shown in panel (e) is 197 μm and is 166 μm in panel (f).
The thickness of the substrates also plays a role in decreasing the extent of gliding. Fig. 6(d) shows an impact of a water drop onto a 1 mm thick silicone substrate with E = 15 kPa at with Wee = 21. Here, the maximum extent of the gliding layer is 184 μm and is much smaller than in panel (c), an equivalent impact onto a 5 mm thick substrate at the same Wee, where the extent of gliding is 344 μm. This is not surprising given the effect seen in Fig. 5 showing the reduced L0 for low velocity impacts onto likewise thin substrates (open symbols in the figure).
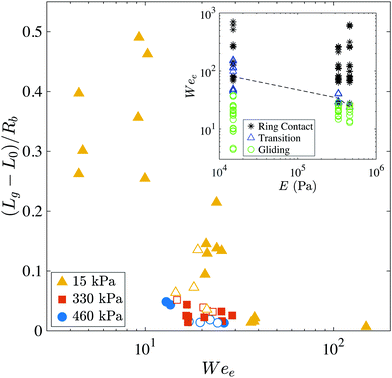
Fig. 7 shows the normalized maximum gliding extent, (Lg − L0)/Rb, for each of the realizations where the extended gliding was observed, versus the Weber number using the effective velocity, Ve. For low values of Wee impacting onto the softest surface, the gliding layer could be nearly 50% of Rb before the air disc was fully enclosed. For the same impact conditions, the same maximum gliding is not always achieved due to the random nature of the local contacts and possible slight differences in each impact surface. As discussed above, increasing the stiffness reduces the gliding extent as does decreasing the substrate thickness to 1 mm.
The inset of Fig. 7 shows the parameter space where gliding is observed. As the stiffness increases, the transition from gliding behavior to ring contact occurs at smaller values of Wee with the transition occurring at average values of Wee = 80 for E = 15 kPa, Wee = 34 for E = 330 kPa, and Wee = 24 for E = 460 kPa. For the lowest stiffness, impacts onto 1 mm thick substrates resulted in transition to ring contact sooner than on the thicker surfaces as seen by the presence of black ‘*’ symbols at Wee ≈ 80 on the far left of the inset. This behavior follows similar trends to those seen by Howland et al.20 for splashing on soft solids, where softer surfaces suppressed splashing at higher impact velocities and as the stiffness increased the amount of suppression decreased.
The phenomenon of gliding is not new as other studies have seen it for high viscosity drops even at high impact velocities13 or low viscosity drops at low impact velocities,14 but it has not previously been seen to such an extent for low-viscosity drops at high impact velocities. For comparison, Kolinski et al.14 observed skating for isopropyl alcohol drops released from 1 cm (We ≈ 9) that extended for ≈500 μm; however, once the release height reached 4 cm (We ≈ 37), the drop contacted the surface almost immediately with very brief skating observed. Li and Thoroddsen9 used higher impact velocities and did not observe any skating in their experiments with water drops. In the case of rebounding drops, the drop must have an impact velocity less than 0.25 m s−1 or a Weber number below 4.16,17
Analyzing the impact Weber numbers, We, for the cases where we observe gliding is quite surprising given the previous observations. For the softest surface, gliding behavior is seen at Weber numbers as high as 617, with the most extended gliding seen at Weber numbers of We = 17. Using the effective velocity, multiplies the impact Weber number by (1/2)2 for the soft silicone surfaces yielding a Weber number Wee of 4.4 for the most extended gliding which is slightly above the maximum Weber number where rebounding was observed in previous studies. In contrast the maximum Wee for observed gliding is herein 154.
Howland et al.20 simulated drop impacts onto soft substrates and found that decreasing the stiffness of the substrate reduces the maximum pressure exerted on the surface by the spreading drop compared with an impact on a rigid substrate leading to splash suppression. This reduced pressure could account for the existence of the extended gliding at much higher velocities than seen previously. The pressure increases proportional to the impact velocity which would agree with the decreased gliding at larger impact velocities.
3.3 Air film rupture
As the behavior transitions from gliding to ring contact, some local contacts are still seen, and the air layer ruptures at a more uniform radius and time. To better see the details of the contacts, some experiments were done using transmission interferometry where the laser is positioned above the surface and the light is focused through the drop. Fig. 8 shows time sequence images of an ethanol drop (Rb = 1.5 mm) impacting onto an E = 330 kPa surface at 1.1 m s−1. In the first image, the drop begins its gliding phase and several local contacts are seen as small black circles and marked with black arrows. As the drop continues to spread outward, the local contacts also spread and more local contacts are made, as seen in the second image. As the thin air film ruptures, the drop makes ring contact around the perimeter of the air disc. For this case the gliding is quite small comparatively at only 36 μm. As seen in the third image, there are now two contact lines (white arrows), one moving inward as the air disc contracts and one moving outward as the drop continues spreading. As the inward moving contact line encounters the wet spots form the local contacts, several microbubbles are entrapped, which is particularly noticeable at the very top of the third image. Similar entrapment by topological change was studied by Thoroddsen et al.33 for the outer contact line during impacts of viscous drops. Many additional microbubbles are entrained by the outward moving contact line by entrapping air in cusps along the contact line. These cusps leave a radial line of microbubbles as they collapse as shown in the last image. | ||
| Fig. 8 Bottom view transmission interferometry images showing details of the gliding and contact of an ethanol drop onto an E = 330 kPa silicone surface (Rb = 1.54, mm V = 1.1 m s−1, Wee = 37). There are 3 μs between each consecutive image, and the scale bar is 100 μm. In the first image, gliding begins and several local contacts are shown by the black arrows. Additional local contacts are made as the drop begins to spread seen in the second image. In the third image, the thin air film has ruptured and there are two contact lines one moving inward and one outward shown by the white arrows. The inward moving contact line entrains microbbubles as it encounters the local contacts shown by black arrows. This entrapment by topological change is also seen in front of the outer contact line by Thoroddsen et al.33 The last image shows radial lines of microbubbles that have been entrained by cusps in the outward moving contact line marked by black arrows. A Supplemental video (ESI†) is available online. | ||
4 Conclusions
Drop impacts onto soft solids entrap more air in the central air disc when compared with equivalent impacts onto rigid substrates. Below a critical stiffness of O(1) MPa, this increased entrapment is observed with no further effect of the stiffness. The effects of gas compression to reduce the initial height of the air disc, with increasing impact velocity, is delayed; however, using an effective impact velocity, Ve, equal to half of the velocity of the drop in the scaling for the soft solids, as done with impacts onto liquid surfaces, matches the compressible gas behavior as seen in impacts onto rigid substrates. Further, for incompressible gas conditions, H* scales with Ste1/2 for the soft surfaces. Continuing the use of Ve in the scaling for the radial extent of the air disc yields reasonable agreement with theories and experiments for impacts onto rigid surfaces with only a slight over-prediction of L0 in most cases. Silicone layers as thin as 1 mm exhibited the same behavior as thicker substrates.For low impact velocities (V ≲ 1.7 m s−1), the drop does not immediately make contact with the soft solid but instead glides over a thin layer of air. This gliding behavior is similar to that seen in impacts of high-viscosity drops onto rigid surfaces. The extended thin layer of air ruptures in random locations and the local wetting spots eventually merge to fully enclose the central air disc, which then contracts into a bubble. As the impact velocity increases, the extent of gliding decreases until the contact transitions to the more traditionally observed ring contact around the perimeter of the central dimple. Here, the stiffness plays more of a role than in the initial size of the air disc. As the stiffness of the substrate increases, the extent of the gliding is decreased and impacts onto higher-stiffness substrates transition to ring contact at lower values of the Weber number than softer surfaces. In all cases, the gliding occurs at much higher impact velocities and We than seen previously in the literature for impacts onto rigid surfaces.
Although soft solids are able to suppress droplet splashing behavior, care should be taken in applications that may be sensitive to entrapped air, such as the inkjet printing of organic displays or conductive materials, since the central air disc is larger and the wetting behavior results in the entrapment of many additional smaller microbubbles. Further study is needed to decouple the deformation of the soft solid from the deformation of the drop to fully understand the mechanisms driving the additional air entrapment.
Conflicts of interest
There are no conflicts of interest to declare.Acknowledgements
Funding for this research was provided by King Abdullah University of Science and Technology (KAUST) under grant URF/1/3727-01-01. AACP acknowledges support from a CBET-EPSRC grant (EP/S029966/1, through a Collaborative Proposals under the US National Science Foundation Division of Chemical, Bioengineering, Environmental, and Transport Systems and the UK Engineering and Physical Sciences Research Council).Notes and references
- C. Josserand and S. T. Thoroddsen, Annu. Rev. Fluid Mech., 2016, 48, 365–391 CrossRef.
- S. Chandra and C. T. Avedisian, Proc. R. Soc. London, Ser. A, 1991, 432, 13–41 CrossRef.
- S. Mandre, M. Mani and M. P. Brenner, Phys. Rev. Lett., 2009, 102, 134502 CrossRef PubMed.
- P. D. Hicks and R. Purvis, J. Fluid Mech., 2010, 649, 135–163 CrossRef CAS.
- P. D. Hicks and R. Purvis, J. Fluid Mech., 2013, 735, 120–149 CrossRef.
- W. Bouwhuis, R. C. A. Van Der Veen, T. Tran, D. L. Keij, K. G. Winkels, I. R. Peters, D. Van Der Meer, C. Sun, J. H. Snoeijer and D. Lohse, Phys. Rev. Lett., 2012, 109, 264501 CrossRef PubMed.
- E. Klaseboer, R. Manica and D. Y. Chan, Phys. Rev. Lett., 2014, 113, 194501 CrossRef PubMed.
- M. Mani, S. Mandre and M. P. Brenner, J. Fluid Mech., 2010, 647, 163–185 CrossRef CAS.
- E. Q. Li and S. T. Thoroddsen, J. Fluid Mech., 2015, 780, 636–648 CrossRef.
- L. Xu, W. W. Zhang and S. R. Nagel, Phys. Rev. Lett., 2005, 94, 184505 CrossRef PubMed.
- E. Q. Li, K. R. Langley, Y. S. Tian, P. D. Hicks and S. T. Thoroddsen, Phys. Rev. Lett., 2017, 119, 214502 CrossRef PubMed.
- D. A. Burzynski and S. E. Bansmer, Phys. Rev. Fluids, 2019, 4, 073601 CrossRef.
- K. Langley, E. Q. Li and S. T. Thoroddsen, J. Fluid Mech., 2017, 813, 647–666 CrossRef CAS.
- J. M. Kolinski, S. M. Rubinstein, S. Mandre, M. P. Brenner, D. A. Weitz and L. Mahadevan, Phys. Rev. Lett., 2012, 108, 074503 CrossRef PubMed.
- J. M. Kolinski, L. Mahadevan and S. M. Rubinstein, Phys. Rev. Lett., 2014, 112, 134501 CrossRef PubMed.
- J. De Ruiter, R. Lagraauw, D. Van Den Ende and F. Mugele, Nat. Phys., 2015, 11, 48–53 Search PubMed.
- J. M. Kolinski, L. Mahadevan and S. M. Rubinstein, EPL, 2014, 108, 24001 Search PubMed.
- E. Q. Li, I. U. Vakarelski and S. T. Thoroddsen, J. Fluid Mech., 2015, 785, R2 Search PubMed.
- K. R. Langley, E. Q. Li, I. U. Vakarelski and S. T. Thoroddsen, Soft Matter, 2018, 14, 7586–7596 RSC.
- C. J. Howland, A. Antkowiak, J. R. Castrejón-Pita, S. D. Howison, J. M. Oliver, R. W. Style and A. A. Castrejón-Pita, Phys. Rev. Lett., 2016, 117, 184502 CrossRef PubMed.
- M. J. Thoraval, K. Takehara, T. G. Etoh and S. T. Thoroddsen, J. Fluid Mech., 2013, 724, 234–258 CrossRef CAS.
- R. C. A. Van Der Veen, T. Tran, D. Lohse and C. Sun, Phys. Rev. E: Stat., Nonlinear, Soft Matter Phys., 2012, 85, 026315 CrossRef PubMed.
- J. de Ruiter, D. van den Ende and F. Mugele, Phys. Fluids, 2015, 27, 012105 CrossRef.
- K. R. Langley and S. T. Thoroddsen, J. Fluid Mech., 2019, 878, R2 CrossRef CAS.
- K. R. Langley, E. Q. Li and S. T. Thoroddsen, The Micro-World Observed by Ultra High-Speed Cameras: We See What You Don't See, Springer International Publishing AG, 2018, pp. 321–341 Search PubMed.
- R. W. Style, R. Boltyanskiy, B. Allen, K. E. Jensen, H. P. Foote, J. S. Wettlaufer and E. R. Dufresne, Nat. Phys., 2015, 11, 82–87 Search PubMed.
- G. Pharr, W. Oliver and F. Brotzen, J. Mater. Res., 1992, 7, 613–617 CrossRef CAS.
- R. W. Style, R. Boltyanskiy, G. K. German, C. Hyland, C. W. MacMinn, A. F. Mertz, L. A. Wilen, Y. Xu and E. R. Dufresne, Soft Matter, 2014, 10, 4047–4055 RSC.
- R. W. Style, R. Boltyanskiy, Y. Che, J. Wettlaufer, L. A. Wilen and E. R. Dufresne, Phys. Rev. Lett., 2013, 110, 066103 CrossRef PubMed.
- N. B. Speirs, Z. Pan, J. Belden and T. T. Truscott, J. Fluid Mech., 2018, 844, 1084–1111 CrossRef CAS.
- T. Tran, H. De Maleprade, C. Sun and D. Lohse, J. Fluid Mech., 2013, 726, R3 CrossRef.
- M. H. W. Hendrix, W. Bouwhuis, D. van der Meer, D. Lohse and J. H. Snoeijer, J. Fluid Mech., 2016, 789, 708–725 CrossRef CAS.
- S. T. Thoroddsen, K. Takehara and T. G. Etoh, Phys. Fluids, 2010, 22, 051701 CrossRef.
Footnote |
| † Electronic supplementary information (ESI) available: Videos corresponding to Fig. 2, 5 and 7. See DOI: 10.1039/d0sm00713g |
| This journal is © The Royal Society of Chemistry 2020 |

