
 Open Access Article
 This Open Access Article is licensed under a Creative Commons Attribution-Non Commercial 3.0 Unported Licence
Layering of bidisperse charged nanoparticles in sedimentation†
Xufeng
Xu
 *a,
P. M.
Biesheuvel
b,
Helmut
Cölfen
c and
Evan
Spruijt
*d
*a,
P. M.
Biesheuvel
b,
Helmut
Cölfen
c and
Evan
Spruijt
*d
aLaboratory of Physical Chemistry, Department of Chemical Engineering and Chemistry, Eindhoven University of Technology, 5612 AE Eindhoven, The Netherlands. E-mail: x.xu3@tue.nl
bWetsus, European Centre of Excellence for Sustainable Water Technology, Oostergoweg 9, 8911 MA Leeuwarden, The Netherlands
cPhysical Chemistry, University of Konstanz, Universitätsstr. 10, Box 714, 78457 Konstanz, Germany
dInstitute for Molecules and Materials, Radboud University, 6525 AJ Nijmegen, The Netherlands. E-mail: e.spruijt@science.ru.nl
First published on 5th May 2020
Abstract
Bidisperse mixtures of charged nanoparticles form separate layers upon centrifugation as a result of minimization of the system's free energy in sedimentation-diffusion equilibrium. Different factors were investigated experimentally for their effects on the layering, and are supported by theoretical calculations of the full sedimentation profiles. Surprisingly, lighter/smaller nanoparticles can even sink below heavier/larger ones when the particle surface charge is carefully tuned. This study provides deeper insights into the control of layering in polydisperse particle mixtures during sedimentation.
Layering of particle mixtures is common in nature. The best-known example is the Brazil nut effect.1,2 Upon shaking or vibrating, Brazil nuts, which are usually the largest nuts in the system, end up on top in a mixture of nuts with various sizes.3 A reverse Brazil nut effect4,5 has also been reported in granular matter, as larger objects may sink to the bottom depending on the size and density of the mixture.6 Going to smaller objects, the layering of micron-sized colloidal particles was recently observed in binary dispersions of particles of different sizes but identical density upon sedimentation by Velegol et al.7 They found smaller polystyrene latex (PSL) localized in a sharp layer above larger PSL after the sedimentation-diffusion equilibrium8 (SDE) was reached, which is fully reproducible in the size range from 1 μm to 5 μm. Due to the micrometre size range of the colloids, only the dominant gravitational energy of the system was considered to explain the spontaneous layering behaviour. The contributions of entropy and interparticle interaction to the system free energy were calculated and found to be negligible. By contrast, in nanometre-sized particle mixtures, these two factors may play a prominent role, and research into their effects on layering is still missing. Moreover, different parameters including particle size, particle charge and relative g-force of the centrifugation would affect both the extent and position of layering by changing the system free energy.
In our study, we used bidisperse charged silica nanoparticles in a refractive index matching solvent as a model system to study the layering of nanometre-sized particles in the SDE. The advantage of this model system is that the normally occurring strong light scattering and severe turbidity at high colloidal concentrations9,10 can be minimized by the refractive index matching between silica and the glycerol water mixture (80 vol% + 20 vol%). Moreover, fluorescent labeling11–13 of the silica nanoparticles (SNPs) was used to quantitatively measure the radial concentration of both particles at very high concentration in the analytical ultracentrifuge cell, which was achieved by multi wavelength analytical ultracentrifugation14–16 (MWL-AUC).
From a theoretical perspective, we calculated the full sedimentation-diffusion equilibrium profiles using a Boublik–Mansoori–Carnahan–Starling–Leland (BMCSL) approximation for the hard-core excluded volume interactions, complemented with a Boltzmann term to account for electrostatic interactions.17,18 We solved the ensuing differential equations numerically to simulate the layering of binary charged nanoparticles in the SDE, which carefully took into account both the entropic and enthalpic contributions to the system free energy.
From both the experimental and theoretical side, we found that the layering of nanoparticles was observed upon sedimentation which can be controlled by changing particle size, surface charge and centrifugal field strength (g-force), as shown in Fig. 1. Counterintuitively, lighter nanoparticles were found to move below heavier ones when the surface charge was tuned carefully, which was demonstrated both by experiments and theoretical calculations. Overall, our study is a first step to quantitatively understand and delicately control the layering of nanoparticle mixtures in sedimentation,19 the concept of which can be used in sorting biological mixtures of different components and purifying polydisperse colloidal mixtures in the future.
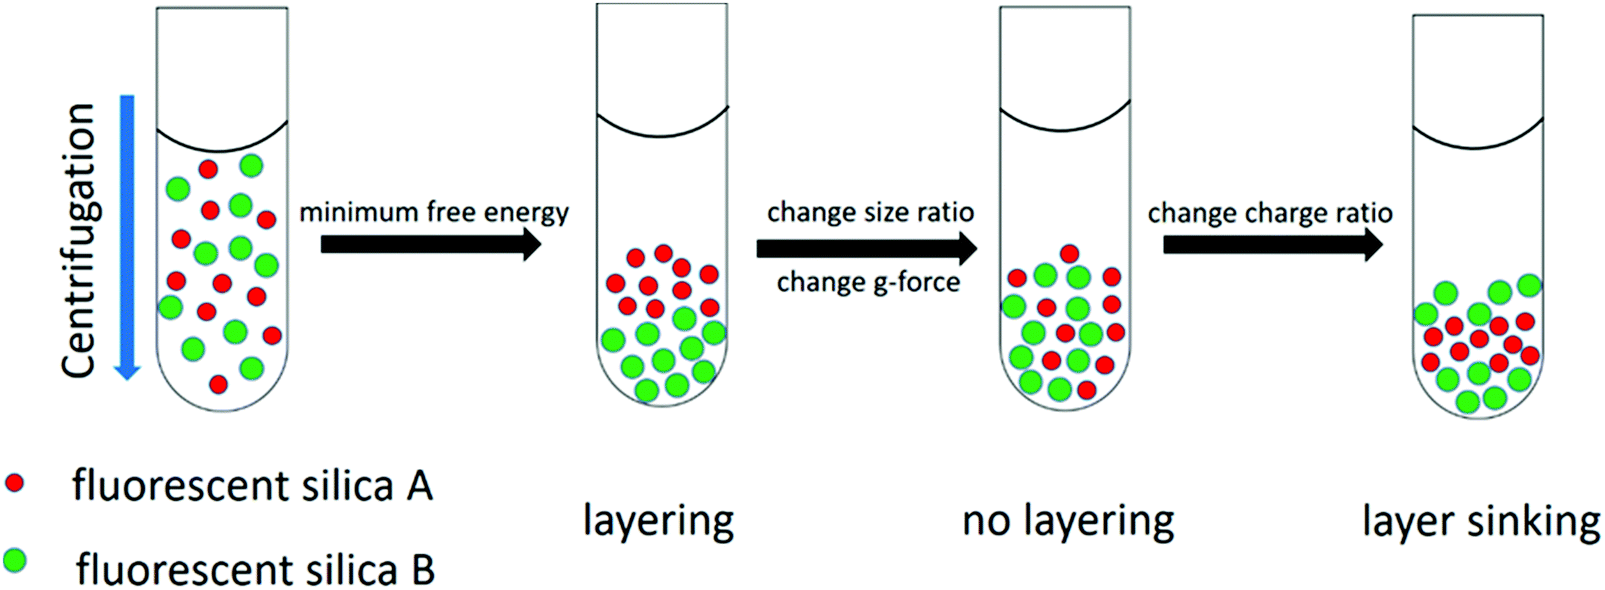 | ||
| Fig. 1 The schematic illustration of the layering. The layering can be formed by the sedimentation of bidisperse charged silica nanoparticles due to the minimum system free energy. Layering can be suppressed by changing the size ratio of the particle mixture or the angular velocity of the centrifugation while layer sinking (the layer of the smaller nanoparticles sinks towards the bottom) can be observed by changing the charge ratio of the particle mixture. | ||
The fluorescence labelled SNPs with the diameter of 80 nm, 100 nm and 130 nm were synthesized according to literature procedures20–22 in two steps: (1) the particle core of 60 nm was first synthesized by the reverse micro-emulsion method21 and (2) different final sizes were then synthesized by the seeded Stöber growth method22 (the size distribution characterization by the analytical ultracentrifuge (AUC) and dynamic light scattering (DLS) is shown in Fig. S1 and S2, ESI†). The SDE profile for a binary mixture of 80 nm and 130 nm SNPs is shown in Fig. 2a (the detailed AUC experiment set-up is described in SI1, ESI†) and the corresponding theoretical calculation result is shown in Fig. 2b (the detailed theoretical calculation steps are described in SI2, ESI†). Qualitatively speaking, the experimental layering position of the smaller particles agreed very well with the theoretical result and the increasing concentration trend of the larger particles was described well by the theoretical calculation. However, experimentally the glass transition occurred at a significantly lower volume fraction due to the extended double layer23,24 (Debye length = 14 nm) for the charged colloids25 in dispersion of a low ionic strength (0.5 mM). Therefore, the concentration gradient reached a plateau at 36 vol%. In comparison, the BMCSL model did not consider the glass transition but kept an increasing trend of the particle concentration along the radius. This leads to the deviation in Fig. 2b (also in Fig. 3 and 4). Nevertheless, by knowing the plateau concentration the effective hard sphere diameter can be estimated. The maximum effective hard sphere volume fraction is 64% (theoretical value for the Bernal (random close-packed) hard-sphere glass26) and the particle volume fraction is 36% (experimental plateau value in our case) for 130 nm SNPs. By using eqn (1) the effective hard sphere diameter equals 1.2 times particle diameter and thus ca. 13 nm need to be added to the particle radius to compensate the electric double layer contribution (Debye length = 14 nm) to the effective hard sphere size.
 | (1) |
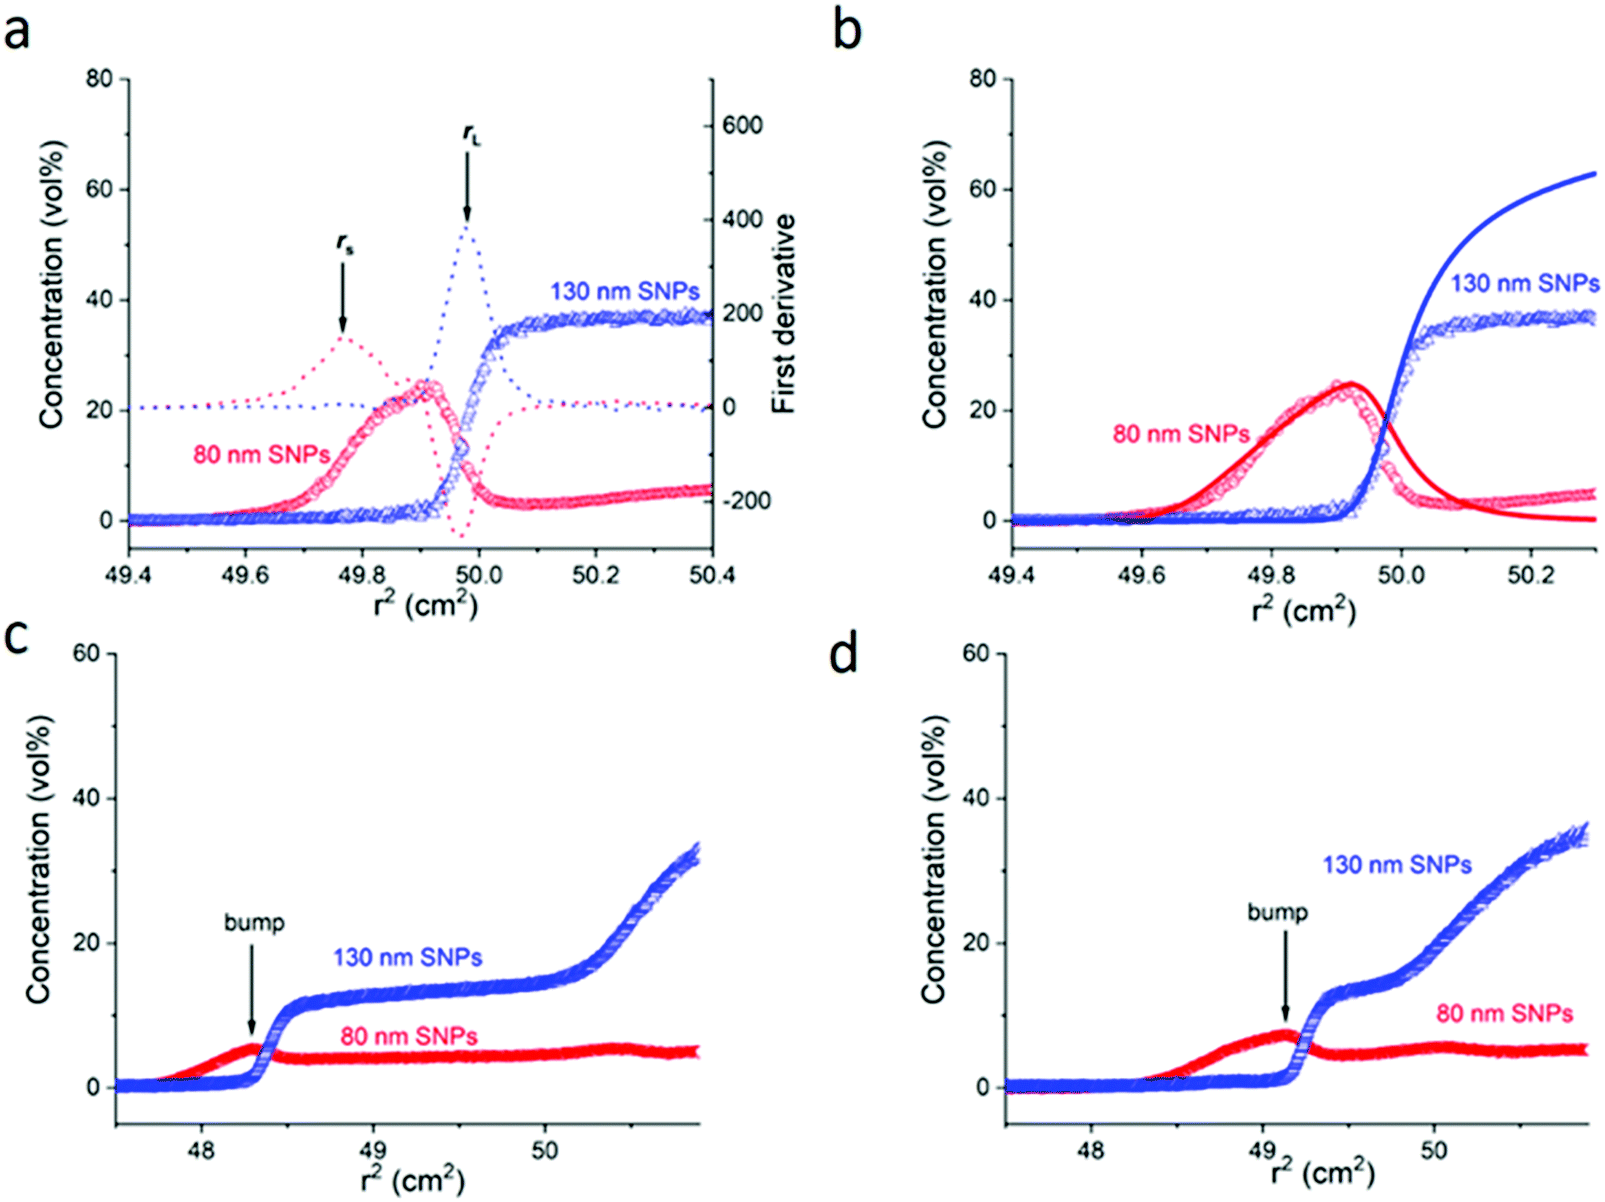 | ||
Fig. 2 Experimental sedimentation-diffusion equilibrium (SDE) profiles for the binary mixture of 80 nm RITC-SNPs and 130 nm FITC-SNPs (number ratio: 1![[thin space (1/6-em)]](https://www.rsc.org/images/entities/char_2009.gif) :1, sample volume 10 μl, initial concentration 20 vol%, ionic strength 0.5 mM) at 1100 rpm and 25 °C. In (a) the positions of rs and rL are indicated. In (b) the theoretically calculated profiles (solid line) are overlapped with the experimental profiles (scatter). The parameters used in the calculation are described in SI2 (ESI†). (c) and (d) are two snapshots of the concentration profiles at 11 h and 21 h after the sedimentation is executed (at 41 h the equilibrium is reached). The concentration bump due to the Johnston-Ogston effect is marked by arrows. :1, sample volume 10 μl, initial concentration 20 vol%, ionic strength 0.5 mM) at 1100 rpm and 25 °C. In (a) the positions of rs and rL are indicated. In (b) the theoretically calculated profiles (solid line) are overlapped with the experimental profiles (scatter). The parameters used in the calculation are described in SI2 (ESI†). (c) and (d) are two snapshots of the concentration profiles at 11 h and 21 h after the sedimentation is executed (at 41 h the equilibrium is reached). The concentration bump due to the Johnston-Ogston effect is marked by arrows. | ||
 | ||
| Fig. 3 Experimental (scatter) and theoretical (solid line) sedimentation-diffusion equilibrium (SDE) profiles for (a) the binary mixture of 80 nm RITC-SNPs and 130 nm FITC-SNPs at 5000 rpm and 25 °C and (b) the binary mixture of 100 nm RITC-SNPs and 130 nm FITC-SNPs at 1100 rpm and 25 °C. The parameters used in the calculation are described in SI2 (ESI†). | ||
 | ||
| Fig. 4 Experimental (scatter) and corresponding theoretical (solid line) sedimentation-diffusion equilibrium (SDE) profiles for the binary mixture of 80 nm RITC-SNPs and 130 nm FITC-SNPs at 1100 rpm and 25 °C of different acidities: (a) 0.001 M HCl; (b) 0.01 M HCl. The parameters used in the calculations are described in SI2 (ESI†). | ||
A solvent of a very high ionic strength (0.1 M) was used to induce a nearly hard sphere situation (as shown in Fig. S3, ESI†). By this means, the maximum total concentration reached 62 vol%, which is considerably close to the theoretical value for the random close-packed hard-sphere glass (64 vol%). The small deviation (2 vol%) can be explained by a thin layer of sterically stabilizing polyethylene glycol (PEG1000 Da, Flory radius 2.3 nm) which was used to avoid aggregation at this high ionic strength.
On the other hand, in order to quantify the layering, the layering extent (indicated as p value) for the binary nanoparticle mixture is introduced, as shown in eqn (2).
| p = rL2 − rS2 | (2) |
The two typical positions rL and rS for the binary mixture of 80 nm and 130 nm SNPs are indicated in Fig. 2a. The experimental and theoretical values were calculated and shown in Table 1. The agreement between the experimental and theoretical values is quite good (relative deviation of p value: 0.05). The same binary mixture of 80 nm and 130 nm SNPs with a varied number ratio (1/2), ionic strength (5 mM) and total volume (20 μl) were also tested, as shown in Fig. S4 and Table S2 (ESI†). The steady values of p (0.19 ± 0.03 cm2) in these cases demonstrate that the layering effect is repeatable regardless of the number ratio of the binary particles, the total sample volume and the ionic strength (up to 50 mM). The dynamics of the sedimentation process is also briefly illustrated by the two snapshots at time 11 h and 21 h during the sedimentation process. In Fig. 2c and d, a typical concentration bump of the slow sedimenting species (80 nm SNPs) appeared, centripetal to the boundary of the fast sedimenting species (130 nm SNPs) during the sedimentation process. This interesting hydrodynamic phenomenon is known as the Johnston–Ogston27–29 effect (J–O effect), which is due to hydrodynamic interaction between the two sedimenting species during the centrifugation process. The detailed dynamic sedimentation process18,30 may be simulated by Newtonian hydrodynamics.
| Plot | r L 2 (cm2) | r S 2 (cm2) | p (cm2) |
|---|---|---|---|
| Experimental | 49.98 | 49.77 | 0.21 |
| Theoretical | 49.98 | 49.76 | 0.22 |
The effects of relative g-force/centrifugal field strength and particle size ratio are both shown in Fig. 3. In Fig. 3a, when a higher g force was applied with the angular velocity increasing from 1100 rpm to 5000 rpm, both nanoparticles moved closer to the bottom and no obvious layering was found anymore with the p value decreasing to 0.02 cm2 from 0.19 cm2 (the detailed calculation is shown in Table S3, ESI†). The theoretical values of rL2, rS2 and p agreed well with the experimental values while for the concentration gradient profiles, the only discrepancy occurred approaching the bottom. The experimental profile reached a plateau due to the glass transition which was not considered in the BMCLS model. In Fig. 3b, when the particle size ratio decreased slightly from 1.6 to 1.3 (130 nm/80 nm to 130 nm/100 nm), the layering became much less pronounced with the layering extent p value decreasing to 0.07 cm2 from 0.19 cm2. This demonstrates that the size ratio affects strongly the layering. The theoretical calculation also succeeded to predict the layering extent value p very well, as shown in Table S3 (ESI†). Overall, both increasing g-force and decreasing particle size can reduce the layering significantly, which was demonstrated from both experimental and theoretical aspects.
To investigate the effect of the particle surface charge on the layering, two strategies were used: the chargeable surface hydroxyl groups were mostly passivated by reaction with PEG-silane and their charge could be restored by reaction with an amino-silane. From the theoretical calculation,18 lighter (smaller) particles are expected to sink below heavier (bigger) ones when the surface charge of heavier particles is significantly larger than that of the lighter ones. This was achieved experimentally by the introduction of amino groups31 to 130 nm SNPs (the experimental details are shown in SI3, ESI†). In an acidic environment (pH 2 and 3), the remaining hydroxide groups on the silica surface after the PEG-silane reaction were neutralized while the charge of amino groups was tuned by varying acidities (from 10−3 M HCl in Fig. 4a to 10−2 M HCl in Fig. 4b). Therefore, the surface charge of 130 nm SNPs was tuneable while 80 nm SNPs remained neutral (Table S5, ESI†). As shown in Fig. S5 (ESI†), with the increasing acidity, the p value gradually decreases which indicates that the layer of the smaller nanoparticles gradually moves towards the bottom (detailed calculations are shown in Table S4, ESI†). More intriguingly, a situation with ‘reverse’ layering may also occur, as predicted from the theoretical calculation and shown in Fig. 5. When the surface charge number (Z) of the larger nanoparticles is substantially increased (from 200 to 950) and the charge of the smaller ones is kept close to zero, the layering can be reversed which indicates that heavier nanoparticles can float above lighter ones.
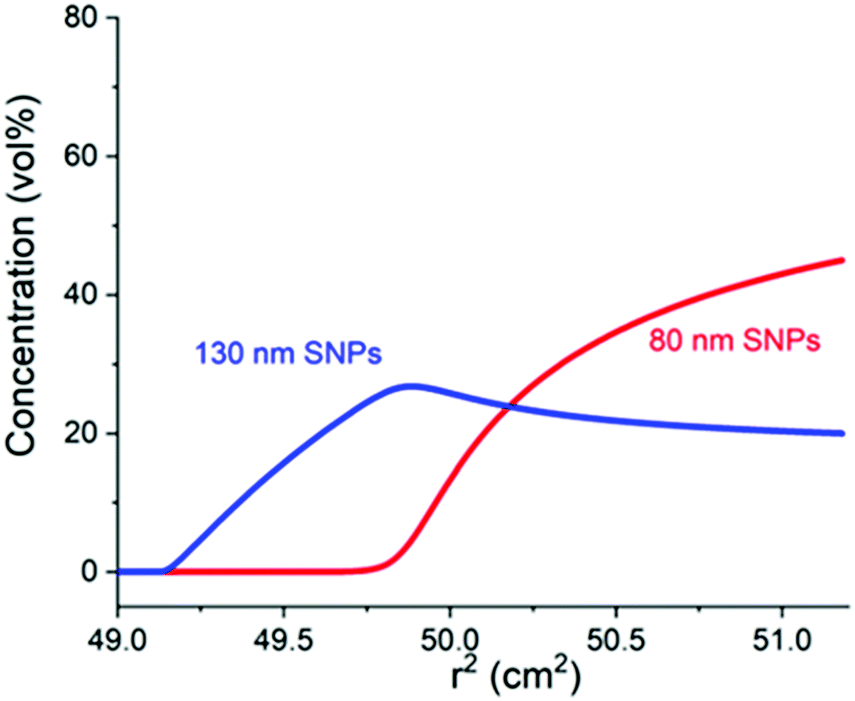 | ||
| Fig. 5 ‘Reverse’ layering predicted by the theoretical calculation. 130 nm SNPs reverse and layer above 80 nm SNPs when the charge of 130 nm SNPs is substantially increased while the charge of 80 nm SNPs remains nearly neutral. | ||
Conclusions
In summary, we showed that bidisperse nanoparticles can be segregated and layered in the sedimentation-diffusion equilibrium due to thermodynamic driving force/lowest system free energy. By applying an accurate equation of state for multicomponent mixtures (of particles of unequal sizes), the layering can be predicted quite well, with the consideration of hard-core excluded volume interactions and electrostatic interactions in addition to gravitational energy.17 The layering was also shown to disappear by applying a stronger g-force or decreasing the size ratio. More interestingly, by tuning the particle surface charge carefully, the layering of lighter nanoparticles is illustrated to be able to move below the heavier nanoparticles. The theoretical calculation even predicts a ‘reverse’ layering when the surface charge of larger nanoparticles is significantly increased. This study can be applied to particle segregation in the dispersions of polydisperse particles, which is very common in research and industry. In addition, the purification of polydisperse particles remains an intriguing topic and this paper may give some hints to use thermodynamic driving force to purify colloidal particles, which is another approach besides to high-speed ultracentrifugation assisted purification due to kinetic driving force.32–34Conflicts of interest
There are no conflicts to declare.Acknowledgements
The authors acknowledge financial support from the EU H2020-MSCA-ITN-2015 project “MULTIMAT” (project no. 676045).References
- R. Brown, J. Inst. Fuel, 1939, 13, 15–23 Search PubMed.
- M. E. Möbius, B. E. Lauderdale, S. R. Nagel and H. M. Jaeger, Nature, 2001, 414, 270 CrossRef PubMed.
- A. Rosato, K. J. Strandburg, F. Prinz and R. H. Swendsen, Phys. Rev. Lett., 1987, 58, 1038–1040 CrossRef PubMed.
- D. A. Huerta and J. C. Ruiz-Suárez, Phys. Rev. Lett., 2004, 92, 114301 CrossRef CAS PubMed.
- A. P. Breu, H.-M. Ensner, C. A. Kruelle and I. Rehberg, Phys. Rev. Lett., 2003, 90, 014302 CrossRef CAS PubMed.
- T. Shinbrot, Nature, 2004, 429, 352–353 CrossRef CAS PubMed.
- C. G. Serrano, J. J. McDermott and D. Velegol, Nat. Mater., 2011, 10, 716–721 CrossRef CAS PubMed.
- H. Cölfen, in Analytical Ultracentrifugation: Techniques and Methods, ed. D. J. Scott and others, Royal Society of Chemistry, Cambridge, UK, 2005, vol. 23, pp. 501–583 Search PubMed.
- X. Xu, T. Franke, K. Schilling, N. A. J. M. Sommerdijk and H. Cölfen, Nano Lett., 2019, 19, 1136–1142 CrossRef CAS PubMed.
- X. Xu and H. Cölfen, ChemPhysChem, 2019, 20, 1799–1803 CrossRef CAS PubMed.
- A. Van Blaaderen and A. Vrij, Langmuir, 1992, 8, 2921–2931 CrossRef CAS.
- N. A. Verhaegh and A. van Blaaderen, Langmuir, 1994, 10, 1427–1438 CrossRef CAS.
- K. Ma, C. Mendoza, M. Hanson, U. Werner-Zwanziger, J. Zwanziger and U. Wiesner, Chem. Mater., 2015, 27, 4119–4133 CrossRef CAS.
- S. Uchiyama, F. Arisaka, W. F. Stafford and T. Laue, Analytical Ultracentrifugation, Springer, Tokyo, 2016 Search PubMed.
- J. Pearson, J. Walter, W. Peukert and H. Cölfen, Anal. Chem., 2018, 90, 1280–1291 CrossRef CAS PubMed.
- H. Zhao, C. A. Brautigam, R. Ghirlando and P. Schuck, Curr. Protoc. Protein Sci., 2013, 71, 20.12.1–20.12.49 CrossRef PubMed.
- P. M. Biesheuvel, J. Phys.: Condens. Matter, 2004, 16, L499–L504 CrossRef CAS.
- E. Spruijt and P. M. Biesheuvel, J. Phys.: Condens. Matter, 2014, 26, 075101 CrossRef CAS PubMed.
- P. Y. Julien, Erosion and sedimentation, Cambridge University Press, 2010 Search PubMed.
- J. E. van der Hoeven, E. B. van der Wee, D. M. de Winter, M. Hermes, Y. Liu, J. Fokkema, M. Bransen, M. A. van Huis, H. C. Gerritsen and P. E. de Jongh, Nanoscale, 2019, 11, 5304–5316 RSC.
- K. Osseo-Asare and F. Arriagada, Colloids Surf., 1990, 50, 321–339 CrossRef CAS.
- H. Giesche, J. Eur. Ceram. Soc., 1994, 14, 189–204 CrossRef CAS.
- G. Bryant, S. R. Williams, L. Qian, I. Snook, E. Perez and F. Pincet, Phys. Rev. E, 2002, 66, 60501 CrossRef CAS PubMed.
- C. P. Royall, W. C. Poon and E. R. Weeks, Soft Matter, 2013, 9, 17–27 RSC.
- M. N. van der Linden, D. El Masri, M. Dijkstra and A. van Blaaderen, Soft Matter, 2013, 9, 11618–11633 RSC.
- P. N. Pusey and W. van Megen, Nature, 1986, 320, 340–342 CrossRef CAS.
- A. Soda, T. Fujimoto and M. Nagasawa, J. Phys. Chem., 1967, 71, 4274–4281 CrossRef CAS.
- J. J. Correia, M. L. Johnson, G. H. Welss and D. A. Yphantis, Biophys. Chem., 1976, 5, 255–264 CrossRef CAS PubMed.
- J. P. Johnston, H. C. Longuet-Higgins and A. G. Ogston, Trans. Faraday Soc., 1945, 41, 588–593 RSC.
- J. K. G. Dhont, J. Phys. Chem., 2004, 120, 1632–1641 CrossRef CAS PubMed.
- K. N. Pham, D. Fullston and K. Sagoe-Crentsil, Aust. J. Chem., 2007, 60, 662–666 CrossRef CAS.
- G. Chen, Y. Wang, L. H. Tan, M. Yang, L. S. Tan, Y. Chen and H. Chen, J. Am. Chem. Soc., 2009, 131, 4218–4219 CrossRef CAS PubMed.
- X. Sun, S. M. Tabakman, W. S. Seo, L. Zhang, G. Zhang, S. Sherlock, L. Bai and H. Dai, Angew. Chem., Int. Ed., 2009, 48, 939–942 CrossRef CAS PubMed.
- P. Qiu and C. Mao, Adv. Mater., 2011, 23, 4880–4885 CrossRef CAS PubMed.
Footnote |
| † Electronic supplementary information (ESI) available. See DOI: 10.1039/d0sm00588f |
| This journal is © The Royal Society of Chemistry 2020 |