 Open Access Article
Structured randomness: jamming of soft discs and pins
Prairie
Wentworth-Nice†
a,
Sean A.
Ridout
 b,
Brian
Jenike
a,
Ari
Liloia
a and
Amy L.
Graves
 *a
*a
aDepartment of Physics and Astronomy, Swarthmore College, Swarthmore, PA 19081, USA. E-mail: abug1@swarthmore.edu; Fax: +01 610 328 7895; Tel: +01 610 328 8257
bDepartment of Physics and Astronomy, University of Pennsylvania, Philadelphia, PA 19104, USA
First published on 26th May 2020
Abstract
Simulations are used to find the zero temperature jamming threshold, ϕj, for soft, bidisperse disks in the presence of small fixed particles, or “pins”, arranged in a lattice. The presence of pins leads, as one expects, to a decrease in ϕj. Structural properties of the system near the jamming threshold are calculated as a function of the pin density. While the correlation length exponent remains ν = 1/2 at low pin densities, the system is mechanically stable with more bonds, yet fewer contacts than the Maxwell criterion implies in the absence of pins. In addition, as pin density increases, novel bond orientational order and long-range spatial order appear, which are correlated with the square symmetry of the pin lattice.
1 Introduction
Over two decades ago, it was first proposed1–3 that soft and granular materials can have a jammed, solid phase, which forms at sufficiently high packing fraction or pressure, and sufficiently low shear and temperature. Now, much is known about materials in the vicinity of the zero-temperature jamming threshold, “Point J”; not only for simple models like soft or hard repulsive, frictionless spheres,4–7 but for particles which are non-spherical,8–12 have rough and/or frictional surfaces,13,14 are confined within various wall geometries15–17 and even active matter18–20 (including work on active matter in the presence of fixed obstacles21). For frictionless soft spheres, a mixed first-second order phase transition, with upper critical dimension of d = 2 occurs6,22–24 at a maximally random close packing fraction (MRP). Near Point J, there are diverging length scales25–29 and universal critical exponents for quantities like contact number, static and dynamical length scales, characteristic phonon frequency, and shear viscosity below the transition6,22,30–33 – while exponents for elastic moduli depend on microscopic details like inter-particle potential.4,22 (A scaling relation for elastic energy has been shown to unify our understanding of the various critical exponents above the jamming transition.34) At zero temperature and shear, the critical density ϕj represents a state of marginal stability, where according to Maxwell's counting argument, the number of inter-particle contacts equals the number of unconstrained degrees of freedom. For d = 2, this situation of isostaticity, given translational invariance and a positive bulk modulus, implies23 that the average number of contacts experienced by one of N particles is Zc = 4 − 2/N.How then, will this maximally random, marginally stable structure be altered if particles are, in part, supported by elements internal to the system? For the case of quenched disorder via randomly-placed attractive sites, it was proposed35 that disorder constitutes a fourth axis of the phase diagram… altering the position of ϕj, as well as introducing a new critical threshold ϕp for the pinning of the flow of particles under an applied force. (Because flow has been shown to be impeded both by attractive35 and repulsive obstacles,36–38 there is some leeway as to whether one uses the term “pinned” or “clogged” to describe the state of arrested particle flow, with its distinctive heterogeneous geometry and time lag over which the flow comes to a halt. For both types of obstacle, the state of arrested flow becomes a true jammed state in the limit of large packing fractions.37) Two different protocols for freezing particle positions as the jammed solid forms have been studied in ref. 39. One protocol produces over-coordinated systems, a consequence being qualitative changes in the characteristic frequency of soft modes, linked to the length scale above which a system is hyperstatic.25 Applications to separation and sorting benefit from understanding flow in the presence of pinning sites.40 Moreover, periodic arrangements of pins add an element of symmetry which can lead to predictable trends in kinematics studies, like the reduction of friction that accompanies kink propagation in driven colloidal solids41 or directional locking in clogging simulations.36,42 Here, as in those references, we study periodically placed pins. Our pins are diminutive and softly repulsive, serving only to exclude volume.
Our goal in this paper is to identify the jamming transition and explore structural features of the jammed solid as a function of the ratio of the number of pins to particles, nf. In Section 3.1, we find the T = 0 jamming probability, P(ϕ) vs. ϕ, for various values of nf. From that probability distribution function, we calculate a jamming threshold, ϕj(nf), which is a decreasing function of nf. Once unsupported particles (“rattlers”) are removed, ϕj(nf) decreases even more dramatically. A comparison with randomly distributed pins, suggests that having an appreciable ratio of particle size to pin separation is important in determining whether the geometry of the pin lattice affects the detailed shape of ϕj(nf). In Section 3.2 we calculate structural quantities, beginning with the probability distribution of bond angles, P(θ). There is a transition from a uniform distribution to one with fourfold symmetry, again occurring when the ratio of particle size to pin separation is appreciable. A numerical solution seems a necessary evil, in order to predict the intricately detailed substructure in P(θ) which arises from the bidispersity of particle sizes, packing amid pins. We then discuss the pair correlation function g(r) and scattering function S(![[k with combining right harpoon above (vector)]](https://www.rsc.org/images/entities/i_char_006b_20d1.gif) ) with
) with ![[k with combining circumflex]](https://www.rsc.org/images/entities/i_char_006b_0302.gif) referred to lattice symmetry axes. Both bond angles and pair correlations reveal how pins impose order, whose character and magnitude can be tuned via the density of pins. In Section 3.3, we calculate contact statistics – concluding that pins support a jammed system with fewer contacts between particles, and fewer contacts overall. We might think of jamming in the presence of a square lattice of pins as not only possessing a modicum of order, but as “parsimonious”, requiring fewer particles, each one requiring fewer contacts, in order to form a rigid solid.
referred to lattice symmetry axes. Both bond angles and pair correlations reveal how pins impose order, whose character and magnitude can be tuned via the density of pins. In Section 3.3, we calculate contact statistics – concluding that pins support a jammed system with fewer contacts between particles, and fewer contacts overall. We might think of jamming in the presence of a square lattice of pins as not only possessing a modicum of order, but as “parsimonious”, requiring fewer particles, each one requiring fewer contacts, in order to form a rigid solid.
2 Methods
M pins are placed on a square lattice in a 1 × 1 simulation cell with periodic boundary conditions. N = Nl + Ns large and small particles are introduced at random locations, using a uniform random number generator. The initial packing fraction is thus ϕ = Nsπrs2 + Nlπrl2 with Ns = Nl and rl/rs = 1.4, a fraction of large-to-small particles and size ratio that previous studies have found optimal in two dimensions, to inhibit the formation of a regular, hexagonal lattice.28 Pin radii rpin are much smaller than those of particles; rpin = rs/1000, and variation around this value had a negligible effect on results. An alternative model would feature pins as point, geometric constraints. Our choice had no discernible drawbacks, and endowed the code with practical advantages: permitting one to test different pin–particle interactions, and change the mobile vs. fixed status of pins at an intermediate point in the simulation, as had been fruitfully done in previous studies.39,43 All particles in our system are soft disks, with a short range harmonic interaction potential given by | (1) |
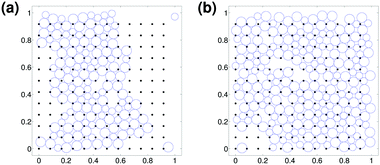
The simulation halts when a chosen tolerance for changes in the gradient of the energy is reached. Near the jamming threshold, this energy is typically less than 10−6 of the energy scale for a single pair interaction. For the data discussed below, we not only assert that particles in a jammed solid are mechanically stable, but we ask that the system “percolates”, so that there is a connected path between box top and bottom sides, and between left and right sides. This criterion is not needed in the absence of pins, when mechanical stability occurs only if the system percolates. It is, however, a needed criterion in systems in which a short-ranged attraction between jammed particles permits the creation of non-spanning rigid clusters.49,50Fig. 1a and b illustrate two final configurations in a system with M = 144, hence a = 0.0833. This is sufficiently close to the particle size (rs = 0.0260382) that, at jamming, equilibration may result in situations like Fig. 1a, where no cluster of non-rattlers spans the system from left to right. At the highest pin density discussed below, approximately 1/4 of jammed configurations fail to percolate. Non-percolating equilibrated configurations like Fig. 1a were excluded from further analysis.
In our work, two protocols were examined, and the second was adopted for results shown in Fig. 3 and beyond. At issue is the state space controlled by three parameters: N, ϕ, and M which cannot be neatly collapsed. Suppose one utilizes a simulation cell of fixed size, with a fixed number of particles, N and pins M. In this “first protocol”, ϕ is varied by changing rs. This may be repeated for larger values of N, and finite-size scaling (FSS) arguments applied in order to extrapolate to the N → ∞ limit. However, the pin lattice introduces an additional length scale,  . The protocol just described involves changing the ratio rs/a as one scans through ϕ values in order to locate ϕj. If one suspects that the ratio of particle size to pin separation is a meaningful control parameter, one seeks a different approach. Thus, we employed a “second protocol”: rs is fixed and N is varied in order to vary ϕ in the neighborhood of ϕj. The range of N values does not need to be large (less than 10% for any value of M in the current study) in order to span the phase transition.
With either protocol (rather than one where the system is relaxed from an initially overjammed configuration) sometimes the minimization procedure is not precise enough to identify a very slightly unstable configuration as such. Thus, we discard a very small fraction (less than 1%) of configurations with an insufficient number of bonds, Niso, required to satisfy the number of degrees of freedom. These must necessarily have zero vibrational frequency modes, and be unstable. In packings without pins, we have checked that this criterion perfectly identifies a group of packings which also have unusually high energies and zero (or negative) bulk moduli.
3 Results
3.1 Jamming probability
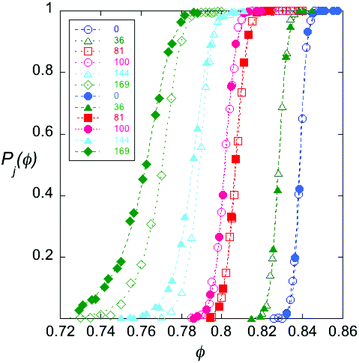
We examine the jamming transition by calculating Pj(ϕ), the probability of jamming as a function ϕ for different system sizes N, and different numbers of pins, M. A sigmoidal fitting form which estimates the center, ϕj, and width, w is: | (2) |
Fig. 2 and Table 1 illustrate that the two protocols yield consistent results for Pj in the limit of small M. However, there is a difference in the two protocols for the densest pin lattices. As M becomes comparable to N, the second protocol (which preserves the ratio of a to the particle size) yields a lower ϕj, and also yields a transition which becomes steadily wider as M increases. Unless otherwise noted, data discussed henceforth were calculated with the second protocol.
| Number of pins | Second protocol ϕj, w | First protocol ϕj, w |
|---|---|---|
| M = 0 | 0.838 ± 1, 0.0018 ± 2 | 0.838 ± 1, 0.0020 ± 2 |
| M = 36 | 0.828 ± 1, 0.0022 ± 2 | 0.828 ± 1, 0.0022 ± 2 |
| M = 64 | 0.820 ± 1, 0.0022 ± 2 | 0.8208 ± 1, 0.0022 ± 2 |
| M = 81 | 0.807 ± 1, 0.0027 ± 2 | 0.8078 ± 1, 0.0028 ± 2 |
| M = 100 | 0.802 ± 1, 0.0028 ± 2 | 0.802 ± 1, 0.0028 ± 2 |
| M = 144 | 0.787 ± 1, 0.0036 ± 3 | 0.790 ± 1, 0.0025 ± 3 |
| M = 169 | 0.766 ± 2, 0.0046 ± 4 | 0.773 ± 2, 0.0033 ± 3 |
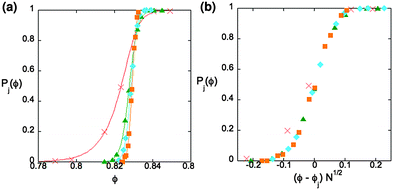
As with other phase transitions, FSS allows one to approach the limit N → ∞ systematically to infer critical properties. Fig. 3a and b show that for the same value of nf, P(ϕ) for different N can be collapsed onto one scaling curve, just as would be true without pins.23,24,51![[thin space (1/6-em)]](https://www.rsc.org/images/entities/char_2009.gif) ‡ Here, one plots Pj as a function of the rescaled distance to the critical point: (ϕ − ϕj(N,nf))N1/2. (Though N values vary slightly with this protocol, nf ≈ 0.14 is constant to two significant figures for the data shown.) The rescaling exponent 1/2 is determined from the width at half maximum of the distribution of jamming thresholds.4 At the smallest size N = 64 it is not surprising that this procedure, sans corrections to scaling, will fail.4,52
‡ Here, one plots Pj as a function of the rescaled distance to the critical point: (ϕ − ϕj(N,nf))N1/2. (Though N values vary slightly with this protocol, nf ≈ 0.14 is constant to two significant figures for the data shown.) The rescaling exponent 1/2 is determined from the width at half maximum of the distribution of jamming thresholds.4 At the smallest size N = 64 it is not surprising that this procedure, sans corrections to scaling, will fail.4,52
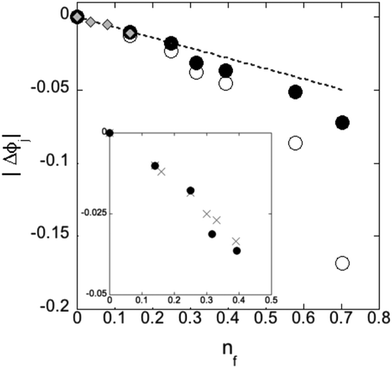
Studies of jamming in which a fraction particles are immobilized have been unanimous in observing a reduction in the jamming threshold. While in previous studies obstacles were slightly larger38 or on par with the size28,36,37,39 of particles, our pins make a negligible contribution to the volume fraction. Perhaps this makes the decrease in ϕj in Fig. 4 less surprising than in previous studies, for in the limit of low pin densities, pins support rigidity without adding volume. Nevertheless, at higher densities, the geometry of the pin lattice may not only generate order (see Section 3.2) but adjacent pin proximity may interfere with the formation of a jammed solid.§
The inset to Fig. 4 provides a comparison between the square pin lattice and an additional geometry: pins placed at random positions in the simulation cell, which has appeared in both experimental work on paramagnetic colloids being driven around silica obstacles38 and simulations.28,37,39 As one might expect, the inset shows agreement between the two geometries in the dilute pin limit.
It has been argued35,51 that jamming occurs when the inter-pin separation is equal to the correlation length, ξ ∼ (ϕ − ϕj)−ν. Thus one would predict that in d dimensions, pins will lower the jamming threshold by the amount:
| Δϕj(nf) ≡ ϕj(nf) − ϕj(0) ∝ nf1/dν | (3) |
 , the accepted value for spherical, repulsive particles in the absence of friction.1,7Fig. 4 suggests that for nf ≤ 0.25, the data is approximately linear; a power law fit yields |Δϕj(nf)| ∝ nαf with α = 0.91 and α = 0.95 ± 0.10 for N = 256, 1024 respectively. If we assume that α = 1 (linear fit) the slope is
  for N = 256, 1024 respectively. The slope value is seen to depend on the details of the interaction between particles and obstacles.35,37,51 More importantly, deviation of the data in Fig. 4 from linearity at higher nf suggest that sufficiently dense, ordered pins do more than single out the correlation length of a highly random packing.
The thresholds for square and random lattices both deviate from linearity and begin to disagree with one another occurs at approximately nf = 0.28. The answer to “Why this density?” seems to incorporate the ratio of pin size to typical inter-pin spacing, rs/a:
 | (4) |
| rs/a = 0.39 n0.46f. | (5) |
Since ϕj is traditionally pitched as a critical initial packing fraction, one may also ask about the final packing fraction after removal of particles which do not alter the mechanical stability (or percolation) of the system. The open circles in Fig. 4 show the final volume fraction, after one eliminates these rattlers. As M increases, so does the volume of rattlers at ϕj, leading to a dramatically smaller packing fraction of particles needed for rigidity. A technological benefit of creating a jammed solid supported by pins would be a less dense material. Below, we show that there is an onset of both local (bond) and global (positional) ordering as the pin lattice density increases. This suggests an additional benefit: the ability of pins to induce elastic and transport properties which are anisotropic and adjustable.
3.2 Angular and spatial ordering
Two particles whose radii overlap can be thought of as sharing a “bond”, oriented in the direction between the particle centers. The geometry of the bond network is central to the theory of jamming; controlling the fragility of the jammed state, elastic properties, the phonon spectrum, scaling exponents, and evolving in response to compression and shear.2,54,55 The angle formed by a pair of bonds which carry the largest forces reveals a distribution which supports the picture of “force chains”.53,56 In the presence of pins, we must first ask a more basic question about individual bonds: are these isotropically distributed in angle space? To capitalize on the comparison of square and random pin lattice, we will answer this question in terms of the variable rs/a; which can be mapped back to nf at the jamming threshold viaeqn (5). Fig. 5 compares the distribution of bond angles with N ≈ 256 systems for various pin densities. One sees the distribution become progressively more anisotropic as M increases. The distribution of bonds P(θ) has fourfold symmetry as one expects given a square pin lattice. (Fig. 5 only shows angles in the range θ ∈ [0,π/2]; bonds with θ ∈ [π/2,π] are averaged with the data shown.) The reflection symmetry about θ = π/4 is clear.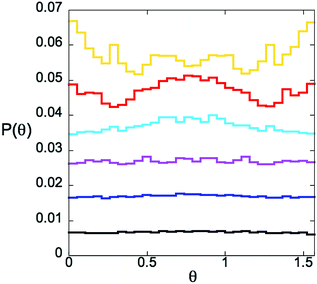 | ||
| Fig. 5 Histograms proportional to the probability P(θ), that a bond makes angle θ with the x-axis. Each data set corresponds to the system parameters closest to the fraction at jamming ϕj from sigmoidal fits, and given (Table 1). Different numbers of pins M corresponding to different size ratios at jamming rs/a are shown in black: M = 0, rs/a = 0; dark blue: M = 36, rs/a = 0.158; purple: M = 81, rs/a = 0.234; light blue: M = 100, rs/a = 0.260; red: M = 144, rs/a = 0.312; and yellow: M = 169, rs/a = 0.338. Histograms for successive parameter values are displaced from each other vertically by 0.01 for ease of viewing. | ||
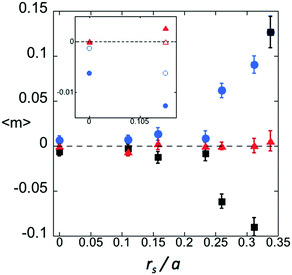
Fig. 6 shows the order parameter 〈m〉 ≡ 〈ei4θ〉 for N ≈ 256 systems. The magnitude of the real part of this order parameter, given the choice of axes, is approximately equal to |〈m〉|. Apparently, an angular ordering transition occurs somewhere between rs/a = 0.23 and 0.26; in good agreement with the density at which the threshold, in the previous section, shows evidence of being affected by the pin lattice geometry. While |〈m〉| continues to increase above the transition, note the change in sign of Re〈m〉 at the densest lattice studied (yellow curve in Fig. 5) which correlates with the change in the most-probable bond angle from θ = π/4 for less dense lattices, to θ = 0,π. While it appears that 〈m〉 is nonzero for all values of M > 0 studied, this may be a finite-size effect having to do with the square simulation cell with periodic boundary conditions, which creates a slight amount of ordering even for M = 0.53 As a check on this, the inset of the figure shows both N = 256 and 1024 data for rs/a = 0, 0.167. For the larger system (open symbols) the order parameter is significantly closer to zero. The T = 0 jamming transition constitutes an out-of-equilibrium, phase transition. Nevertheless, the abrupt increase in |〈m〉| with cubatic ordering from pins is reminiscent of a phase transition, such as the isotropic to nematic transition in uniaxial liquid crystals in the presence of an orienting field.57 Statistical ensemble ideas have successfully described jamming58 and perhaps will allow one to map out a bond ordering transition using pin density as a control parameter.
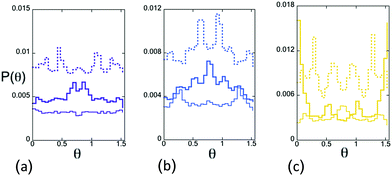
A bidisperse distribution results in particle-size-dependent preferences for certain bond angles. Thus, detailed features of P(θ) in Fig. 5 can be traced to bonds between particles of specific sizes, as exemplified in Fig. 7. The large–large bonds tend to be oriented near θ = π/4 for M = 81, 100; however a couple of other favorable orientations appear as side peaks in Fig. 7a and b. At the highest pin density studied, M = 169 of Fig. 7c, large–large bond probabilities have a peak at approximately θ = π/6, 2π/3 (also true for M = 100) but the most probable orientation is horizontal or vertical. In contrast, at this pin density, the small–small bond angles have a preferred orientation of θ = π/4. Small–small bonds show little orientational structure at M = 81, and at M = 100 are most likely to be oriented at θ = π/12, 5π/12; coinciding with one set of large–large bond peaks. Large–small bond probabilities have, for M = 81 a small local maximum at θ = π/4. But it is overshadowed by peaks at other angles, present for all three M values in Fig. 7. The take home message is that the details of the bond angle distribution depend in an intricate way on particle sizes rs, rl and pin separation, a. It is worth noting that there is only a slight degree of particle size segregation; whether same-sized or differently-sized particles are more likely to share a contact varies only slightly with M. Segregation is largest at M = 169, where differently-sized particle contacts exceed same-sized ones by 4%.
The pair correlation function between particle centers, g(r) with rs = 0.0133, and rl = 0.0186 is shown in Fig. 8 for N = 1024 particles – with zero pins (blue) and M = 144 pins (red), so that a = 0.0833. (As in the inset of Fig. 6, N = 1024 is utilized here to lessen the finite-size effects on structure, and distinguish them from the effect of pins.53) At the modest pin density nf = 0.141, Fig. 8a indicates that pins do not dramatically change g(r) at distances r which are within the first few “solvation shells” of a reference particle. Structure related to the bidisperse system is visible; for example, the first three peaks correspond to r ≈ 2rs, rs + rl, and 2rl. However, as seen in Fig. 8b, pins are responsible for the persistence of this order across the simulation cell. These regular oscillations in g(r) have a spatial period of 0.030 ± 0.005, the typical separation between neighboring particles. These oscillations feature an amplitude modulation, which can be explained by the superposition of contacts at large–large, large–small, and small–small contact distances: 0.037, 0.032, 0.027. The width of the “beat pattern” of three such superposed sinusoids is quite comparable to the value of 0.20, seen in Fig. 8b.
 | ||
| Fig. 8 Pair correlation function, g(r) for N = 1024 particles at the jamming threshold. Blue symbols: M = 0. Red symbols: M = 144, nf = 0.141. | ||
Structure seen in g(r) carries over into its Fourier transform, S(k). Moreover, S(![[k with combining right harpoon above (vector)]](https://www.rsc.org/images/entities/i_char_006b_20d1.gif) ) for vector
) for vector ![[k with combining right harpoon above (vector)]](https://www.rsc.org/images/entities/i_char_006b_20d1.gif) reveals any long range order in structurally-relevant directions. For a perfect square lattice, these directions would simply be all integers [hl]. We define a normalized scattering intensity as this structure factor:
reveals any long range order in structurally-relevant directions. For a perfect square lattice, these directions would simply be all integers [hl]. We define a normalized scattering intensity as this structure factor:
 | (6) |
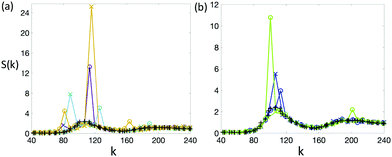
The structure factor S(![[k with combining right harpoon above (vector)]](https://www.rsc.org/images/entities/i_char_006b_20d1.gif) ) ≡ S(k) for zero pins is shown with + symbols in Fig. 9, while circles in Fig. 9a and b depict S(k10) where kx = k, ky = 0 and crosses depict S(k11), where
) ≡ S(k) for zero pins is shown with + symbols in Fig. 9, while circles in Fig. 9a and b depict S(k10) where kx = k, ky = 0 and crosses depict S(k11), where  . Colors indicate M values. Discretization due to the periodic boundaries of the 1 × 1 simulation cell restricts the resolution in k space to Δk = 2π. The horizontal scale is chosen to focus on the region relevant to the first couple of “solvation shells”. A peak from particles separated by precisely 2rs, rs + rl or 2rl along each lattice direction would fall roughly at k = 121, 101 or 86. The main message of Fig. 9 is the existence of lattice-induced peaks which are correlated with the positions of pins. Were it simply the case that particles took on the crystalline symmetry of a perfect square, peaks would fall at the reciprocal lattice vectors kx = nΔk, ky = mΔk with n,m integers. Small amounts of positional disorder and finite size effects from simulation would result in recognizable modulation of peak heights and widths.59 For our finite system the peaks for n = m = 1 and n = 1, m = 0 would be equal in height. With pins, S(
![[k with combining right harpoon above (vector)]](https://www.rsc.org/images/entities/i_char_006b_20d1.gif) ) is neither that of an isotropic system, nor a square crystal with positional disorder. In Fig. 9, discrete peaks rise from the isotropic background. The height of the tallest peak increases as the pin density increases.
) is neither that of an isotropic system, nor a square crystal with positional disorder. In Fig. 9, discrete peaks rise from the isotropic background. The height of the tallest peak increases as the pin density increases.
All of the peaks in Fig. 9a have this in common: they signify particles whose separation, projected onto the direction of ![[k with combining right harpoon above (vector)]](https://www.rsc.org/images/entities/i_char_006b_20d1.gif) , is half of the inter-pin spacing. This reflects the compromise which particles make to close-pack while avoiding pins with the chosen separation. For M = 81, a = 0.111: the large peak (circle) at k = 113, has 2π/k = a/2. The much smaller peak (cross) at k = 80 implies
, is half of the inter-pin spacing. This reflects the compromise which particles make to close-pack while avoiding pins with the chosen separation. For M = 81, a = 0.111: the large peak (circle) at k = 113, has 2π/k = a/2. The much smaller peak (cross) at k = 80 implies  . For M = 100, a = 0.1: again one sees two per unit cell in both horizontally and diagonally. For M = 169, a = 0.0769: the dominant peak (cross) at k = 115.5 indicates two particles per lattice unit cell projected diagonally.
At the pin densities shown in Fig. 9a, a pair of bidisperse particles, in contact but non-overlapping, do not in general “fit” within an a × a square region with pins at its four vertices. Analyzing these data presents an enormously complicated packing problem, even if only particle pairs are considered. One speculates that such packing constraints drive the qualitative shift from ordering in the horizontal or vertical directions, to ordering along a diagonal in the lattice. On the other hand, the trend shown in Fig. 7 for bond angles is opposite, with a bond probability density maximum at θ = 45° at lower pin densities, which has shifted to θ = 0 at higher densities. Local bond and long-range positional order are, broadly speaking, two distinct results of the pin lattice.
Supporting this notion is the fact that the more dilute pin lattices are also able to promote long-range positional order. This is seen both in Fig. 8 and in Fig. 9b, which depicts the two lowest pin-densities studied. These have no significant bond order according to Fig. 6. In Fig. 9b for M = 36, a = 0.167: the peak (circles) at k = 113.09 gives 2π/k = 0.0556 = a/3. The naïve picture is one of three particles spanning a lattice unit cell horizontally (or vertically). The peak (crosses) at k = 106.6292 implies  , leading to a naïve picture of four particles spanning the diagonal of the lattice unit cell. For M = 64, a = 0.125: there is no evidence of lattice-induced structure (crosses) in the 45° direction. However, a large peak (circle) at k = 100.5 implies structure in the horizontal (or vertical) direction with period 2π/k = 0.0625 = a/2.
The take-away is that the order produced by the pins stems from the intricate details of packing of bidisperse particles among them. There is every reason to assume S(![[k with combining right harpoon above (vector)]](https://www.rsc.org/images/entities/i_char_006b_20d1.gif) ) in lattice directions other than 0° or 45° will yield additional structural features, arising from the detailed way that particles pack among the pins. For the two lattice directions studied above, local bond order and global spatial order don’t transparently reinforce each other. For example, no type of M = 81 bond pair shows a preference for θ = 0, while Fig. 9a shows its most dramatic peak in that lattice direction.
) in lattice directions other than 0° or 45° will yield additional structural features, arising from the detailed way that particles pack among the pins. For the two lattice directions studied above, local bond order and global spatial order don’t transparently reinforce each other. For example, no type of M = 81 bond pair shows a preference for θ = 0, while Fig. 9a shows its most dramatic peak in that lattice direction.
3.3 Contact statistics
How do pins affect a particle's average contact number, Z? In what follows, the subscript “pp” denotes a contact between particles and “pf” denotes contact between a particle and a fixed pin. It is obvious that Zpp is reduced by pins for a given value of ϕ. A particle stabilized by a pin might touch as few as two other particles and contribute to the rigid solid. It is not as obvious how Z should vary with M. Fig. 10 shows the probability P for a particle to have z contacts, evaluated at the configuration-averaged jamming threshold ϕj(M). Increasing M at the jamming threshold will shift both distributions to the left, toward smaller number of contacts. As Fig. 11 below shows, both Z and Zpp decrease as pin density increases. These results have technological consequences: a conductive jammed solid stabilized by pins may be expected to have a lower conductivity, higher individual bond strengths, lower yield strength, and different elastic moduli from its pin-free counterpart.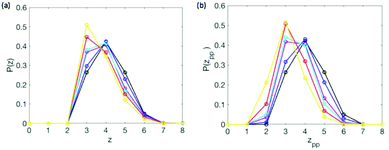 | ||
| Fig. 10 Probability that particle has z contacts at ϕ = ϕj(M) (see Table 1). Colors correspond to M as in earlier figures. (a) All contacts; (b) only particle–particle contacts. | ||
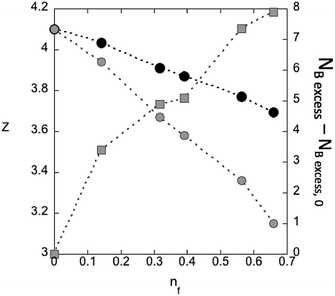 | ||
Fig. 11 Typical number of contacts per particle. Black circles: all types of contacts, Z, grey circles: particle–particle contacts, Zpp, grey squares: NB![[thin space (1/6-em)]](https://www.rsc.org/images/entities/char_2009.gif) excess − NB excess − NB![[thin space (1/6-em)]](https://www.rsc.org/images/entities/char_2009.gif) excess,0. excess,0. | ||
The traditional Maxwell counting argument23 asserts that frictionless, spherical particles require a minimum of NB![[thin space (1/6-em)]](https://www.rsc.org/images/entities/char_2009.gif) iso = dN − qd + 1 bonds. The second term in this definition arises from d zero modes associated with global translations, while the third term ensures a positive bulk modulus. Here, q = 1 without pins, but q = 0 if even one pin is present, as our equilibration protocol breaks translational symmetry.51 Say that the total number of bonds is NB = Npp + Npf. The number of excess bonds between particles is found via a generalized isostaticity criterion:39
iso = dN − qd + 1 bonds. The second term in this definition arises from d zero modes associated with global translations, while the third term ensures a positive bulk modulus. Here, q = 1 without pins, but q = 0 if even one pin is present, as our equilibration protocol breaks translational symmetry.51 Say that the total number of bonds is NB = Npp + Npf. The number of excess bonds between particles is found via a generalized isostaticity criterion:39
NB![[thin space (1/6-em)]](https://www.rsc.org/images/entities/char_2009.gif) excess ≡ NB − NB excess ≡ NB − NB![[thin space (1/6-em)]](https://www.rsc.org/images/entities/char_2009.gif) iso = Npp + Npf − dN + qd − 1. iso = Npp + Npf − dN + qd − 1. | (7) |
![[thin space (1/6-em)]](https://www.rsc.org/images/entities/char_2009.gif) iso. In the presence of pins it is no longer true that one can write Ziso ∝ NB
iso. In the presence of pins it is no longer true that one can write Ziso ∝ NB![[thin space (1/6-em)]](https://www.rsc.org/images/entities/char_2009.gif) iso, as Npp bonds stabilize two particles, and Npf bonds stabilize only one.
iso, as Npp bonds stabilize two particles, and Npf bonds stabilize only one.
Hyperstaticity, by which one means NB > Niso, is expected in certain cases, such as frictional particles,13 or those with attractive interactions.49,50 We see increasing hyperstaticity with nf, reminiscent of previous work with frozen particles39 as well as in bidisperse mixtures in which the ratio of small to large radii is varied.60 Unfortunately, even at nf = 0, the number of excess bonds NB![[thin space (1/6-em)]](https://www.rsc.org/images/entities/char_2009.gif) excess,0 is greater than zero. This is a consequence of fixing rs/a for a set of initial conditions, thus averaging over configurations at various distances from their individual jamming points. (As one might hope, this fraction of excess bonds is independent of the system size, N.) Squares in Fig. 11 shows the difference between the number of excess bonds at finite nf and at nf = 0.
excess,0 is greater than zero. This is a consequence of fixing rs/a for a set of initial conditions, thus averaging over configurations at various distances from their individual jamming points. (As one might hope, this fraction of excess bonds is independent of the system size, N.) Squares in Fig. 11 shows the difference between the number of excess bonds at finite nf and at nf = 0.
Though NB![[thin space (1/6-em)]](https://www.rsc.org/images/entities/char_2009.gif) excess increases with nf, the number of excess bonds per pin is found to decrease:
excess increases with nf, the number of excess bonds per pin is found to decrease:
NB![[thin space (1/6-em)]](https://www.rsc.org/images/entities/char_2009.gif) excess − NB excess − NB![[thin space (1/6-em)]](https://www.rsc.org/images/entities/char_2009.gif) excess,0 ∼ nβf; β = 0.61 ± 0.07 excess,0 ∼ nβf; β = 0.61 ± 0.07 | (8) |
4 Conclusions
Introducing a square lattice of pin-like obstacles to systems of bidisperse particles provide a parsimonious route to jamming. The threshold ϕj decreases and fewer contacts are needed for stability as the density of pins increases. ϕj decreases linearly at low pin densities, and more steeply at higher densities. This change in behavior occurs in a regime where the volume per particle is comparable to the volume per pin. There are additional, detailed changes in the structure of the jammed system as pin density increases. The distribution of bond angles becomes increasingly anisotropic and we see a transition in a cubatic order parameter. The bond angle distribution exhibits fourfold symmetry, consistent with the presence of pins in a square lattice, but with details that depend sensitively on the packing of bidisperse particles among pins of a given density. The presence of oscillations in the pair correlation function suggests long-range spatial ordering in the system. Peaks in the structure factor arise, locked to the spatial frequency of the pin lattice. In general, the axes along which there is long-range spatial order need not correspond to directions of preferred bond angles. This supports the notion that long-range, spatial ordering can be considered separately from local, bond ordering. Both are consequential when the pin separation is on the order of the particle size.Conflicts of interest
There are no conflicts to declare.Acknowledgements
We thank Tristan Cates, Carl Goodrich, and M. Lisa Manning for invaluable technical contributions. We thank Cacey Bester, Peter Collings, Randall Kamien, Andrea Liu, Cynthia Olson Reichhardt, Daniel Sussman, Brian Utter, and Katharina Vollmayr-Lee for their comments and insights. This material is based upon work supported by the National Science Foundation under Grant No. DMR-1905474. Acknowledgement is made to the Donors of the American Chemical Society Petroleum Research Fund for partial support of this research. We are grateful to Swarthmore College's Provost, Division of Natural Sciences, and Individual Donors. A. L. Graves is grateful for a Michener Sabbatical Fellowship. S. A. Ridout has been supported by PGS-D fellowship from NSERC and the Simons Foundation Cracking the Glass Problem Collaboration award No. 45494 to Andrea J. Liu.Notes and references
- D. Durian, Phys. Rev. Lett., 1995, 75, 4780 Search PubMed.
- M. E. Cates, J. P. Wittmer, J. P. Bouchaud and P. J. Claudin, Phys. Rev. Lett., 1998, 81, 1841 CrossRef CAS.
- A. J. Liu and S. R. Nagel, Nature, 1998, 396, 21 CrossRef CAS.
- C. S. O’Hern, L. E. Silbert, A. J. Liu and S. R. Nagel, Phys. Rev. E: Stat., Nonlinear, Soft Matter Phys., 2003, 68, 011306 CrossRef PubMed.
- P. Olssen and S. Teitel, Phys. Rev. Lett., 2007, 99, 178001 CrossRef PubMed.
- A. J. Liu and S. R. Nagel, Annu. Rev. Condens. Matter Phys., 2010, 1, 347 CrossRef.
- A. O. N. Siemens and M. van Hecke, Physica A, 2010, 389, 4255 Search PubMed.
- A. Donev, R. Connelly, F. H. Stillinger and S. Torquato, Phys. Rev. E: Stat., Nonlinear, Soft Matter Phys., 2007, 75, 051304 Search PubMed.
- M. Mailman, C. F. Schreck, C. S. O’Hern and B. Chakraborty, Phys. Rev. Lett., 2009, 102, 255501 CrossRef PubMed.
- K. VanderWerf, W. Jun, M. D. Shattuck and C. S. O’Hern, Phys. Rev. E, 2018, 97, 012909 CrossRef PubMed.
- C. Brito, H. Ikeda, P. Urbani, M. Wyart and F. Zamponi, Proc. Natl. Acad. Sci. U. S. A., 2018, 115, 11736 CrossRef CAS PubMed.
- Y. Zhao, J. Barés, H. Zheng, C. S. Bester, Y. Xu, J. E. S. Socolar and R. P. Behringer, 2019, arXiv:1902.080242v1.
- L. E. Silbert, Soft Matter, 2010, 16, 2918 RSC.
- R. P. Behringer, Granular Mater., 2015, 16, 10 CAS.
- K. W. Desmond and E. R. Weeks, Phys. Rev. E: Stat., Nonlinear, Soft Matter Phys., 2009, 80, 051305 CrossRef PubMed.
- S. S. Ashwin and R. K. Bowles, Phys. Rev. Lett., 2009, 102, 235701 Search PubMed.
- S. Torquato and F. H. Stillinger, Rev. Mod. Phys., 2010, 82, 2633 CrossRef.
- S. Henkes, Y. Fily and M. C. Marchetti, Phys. Rev. E: Stat., Nonlinear, Soft Matter Phys., 2011, 84, 040301 CrossRef PubMed.
- D. Bi, J. Lopez, J. Schwarz and M. L. Manning, Nat. Phys., 2015, 10, 1074 Search PubMed.
- N. Xu and Q. Liao, Soft Matter, 2018, 14, 853 RSC.
- C. Reichhardt and C. J. Olsen Reichhardt, Phys. Rev. E: Stat., Nonlinear, Soft Matter Phys., 2014, 90, 012701 CrossRef CAS PubMed.
- M. van Hecke, J. Phys.: Condens. Matter, 2009, 22, 033101 CrossRef PubMed.
- C. P. Goodrich, A. J. Liu and S. R. Nagel, Phys. Rev. Lett., 2012, 109, 095704 CrossRef PubMed.
- C. P. Goodrich, S. Dagois-Bohy, B. P. Tighe, M. van Hecke, A. J. Liu and S. R. Nagel, Phys. Rev. E: Stat., Nonlinear, Soft Matter Phys., 2014, 90, 022138 Search PubMed.
- M. Wyart, S. Nagel and T. Witten, Europhys. Lett., 2005, 72, 486 CrossRef CAS.
- C. P. Goodrich, W. G. Ellenbroek and A. J. Liu, Soft Matter, 2013, 9, 109933 Search PubMed.
- S. Shoenholz, C. P. Goodrich, O. Kogan, A. J. Liu and S. R. Nagel, Soft Matter, 2013, 9, 11000 Search PubMed.
- C. Reichhardt and C. J. Olsen Reichhardt, Soft Matter, 2014, 17, 2932 RSC.
- D. Hexner, A. J. Liu and S. R. Nagel, Phys. Rev. Lett., 2018, 121, 115501 CrossRef CAS PubMed.
- L. Silbert, A. J. Liu and S. R. Nagel, Phys. Rev. Lett., 2005, 95, 098301 Search PubMed.
- M. Wyart, L. E. Silbert, S. R. Nagel and T. A. Witten, Phys. Rev. E: Stat., Nonlinear, Soft Matter Phys., 2005, 72, 051306 Search PubMed.
- A. S. Keys, A. R. Abate, S. C. Glotzer and D. J. Durian, Nat. Phys., 2007, 3, 260 Search PubMed.
- P. Olssen and S. Teitel, Phys. Rev. E: Stat., Nonlinear, Soft Matter Phys., 2011, 83, 030302(R) CrossRef PubMed.
- C. P. Goodrich, A. J. Liu and J. P. Sethna, Proc. Natl. Acad. Sci. U. S. A., 2016, 35, 9745 CrossRef PubMed.
- C. J. Olson Reichhardt, E. Groopman, Z. Nussinov and C. Reichhardt, Phys. Rev. E: Stat., Nonlinear, Soft Matter Phys., 2012, 86, 061301 CrossRef CAS PubMed.
- H. T. Nguyen, C. Reichhardt and C. J. Olson Reichhardt, Phys. Rev. E, 2017, 95, 030902(R) CrossRef PubMed.
- H. Péter, A. Libál, C. Reichhardt and C. J. Olson Reichhardt, Sci. Rep., 2018, 8, 10252 Search PubMed.
- R. Stoop and P. Tierno, Commun. Phys., 2018, 68, 1 Search PubMed.
- C. Brito, G. Parisi and F. Zamponi, Soft Matter, 2013, 9, 8540–8546 RSC.
- C. Reichhardt and C. J. Olson, Phys. Rev. Lett., 2002, 89, 078301 CrossRef CAS PubMed.
- T. Bohlein, J. Mikhael and C. Bechinger, Nat. Mater., 2012, 11, 126 CrossRef CAS PubMed.
- C. Reichhardt and C. J. Olsen Reichhardt, J. Phys.: Condens. Matter, 2012, 24, 225702 CrossRef CAS.
- W. Kob and L. Berthier, Phys. Rev. Lett., 2013, 110, 245702 CrossRef PubMed.
- P. Chaudhuri, L. Berthier and S. Sastry, Phys. Rev. Lett., 2010, 104, 165701 CrossRef PubMed.
- T. Bertrand, R. Behringer, B. Chakraborty, C. S. O’Hern and M. D. Shattuck, Phys. Rev. E, 2016, 93, 012901 CrossRef PubMed.
- C. F. Schreck, C. S. O’Hern and L. E. Silbert, Phys. Rev. E: Stat., Nonlinear, Soft Matter Phys., 2011, 84, 011305 CrossRef PubMed.
- M. Ozawa, T. Kuroiwa, A. Ikeda and K. Miyazaki, Phys. Rev. Lett., 2011, 109, 205701 CrossRef PubMed.
- J. Schewchuk, An Introduction to the Conjugate Gradient Technique Without the Agonizing Pain, Carnegie Mellon University Technical Report, 1994 Search PubMed.
- G. Lois, J. Blawzdziewicz and C. O’Hern, Phys. Rev. Lett., 2008, 100, 028001 CrossRef PubMed.
- D. Koeze, L. Hong, A. Kumar and B. Tighe, Elasticity of Jammed Packings of Sticky Disks, 2020 Search PubMed.
- A. L. Graves, S. Nashed, C. P. Goodrich, A. J. Liu and J. P. Sethna, Phys. Rev. Lett., 2016, 116, 235501 CrossRef PubMed.
- D. Vagberg, D. Valdez-Balderas, M. Moore, P. Olsoon and S. Teitel, Phys. Rev. E: Stat., Nonlinear, Soft Matter Phys., 2011, 83, 030303(R) CrossRef PubMed.
- K. Desmond, P. Young, D. Chen and E. Weeks, Soft Matter, 2013, 9, 3424 RSC.
- T. Majumdar and R. Behringer, Nature, 2005, 435, 1079 CrossRef PubMed.
- J. Zhang, T. Majumdar, M. Sperl and R. Behringer, Soft Matter, 2010, 6, 1982 Search PubMed.
- J. Zhou and A. Dinsmore, J. Stat. Mech.: Theory Exp., 2009, 2009, L05001 Search PubMed.
- S. Singh, Liquid Crystals Fundamentals, World Scientific, Singapore, 1st edn, 2002, pp. 118–123 Search PubMed.
- D. Bi, S. Henkes, K. F. Daniels and B. Chakraborty, Annu. Rev. Condens. Matter Phys., 2015, 6, 63 Search PubMed.
- A. Guinier, X-ray Diffraction. In Crystals, Imperfect Crystals, and Amorphous Bodies, W.H. Freeman and Co., London, UK, 1st edn, 1963 Search PubMed.
- D. Koeze, D. Vagberg, B. Tjoa and B. Tighe, Europhys. Lett., 2016, 113, 54001 CrossRef.
Footnotes |
| † Present address: Department of Mathematics, Cornell University, Ithaca, NY 14853, USA. |
| ‡ Scaling behavior with nf has also been proposed in the limit of dilute, fixed particles.51 |
| § Preliminary data indicate that, the rule of monotonic decrease seen in Fig. 4 can be violated. These results, which include additional pin geometries, will appear in a forthcoming publication. |
| This journal is © The Royal Society of Chemistry 2020 |

