
Anomalous and heterogeneous DNA transport in biomimetic cytoskeleton networks†
Jonathan
Garamella
 ,
Kathryn
Regan
,
Gina
Aguirre
,
Ryan J.
McGorty‡
and
Rae M.
Robertson-Anderson‡
*
,
Kathryn
Regan
,
Gina
Aguirre
,
Ryan J.
McGorty‡
and
Rae M.
Robertson-Anderson‡
*
Department of Physics & Biophysics, University of San Diego, San Diego, CA 92110, USA. E-mail: randerson@sandiego.edu
First published on 12th June 2020
Abstract
The cytoskeleton, a complex network of protein filaments and crosslinking proteins, dictates diverse cellular processes ranging from division to cargo transport. Yet, the role the cytoskeleton plays in the intracellular transport of DNA and other macromolecules remains poorly understood. Here, using single-molecule conformational tracking, we measure the transport and conformational dynamics of linear and relaxed circular (ring) DNA in composite networks of actin and microtubules with variable types of crosslinking. While both linear and ring DNA undergo anomalous, non-Gaussian, and non-ergodic subdiffusion, the detailed dynamics are controlled by both DNA topology (linear vs. ring) and crosslinking motif. Ring DNA swells, exhibiting heterogeneous subdiffusion controlled via threading by cytoskeleton filaments, while linear DNA compacts, exhibiting transport via caging and hopping. Importantly, while the crosslinking motif has little effect on ring DNA, linear DNA in networks with actin–microtubule crosslinking is significantly less ergodic and shows more heterogeneous transport than with actin–actin or microtubule–microtubule crosslinking.
Introduction
The theoretical and experimental description of thermally diffusive transport has been extensively studied.1–4 Both a Gaussian distribution of random steps and the linear growth of the mean-square displacement (MSD) in time effectively characterize transport in a homogenous and dilute medium. However, certain experimental or environmental conditions cause deviations from these transport properties, leading to myriad models of anomalous diffusion.5,6 At the forefront of verifying these models, and more importantly understanding transport at the micron scale, is the field of single particle tracking.7–10 Here, we use single-molecule conformational tracking (SMCT) to investigate the transport and conformational dynamics of linear and ring DNA molecules in biomimetic composite networks of actin and microtubules with varying types of crosslinking. Given the ubiquity of both linear and relaxed circular (ring) DNA in living organisms, and the implications that DNA transport in the cytoskeleton has on transcription, transformation, looping, gene expression and gene therapy, understanding the transport and conformational dynamics of DNA through cytoskeletal environments is critical.11–15 The cytoskeleton, comprised of various protein filaments and binding proteins, is a highly structured and crowded, yet dynamic, network that can hinder the transport of DNA molecules and adversely affect the conformational stability needed for the aforementioned cellular processes.16–18 Semiflexible actin filaments (persistence length lp ≈ 10 μm) and rigid microtubules (lp ≈ 1 mm) are the primary cytoskeletal protein filaments,16,18–20 often forming sterically entangled or crosslinked networks for the purposes of proliferation, differentiation and cell migration.18,20–24 Yet, the role of crosslinking and interactions between actin and microtubules on intracellular transport has yet to be discovered.25–29Traditionally, the impact of crowding on intracellular transport has been investigated using small globular proteins or synthetic polymers as the crowders,30–33 which do not well model crowding by entangled and crosslinked networks of filaments that comprise the cytoskeleton. In such dense, entangled networks, long polymers (e.g., DNA) are restricted to move via reptation, or curvilinear diffusion along their backbones.34,35 Ring polymers, on the other hand, lack the free ends required for this type of transport, making ring DNA transport through entangled environments distinct and leading to great interest and debate.36–43 Ring polymers entangled by linear chains have been predicted to assume a wide range of conformational states, giving rise to a greater variety of transport mechanisms than their linear counterparts.43–51 Further complicating ring transport is the predicted threading of ring polymers by linear chains such that they cannot move beyond their radius of gyration unless the linear chain unthreads itself via reputation.34,35 This diffusive process, known as constraint release,52–54 is extremely slow compared to reptation and is likely largely eliminated if the linear chains are crosslinked.26 However, experimental evidence of these predicted diffusive processes, especially for biologically relevant polymers and systems, is sparse.26,47,48,55
The most well understood characteristic of diffusive motion in homogenous media is the linear growth of the mean-squared displacement (MSD) with time, i.e. MSD ∝ tα where α = 1. In crowded and stochastic systems, a departure from this relation (i.e. α ≠ 1) is common, giving rise to the widely-studied field of anomalous diffusion.56,57 While a subdiffusive MSD vs. time curve indicates anomalous diffusion, this alone cannot differentiate between the various transport models.5,56 The nature of the distributions of particle displacements can be analyzed for a deeper understanding of these processes. Non-Gaussian distributions are often found in crowded or confined environments common to soft matter58–61 and biological62–66 systems. The non-Gaussianity parameter βNG, which relates the fourth moment of the time-averaged trajectory to the time-averaged MSD (tMSD), can be used to differentiate between Brownian or fractional Brownian motion and continuous time random walk models. The origin of this non-Gaussianity is most often attributed to heterogeneity in the media, resulting in a range of diffusivities that depend on the local environment.67–69 Similarly, fluctuations in the time-averaged MSD can be characterized by the variance of individual particle tracks relative to the tMSD, quantified by the ergodicity breaking parameter, EB.70 For a perfectly reproducible process where all time-averages over adequately long intervals are the same, EB = 0 and the process can be said to be ergodic. Weakly non-ergodic processes either slowly decay to zero as t → ∞ or have some positive value.71 Deviations from zero are expected for other, non-stationary models.6,10 The easiest to conceptualize are systems in which the particles do not move continuously through the medium but are trapped, or caged, for a non-trivial amount of time before jumping, or hopping, to another available pocket.72
Anomalous diffusion, in particular subdiffusion where the scaling exponent α < 1, is widespread in crowded biological environments.6,73–76 There are many examples of subdiffusive behavior in living cells, including RNA–protein complexes in E. coli77–79 and S. cerevisiae,78,79 viruses in HeLa cells,80 proteins in plasma membranes,62 and gold nanoparticles in human and mammalian cell lines.81 Yet, the underlying processes and molecular conformations that give rise to the observed phenomena are not well understood. Further, given the inherent complexity of these in vivo environments, it is nearly impossible to isolate the roles that individual parameters play in the observed phenomena.
Here, we create biomimetic in vitro networks of actin and microtubules in which we systematically vary the type of crosslinking to understand the role the cytoskeleton plays in the transport and conformational dynamics of DNA. We specifically investigate three important crosslinking motifs: actin crosslinked to actin (A–A), microtubules crosslinked to microtubules (M–M), and actin crosslinked to microtubules (A–M) (Fig. 1). While these variations in crosslinking have been shown to alter the cytoskeleton network connectivity and rigidity,27 their effect on the transport of DNA and other macromolecules had yet to be discovered. Further, the extent to which transport is ergodic and/or Gaussian in nature, key to understanding the transport phenomena and properly analyzing and interpreting experimental data on these systems, remains an open question.
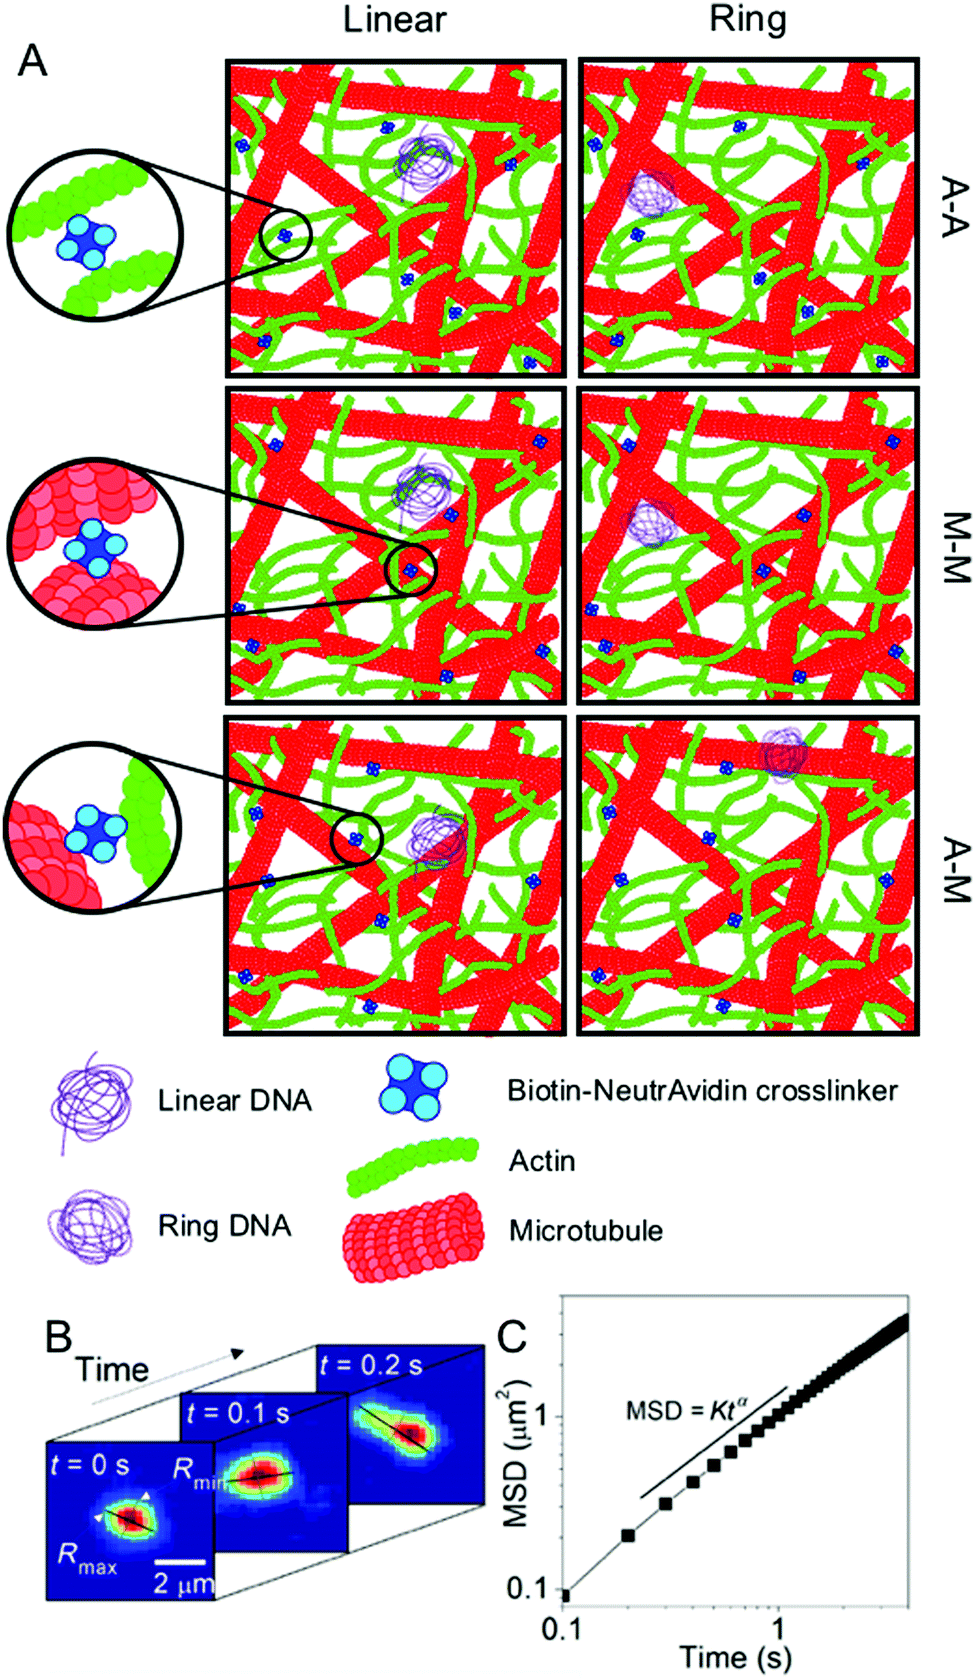 | ||
| Fig. 1 Experimental conditions and techniques used to examine DNA transport in biomimetic cytoskeleton networks. (A) Schematic of the various conditions examined. Linear and ring DNA are added to actin–microtubule networks with actin–actin (A–A), microtubule–microtubule (M–M), or actin–microtubule (A–M) crosslinking. Biotinylated filaments are used in conjunction with NeutrAvidin complexes to enable crosslinking. (B) Single-molecule conformational tracking is used to measure the center-of-mass (COM) position and the lengths of the major and minor axes (Rmax and Rmin) of each DNA molecule for every frame of the time-series to quantify the transport and conformational dynamics of individual DNA molecules. (C) From (B), the COM mean squared displacement (MSD) is computed. This schematic was adapted from ref. 26. | ||
We find that while both DNA topologies, ring and linear, exhibit subdiffusion that is non-Gaussian and non-ergodic over the entire measurement time, these dynamics are driven by different physical phenomena depending on the topology. Ring DNA dynamics are dominated by threading by the cytoskeleton filaments, with little dependence on the type of crosslinking. Linear DNA dynamics, on the other hand, are heavily influenced by the crosslinking motif, with transport in the non-homologous crosslinked network (A–M) being significantly more anomalous as well as less Gaussian and less ergodic than in the networks with homologous crosslinking (A–A, M–M). Our collective results shed important new light on the role that the cytoskeleton plays in the ubiquitous anomalous transport observed in biological environments. As such, our results can further aid in systematically interrogating complex living systems in an effort to develop bottom-up artificial cells.82–84
Methods
DNA
Double-stranded 115 kbp DNA is prepared using E. coli to replicate bacterial artificial chromosomes, which were then extracted and purified per previously described protocols.43 After purification, the supercoiled circular DNA was treated with MluI or topoisomerase I (New England Biolabs) to convert the topology to linear or relaxed circular (ring) DNA, respectively.55 For all experiments, the DNA was fluorescently labeled with YOYO-1 (Thermo Fisher Scientific) at a 4![[thin space (1/6-em)]](https://www.rsc.org/images/entities/char_2009.gif) :1 base pair:dye ratio.85
:1 base pair:dye ratio.85
Cytoskeleton proteins
Crosslinked networks of actin and microtubules are prepared using previously described protocols.27,86 Briefly, porcine brain tubulin dimers and rabbit skeletal actin monomers (Cytoskeleton) are resuspended at a 1:1 molar ratio to a final protein concentration of 5.8 μM. An aqueous buffer comprised of 100 mM PIPES, 2 mM MgCl2, 2 mM EGTA, 1 mM ATP, 1 mM GTP, and 5 μM Taxol is used. To polymerize proteins to create filamentous composite networks, final solutions are pipetted into capillary tubing with an inner diameter of 800 μm, sealed with epoxy, and incubated for at least 30 minutes at 37 °C. To enable crosslinking, biotin–NeutrAvidin complexes are preassembled and added at a crosslinker:protein molar ratio of Rcp = 0.02 before polymerization.27 By preassembling the biotin–NeutrAvidin complexes separate of the network, we are able to control the type of crosslinking. All complexes contain a 2:2:1 stoichiometry of biotinylated protein to biotin to NeutrAvidin with the biotinylated proteins either being two actin monomers, two tubulin dimers or one of each to create actin–actin, microtubule–microtubule or actin–microtubule crosslinker complexes. These complexes are incorporated into the filaments as they polymerize. All three networks, characterized previously, are considered isotropic with no phase separation between proteins.26,27,87 The mesh size of all composite networks is ξ ≈ 0.81 μm.27
Sample preparation
In all experiments, linear and ring DNA is labeled with YOYO dye and added to the cytoskeleton protein solution prior to polymerization at a concentration of 0.25 μg ml−1. To inhibit photobleaching, glucose (0.9 mg ml−1), glucose oxidase (0.86 mg ml−1), and catalase (0.14 mg ml−1) are added. Finally, 0.05% Tween 20 is added to reduce surface interactions. DNA is added prior to polymerization to allow the network to assemble within the experimental chamber. The alternative would be to polymerize the network outside the chamber, then add DNA, then load the sample into the chamber, which often results in flow alignment, buckling and breaking of the filaments. This approach would also be less physiologically relevant as in the cytoskeleton filaments are continuously polymerizing and depolymerizing and altering their crosslinking state.Imaging and analysis
The DNA was imaged using a light sheet microscope with an excitation objective of 10× 0.25 numerical aperture (NA), an imaging objective of 20× 1.0 NA, and an Andor Zyla 4.2 CMOS camera. Each of the sample videos contains ∼10 DNA molecules per frame recorded at 10 fps for 500 frames. The video duration was chosen to minimize photobleaching of the fluorescently labeled particles and to remove systemic error. Due to the physical width of the excitation sheet (∼4.5 μm), DNA molecules only need to move a few microns to leave the sheet and no longer be tracked. By increasing the imaging time to 100 s of seconds, we would potentially bias our data towards slower molecules that do not leave the sheet. Forty-five videos were taken for each sample, amounting to roughly 1000 particles for each condition. Custom written software (Python) was used to track COM positions (x, y) as well as the major axis (Rmax) and minor axis (Rmin) of each molecule. As previously detailed, from the COM positions we calculate the mean-squared displacement , from which we compute scaling exponents via MSD ∝ tα (Fig. 2). From the COM positions, we also compute particle displacements for each lag time to generate the van Hove distributions (Fig. 3A). These distributions are fit to the sum of a Gaussian and exponential function
 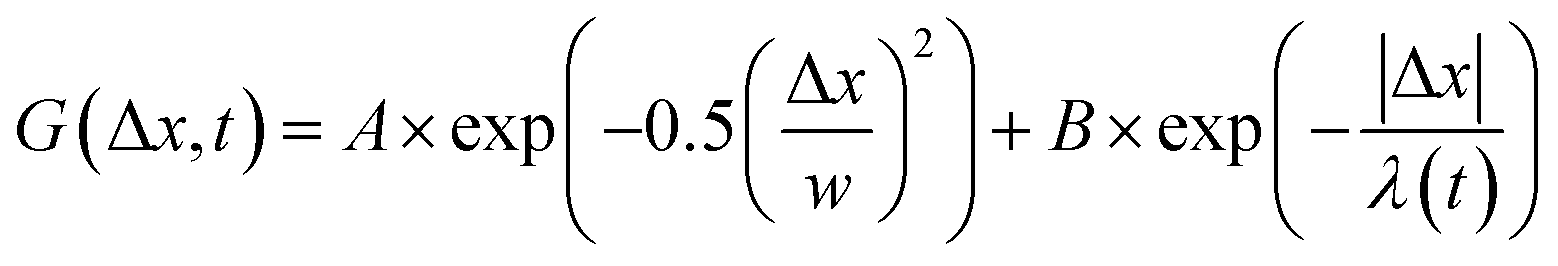 , where A is the amplitude of the Gaussian, w is the Gaussian width, B is the amplitude of the exponential, and λ is the decay length. Distributions at 0.3, 0.5, 1, 1.5, 2, 2.5, 3, and 4 s were fit and λ was extracted for each time point (Fig. 3B). Master curves are generated by scaling the displacements using the power-law fitting λ ∝ tΩ such that Δxλ = Δx(t)/tΩ and plotting G(Δxλ,t). Finally, we compute the non-Gaussianity parameter,
 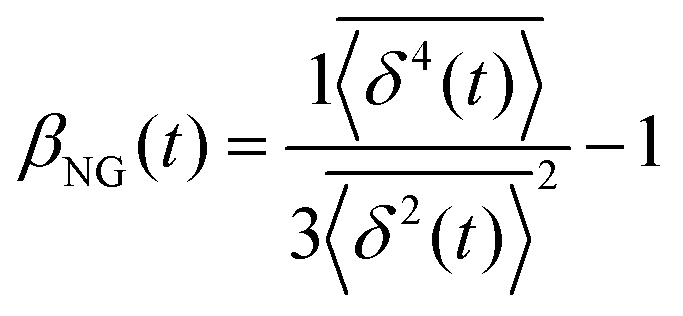 , and ergodicity-breaking parameter,
 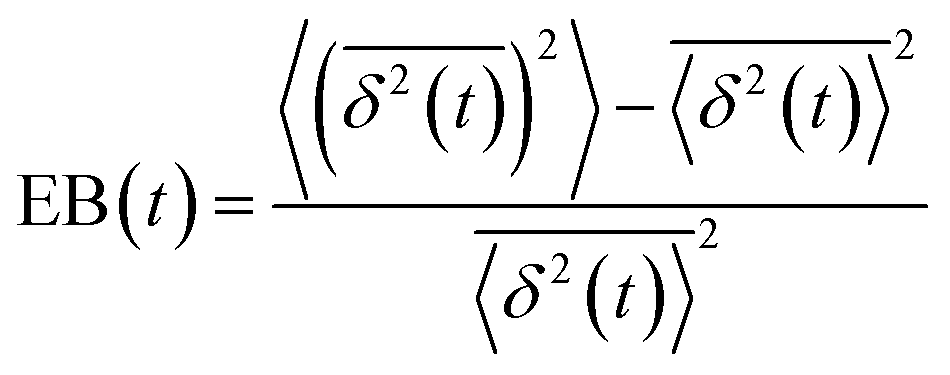 , where
  is the individual time averaged squared displacement and
  is the time average MSD for the entire ensemble of trajectories (Fig. 4). To characterize the conformations of the DNA molecules, we compute the DNA coil size
 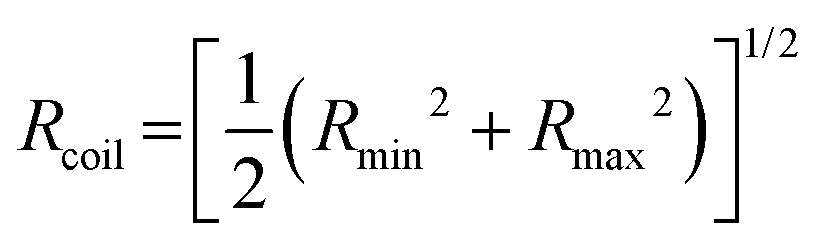 from the major and minor axes measurements and normalize by the dilute limit mean end-to-end length,
  , to determine the reduced coil size r043 (Fig. 5A). These analysis methods, depicted in Fig. 1, have been described and validated previously.25,26,30,32,88
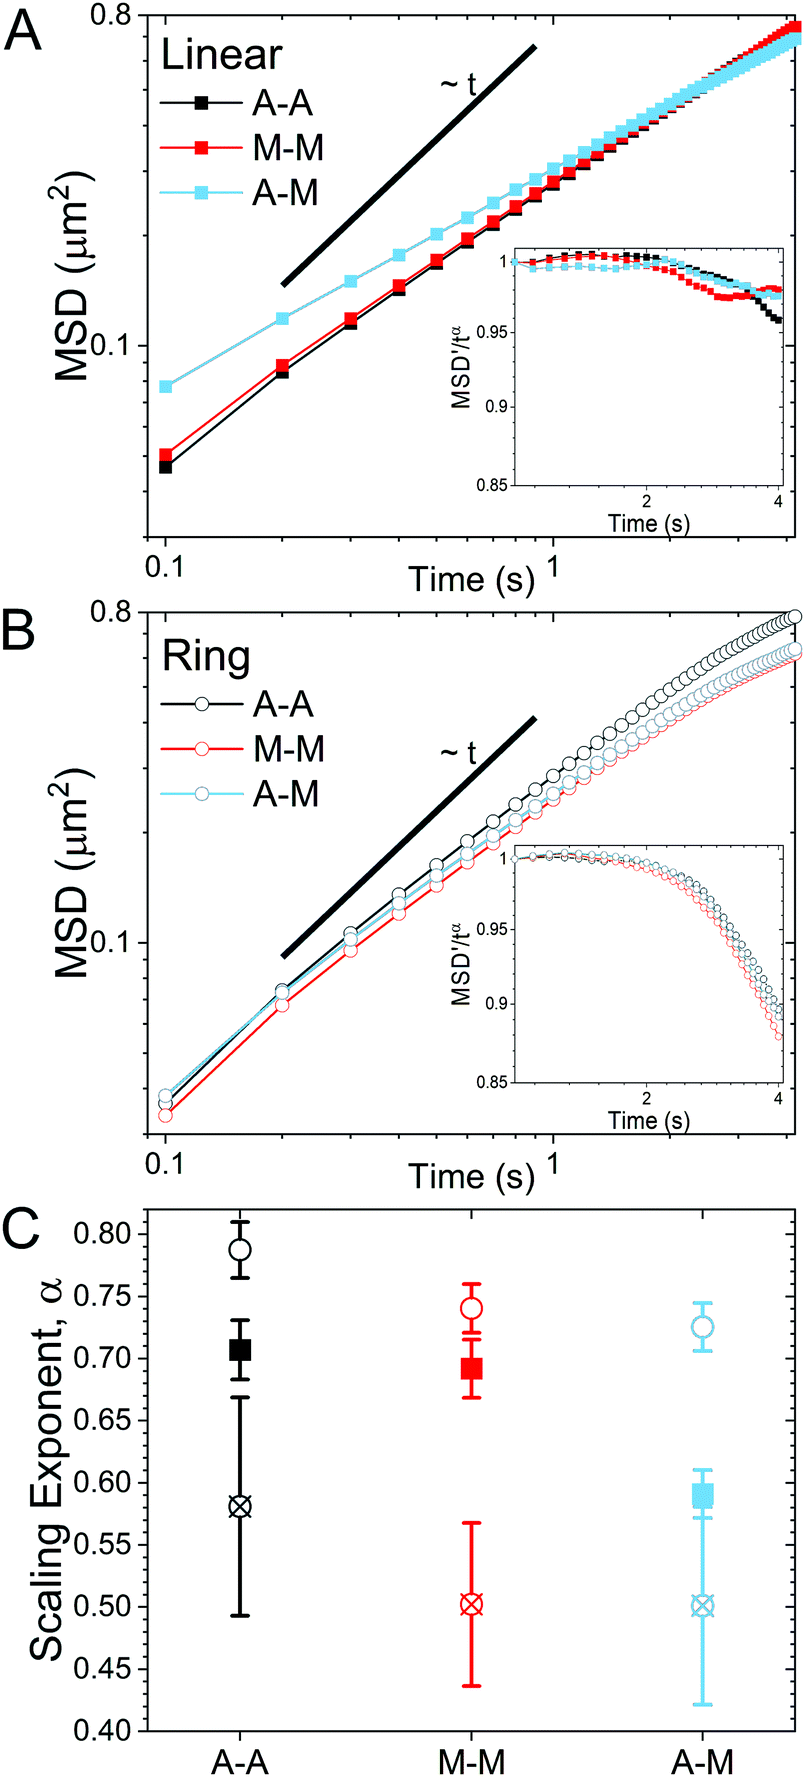 | ||
| Fig. 2 Linear and ring DNA exhibit topology-dependent diffusion in varying crosslinked cytoskeleton networks. (A and B) Mean-squared displacements (MSD) versus time for linear DNA (A, closed squares) and ring DNA (B, open circles) in networks with actin–actin crosslinking (A–A, black), microtubule–microtubule crosslinking (M–M, red), and actin–microtubule crosslinking (A–M, light blue). In both (A) and (B), connecting lines are added and a straight line showing MSD ∼ t are added to guide the eye. MSD vs. time curves were fit to the power-law relation, MSD ∝ tα, where α is the anomalous scaling exponent. Insets: Normalized MSDs, scaled by the anomalous scaling exponent fit over 0.1–2.5 s, vs. time for linear (A) and ring (B) DNA. A horizontal line indicates a time-independent scaling exponent. (C) Anomalous scaling exponents for linear (squares) and ring (circles) DNA determined from MSDs shown in A and B. Linear DNA exponents are determined from fits over t = 0.1–4 s (closed squares), while ring DNA values are determined from fits over t = 0.1–2.5 s (open circles) and t = 2.6–4 s (crossed circles). Errors bars are standard error of values from 10 subsets of the data for each condition. | ||
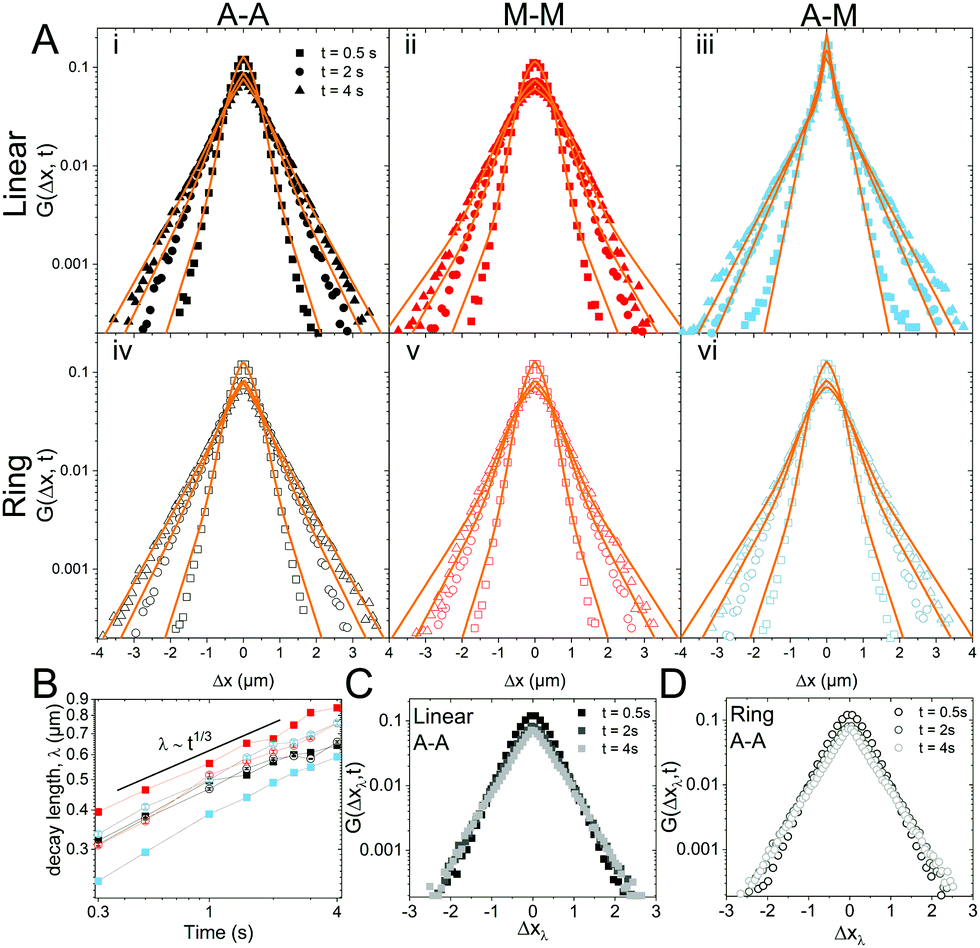 | ||
Fig. 3 van Hove distributions reveal non-Gaussian, heterogeneous transport for both ring and linear DNA in all crosslinking motifs. (A) van Hove distributions (G(x,t)) for linear (top) and ring (bottom) DNA in networks comprised of actin–actin (A–A; black; i, iv), microtubule–microtubule (M–M; red; ii, v), and actin–microtubule (A–M; light blue; iii, vi) crosslinking plotted on a semi-log scale. Shown are the distributions for 0.5, 2, and 4 seconds. The displacement distributions are decidedly non-Gaussian and were fit to the sum of a single Gaussian and single exponential distribution,  , shown in orange. (B) The characteristic length, λ, obtained from the exponential fit of the curves shown in (A), plotted against lag time. Points are connected via lines to guide the eye while the black line shows the approximate power-law scaling. (C and D) Master van Hove distributions for linear DNA (C) and ring DNA (D) diffusing in an actin–actin crosslinked network obtained by scaling the displacements such that Δxλ = Δx(t)/tΩ where Ω is the scaling exponent found in B for times of 0.5 (black), 2 (gray), and 4 seconds (light gray). , shown in orange. (B) The characteristic length, λ, obtained from the exponential fit of the curves shown in (A), plotted against lag time. Points are connected via lines to guide the eye while the black line shows the approximate power-law scaling. (C and D) Master van Hove distributions for linear DNA (C) and ring DNA (D) diffusing in an actin–actin crosslinked network obtained by scaling the displacements such that Δxλ = Δx(t)/tΩ where Ω is the scaling exponent found in B for times of 0.5 (black), 2 (gray), and 4 seconds (light gray). | ||
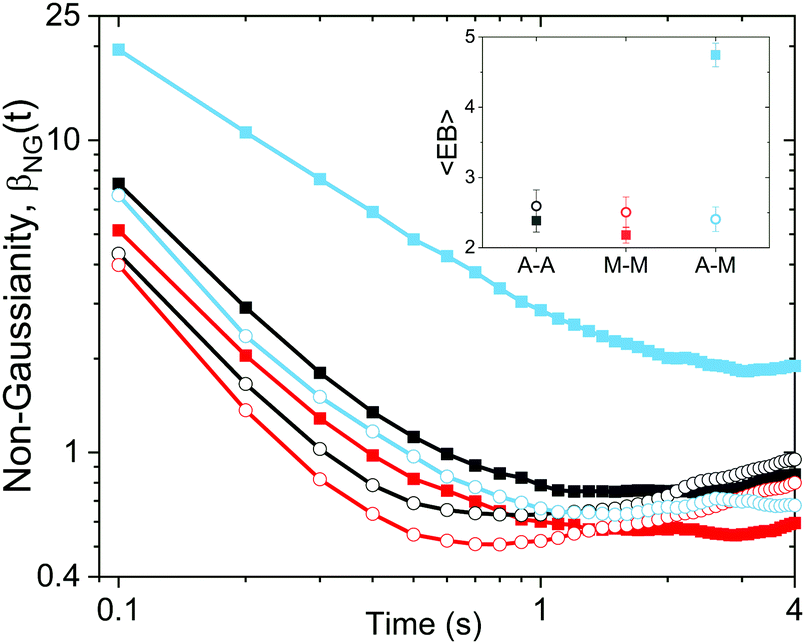 | ||
| Fig. 4 Non-Gaussianity parameter, βNG(t) and ergodicity-breaking term, EB, show that DNA transport dynamics are both non-Gaussian and non-ergodic. βNGversus time for both linear (closed squares) and ring (open circles) DNA diffusing in networks comprised of actin–actin (A–A, black), microtubule–microtubule (M–M, red), and actin–microtubule (A–M, light blue) crosslinking. Inset: Time-average of the corresponding ergodicity-breaking term EB. Note that both βNG and EB are zero for a particle undergoing normal Brownian diffusion. See text for definitions of βNG and EB. | ||
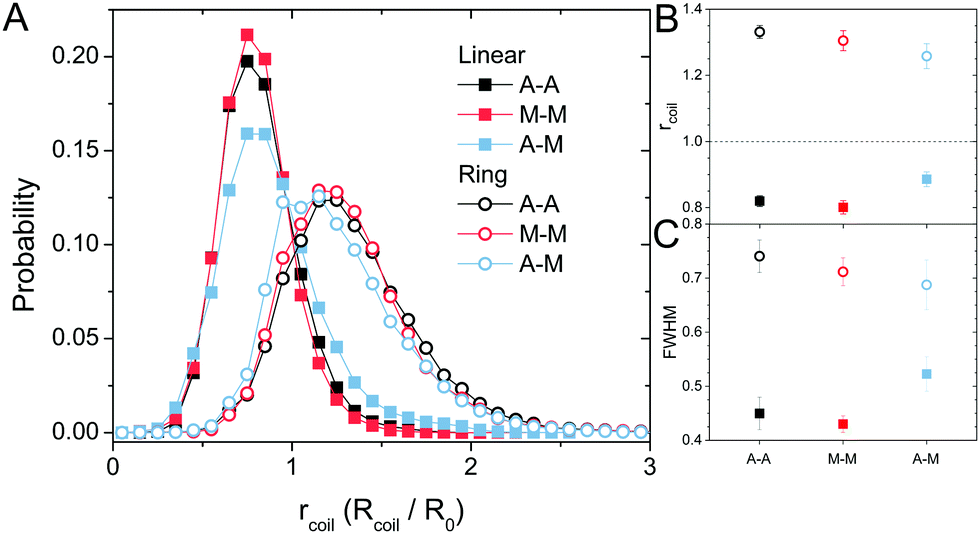 | ||
| Fig. 5 Conformational analysis indicates that linear DNA is compacted and ring DNA is swollen in all networks. (A) Probability distributions of the DNA coil size, Rcoil, normalized by the corresponding dilute-limit size, R0, denoted as rcoil, for linear (closed squares) and ring (open circles) DNA diffusing in each cytoskeleton network. (B) Expectation value of rcoil from the distributions in (A). The dashed line at rcoil = 1 guides the eye to the expected dilute-limit value. (C) Full-width half-maximum (FWHM) measurements of the rcoil distributions in (A). | ||
Results
Anomalous subdiffusion of DNA in crosslinked cytoskeleton composites
As described in Methods, we use single-molecule conformational tracking to measure the dynamics of linear and ring DNA diffusing in in vitro cytoskeleton networks with varying crosslinking motifs. We first evaluate the mean-squared displacement (MSD) by tracking the center-of-mass locations of an ensemble of individual DNA molecules in each network (Fig. 2). As evidenced by Fig. 2, both DNA topologies exhibit sub-linear MSD vs. t curves, indicating anomalous subdiffusion. We thus fit each curve to the power-law relation MSD ∝ tα where α is the anomalous scaling exponent.While all systems display subdiffusion (α < 1), there are obvious differences in the transport of linear and ring DNA, as can be seen in Fig. 2A and B. The MSDs for linear molecules obey a single power-law relation over all measured lag times in all networks (Fig. 2A). While actin–actin (A–A) and microtubule–microtubule (M–M) (homologous) crosslinking appears to have similar effects on linear DNA transport with α ≈ 0.7, actin–microtubule crosslinking (A–M) (non-homologous) leads to significantly more subdiffusion with α ≈ 0.59. Interestingly, the transport of linear DNA in the A–M network is actually faster than in the other networks initially; but, because it is more subdiffusive, we observe a crossover in the MSD curves at ∼0.5 μm2. While the MSDs for linear DNA are well fit by a single power law for our entire experimental time window, ring DNA MSDs exhibit two distinct regimes of subdiffusion. Initially, as shown in Fig. 2C, ring DNA diffusion is less anomalous than that of its linear counterpart. However, beyond ∼0.4 μm2, the MSD curves for ring DNA become more anomalous (decreasing α) than those for linear DNA (Fig. 2C). This biphasic diffusion, absent for linear DNA, is emphasized by the insets in Fig. 2A and B. Here, we scale the normalized mean-squared displacement by tα using the α value obtained by fitting the first 2.5 seconds of the MSDs. As such, a horizontal line denotes a constant α value, while a deviation occurs when the anomalous scaling exponent changes. As shown, we observe a decrease in the scaled MSD curves for ring DNA that has the same characteristic shape in all crosslinking motifs (Fig. 2B inset). This behavior is in contrast to the inset in Fig. 2A, where the curves are roughly constant with lag time. Further, for ring DNA, transport in the M–M and A–M networks are similar and transport in the A–A networks is only slightly less anomalous (Fig. 2C), in contrast to the linear DNA in which transport in the A–M network is the outlier.
Heterogeneous and non-ergodic transport
To better understand the interesting behavior displayed in Fig. 2, we turn to the probability distributions of center-of-mass displacements, also known as van Hove distribution functions G(Δx,t) (Fig. 3). Fig. 3A displays the temporal evolution of the normalized van Hove functions, plotted on a semi-log axis, for linear and ring DNA diffusing in actin–actin, microtubule–microtubule, and actin–microtubule crosslinked networks with lag times of 0.5, 2, and 4 seconds. For a particle undergoing normal Brownian motion, one expects Gaussian distributions.3 However, we observe distinctly non-Gaussian distributions, a hallmark of dynamic heterogeneity in crowded media.67–69,79,89,90 Further, the temporal persistence of the non-Gaussian dynamics and the lack of a crossover to a Gaussian regime at longer times indicate that the overall relaxation of the dynamical processes dictating transport is longer than our measurement timescale. While this phenomenon is consistent given the measured relaxation times of the cytoskeleton networks,29,91 it is distinct from many other systems where the non-Gaussian transport is transient, reverting to Gaussian behavior after some critical time.67 While this is noteworthy, we expect that longer experiments, able to probe time scales that exceed the maximum relaxation time of the networks, may find the recovery of Gaussian behavior. Previous single-molecule studies reported similar distributions and fit them to the sum of a single Gaussian, to capture small displacements, and an exponential function, to capture the large “tails” in the distributions.59,67,68,92 The exponential portion of the van Hove function can be described by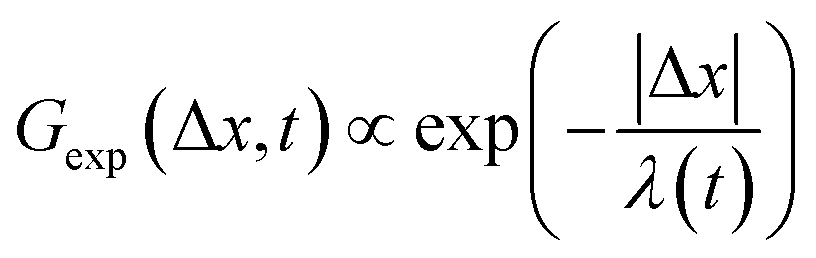 where λ(t) is the time dependent decay length of the system. This characteristic decay length λ(t) can be understood as an average of length scales associated with each of the relaxation processes that contribute to the exponential tail of the distributions.
To probe whether the decay length λ(t) is sensitive to DNA topology and network crosslinking motif, we plot its temporal evolution for all conditions in Fig. 3B. λ(t) roughly grows as the cube root of time, λ(t) ∝ t∼1/3, though this scaling exponent Ω varies slightly depending on DNA topology and crosslinking (ESI,† Table S1). We use the scaling behavior of the exponential tail to obtain an overlapping master curve by rescaling the displacements as Δxλ = Δx(t)/tΩ (Fig. 3C and D). Although we only show master curves for DNA in the actin–actin network, the result is generic and applicable to all networks. This suggests that the exponential function and corresponding decay lengths for the different DNA topologies in the various networks provides a robust description of the transport.
To further quantify and characterize the anomalous transport we observe, we evaluate the non-Gaussianity parameter, βNG and ergodicity-breaking parameter, EB, as described in Methods. For a particle undergoing Brownian motion, which is an ergodic process obeying Gaussian statistics, βNG = EB = 0. Conversely, as shown in Fig. 4, both parameters are clearly nonzero over the entire measurement window for both DNA topologies in all cytoskeleton networks. As shown, βNG(t) for all conditions decreases from an initial absolute maximum value of ∼O(10) to a nearly time-independent plateau ∼O(1). For most ostensibly anomalous processes, the non-Gaussianity is expected to approach a near-zero plateau as the transport becomes normal.93 However, we find no such behavior – all plateau values are significantly nonzero. Initially, linear DNA displays less Gaussian diffusion (higher βNG) than its ring equivalent, but, surprisingly, this effect is reversed for t > 2 seconds. Importantly, this crossover time is nearly the same as the time when the ring DNA becomes more subdiffusive. The exception is, again, the linear DNA diffusing in the actin–microtubule crosslinked composite, with βNG being > 2× higher than in all other conditions. This result is consistent with those presented in Fig. 3, where the van Hove distributions in Fig. 3Aiii are distinctly different than the others. The inset, showing the time average of the ergodicity breaking parameter EB, shows a similar trend. The diffusion of ring DNA is less ergodic over the experimental time period, with the exception of linear DNA in the A–M network, where EB is greatest by roughly a factor of two. Note that in all conditions the ergodicity breaking parameter is non-zero and positive, a hallmark of a weakly non-ergodic process.5
Conformational dynamics of linear and ring DNA
The topology-dependent transport phenomena we observe suggests that the varying networks may alter the conformational dynamics of ring and linear DNA differently. As such, we characterize the distribution of conformational sizes of the diffusing DNA molecules (Fig. 5). As described in Methods, we measure the major and minor axes lengths (Rmax and Rmin) for each molecule in each frame. From these measurements, we calculate an effective DNA coil size, Rcoil = [1/2(Rmax2 + Rmin2)]1/2, for each molecule and each frame and normalize by the dilute limit mean end-to-end length, . Fig. 5 shows the probability distributions for this reduced coil size rcoil = Rcoil/R0 (Fig. 5A), as well as the mean value 〈rcoil〉 (Fig. 5B), and full-width-half-maximum, FHWM (Fig. 5C). These data, taken together, show clear topology-dependent differences: linear DNA is compacted in all networks while ring DNA is swollen and has a much wider conformational breadth, as measured by FWHM (the dashed line in Fig. 5B guides the eye to the condition Rcoil = R0). However, for each DNA topology there is little difference between the effect of actin–actin and microtubule–microtubule crosslinking. The major deviation occurs for linear DNA diffusing in the A–M network, where we observe a much larger distribution width (i.e., FWHM) compared to the other networks, signifying that the DNA assumes a greater range of conformational states in this network.
Discussion
Taken as a whole, our results indicate that both linear and ring DNA undergo anomalous, non-Gaussian subdiffusion that is not ergodic. However, our analyses show that this dynamic heterogeneity, while superficially similar, is caused by entirely different physical phenomena depending on the DNA topology and cytoskeleton network crosslinking motif. Ring DNA assumes a greater range of conformational states than linear DNA, as demonstrated by an increased FWHM (Fig. 5). There is ample literature, both experimental26,43,44,48 and theoretical,45–48 suggesting that ring polymers entangled by linear chains assume folded, amoeba-like, or threaded conformations not accessible to linear molecules, leading to anomalous subdiffusion and coil swelling, in alignment with our results.However, the most direct evidence of threading presented here lies in the biphasic MSDs for rings (Fig. 2B). The shift to a more subdiffusive regime occurs at or after ∼0.4 μm2, which is quite similar to the square of the radius of gyration for the ring DNA, RG2 = (0.65 μm)2 ≅ 0.42 μm2.26,43 This shift indicates that COM motion is restricted at distances >RG, exactly what we should expect for rings threaded by the cytoskeleton filaments. Namely, threaded rings can only diffuse perpendicular to the threading filament over distances <RG, so we would expect squared displacements >RG2 to be frozen out for threaded rings over timescales below the slowest relaxation mode of the network (∼O(10 s)).27,29,91 Further, as the average size of the ring DNA coils is greater than the dilute mean end-to-end limit of ∼1.58 μm43 (Fig. 5B), and the mesh size ξ of the network is ∼0.81 μm, the rings are likely threaded by multiple filaments. This result, coupled with the fact that the filaments are crosslinked together, makes it extremely unlikely for ring DNA molecules to be ‘released’ from the threading filaments. While threaded rings could also move along the actin filaments or microtubules rather than perpendicular to them, they would still be restricted by entanglements or crosslinks in the network and thus the squared displacements would be limited to the square of the mesh size ξ2. As such, we would expect all MSDs to remain <ξ2, even at large times. In M–M and A–M crosslinked networks, this is exactly the case (Fig. 2B) while transport in the A–A crosslinked network seems to contradict this idea. In the A–A network, there is slightly faster diffusion over a majority of the measurement time and this is amplified as the ring DNA in the other networks asymptotes to ξ2. We previously showed that as actin–actin crosslinking in composite networks is increased, the incidence of actin bundling increases.29 This bundling works to effectively reduce the number of individual fibers in the network and, in turn, increase the mesh size. Therefore, while we still expect the MSD curve in the A–A network to plateau, it should be slightly higher than in the other networks, as we find in Fig. 2B.
Threading of the ring DNA is also manifest in the temporal evolution of the non-Gaussianity parameter, βNG. Initially, the threaded rings are able to move around more freely than the linear chains in the same cytoskeleton network as they have smaller coils so it takes a longer time to “feel” the filaments in the network (Fig. 4). However, at longer times, the transport of ring DNA becomes less Gaussian (increase in βNG) as the constraints of the threading filaments become important.
The fact that the transport (α, λ, βNG, EB) and conformational dynamics (rcoil, FWHM) for rings are nearly the same irrespective of the crosslinking motif reinforces the idea that a single effect, i.e. threading, dominates ring dynamics. We note that the dominance of threading may be a result of adding DNA to the networks prior to filament polymerization. If the DNA were added after polymerization and crosslinking we would expect threading to occur primarily with the un-linked filaments and the free ends of the crosslinked species. However, given that in cells, the cytoskeleton is continuously polymerizing and depolymerizing as well as varying its crosslinking state we expect our preparation methods to be more physiologically relevant than the alternative preparation.
In contrast to rings, we find significant, network dependent changes in the transport of linear DNA when changing from homologous (A–A, M–M) to non-homologous (A–M) crosslinking motifs. In the network with actin filaments crosslinked to microtubules, the diffusion of linear DNA is faster than in A–A and M–M networks for the first 0.5 μm2 but slower for longer distances (Fig. 2A). This results in significantly more anomalous transport of linear DNA in A–M networks relative to the other networks (Fig. 2C). This crossover occurs as the DNA displacement approaches the mesh size, indicating that the A–M crosslinked network imposes a greater constraint than the other networks. This fact is bolstered by van Hove functions that show, qualitatively, that the distribution is the least Gaussian, suggesting that there is an increased degree of heterogeneity in transport (Fig. 3A). This interpretation is in agreement with a rheological analysis of this network,27 in which the mobilities of actin and microtubules in an A–M crosslinked network exhibited a much larger spread in values relative to A–A and M–M networks. This variance in mobility is indicative of more local heterogeneity in the networks, which in turn gives rise to heterogeneous transport.
Quantitatively, the non-Gaussianity for linear DNA in the A–M network is significantly higher than any other DNA in any other network (Fig. 4); the same is true for the ergodicity breaking parameter (Fig. 4, inset). These collective results suggest that the diffusion of linear DNA in the A–M crosslinked network is driven by caging more so than the other networks. This type of transport – where the tracer molecules do not continuously diffuse through the media but are trapped in a pocket of the network for an extended period before hopping to another pocket – has been seen in other viscoelastic polymer networks,94 manifesting as non-ergodic and non-Gaussian subdiffusion.94,95 When employing a homologous crosslinking motif (A–A or M–M), the other filament type (microtubules or actin) remains un-linked and thus maintains a greater degree of mobility. As such, the un-linked network acts to restrict hopping as the DNA motion is coupled to the slow rearrangement of the local network.96 In a more rigid network, such as one with a non-homologous crosslinking motif, hopping from rigid pocket to rigid pocket is a more effective mode of transport as the rearrangement times in this network are much longer. Indeed, studies in rigid polymer networks have found increasing the rigidity leads to more anomalous transport.97,98 Conversely, transport within the local rigid pockets for a single polymer is faster as less rearrangement occurs such that the molecule has more ‘empty’ space to explore. These competing effects lead to faster transport at smaller distances yet slower transport at larger distances (Fig. 2A).
In summary, we have used single-molecule conformational tracking to investigate the transport properties of large linear and ring DNA molecules in biomimetic cytoskeleton networks. We focus on the effects of DNA topology and cytoskeleton crosslinking motif on DNA transport and conformations, linking network structure to DNA dynamics. We find that transport in all networks is subdiffusive and heterogeneous, exhibiting weak ergodicity breaking and non-Gaussian displacement distributions. However, linear DNA assumes both a smaller coil size and a smaller breadth of conformations than ring DNA. Moreover, non-homologous crosslinking enhances the dynamic heterogeneity of linear DNA by linking the connectivity of the actin network to the rigidity of the microtubule network. On the other hand, ring DNA transport and conformational dynamics are dominated by threading of the rings by the cytoskeleton filaments. Not only is the subdiffusion of ring DNA biphasic and more anomalous than its linear counterpart, but also the dynamics for rings appear to be largely unaffected by the type of network crosslinking.
Conclusion
The transport of DNA, as well as other macromolecules and complexes, through the cytoskeleton plays critical roles in numerous biological processes. Yet, the complexity of the cytoskeleton and wide variation in properties of diffusing macromolecules leaves our understanding of the transport phenomena limited. Here, we elucidate the role that DNA topology plays in the transport of large DNA molecules in composite, crosslinked cytoskeleton networks. By altering the crosslinking motif, and specifically creating networks with homologous and non-homologous crosslinking, we are able to investigate how the mobility and connectivity of the biomimetic networks affects the dynamics of topologically distinct DNA. While these networks all have different types of crosslinking, we note that the homologously crosslinked networks are composite networks and as such the non-crosslinked filaments (actin or microtubules) are entangled with themselves and their crosslinked counterparts, thus providing relevance to systems where a portion of the network is crosslinked while some parts remain entangled. We demonstrate that threading controls the dynamics of ring DNA nearly completely, irrespective of the crosslinking motif. On the other hand, the crosslinking motif plays a significant role in linear DNA dynamics, with non-homologous crosslinking leading to the most heterogeneous dynamics. While we focus on composite networks of actin and microtubules due, in part, to the interest in how they might interact in the cell,21 we suspect that the differences between ring and linear polymer dynamics would be observed in other polymer networks.Beyond the implications our results have for understanding molecular transport in crowded media, they also give substantial insight into the complexities of engineering functional systems in biological environments. The impact on gene therapy or drug delivery are readily apparent, as any delivery system utilizing a nucleic acid or other macromolecule would need to navigate within a dynamic and complex cytoskeleton. This study further provides insight in bioengineering, yielding information into how intracellular material properties can be altered by tuning the activity of proteins responsible for homologous or non-homologous filament crosslinking. Our future work will investigate how transport depends on the DNA size as well as the network mesh size and spatial extent of heterogeneities.
Author contributions
J. G. performed experiments, analyzed, and wrote the manuscript. K. R. and G. A. performed experiments and analyzed data. R. M. R. A. and R. J. M. conceived of and supervised the project.Conflicts of interest
The authors declare no competing interest.References
- A. Fick, Ann. Phys., 1855, 170, 59–86 CrossRef.
- M. V. Smoluchowski, Ann. Phys., 1916, 353, 1103–1112 CrossRef.
- Selected Papers on Noise and Stochastic Processes, ed. N. Wax, (1-Jun-1954) Paperback, Dover Publications, 1701 Search PubMed.
- N. van Kampen, Stochastic Processes in Physics and Chemistry, North Holland, 3rd edn, 2007 Search PubMed.
- A. G. Cherstvy and R. Metzler, Phys. Rev. E: Stat., Nonlinear, Soft Matter Phys., 2014, 90, 012134 CrossRef CAS PubMed.
- F. Höfling and T. Franosch, Rep. Prog. Phys., 2013, 76, 046602 CrossRef PubMed.
- J. Elf and I. Barkefors, Annu. Rev. Biochem., 2019, 88, 635–659 CrossRef CAS PubMed.
- F. C. Hendriks, F. Meirer, A. V. Kubarev, Z. Ristanović, M. B. J. Roeffaers, E. T. C. Vogt, P. C. A. Bruijnincx and B. M. Weckhuysen, J. Am. Chem. Soc., 2017, 139, 13632–13635 CrossRef CAS PubMed.
- F. Ritort, J. Phys.: Condens. Matter, 2006, 18, R531–R583 CrossRef CAS PubMed.
- D. Ernst, J. Köhler and M. Weiss, Phys. Chem. Chem. Phys., 2014, 16, 7686–7691 RSC.
- R. J. Ellis, Curr. Opin. Struct. Biol., 2001, 11, 114–119 CrossRef CAS PubMed.
- S. Nakano, D. Miyoshi and N. Sugimoto, Chem. Rev., 2014, 114, 2733–2758 CrossRef CAS PubMed.
- S. Nakano and N. Sugimoto, Mol. BioSyst., 2016, 13, 32–41 RSC.
- D. Miyoshi and N. Sugimoto, Biochimie, 2008, 90, 1040–1051 CrossRef CAS PubMed.
- C. Tan, S. Saurabh, M. P. Bruchez, R. Schwartz and P. LeDuc, Nat. Nanotechnol., 2013, 8, 602–608 CrossRef CAS PubMed.
- M. L. Gardel, K. E. Kasza, C. P. Brangwynne, J. Liu and D. A. Weitz, in Biophysical Tools for Biologists, Volume Two: In Vivo Techniques, Academic Press, 2008, vol. 89, pp. 487–519 Search PubMed.
- T. D. Pollard, Nature, 2003, 422, 741 CrossRef CAS PubMed.
- F. Huber, A. Boire, M. P. López and G. H. Koenderink, Curr. Opin. Cell Biol., 2015, 32, 39–47 CrossRef CAS PubMed.
- M. Kikumoto, M. Kurachi, V. Tosa and H. Tashiro, Biophys. J., 2006, 90, 1687–1696 CrossRef CAS PubMed.
- O. C. Rodriguez, Nat. Cell Biol., 2003, 5, 599–609 CrossRef CAS PubMed.
- M. Dogterom and G. H. Koenderink, Nat. Rev. Mol. Cell Biol., 2019, 20, 38–54 CrossRef CAS PubMed.
- H. Kubitschke, New J. Phys., 2017, 19, 093003 CrossRef.
- E. E. Joo and K. M. Yamada, BioArchitecture, 2016, 6, 53–59 CrossRef PubMed.
- M. Mak, M. H. Zaman, R. D. Kamm and T. Kim, Nat. Commun., 2016, 7, 10323 CrossRef CAS PubMed.
- K. Regan, D. Wulstein, H. Rasmussen, R. McGorty and R. M. Robertson-Anderson, Soft Matter, 2019, 15, 1200–1209 RSC.
- D. M. Wulstein, K. E. Regan, J. Garamella, R. J. McGorty and R. M. Robertson-Anderson, Sci. Adv., 2019, 5, eaay5912 CrossRef PubMed.
- S. N. Ricketts, M. L. Francis, L. Farhadi, M. J. Rust, M. Das, J. L. Ross and R. M. Robertson-Anderson, Sci. Rep., 2019, 9, 1–12 CrossRef PubMed.
- S. N. Ricketts, J. L. Ross and R. M. Robertson-Anderson, Biophys. J., 2018, 115, 1055–1067 CrossRef CAS PubMed.
- M. L. Francis, S. N. Ricketts, L. Farhadi, M. J. Rust, M. Das, J. L. Ross and R. M. Robertson-Anderson, Soft Matter, 2019, 15, 9056–9065 RSC.
- S. M. Gorczyca, C. D. Chapman and R. M. Robertson-Anderson, Soft Matter, 2015, 11, 7762–7768 RSC.
- C. D. Chapman, S. Gorczyca and R. M. Robertson-Anderson, Biophys. J., 2015, 108, 1220–1228 CrossRef CAS PubMed.
- W. M. Mardoum, S. M. Gorczyca, K. E. Regan, T.-C. Wu and R. M. Robertson-Anderson, Front. Phys., 2018, 6, 53, DOI:10.3389/fphy.2018.00053.
- H. Kang, N. M. Toan, C. Hyeon and D. Thirumalai, J. Am. Chem. Soc., 2015, 137, 10970–10978 CrossRef CAS PubMed.
- M. Doi and S. F. Edwards, The Theory of Polymer Dynamics, Clarendon Press, 1988 Search PubMed.
- P.-G. Gennes, Scaling Concepts in Polymer Physics, Cornell University Press, 1979 Search PubMed.
- M. Rubinstein, Phys. Rev. Lett., 1986, 57, 3023–3026 CrossRef CAS PubMed.
- A. Grosberg, Y. Rabin, S. Havlin and A. Neer, Europhys. Lett., 1993, 23, 373–378 CrossRef CAS.
- M. Kapnistos, Nat. Mater., 2008, 7, 997–1002 CrossRef CAS PubMed.
- J. Suzuki, A. Takano and Y. Matsushita, J. Chem. Phys., 2008, 129, 034903 CrossRef PubMed.
- T. Vettorel, A. Y. Grosberg and K. Kremer, Phys. Biol., 2009, 6, 025013 CrossRef PubMed.
- T. Sakaue, Phys. Rev. Lett., 2011, 106, 167802 CrossRef PubMed.
- S. P. Obukhov, M. Rubinstein and T. Duke, Phys. Rev. Lett., 1994, 73, 1263–1266 CrossRef CAS PubMed.
- R. M. Robertson, S. Laib and D. E. Smith, Proc. Natl. Acad. Sci. U. S. A., 2006, 103, 7310–7314 CrossRef CAS PubMed.
- R. M. Robertson and D. E. Smith, Macromolecules, 2007, 40, 3373–3377 CrossRef CAS.
- B. V. S. Iyer, A. K. Lele and S. Shanbhag, Macromolecules, 2007, 40, 5995–6000 CrossRef CAS.
- J. D. Halverson, W. B. Lee, G. S. Grest, A. Y. Grosberg, K. Kremer and I. Statics, J. Chem. Phys., 2011, 134, 204904 CrossRef PubMed.
- Y. Zhou, K.-W. Hsiao, K. E. Regan, D. Kong, G. B. McKenna, R. M. Robertson-Anderson and C. M. Schroeder, Nat. Commun., 2019, 10, 1753, DOI:10.1038/s41467-019-09627-7.
- R. M. Robertson and D. E. Smith, Proc. Natl. Acad. Sci. U. S. A., 2007, 104, 4824–4827 CrossRef CAS PubMed.
- D. J. Orrah, J. A. Semlyen and S. B. Ross-Murphy, Polymer, 1988, 29, 1452–1454 CrossRef CAS.
- S. F. Tead, Macromolecules, 1992, 25, 3942–3947 CrossRef CAS.
- G. B. McKenna, Macromolecules, 1987, 20, 498–512 CrossRef CAS.
- K. R. Shull, K. H. Dai, E. J. Kramer, L. J. Fetters, M. Antonietti and H. Sillescu, Macromolecules, 1991, 24, 505–509 CrossRef CAS.
- M. Wang, K. Timachova and B. D. Olsen, Macromolecules, 2015, 48, 3121–3129 CrossRef CAS.
- H. Silescu, J. Non-Cryst. Solids, 1991, 131–133, 593–597 CrossRef.
- C. D. Chapman, S. Shanbhag, D. E. Smith and R. M. Robertson-Anderson, Soft Matter, 2012, 8, 9177–9182 RSC.
- R. Metzler, J.-H. Jeon, A. G. Cherstvy and E. Barkai, Phys. Chem. Chem. Phys., 2014, 16, 24128–24164 RSC.
- J. Horbach, N. H. Siboni and S. K. Schnyder, Eur. Phys. J.-Spec. Top., 2017, 226, 3113–3128 CrossRef.
- E. R. Weeks, J. C. Crocker, A. C. Levitt, A. Schofield and D. A. Weitz, Science, 2000, 287, 627–631 CrossRef CAS PubMed.
- R. K. Singh, J. Mahato, A. Chowdhury, A. Sain and A. Nandi, J. Chem. Phys., 2020, 152, 024903 CrossRef CAS PubMed.
- K. He, F. Babaye Khorasani, S. T. Retterer, D. K. Thomas, J. C. Conrad and R. Krishnamoorti, ACS Nano, 2013, 7, 5122–5130 CrossRef CAS PubMed.
- W. K. Kegel and A. van Blaaderen, Science, 2000, 287, 290–293 CrossRef CAS PubMed.
- A. V. Weigel, B. Simon, M. M. Tamkun and D. Krapf, Proc. Natl. Acad. Sci. U. S. A., 2011, 108, 6438–6443 CrossRef CAS PubMed.
- J.-H. Jeon, V. Tejedor, S. Burov, E. Barkai, C. Selhuber-Unkel, K. Berg-Sørensen, L. Oddershede and R. Metzler, Phys. Rev. Lett., 2011, 106, 048103 CrossRef PubMed.
- R. Metzler, J.-H. Jeon and A. G. Cherstvy, Biochim. Biophys. Acta, Biomembr., 2016, 1858, 2451–2467 CrossRef CAS PubMed.
- W. He, H. Song, Y. Su, L. Geng, B. J. Ackerson, H. B. Peng and P. Tong, Nat. Commun., 2016, 7, 11701 CrossRef CAS PubMed.
- Y. Lanoiselée, N. Moutal and D. S. Grebenkov, Nat. Commun., 2018, 9, 4398 CrossRef PubMed.
- B. Wang, S. M. Anthony, S. C. Bae and S. Granick, Proc. Natl. Acad. Sci. U. S. A., 2009, 106, 15160–15164 CrossRef CAS PubMed.
- B. Wang, J. Kuo, S. C. Bae and S. Granick, Nat. Mater., 2012, 11, 481–485 CrossRef CAS PubMed.
- R. Metzler, Biophys. J., 2017, 112, 413–415 CrossRef CAS PubMed.
- S. M. Rytov, Y. A. Kravtsov and V. I. Tatarskii, Principles of Statistical Radiophysics 1: Elements of Random Process Theory, Springer-Verlag, Berlin Heidelberg, 1987 Search PubMed.
- Y. He, S. Burov, R. Metzler and E. Barkai, Phys. Rev. Lett., 2008, 101, 058101 CrossRef CAS PubMed.
- Y. He, S. Burov, R. Metzler and E. Barkai, Phys. Rev. Lett., 2008, 101, 058101 CrossRef CAS PubMed.
- R. J. Ellis, Trends Biochem. Sci., 2001, 26, 597–604 CrossRef CAS PubMed.
- G. Rivas and A. P. Minton, Trends Biochem. Sci., 2016, 41, 970–981 CrossRef CAS PubMed.
- S. Mittal, R. K. Chowhan and L. R. Singh, Biochim. Biophys. Acta, 2015, 1850, 1822–1831 CrossRef CAS PubMed.
- N. Khanna, Y. Zhang, J. S. Lucas, O. K. Dudko and C. Murre, Nat. Commun., 2019, 10, 2771 CrossRef PubMed.
- S. Stylianidou, N. J. Kuwada and P. A. Wiggins, Biophys. J., 2014, 107, 2684–2692 CrossRef CAS PubMed.
- I. Golding and E. C. Cox, Phys. Rev. Lett., 2006, 96, 098102 CrossRef PubMed.
- T. J. Lampo, S. Stylianidou, M. P. Backlund, P. A. Wiggins and A. J. Spakowitz, Biophys. J., 2017, 112, 532–542 CrossRef CAS PubMed.
- G. Seisenberger, M. U. Ried, T. Endress, H. Büning, M. Hallek and C. Bräuchle, Science, 2001, 294, 1929–1932 CrossRef CAS PubMed.
- G. Guigas, C. Kalla and M. Weiss, Biophys. J., 2007, 93, 316–323 CrossRef CAS PubMed.
- J. Garamella, R. Marshall, M. Rustad and V. Noireaux, ACS Synth. Biol., 2016, 5, 344–355 CrossRef CAS PubMed.
- Y. Bashirzadeh and A. P. Liu, Soft Matter, 2019, 15, 8425–8436 RSC.
- A. D. Silverman, A. S. Karim and M. C. Jewett, Nat. Rev. Genet., 2020, 21, 151–170, DOI:10.1038/s41576-019-0186-3.
- K. Regan, S. Ricketts and R. M. Robertson-Anderson, Polymers, 2016, 8(9), 336, DOI:10.3390/polym8090336.
- S. N. Ricketts, B. Gurmessa and R. M. Robertson-Anderson, in Parasitology and Microbiology Research, IntechOpen, 2019, Microscale Mechanics of Plug-and-Play In Vitro Cytoskeleton Networks Search PubMed.
- S. N. Ricketts, J. L. Ross and R. M. Robertson-Anderson, Biophys. J., 2018, 115, 1055–1067 CrossRef CAS PubMed.
- E. Dauty and A. S. Verkman, J. Mol. Recognit., 2004, 17, 441–447 CrossRef CAS PubMed.
- B. P. Bhowmik, I. Tah and S. Karmakar, Phys. Rev. E, 2018, 98, 022122 CrossRef CAS PubMed.
- P. Chaudhuri, L. Berthier and W. Kob, Phys. Rev. Lett., 2007, 99, 060604 CrossRef PubMed.
- B. Gurmessa, S. Ricketts and R. M. Robertson-Anderson, Biophys. J., 2017, 113, 1540–1550 CrossRef CAS PubMed.
- F. Burla, T. Sentjabrskaja, G. Pletikapic, J. van Beugen and G. H. Koenderink, Soft Matter, 2020, 16, 1366–1376, 10.1039/C9SM01837A.
- H. Fischer, A history of the central limit theorem: from classical to modern probability theory, Springer, New York, London, 2011 Search PubMed.
- S. J. Anderson, C. Matsuda, J. Garamella, K. R. Peddireddy, R. M. Robertson-Anderson and R. McGorty, Biomacromolecules, 2019, 20, 4380–4388, DOI:10.1021/acs.biomac.9b01057.
- I. M. Sokolov, Soft Matter, 2012, 8, 9043 RSC.
- T. Sentjabrskaja, E. Zaccarelli, C. De Michele, F. Sciortino, P. Tartaglia, T. Voigtmann, S. U. Egelhaaf and M. Laurati, Nat. Commun., 2016, 7, 11133 CrossRef CAS PubMed.
- P. Kumar, L. Theeyancheri, S. Chaki and R. Chakrabarti, Soft Matter, 2019, 15, 8992–9002 RSC.
- R. Chen, R. Poling-Skutvik, M. P. Howard, A. Nikoubashman, S. A. Egorov, J. C. Conrad and J. C. Palmer, Soft Matter, 2019, 15, 1260–1268 RSC.
Footnotes |
| † Electronic supplementary information (ESI) available. See DOI: 10.1039/d0sm00544d |
| ‡ Equal contributions. |
| This journal is © The Royal Society of Chemistry 2020 |